hp indigo labels and packaging color kit powered by ...h10032. · hp indigo labels and packaging...
TRANSCRIPT

User Guide
HP Indigo Labels and Packaging Color Kitpowered by EskoArtwork

HP Indigo Labels and Packaging powered by EskoArtwork
Color Kit User Guide

Introduction
2
Copyright
© 2008 Copyright Hewlett-Packard Development Company, L.P.
Reproduction, adaptation, or translation without prior written permission is prohibited, except as allowed under the copy-right laws.
The information contained herein is subject to change without notice.
The only warranties for HP products and services are set forth in the express warranty statements accompanying such products and services. Nothing herein should be con-strued as constituting an additional warranty. HP shall not be liable for technical or editorial errors or omissions con-tained herein.
HP, HP Indigo Press, HP Indigo Press RIP, and HP ElectroInk are trademarks or registered trademarks of HP.
All other products or name brands are trademarks of their respective holders.
Copyright 2007 Esko nv, Gent, Belgium All rights reserved. Esko nv. does not warrant, guarantee or make any representations regarding the use, or the results of the use of the software or the information contained herein. Esko nv shall not be liable for any direct, indirect, consequen-tial or incidental damages arising out of the use or inability to use the software or the information contained herein. PANTONE Colors displayed here may not match PANTONE-identified standards. Consult current PANTONE Color Publications for accurate color. PANTONE and other Pantone, Inc. trademarks are the property of Pantone, Inc. Pantone, Inc., 2000. Pantone, Inc. is the copyright owner of color data and/or software which are licensed to Esko nv to distribute for use only in combination with LW-Brix and CT-Brix based applications. PANTONE Color Data and/or Software shall not be copied onto another disk or into memory unless as part of the execution of the LWBrix and CTBrix based appli-cations.This software is based in part on the work of the In-dependent JPEG Group. This product includes software developed by the Apache Software Foundation (http://www.apache.org/) Adobe, the Adobe logo, Acrobat, the Acrobat logo, Adobe Creative Suite, Illustrator, InDesign, PDF, Photoshop, Post-Script, XMP and the Powered by XMP logo are either regis-tered trademarks or trademarks of Adobe Systems Incorpo-rated in the United States and/or other countries. Microsoft and the Microsoft logo are registered trademarks of Microsoft Corporation in the United States and other countries. "SolidWorks is a registered trademark of SolidWorks Corpo-ration." Portions of this software are owned by Spatial Corp. 1986 2003. All Rights Reserved. JDF and the JDF logo are trademarks of the CIP4 Organisa-tion. Copyright 2001 The International Cooperation for the
Integration of Processes in Prepress, Press and Postpress (CIP4). All rights reserved. The Esko software contains the "RSA Data Security, Inc. MD5 Message-Digest Algorithm". Java and all Java-based trademarks and logos are trademarks or registered trademarks of Sun Microsystems in the U.S. and other countries.
Confidentiality notice This guide and any information con-tained herein is confidential and should not be disclosed to any third party out-side of HP Indigo. Do not copy and/or disseminate any information contained in this guide. This guide should be maintained in a manner which shall ensure compliance with the confidenti-ality requirements set forth herein.
This document contains valuable trade secrets and confidential information of Hewlett-Packard Company. Nothing herein may be copied, reproduced or distributed in any form or medium, or disclosed to any third party in any manner, without prior written authoriza-tion of Hewlett-Packard Company. The copyright notice, which appears in this document, is purely precautionary and shall not be deemed to constitute pub-lication or intent to publish, in whole or in part.
Part Number: CA294-05750 First Edition: February 2008

Contents
Introduction.......................................................................................................................... 4 About this manual ............................................................................................................................ 4 What is Color Kit? ............................................................................................................................ 4 Solution for special colors ................................................................................................................ 5 Multi-color profiles ............................................................................................................................ 5 System solution for color management............................................................................................ 5
Prerequisites........................................................................................................................ 6 Spectrophotometer .............................................................................................................. 7
Supported spectrophotometers........................................................................................................ 7 Connecting a spectrophotometer..................................................................................................... 7 Calibration of the spectrophotometer............................................................................................. 13 Working with filters ......................................................................................................................... 15 Using the profiles ........................................................................................................................... 29 Color Strategies ............................................................................................................................. 29
ICC profiles ........................................................................................................................ 44 Definition of ICC profiles ................................................................................................................ 44 Notes on importing an ICC profile.................................................................................................. 44 Exporting to ICC profiles ................................................................................................................ 45 Notes on exporting to an ICC profile.............................................................................................. 46 Importing ICC profiles .................................................................................................................... 47 Viewing ICC profiles....................................................................................................................... 47
Dealing with Special colors................................................................................................ 48 How to create your own inks?........................................................................................................ 48 Info on inks..................................................................................................................................... 50 Export an ink book ......................................................................................................................... 50 Import an ink book.......................................................................................................................... 51 Proof an ink book ........................................................................................................................... 51
Tools .................................................................................................................................. 54 Links............................................................................................................................................... 54 Gamut View.................................................................................................................................... 56 Compare Inks................................................................................................................................. 58 Gamut Check ................................................................................................................................. 59 Average Profiles............................................................................................................................. 60 Preferences.................................................................................................................................... 62
Example of a workflow....................................................................................................... 65 Appendix, a closer look at the standard Color Strategies.................................................. 76

Introduction
4
Introduction HP Indigo Labels and Packaging Color Kit powered by Esko includes:
• software to measure color charts.
• software to generate profiles (both native and ICC).
• a ‘Color management Module’.
• a database with charts, profiles and inks.
About this manual This manual explains all the tools in Color Kit. It explains all features in detail You may want to pro-ceed straightaway to how-to section in section 9, which guides you through a step-by-step calibration. Therefore some illustrations might appear in both the reference section as in the step-by-step section.
What is Color Kit? HP Indigo Labels and Packaging Color Kit powered by Esko is a complete color system. It offers profiling tools to profile presses and proofing devices and offers all required features to create, modify and execute profiles.
In addition, Color Kit uses a central color database which digitizes all color knowledge. This database can be used for output to any devices using FlexRip. For the HP Indigo press the color database provides full color conversion automation and eliminates the need for operator intervention to prepare conventionally printed jobs for digital reruns. It is the ideal platform to optimize press uptime and number of jobs run on the HP Indigo digital press.
Color Kit goes well beyond ICC capabilities when special colors (Pantone and brand colors) are concerned. Color Kit profiles are 100% spectral profiles providing, in addition to LAB values, much more information about color behavior and characteristics than ICC profiles and ICC based color management systems.
To profile devices (proofing devices, conventional and digital presses) Esko's Color Kit uses special measuring charts for up to 7 color processes. This can be used to create a profile of the HP Indigo digital press using Indichrome or Indichrome + green. This profile is stored in the Color Kit database.
Measure color charts Color Kit comes with its own layouts to measure CMYK and multi-color profiles but you can also measure IT8 or ECI2002 charts. Interfaces with the most common spectrophotometers are available.
Generate profiles From measured charts, both native Color Kit profiles and ICC profiles can be generated.
Note: The Color Kit module is not an actual CMM that can be used on a MAC.
A database Color Kit keeps track of all the proofer, press or ink profiles in a database. Thanks to this database, it is possible to tell when the profile was made, which chart (and how many patches) was used to make
Introduction
5
the profile and what kind of profile it is: a proofer, press, monitor or scanner profile. It will also tell you if the profile is referenced in a device link profile. Additionally, when using 'Color Strategies' the database keeps track of conversion tables. It will tell you what kind of colormatch was used. In other words, the CMS database provides an enormous amount of quality control. A database is built over time. Over time, you will create a database of colours for every substrate/press condition combinations that will help you to maximize production on the press.
So far, apart from the database, Color Kit looks like a traditional color management package.
Solution for special colors A traditional color management system relies on colorimetric modeling only. The goal is to obtain a color match between input, monitor, proof and printed output. But what about special colors? The problem of special colors becomes dramatically complex when dealing with overprints between specials, often used in packaging.
Multi-color profiles Color Kit enables you to create multi-color profiles. These profiles can either be output profiles (for proofing devices or digital presses that run more than 4 colors, e.g. HP Indigo) or press profiles.
Multi-color Press Profiles can be very handy when dealing with a standardized set of 6 or 7 inks. The profile will help to convert legacy jobs into the press colorspace with InkWizard and will help to make an accurate simulation of the press on the digital proofing system.
System solution for color management Color Kit offers a solution for every step in the color workflow:
• Measuring profile charts: whether you choose to use IT8 charts or Esko charts for press or proofer or you advance to the ink profiles, Color Kit will measure them for you.
• Generating profiles: Color Kit can deliver an Esko profile or an ICC profile.
• CMS: Color Kit also provides the CMS kernel which converts from one color space to another (comparable to a CMM in an ICC environment), which is built into all Esko products mentioned above.

6
Prerequisites Before Esko Color Kit can be of any use to you, the following prerequisites need to be fulfilled:
• A spectrophotometer is essential. (See: Supported spectrophotometers (page 7). To measure multi-color profiles, a high-speed measuring device (e.g I1IO or DTP70) is recommended.
• You need a stable press. You need to understand perfectly how the press can be calibrated. Consistent colour output can only be obtained through optimal calibration of the Indigo press. A good communication between the pre-press department and press operator is essential, especially where it concerns usage of LUT tables on the press. Here’s why: Profiles reflect every aspect of paper, ink an press conditions. One should not change press conditions without communicating with the pre-press department and vice versa.
• You need the correct licenses on your system.
• You can find all the Esko and IT8 color charts on your system after the software has been installed.
• In order to have a reliable optical comparison between colors from your proofing device and from your press, a viewing booth with D50 illumination is required.

7
Spectrophotometer Supported spectrophotometers The following spectrophotometers are supported for USB:
• Gretag SpectroEye
• Gretag Eye-One
• Gretag ICColor
• Xrite DTP70
• Gretag Eye-One IO
Connecting a spectrophotometer Please hook up your spectrophotometer to a serial port of your system. Esko Color Kit will detect the meter automatically.
Connecting a spectrophotometer to a USB port The following meters can be connected to a USB port:
• Gretag Eye-One
• Gretag Eye-One IO
• DTP70, ICColor
Note: No USB drivers for Windows NT are available. Connect the meter to a USB port on your PC (not via the keyboard).
The system detects new hardware and will prompt you to install the drivers. Proceed as follows:
1. Choose to install the drivers from a specific location

Spectrophotometer
8

Spectrophotometer
9
2. Choose to install the driver yourself.
3. Select Eye-One and click 'Have Disk'.

Spectrophotometer
10
4. Click 'Browse'.
5. Browse to the Documentation DVD under Extra - Spectrophotometer drivers, select the corresponding driver and click 'Open'.

Spectrophotometer
11

Spectrophotometer
12
6. Click 'OK'.
7.

Spectrophotometer
13
8.
9. The Eye-One is now ready to be used in Color Kit
Calibration of the spectrophotometer
1. Your spectrophotometer can be calibrated by double-clicking the spectrophotometer icon
First, Color Kit will automatically detect the type of spectrophotometer that is connected.
Warning
If no spectrophotometer is connected to your system the following error will come up.

Spectrophotometer
14
2. Click 'Calibrate'.
Note: For hand-held spectrophotometers, you will be asked to put the meter on the absolute white reference first.

Spectrophotometer
15
3. If the calibration was successful, the following message will appear:
4. Click 'OK' to close the spectrophotometers settings window.
Note: With the ICColor, there is no need to perform a calibration since the device calibrates itself.
Working with filters Different filters can be used on a spectrophotometer:
• a Polarization filter, which can be used to take away the disturbing effect of measuring on a glossy substrate.
• a D65 filter, which has to be used if D65 is used as reference light temperature.
• a UV filter, which can be used to take away UV light from the spectrophotometer light source. This can be helpful if you are measuring on substrates with optical brighteners.
The default setting in Color Kit is NO filter. If you want to work with a filter please proceed as follows:
1. Make sure your spectrophotometer is connected to your workstation.
2. Put on the right filter.
3. Double-click the Spectrophotometer button (or go to the 'File' menu and choose 'Settings').
4. Change the Settings to Custom.
5. Select the right Geometry (D65 or Pol).
6. Click 'Calibrate'.
7. Click 'OK' and you come back to the same window.
8. Click 'OK' again. If the following window comes up, the filter that you used does not correspond with the settings in Color Kit. Please change either the filter or the settings and recalibrate.

Spectrophotometer
16
Caution! If you have decided to use a filter, please use this filter to measure all profiles. Mixing profiles measured with and without profiles might cause unwanted effects.

17
Deciding on a testchart First of all you have to decide which test chart to use. A couple of parameters will decide which parameters will decide which chart is best for you:
• The type of spectrophotometer you will be using to measure the testchart.
• The number of patches you want to measure (normal or high quality). The choice between normal or high quality is not available for all spectrophotometers.
• Whether you want to make a multi-color press profile or just CMYK. For profiling CMYK only, we recommend charts that include black overprints. This means that not only overprints of C,M,Y will be measured, but also overprints of K. Try to use the highest possible quality. Some spectrophotometers have normal and high-resolution charts
The following overview chart will help you decide for CMYK charts.
All these testcharts can be found on Esko\bg_data_cms_v010\r\tim
If you are making a press profile please pick one from the chart underneath.

Digital Proofing: Step by step
18
As you can see from the overview, different charts will be used for press profiles covering different color regions. The naming convention for the color regions is as follows:
CMYK = CMYK
Orange, Red area = R
Green = G
Blue, Violet area = B
So if you are profiling a press with CMYK, Orange, and Violet, please pick the CMYKRB chart that corresponds with your spectrophotometer.
Making a new profile and printing the test chart on the press Outputting charts on your press is needed to make a profile. A profile will describe overprints of CMYK, CMYKOV or CMYKOVG in the CieLab colorspace.
Start by defining a new proof process. In Color Kit, right-click on ‘Esko profiles, Proofer’ and choose ‘new’, or alternatively go to the File menu and choose ‘New’.
Note! The list above explains all the possible combinations. In practice, the choice of a chart will be practically intuitive. The list of charts is limited through the choice of the output inks and the connected spectrophotometer. In the step-by step workflow in section 9 this will become clear!

Digital Proofing: Step by step
19
Choose your FlexRip configuration in the ‘proofer’ window. This can be CMYK, CMYKOV or CMYKOGV. Remember that you can make configurations with the FlexRip Coinfigurator. The con-figurations mentioned above are pre-installed though, for your convenience. In the example below, we decide to measure a profile for CMYKOV.

Digital Proofing: Step by step
20
You will see some extra information displayed about the configuration.
Now you need to save the file, with ‘File’, ‘Save as”. Make sure the configuration and the substrate is reflected in the name that you give. We also suggest to include press parameters, when you work with different LUTs
Proceed to the ‘Overprints’ tab. Mind that the icons on the right will stay grayed-out when you have not saved the file!

Digital Proofing: Step by step
21
You see the name that you have given in the upper-left corner. All you need to do to get the files printed on the press is to click the proof button. You will see a progress bar at the bottom of your screen. The charts can now be printed on the press. The screenshot above shows you an example of a 7 color profile, with an i1 spectrophotometer attached.
Measuring the testchart To start measuring the test-chart, make sure the spectrophotometer is hooked up to your system. See Connecting a Spectorophotometer (page 7).
IMPORTANT REMARK: It is when you actually print the charts on the press, that all the parameters are applied. Therefore we strongly advise to observe a clear naming convention when you save profiles. Please choose an accurate name that includes substrate, output ink set and LUT.
When the charts to make this profile have been printed with LUT05, you should later only apply it in your production workflow duringon jobs to be printed with THE CORRESPONDING LUT. Ripping jobs with a profile made for one kind of LUT, and outputting it on the press with a totally different LUT would have a serious effect on the output of colours.

Digital Proofing: Step by step
22
Go to the 'Overprints' tab.
Color Kit will now check which spectrophotometer is connected to your system. Only the layouts available for this meter will be shown.
If the meter is not connected the following message will appear:
Please connect the meter, restart Color Kit and start again.
Click the measurement icon that corresponds with your meter.
• Gretag Eye One (strip reading) (page 22)
• Gretag Eye One (manual mode) (page 23)
• Gretag SpectroScan (page 23)
• Hand-held spectrophotometer (page 23)
• Xrite DTP41 (page 23)
• Gretag ICColor (page 24)
• Xrite DTP70 (page 25)
• Gretag Eye-One IO (page 25)
Note:
For automatic meters, click
For hand-held meters click Automatic meters are: Gretag Spectroscan, Xrite Spectrofiler, Xrite DTp70, Gretag ICColor and Gretag Eye One IO. All other meters are considered hand-held. The Gretag Eye-One has 2 modes: it can be used as a strip reader using the ruler. In this case it is considered an automatic meter. It can also be used to measure individual patches; then it is considered manual. If you are working with an ICColor, please refer to the chapter on the Gretag ICColor If you are working with a DTP70 please refer to the chapter on the DTP70 .
Gretag Eye One (strip reading)
1. Take the first chart and put the ruler along the strip.
2. Click the manual measurement button (this starts a measurement session).
3. Press the button on the Eye-One.
4. Wait for the beep (while keeping the button on the Eye One pressed).

Digital Proofing: Step by step
23
5. Slide the meter along the ruler at a constant pace (still holding the button pressed).
6. Release the button.
7. Wait until all measurements have been transferred.
8. Repeat this action until all strips have been measured and click 'OK' to finish the measurement.
Note: Only when there is a measurement error (e.g. bad reading), you will have to click the measurement button again (to restart the session).
Gretag Eye One (manual mode)
1. Take the first chart and place the meter holder on the first patch (100%C 100%M 100%Y).
2. Click the manual measurement button.
3. Repeat this action until all patches have been measured and click 'OK' to finish the measurement.
Gretag SpectroScan
You are prompted to put the overprints chart on the measuring table.
1. Place the (first) overprints chart on the measuring table.
2. Click 'OK'. Paper hold will now be activated.
3. Align the crosshair of the meter on the top left crosshair on the paper and press 'OK' to continue.
4. Align the crosshair of the meter on the top right crosshair on the paper and press 'OK' to continue.
5. Align the crosshair of the meter on the bottom left crosshair on the paper and press 'OK' to continue. The SpectroScan will now measure the (first) chart.
If you are measuring a chart that contains more than one page, you will be asked to put the next page on the measuring table. Click 'OK' when the next chart is placed on the table and repeat the alignment procedure to measure the next page. Repeat this procedure for every page (e.g. sp16x16_1234 has 4 pages, spscan_nonuni_cmyk has 2 pages).
6. When all pages are measured, click 'OK' to finish the measurement.
Xrite DTP41
1. Have the first chart ready.
2. Click the manual measurement button. With every click one row will be measured.
3. Feed the first row through the DTP41. The row number is printed on the chart.

Digital Proofing: Step by step
24
4. Wait until all the measurements have been passed to Color Kit.
Note
The CMYK combination shown in Color Kit corresponds with the next row that needs to be measured. If a row was not measured correctly, it should be measured again.
5. Continue to feed all other rows through the meter.
6. When all rows have been fed through, click 'OK' to finish the measurement.
Gretag ICColor
1. Have the first page ready (the page number is mentioned on the chart).
2. Click the automatic measurement button.
3. Feed the first page through the ICColor.
4. Feed all other page through the meter.
5. When all pages have been measured, click 'OK' to finish.

Digital Proofing: Step by step
25
Note: The chart can be inserted both ways: arrow first or arrow last.
Xrite DTP70
1. Have the first page ready (the page number is mentioned on the chart).
2. Click the automatic measurement button.
3. Feed the first page through the DTP70.
4. Feed all other page through the meter.
5. When all pages have been measured, click 'OK' to finish.
Gretag Eye-One IO
1. Adjust the height of the meter if necessary. Slide the substrate under the white reference to test the height. The substrate should not get stuck and should not slide through too easily.
2. Click the automatic measurement button.
3. Follow the instuctions to place the page and align.
4. Place the first page on the scanning table (page number is mentioned on the chart).
5. Activate the electro-magnetic filed by pressing the button a the top-right of the meter.
6. Align the meter to the 3 crosshair and click OK (there is no need to click the Eye-One button)
7. Measure all pages and press 'OK' when finished'.
Verifying a profile To avoid using a profile with measurement mistakes (due to the meter, the operator or the software), the profile should be verified. Color Kit features a tool to visualize a native profile as an image. Proceed as follows:
1. Go to the 'File' menu > 'Open' to open the proofer profile.
2. Go to the 'File' menu and click 'Show measurements'.
A new window opens in which all measurements are shown in an image.
A CMYK chart that includes black will look like this:

Digital Proofing: Step by step
26
Visualizing the measurements of a multi-color profile looks like this: (mind the device coordinates window, where you see the ink precentages when moving the cursor)
Check for white, black or double patches. When the profile is OK, it is ready to be used. If there are mistakes in the profile, you can correct them by re-measuring. Color Kit can re-measure only the patches that are wrong. Just go to the wrong patch with your mouse in the the "Show measurements" tool and it will indicate the CMYK combination that you have to remeasure.
This CMYK value can be entered in when you re-measure.

Digital Proofing: Step by step
27
To find the bad patch on the chart, select the patch by clicking it, and then select the Chart View tab. The patches will now be shown as they are arranged on the chart, and the bad patch will be selected. For the Eye-One and the X-Rite DTP41 spectrophotometers, row numbers will be indicated. This way you will know where to place the meter when remeasuring.
Note: For some profiles, the name of the used chart is not stored in the profile. In this case, the Chart Info group will contain dropdown lists for selecting the Spectrophotometer and Chart. On making a selection, the Chart View tab will become available.

Digital Proofing: Step by step
28
Recover a profile If you have found mistakes in the measurement (see Verifying a profile (page 25)), you can correct the mistakes by re-measuring the patches that were wrong. Please make sure the flaws are not in the chart itself. When you have a fast spectrophotometer, sometimes remeasuring the complete charts(s) is the easiest solution)
1. Open the printer/proofer process that you want to correct.
2. Go to the 'Overprints' tab.
3. Color Kit will now check which spectrophotometer is connected to your system. Only the layouts available for this meter will be shown.
If the meter is not connected the following message will appear.
Please connect the meter and start again.
4. Select the type of chart you used to measure the profile.
5. Click the measurement button that corresponds with your meter.
6. Fill in the combination of C,M,Y and K where you want to start recovering.
Warning! If one of the numbers in the combination of CMYK is 0, please fill in 0, do not leave the field blank!
7. Click 'Initialize'.
8. Click the measurement button.

Digital Proofing: Step by step
29
Note: If you have to re-measure several non-subsequent patches, you do not have to re-measure all the patches in-between. Once you have re-measured the patches that were wrong you can stop the measurements by clicking the measurement button.
Export a profile You can export a reference profile so it can be used at a remote site.
1. Open the profile.
2. Go to 'File' > 'Export'.
3. Browse to the directory in which you want to save the exported profile.
4. Click 'OK'.
This will result in an .FP file, which can be sent to the remote site.
Note: Ink books, process links and color strategies can also be exported and will also result in an .FP file. It is good practice to mention the type of element you exported in the name because Color Kit does not distinguish between different types of .FP files when importing. e.g my_press.fp or designer_inkbook.fp or this_is_a_process_link.fp.
Import a profile An exported profile can be imported at a remote site.
1. Go to 'Measured profiles'.
2. Select 'Proofer'.
3. Go to 'File' ⇒ 'Import'.
4. Browse to the directory where the .FP file is located.
5. Select the .FP file and click 'OK'.
6. Save the imported profile with 'Save as'.
Note: If you do not know what document type the .FP file is, you can drag it on to the Color Kit shortcut on your desktop. Color Kit will then open the file, automatically determine the document type, and import it.
Using the profiles We recommend that you make color strategies from your profiles.
Color Strategies Color Strategies are a bundle of Color management settings. By bundling these options, it becomes very easy for users to select the right 'strategy'. Trained Color Kit users will generate these strategies

Digital Proofing: Step by step
30
and other operators just pick one. This makes life easier for operators and makes a color workflow less error prone. Color Strategies are only used in FlexProof and can be selected in BackStage, in the Dispatcher and in the Image Downloader (task). Color strategies may contain:
• Input and output color space
• Settings for a CMYK color conversion (typically a device link)
• Settings to overrule a substrate color
• Settings to determine the ink order
• Settings for conversion of special inks
Input and output color space A color strategy should contain an input (reference profile) and an output (proofer or destination) color profile.
Click on strategy and right-click on ‘New’. You just made your new strategy.
Note
Output profile can be set to 'Automatic', in which case the input profile will also serve as output profile.
Ink Mapping Ink mapping allows you to map a job ink to another ink.
This is particularly interesting in an ink profiler workflow.
Dot gain simulation Dot gain simulation is a dot gain compensation curve or a group of dot gain curves that can be specified when making digital proofs. You can also specify a different curve per ink in your job.
Note
Specific sets of dot gain simulation curves can be saved under a 'Quick Set'. Dot gain simulation allows you to:
• Specify a reverse DGC curve when making digital proofs (for Flexo) (page 31).
• Specify a "bump up" curve for highlight correction when making digital proofs (page 31).
• Measure once, simulate many processes on your digital proof (page Error! Bookmark not defined.).

Digital Proofing: Step by step
31
• Simulate a different dot gain for special colors and process colors (page Error! Bookmark not defined.).
Convert special inks Here you can decide how special inks are converted. The general rule how inks should be converted, is set under 'conversion values’:
Depending on the number of output inks (3,4, 6 or 7) the list of conversion methods will change.
For CMYK output there are several ways to convert Pantone colors:
1. Use destination profile: with this option, Pantone inks will be converted to CMYK using the Use destination profile. It takes into account the proofer CMYK color space. This option is the most accurate if you have measured a profile of your proofer.
2. Pantone CMYK: With this option Pantones will be converted to CMYK according to the Pantone table (SWOP and EURO).
3. HP Indigo CMYK 1.0: with this option Pantones will be converted to CMYK according to the HP Indigo CMYK 1.0 table. Remember that using this option causes the Pantone® or spot inks not to be converted anymore with the profile, but a fixed table is used. Investing work in the creation of a profile and then choosing this option is contradictory. This option is used for the standard color strategy HPI-CMYKW106use of custom2
For 6 color output (HP IndiChrome. Or with any 6 color Esko profile), there are two ways to convert Spot colors to 6 output colors:
• Use destination profile: with this option, Pantone inks will be converted to CMYKOG or CMYKOV using the destination profile . It takes into account the output color space. This option is the most accurate if you have measured a profile of your proofer.
• Pantone HexaChrome: (only if a HexaChrome profile is selected) with this option Pantones will be converted to CMYKOG according to the Pantone table. We do not recommend to use this

Digital Proofing: Step by step
32
conversion method in an HP Indigo workflow, as the ink characteristics of the Indigo press are different than the characteristics of the Pantone® HexaChrome inks.
• HP IndiChrome: (only if an IndiChrome profile is selected) with this option Pantones will be converted to CMYKOV according to the HP IndiChrome table. Remember that using this option causes the Pantone® or spot inks not to be converted anymore with the profile, but a fixed table is used. Investing work in the creation of a profile and then choosing this option is contradictory. This option is used for the standard color strategy HPI-CMYKOVW
Note
If you are working with an Esko multi-color profile as destination, you can decide whether you want to use the full color gamut (5, 6 or 7 colors) or limit the output inks to CMYK.
‘Generate no CMYK’ means you will use the full color gamut. Spot colors will be simulated using 3 colors (2 neighboring colors + black).
‘Generate only CMYK’ means that, even though you are specifying a multi-color profile, you would like spot colors to be simulated with CMYK only.
This option makes spot color simulation cheaper (in case of Kodak Approval less donors will be used; in case of Indigo less impressions) but also makes spot color simulation less accurate.
‘Generate preferably CMYK’ means you would like to simulate spot colors using CMYK if the color deviation is not bigger than a certain tolerance. Only if the deviation is bigger than the entered Delta E, it will use all available output colors.
For 7 color output (HP Indigo CMYK OGV), there is only 1 option: Use Destination Profile.
Exceptions to these rules can be specified in the window 'Exceptions (page 32)'.
Exceptions Exceptions to these rules can be specified in the window 'Exceptions'. To make an exception to the rule, proceed as follows:

Digital Proofing: Step by step
33
1. Open an ink book by double-clicking an empty patch or by clicking the ink book symbol in the ink toolbar.
2. Drag and drop the ink(s) that you want to assign exceptions to choose the kind of exception.
Note
You can skip step 1 and 2 by simply clicking the name field of an empty row and entering the name or abbreviation of an ink .
When you press 'Enter', the ink is searched first in Pantone and then in Designer book and the row is completed if the ink is found in any of these books.
If you are not happy with the ink you can start by entering the ink book name and afterwards the ink name.
3. If you click the ‘Use’ column, you will see that there are 5 options:
• Destination profile: with this option, Pantone inks will be converted to CMYK using the output profile.
• Keep in output: with this option, FlexProof will generate an extra separation. This is where you should specify the white ink that should appear as a separate separation on the Indigo press.
• Do not proof: with option the ink will not be proofed.
• Use Custom Values: you can define your own output values. This option allows you to finetune spot colors. When you select 'Use Custom Values', the fields become editable and you can change the numbers. In the example below the profile gives us 1.1% of Cyan for Pantone® 106. We reduce this to 0%

Digital Proofing: Step by step
34
Choose the conversion method ‘Custom values’ for the ink PANTONE® 106.
You now manually adapt the percentage. In this example we replace the 1.1.% by 0.
• Smallest CIELAB Delta E: This option will further refine the values obtained through the Destination profile in order get a lower CIELAB DeltaE between target and proof.
4. Depending on the type of ink that you put in the exceptions list and the amount of inks in the output profile, there may be different conversion tables in the list of options. At this moment there are only conversion tables for Pantone inks:
• Pantone CMYK Swop (Has been overruled by Color Bridge but we still provide it for compatibility with the past)

Digital Proofing: Step by step
35
• Pantone CMYK Euro (Has been overruled by Color Bridge but we still provide it for compatibility with the past)
• Pantone Color Bridge Swop (As released in June 2006 by Pantone)
• Pantone Color Bridge Swop
• Pantone Hexachrome
• HP Indigo CMYK 1.0
• HP IndiChrome
• HP IndiChrome Plus 1.0 In the example below, all Pantone inks are converted to CMYK using the proofer profile, except for all Cool Grey inks. When you use Pantone conversion for Cool Gray inks, they will be converted to K only, which is much less prone to color casts.
Refine tool When reproducing spot colors on a proofer, a profile gives you the best first shot possible. However, fine tuning spot color simulation is common practice and extra tools will make fine-tuning easier. The Color Refine Tool is accessible from the convert special inks dialog for Color Strategies. Users are able to refine inks using either custom values or destination profile values. Click the refine icon in the inks toolbar to open the Refine Tool.
The Color Refine Tool offers the following functionality:
• Fine-tuned colors are visualized on the monitor.
• For colors using customized values, the user can manually adjust the proofer coordinates, comparing the new color to both the current color and the input color, both visually and through Lab / ∆E.
• For colors using customized values, a grid chart can be proofed, allowing the user to manually select the right patch from the proofed output.
• For colors using destination profile values, the user can re-measure the simulated spot color (iteration). Multiple iterations are possible.

Digital Proofing: Step by step
36
Refining the values obtained through the destination profile
When opening the refine tool for an ink that is using Destination Profile, the dialog will look like to this:
There are only three buttons: the OK button, which is disabled in the beginning, the cancel button, and the measure button. If you click the measure button, a single measurement will be made. This measurement is compared to the Proofed Color and from that a Refined Color is calculated, matching the predicted Lab values for the Destination Profile. Once a refined color is obtained, the OK button is enabled. Clicking it will reopen the convert special inks dialog, where now, instead of Destination

Digital Proofing: Step by step
37
Profile, the option Refined Destination Profile is selected for the refined ink, while the selected values will be the new refined values.
Remark that in the example above, we provoked distinctively different values, just to show you how the interface behaves. Some explanation may be needed here about the difference between Destination Profile and Proofed Color. This is best illustrated by a description of a possible workflow. Typically, a user creating a color strategy will have all his special inks converted using the destination profile, which is the best possible first guess. Then, after making a proof containing a number of spot colors he will decide that some spot colors may need refinement. The user will then add these inks to the special inks exception list, select the Destination Profile option and start the Refinement Tool. When the user has proofed using the destination profile values, the values in the Destination Profile and Proofed Color columns will be the same. The Lab values shown in the Destination Profile column are those values that CMS expects to be measured.

Digital Proofing: Step by step
38
When making a measurement, the measured Lab values will appear in the Proofed Color column. Comparing those to the Lab values in the Destination Profile column, CMS will estimate how ‘wrong’ the profile is (due to drift of the proofer, or inaccuracy due to limited resolution), and shift the profile a little bit to match the measurement , just for this ink. With this ‘shifted profile’ a new match will be calculated.
After the user has accepted the refined values, new proofs will be made. At this point the user can decide to do another refinement, because the refined color still is not accurate enough. The option in the special inks list for the ink to be refined will now be Refined Destination Profile, showing the refined values. When opening the Color Refinement Tool, the user will see that Destination Profile and Proofed Color have different values: Proofed Color shows the values obtained in the previous refinement, while Destination Profile is still the same. Make sure that the patch you are about to measure was proofed using the refined values.
Why is this important? To make any prediction, CMS must know what ink values were used to produce the measured color. There is no point in telling CMS that the measured color is very different from the target color when it was made with totally unrelated ink values. Without this, there would be no point in multiple measurements.
Why take multiple measurements? CMS may be able to make an accurate prediction for smaller color differences, but as the difference becomes larger, the prediction is likely to become inaccurate. Making a first refinement will bring you closer, while a second or even third refinement may correct for the over- or undershoot of the first refinement.
Note that this workflow assumes that the predicted Lab values for the destination profile conversion are assumed to be the best match. For out-of-gamut colors, depending on the opinion of the user, this may not be the case. For this reason, the ‘Custom Values’-based workflow is advised for out-of-gamut colors.
Refining Custom Values
Refining custom values works somewhat different compared to refining destination profile values. Here the user manually adjusts the ink values, judging the result either visually or through one of the supplied ∆E formulas. Values can be edited by clicking the ink percentage you want to modify (inside the black rectangle). It is also possible to proof grid charts, which are discussed in the next section.
Several precautions should be taken into account when interpreting the result. First of all, even when the monitor has been calibrated, the colors are not absolute, so only color differences should be judged visually, never absolute colors. Also, colors outside monitor gamut may seem the same while in reality they are considerably different. For this reason, an option is available to desaturate the colors so they are all inside monitor gamut. The accuracy of this desaturation is however limited.
Proofing a Grid Chart For inks/colors using customized values, a grid chart can be proofed, allowing the user to manually select the right patch from the proofed output. These grid charts contain patches with different ink combinations that vary around a central value. The user can specify up to 3 varying inks, and for each ink several parameters can be set:

Digital Proofing: Step by step
39
• The central value: by default the new custom value selected in the Refine Custom Values dialog box.
• The difference in ink percentage for each variation.
• The number of upward and downward variations. A preview function is also available.
Custom Values and double strike The HP indigo press can print more then 100% of an ink, e.g.. For these proofers Color Kit allows to specify custom values higher then 100% in the color strategy.
When the color strategy above is used in FlexProof, two magenta separations will be generated if the job contains Pantone Purple. The first separation will contain 100% Magenta , the second will contain 50% Magenta.
If for an exception ink one of the custom values is higher then 100%, a warning sign will appear in the Delta E column. This is because we can no longer calculate nor guarantee the color accuracy.
Match solids / Match Inks
Choose match solids to maximize the simulation of spot color solids (100% spot color).

Digital Proofing: Step by step
40
We recommend that you use this option in your color strategies for HP Indigo.
Note
Match inks is the default behavior and is compatible with previous versions of Color Kit/FlexRip
Gamut Mapping Out of gamut colors can be rendered in different ways. Closest color (classic) will map the out-of-gamut color to the closest color within the color gamut. This might introduce a hue shift.
Example
When trying to reproduce PMS Purple on an HP Indigo press, the closest color gamut mapping technique causes the PMS Purple to shift to a blue-ish color. To avoid PMS Purple from shifting to a blue-ish color in the example above, the ‘constant hue gamut mapping technique can be used. This technique tries to maintain the hue of the color. The result in the example above would be that PMS Purple would be reproduced as a much less saturated purple.
Tuning curve With tuning curves, the final output can be finetuned. We do not recommend to use this feature for color strategies for HP Indigo.
Example
Proofs turn out to have a red cast. With 'tuning curves' you can pull down the yellow and the magenta to compensate.

Digital Proofing: Step by step
41
Extra Output inks 'Extra output inks' allows you to specify extra output inks for printers that have more than CMYK inks. If you proof to this device with a strategy that contains extra output inks, these separations will not be color managed but passed on directly to a separate output file.
To add extra output inks, proceed as follows:
1. Open the 'Extra output inks' window by double-clicking on 'Extra Output inks'.
2. Open an ink book by double-clicking the ink book icon.
3. Drag and drop the inks from the Pantone ink book or the designer ink book to the extra output inks window.
For HP Indigo, "White" will typically be defined as an extra output ink. You can set an ink ONLY in the ‘Extra Output Inks’.
Also in the ‘Convert Special Inks’ menu, inks specified as extra output inks appear in the exception list, but one cannot SET it there. The extra output inks are greyed-out and are shown as ‘Keep in Output’.

Digital Proofing: Step by step
42
Also, when mixing custom inks for HP Indigo, they will need to be defined as extra output ink.
Export a color strategy Color strategies can be exported to one single file to be used on a remote site. All elements (inks, profiles, process links, dot gain simulation curves) will be included in one File Packer (.FP) file.
1. Open the color strategy.
2. Go to 'File' > 'Export'.
3. Browse to the directory where you want to store the exported file and click 'OK'.
Note
Ink books, profiles and device links can also be exported separately and will also result into an .FP file. It is good practice to mention the type of element you exported in the name because Color Kit does not distinguish between different types of .FP files when importing. e.g. this_is_a_color_strategy.fp
Import a color strategy An exported color strategy can be imported on a remote site.
1. Go to 'Color Strategies'.
2. Go to 'File' ⇒ 'Import'.
3. Browse to the directory where the .FP file is located.
4. Select the .FP file and click 'OK'.
5. Save the imported profile with 'Save as'.
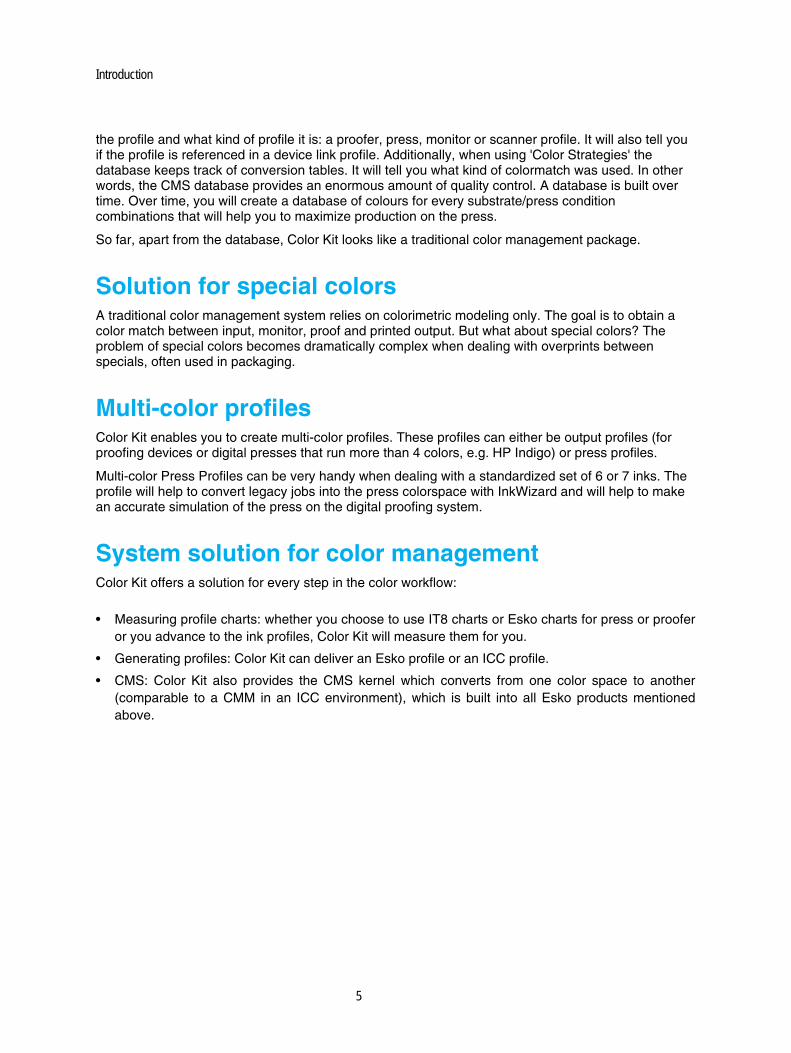
Note
If the imported color strategy contains elements that already are in your database, the original files will not be overwritten. The following message will pop up:
Digital Proofing: Step by step
43
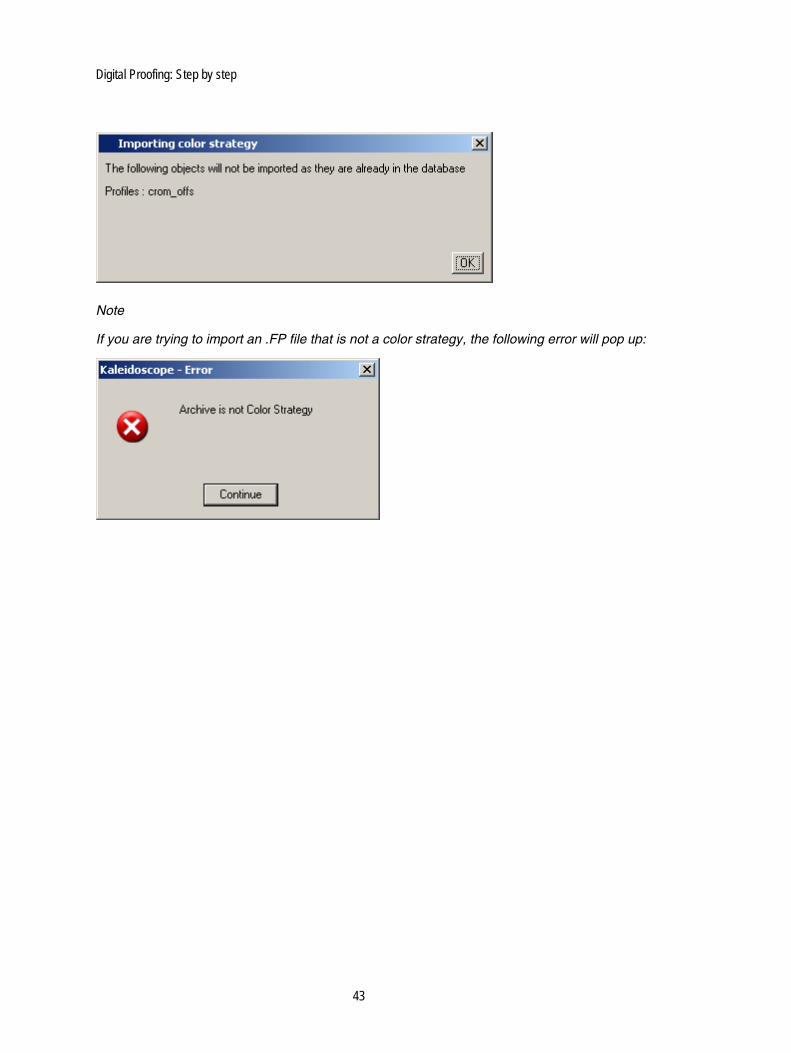
Note
If you are trying to import an .FP file that is not a color strategy, the following error will pop up:

44
ICC profiles • Definition of ICC profiles (page 44)
• Notes on importing an ICC profile (page 44)
• Exporting to ICC profiles (page 45)
• Notes on exporting to an ICC profile (page 46)
• Importing ICC profiles (page 47)
• Viewing ICC profiles (page 47)
Definition of ICC profiles
An ICC Profile is a piece of data that defines the color and reproduction characteristics of a device. ICC Profiles are written in a standard data format that is OS independent.
Everybody can read and write ICC profiles if they know the data format.
Note
Esko only supports V2 ICC profiles, not V4 (2001 specification)
In order to represent a color on a device, we need to know the color's coordinates for that device. This is done by the Color Management System. The CMS is capable of translating colors specified in a device dependent coordinate into the coordinates for another device, thus matching colors between an original image, scanner, monitor, printer... ColorSync is the built-in CMS for Apple computers and is also used by some third party vendors. Colorsync 'links together' ICC-profiles to get a translation from one device to another. This can be compared to processlinks in Color Kit. Another important CMS is Image Color Matching (ICM) for a Windows platform.
An ICC Profile can be compared to an Esko profile since it is also a piece of data that defines the colors of a specific device.
However, there are some important differences.
Notes on importing an ICC profile
When importing ICC profiles into Color Kit, bear in mind that the quality of the profile strongly depends on:
• The precision of the spectrophotometer with which the profiles are made. Not all spectrophotometers are high-end and produce accurate data. Esko has carefully selected the accurate spectrophotometers (See: supported spectrophotometers (page 7).)

ICC profiles
45
• Stability of the devices. If you downloaded a profile of a particular monitor, it does not necessarily mean that your monitor produces the same colors, even though it concerns exactly the same model. Every device can be different and should be profiled separately for optimal results.
• Stability in time of the device. The colors of the device might have drifted since the profile was made.
Also bear in mind that ICC has standardized the dataformat of the profiles, not the characterization of devices, for colormatching. ICC allows for private tags which makes that a profile can contain information that cannot be read by everyone.
In other words, if you have a proofer profile which produced good results with a particular RIP, it does not mean that it will yield the same results with FlexProof because of the private tags.
Exporting to ICC profiles
All types of Esko profiles (except special color and multi color profiles) can be converted to ICC profiles. Proceed as follows:
1. Go the ICC profiles dialog box.
2. Choose which kind of ICC profile you want to generate (monitor, printer).
Note
There are no 'native' scanner profiles to be exported by Color Kit.
3. Go to the 'File' menu and choose 'New'.
4. Choose the Esko profile you want to export.
5. Choose a quality and a Gamut Mapping Technique.
6. Go to the 'File' menu and choose 'Save as'.
7. Enter a name and click 'OK'.
The ICC profile will now be calculated.
Note
Depending on the quality chosen and the speed of your computer, calculation time may vary.

ICC profiles
46
Note
It is not possible to influence the settings for black generation at this moment. The ICC profiles that Color Kit generates, alwayswill use minimal black.
• Using Dot gain simulation curves (page 46)
• Using Refinement curves (page 46)
• Using Black Generation (page 46)
Using Dot gain simulation curves
When exporting to an ICC profile, it is possible to use 'dot gain simulation' curves. These curves will only have an effect if the profile is used as a reference profile.
This type of dot gain simulation can be compared to the dot gain simulation used in Color Strategies.
Using Refinement curves
When exporting to an ICC profile, it is also possible to use 'refinement' curves. These curves will have an effect only if the profile is used as an output profile. Refinement curves can be used to fine-tune the output colors.
Example
If the reds on your calibrated proofer are too strong, dgc curves can be used to cut back the magenta and yellow. This information will be stored in the ICC profile.
Using Black Generation
When exporting a CMYK profile, the Separation tab will be enabled. This is where you can specify a black generation preset, as described in the chapter Black Generation in ICC Profiles.
Notes on exporting to an ICC profile
When exporting to ICC, bear in mind that different CMS vendors will make different colormatches, even if the same profiles were used. These differences can be caused by the fact that:
• ICC profiles do not contain measured data points. The relation between data points in the profile and the measured data points is profile vendor specific.
• The accuracy of the algorithms and the techniques that are used in the CMM and by the different answers to the following questions:
• What to do with out-of-gamut colors?
• How to interpolate between the measured points in the Profiles?

ICC profiles
47
Importing ICC profiles
• Import an ICC profile (page 47)
• Use the ICC profile in any Esko application (page 47)
• Build process links and color strategies with ICC profiles (page 47)
Import an ICC profile
To import an ICC profile (.ICC or .ICM file) into the Color Kit database, proceed as follows:
1. Go to 'Icc Profiles'.
2. Go to the 'File' menu and choose 'Register'.
3. Browse to the directory in which the profile is located, select the profile(s) and click 'OK'.
Note
ICC profiles are not converted to Esko profiles.
Build process links and color strategies with ICC profiles
ICC profiles can also be used to build device links and color strategies. Note that using device links and color strategies will generate a more accurate result than just using the profiles.
Viewing ICC profiles
You can use Color Kit to view the conversion tables stored inside an ICC profile’s, by opening an ICC profile and then selecting 'Show Measurements' from the File menu. This function is very similar to verifying a measured Esko profile, except that for an Esko profile you can see the actual measurements, while for an ICC profile the conversion table generated from the measurement data is shown.
Imported as well as Esko-generated ICC profiles can be viewed. Both the A2B and B2A Absolute Colorimetric tags can be viewed, for profiles with up to 7 inks. For the B2A tag, you can view both the input Lab and the Lab after gamut mapping.

48
Dealing with Special colors Color Kit features tools that enable you to characterize inks.
The standard library of Pantone inks was also characterized in this way (Cromalin based).
With Color Kit, you can also create your inks (and ink database).
We strongly advise to use the Designer Ink Book for Profiled inks since only 3 books are recognized throughout the system: Process, Pantone Colors Coated and Designer. In all your jobs, you should ONLY use inks that are in those three inkbooks.
However, if you would measure your own Pantone® book, you must use inkmapping to map incoming inks (used in your job) to that special inkbook.
How to create your own inks?
• Copying from an existing ink book (page 48)
• Measuring an ink with a spectrophotometer (page 48)
• Creating an ink by entering an LAB value (page Error! Bookmark not defined.)
Copying from an existing ink book
This can be useful if you want to use the spectral information and accuracy of a Pantone ink but you want to give the ink another name.
1. Open the ink book you want to copy an ink from (e.g. the Pantone Color Coated book).
2. Open the ink book you want to copy the ink to (e.g. the Designer inkbook).
3. Drag and drop the ink into the ink book (or use Copy/Paste).
Measuring an ink with a spectrophotometer For outputting to your HP Indigo digital Press, we recommend to introduce special colours into the
designer book by measuring the 100% patch. Click
Measuring the 100% patch
You can 'profile' an ink with only one measurement. This can be very useful if you want to simulate a special flat tint and the thing you have is an original. In this case you can measure this single color with your spectrophotometer. Proceed as follows:
1. Open the ink book you want to add the ink to.
2. Select an empty color patch.
3. Put the head of your spectrophotometer on the color that you want to measure.

Dealing with Special colors
49
Note
If you are working with a Gretag SpectroScan, you will have to align the crosshair on the patch that you want to measure.
4. Click the 'one measurement' button:
5. Give an appropriate name to the ink.
6. Go to the 'File' menu and click 'Save' to save the changes you made to the ink book.
Creating an ink by entering an LAB value
A third way to add an ink to the database is by entering an LAB value:
1. Open the ink book you want to add the ink to.
2. Select an empty color patch.
3. Click the Lab icon
4. The 'Add Lab color...' window appears:
5. Enter a LAB value or use the sliders to determine the color.
Note
'L' determines the Lightness, 'a' is the Green-Red axis and 'b' is the Yellow-Blue axis.

Dealing with Special colors
50
Info on inks
Inks from the standard Esko ink books:
Inks based on an LAB value:
Export an ink book
1. Open the ink book you want to export.
2. Go to the 'File' menu > 'Export'.
3. Browse to a location, enter an appropriate file name and click 'OK'.
This will result in a .FP (File Packer) file, which can be sent to a remote site.
Note
Profiles, device links and color strategies can also be exported and will also result into an .FP file. It is good practice to mention the type of element you exported in the name because Color Kit does not distinguish between different types of .FP files when importing. e.g. my_press.fp or designer_inkbook.fp or this_is_a_process_link.fp

Dealing with Special colors
51
Import an ink book
1. Go to 'Ink books' in the main dialog box.
2. Go to the 'File' menu > 'Import'.
3. Browse to the location where the packed ink book (an .FP file) is located and click 'OK'.
4. Go to the 'File' menu and save the ink book with an appropriate name.
Note
Only 3 books are recognized throughout the system: Process, Pantone Colors Coated and Designer.
Proof an ink book
You can make a proof of an ink book by opening the ink book and clicking the Proof button in the
toolbar on the right:
A dialog box will pop up in which you can specify print settings. In the Color tab you can select the proofer configuration and color conversion settings. Two modes are available: to a profile, and through a color strategy. This is similar to the Gamut Check tool (page 59).
In the Layout tab you can select the layout style for the ink book. You can make the book look like the standard PANTONE book, or make a smaller book or print patches only if you want to use less ink

Dealing with Special colors
52
and substrate. You can also limit the page dimensions (by default, the full page width will always be used) and specify a page range.
Note
For the PANTONE book, the page numbers of the ink book in the database do not match those on the official printed books, because additional pages with numbers like e.g. 10.5 are inserted. So when specifying a page range, make sure that you specify numbers from the book in the CMS database.
In the Advanced tab, you can specify whether or not to keep the ink book’s layout as it is shown in Color Kit, or to put all patches next to each other and skip empty patches. You can also specify to print various information about the inks next to the patches.

Dealing with Special colors
53
Note
Pages and columns that are completely empty will be skipped automatically.

54
Tools • Links (page 54)
• Gamut View (page 56)
• Compare Inks (page 58)
• Gamut Check (page 59)
• Average Profiles (page 60)
• Preferences (page 62)
Links
'Links' allows you to quickly find out if a certain element (an ink, a profile, …) is referenced somewhere else in the CMS database.
Example
To find out if a profile is used in a device link, you can use Links. The main objective is not only to find out but also to delete elements from the database. Since elements cannot be deleted when they are still referenced, it is important to know what element needs to be deleted first.
Example
I would like to delete a profile from the database because I do not use it anymore. Color Kit does not allow me to delete it because there is a device link that uses this process.
• How to use 'Links'? (page 54)
• How to use 'Links' to delete elements (page 55)
How to use 'Links'?
Links can be used on inks, measured profiles, ICC profiles, device links and Color strategies.
The basic procedure is:
1. Open the element of which you want to check the links.
2. Go to the 'File' menu and click 'Links…'
Example
To check Links of a particular print process, proceed as follows:
1. Open the print process.
2. Go to the 'File' menu and click Links…

Tools
55
The red arrows tells you that the selected profile 'proofer_8x8_black' is referenced 5 times in device links and as many color strategies.
Note
Other Links can be found from the first window. Just double-click an element or select an element and click 'Links for Selected'.
The links for the selected profile 'HP5000', are shown in a new window. In this example, the profile is not linked anywhere and could be deleted.
How to use 'Links' to delete elements
As soon as the links for a certain element have been found, 'Links' can be used to delete the elements selected in RED.
To delete all red elements at once, click 'Delete' in the 'Links' window and confirm.
Note
Only elements selected in red can be deleted.
Note
Green arrows indicate what the selected elements are made of.

Tools
56
Note
Read-only elements cannot be deleted from “Links”.
Gamut View
With gamut view, you can evaluate the color gamut of a device and compare different color gamuts with each other. The color gamut(s) can be viewed along the L axis or along the a-b axis. A 2-D section will be shown.
Example
You can see the differnce between the gamut of press output on a glossy paper with press output on matte paper.
1. Go to the 'Tools' menu and choose 'Gamut View'.
2. In Plane selection, click 'L' to see the gamut from on top, click 'Hue' to see the gamut from the side. The sliders determine the place where the section will be taken.
Example
With L set to 50, the gamut section will be taken at L=50.
3. Double-click the white field under 'Profile' and select a profile from the list.
4. Click 'Show Plane' to view the profile's color gamut.

Tools
57
To delete a profile from the list, press the 'Delete' button on your keyboard or select the icon from the toolbar next to ‘Profiles:’
You can change the color of the visualization by first selecting a profile and then select the refine icon in the toolbar next to ‘Profiles:’
An RGB slider pops up, which allows you to change the color. Click 'Show plane again' to work with the new color.
To compare two or more profiles with each other, add more profiles to the list, give them different colors to be able to see the difference, make sure the profile is checked and click 'Show Plane'.

Tools
58
In the example above, a press profile (blue) and a proofer profile (red) are compared. You can see that the press profile is virtually completely covered by the proofer profile.
Compare Inks
This tool allows you to compare colors. Colors can be dragged and dropped from an inkbook (e.g Pantone book) and compared with a sample color that is measured or also dragged from an ink book.
Both the LAB of the individual color and the Delta E between the 2 colors are displayed.
You can also add colors by measuring a single patch, or specifying either CMYK, RGB or Lab values.

Tools
59
A list of comparions can be made and exported to a text file by clicking the 'Save As...' button in the bottom-right corner.
Gamut Check
A Gamut check allows you to verify if colors are in or outside gamut of a given profile (which can be 3,4,5,6,7 color profiles).
The example above shows how Pantone colors will be simulated on an Indigo using 7 colours.

Tools
60
For every Pantone, the Gamut check window tells you:
• How it will be separated.
• If it is inside gamut or not (a tick means it is inside).
• The last column tells something about how far the color is out of gamut.
• The last column also indicates the accuracy of the profile. If the tick is on and the Delta E is high, it means the profile is not accurate in this area (typically with ICC profiles).
• At the bottom of the window an overview is given with a total amount of inks inside gamut.
• Double-click an ink to view Lab values of the target ink, and Lab values of the match, and to see the difference visually. This way you can see exactly how the colors differ. Based on this you may decide to change a color strategy’s rendering intent, or to use custom values for this ink.
• For Color Strategies, you will find an extra option ‘Source Process Inks’ at the bottom of the ink
book list in the ink book dropdown list. This option allows you to do a quick check on your process ink solids, to see if they are in gamut.
Average Profiles
The Average Profiles tool allows you to create an averaged profile from a number of measured profiles. The profile is averaged out sample by sample, and therefore, all profiles need to be based on the same chart.

Tools
61
You will find the Average Profiles tool in the Tools menu. First, you will need to select your base profile. This profile will determine what chart type you are going to use. This profile will also be the first in the list of profiles to use for averaging.
Note
To use a profile for averaging, it must be completely measured. ICC profiles and calculated press profiles cannot be used.
After selecting the base profile, you can add more profiles by clicking the 'add' button:
A list of profiles that are compatible with the base profile will be generated. If you have a large number of profiles in the database, this may take a while.
Note
To be compatible, only the profile’s chart type needs to be the same. The same chart type is often available for different spectrophotometers. This means that you can measure the same chart on different instruments and average out, compensating for differences between spectrophotometer types.
You can give some profiles a greater or smaller weight, which makes a profilel have more or less influence on the averaged profile. By default, all profiles are attributed the same weight.

Tools
62
To generate and save the new profile, click 'Save Averaged Profile…'.
Preferences
You can specify a number of preferences in Esko Color Kit so that these settings are kept between different Color Kit sessions. Go to the 'File' menu and click 'Preferences'.
• Modules (page 62)
• Spectrophotometer (page 63)
• Color Settings (page 63)
• Chart Settings (page 64)
Modules
In the modules tab you can choose which icons you want to see in the icon bar. Modules like inkswitch or BlackSmith are not used in an HP Indigo workflow. We recommend to switch off InkSwitch and

Tools
63
Spectrophotometer
By default, Color Kit automatically detects the connected spectrophotometer. If you always connect your spectrophotometer to the same port, you could specify the port name in the spectrophotometer tab of the preferences dialog box in order to speed up the automatic detection.
Color Settings
Color Kit offers a number of dialog boxes where you can specify the illuminant under which the color match is done, e.g. the Compare tool, Gamut View, device links and color strategies. If the illuminant under which you are matching colors is different from D50, e.g. D65, you can specify this in the Color Settings tab and all dialog boxes will come up with this selection as default. You can only match under an illuminant different from ‘CIE Illuminant D50’ if you use profiles with spectral data. This is not the case for ICC profiles.
In a number of dialog boxes the quality of a color match is indicated with a number. In the past this number was calculated with the classical CIELab DeltaE formula also known as Delta E 76. Now you can select between 5 different formulas: CIELab DeltaE (classical), Delta E 94, Delta E 2000, CMC

Tools
64
(1:1) and CMC (2:1). The selection that you make in the Color Settings tab will be used as default in the dialog boxes of the Compare Tool, Gamut Check, and Color Strategies.
Chart Settings
A number of dialog boxes shows the dimensions of charts. The Chart Settings option allows you to specify in which units the dimensions need to be expressed.

65
Example of a workflow We explain how to proceed if you want to output jobs on your HPIndigo.
1. Make sure your press is in perfect condition. (We advise to do a LUT generation before outputting the color charts). You need to be aware for which substrate you are going to make a profile, which LUT you are going to use to output it, which substrate settings you are going to apply on the press etc. Connect your spectrophotometer to your system and switch it on if applicable. (the drivers should already be installed)
2. In Color Kit, make a new proofer profile, carefully select for which configuration, in other words for which output colours the profiles is meant to be.

Extra information
66
In this example we make a profile for IndiChrome output (CMYKOV), choose this inkset from the drop down list. The chosen inks are also reflected when you open the ‘Inks’ tab.
In the example below, your profile is not saved yet, all buttons are still disabled. You need to save the profile, before you can:
• output the charts with the simple push of a button
• measure the charts with your spectrophotometer.
As you can see aswell , the choice of charts is already made for you, depending of the spectrophotometer and the configuration. In this example an i1io is connected and recognized by the system.

Extra information
67
After you save the file, carefully considering an appropriate name, the buttons are active, send the files by pushing the button.
Print bthe files on the press and measure them after having pressed the measure button. When finishing measuring, do check the measurements. ‘File’, ‘Show Measurements’.

Extra information
68
When there are no mistakes in the measurements, proceed by making a new color strategy.

Extra information
69
Right-click on ‘Color Strategy’ and choose ‘New’

Extra information
70
We choose the same profile for source and destination. Leaving the Destination profile on <Automatic> has the same effect. Save the color straegy through the ‘File’ menu. No colour management will take place for incoming CMYK values. Settings in the ‘Convert Special Inks’ menu will define how incoming designer inks or Pantone® inks are dealt with.
Click on ‘Convert Special Inks. to have a closer look how this is done:

Extra information
71
Choose ‘Match Solids.
Pantone® inks will be converted by means of the Destination Profile.
Set Gamut Mapping to Closest Color.
Save the strategy again. You can close it for now.
At this stage you can already predict how your Pantone® inks will be separated, by using on of Color Kit’s powerful tools: Gamut Check. You find it under the Tools menu.

Extra information
72
Choose inkbook Pantone® and choose your finished strategy. Click the Check Button.

Extra information
73
On the basis of the output percentages that you get now, you may wish to already change some values manually. This is done by adding individual inks to the exception list in ‘Convert Special Inks’.

Extra information
74
In Pantone® 494, we remove the 1,5% black.
As a next step, proof your inkbook by opening the Pantone® book and print it on your HP Indigo Press with your color strategy, using the proof icon.
After visual compaison of Pantone® inks on the press and in your Pantone® librarary, you can now either manually refine some inks by:

Extra information
75
• manually editing values
• refining values by measuring the printed result
• proofing grid charts.
The result will be a strategy that optimally fits your needs. The strategy can now be applied to your proof tickets. Remember that the list of strategies in the ticket will depend on the configuration you have chosen! Logically, you will see all CMYKOV strategies in the drop down list if the chosen configuration is a CMYKOV configuration. Output jobs with a given color strategy when you are sure to use the same press conditions as the ones used to make the profile!
After a while, you will have a powerful database of profiles and strategies, that will allow you to spend less time for colour correction.

Extra information
76
Appendix, a closer look at the standard Color Strategies
Color Kit comes with a set of standard color strategies: Here is how they look like:
name: HPI-CMYKW:
What is it used for? for CMYK, so in combination with a HP Indigo FlexRip configuration CMYK.
Is white set as extra output ink? Yes, white inks is set as extra output ink. The name of the white ink must be
‘HPI-White’. When a job contains no white ink with that name, no white separation will be generated on the press.
Which method is used for converting Pantone® inks? HP Indigo CMYK 1.0
name: HPI-CMYKOVW
What is it used for? for CMYKOV (IndiChrome), so in combination with a HP Indigo FlexRip configuration
CMYKOV.
Is white set as extra output ink? Yes, white inks is set as extra output ink. The name of the white ink must be
‘HPI-White’. When a job contains no white ink with that name, no white separation will be generated on the press.
Which method is used for converting Pantone® inks? HP IndiChrome

Extra information
77
name: HPI-CMYKOVG
What is it used for? for CMYKOVG (IndiChrome Plus), so in combination with a HP Indigo FlexRip configuration
CMYKOVG.
Is white set as extra output ink? No, as green will be used as 7th ink. The maximum of 7 inks on Press is now used.
Which method is used for converting Pantone® inks? HP IndiChrome Plus 1.0
name: HPI-7COLORS
What is it used for? It is conceived to output preseparated jobs, it should be used in combination with a HP Indigo
FlexRip configuration CMYK.
Is white set as extra output ink? Possibly, white ink is set as extra output ink. There are 3 inks set as extra output
inks’.
The names are HPI1, HPI2 and HPI3. When a job contains inks with that name, an extra separation will be generated
on the press. So you can send jobs that are already separated in CMYKOV, provided the Orange separation is called

Extra information
78
HPI1, 2 or 3, Violet is called HPI1, 2 or 3. There can be either a green or a white ink called HPI1,2 or 3. In this case
the name of the white ink CANNOT be HPI-White like in the other strategies.
You can also use this strategy for specially mixed inks, perhaps you want to use it for a job that is preseparated to be
printed with CMYK+Orange+Blue071
Which method is used for converting Pantone® inks? HP Indigo CMYK 1.0

Extra information
79

reorder: P/N CA294-05750
Copyright © 2008 Hewlett-Packard Company
This is an HP Indigo digital print. Printed in Israel.
www.hp.com/go/indigo