hplc 2013 - impact of particle designs for achieving ... · © 2012 sigma-aldrich co. all rights...
TRANSCRIPT

© 2012 Sigma-Aldrich Co. All rights reserved.
sigma-aldrich.com/analytical
Impact of Particle Designs for Achieving Performance in Liquid Separations
David S. BellHPLC 2013

© 2012 Sigma-Aldrich Co. All rights reserved.
2
Introduction
In recent years, a major driving force in HPLC innovation has been the desire for faster method development and analysis
To achieve fast analysis, resolution must be maintained while other parameters such as flow rate or column length are optimized
Since resolution is, in part, dependent on theoretical plates, or ‘efficiency,’ one major trend in the industry has been to utilize smaller and smaller porous particles
4N
Efficiency SelectivityRetention
R=k’
k’+1-1
. .
© 2012 Sigma-Aldrich Co. All rights reserved.
3
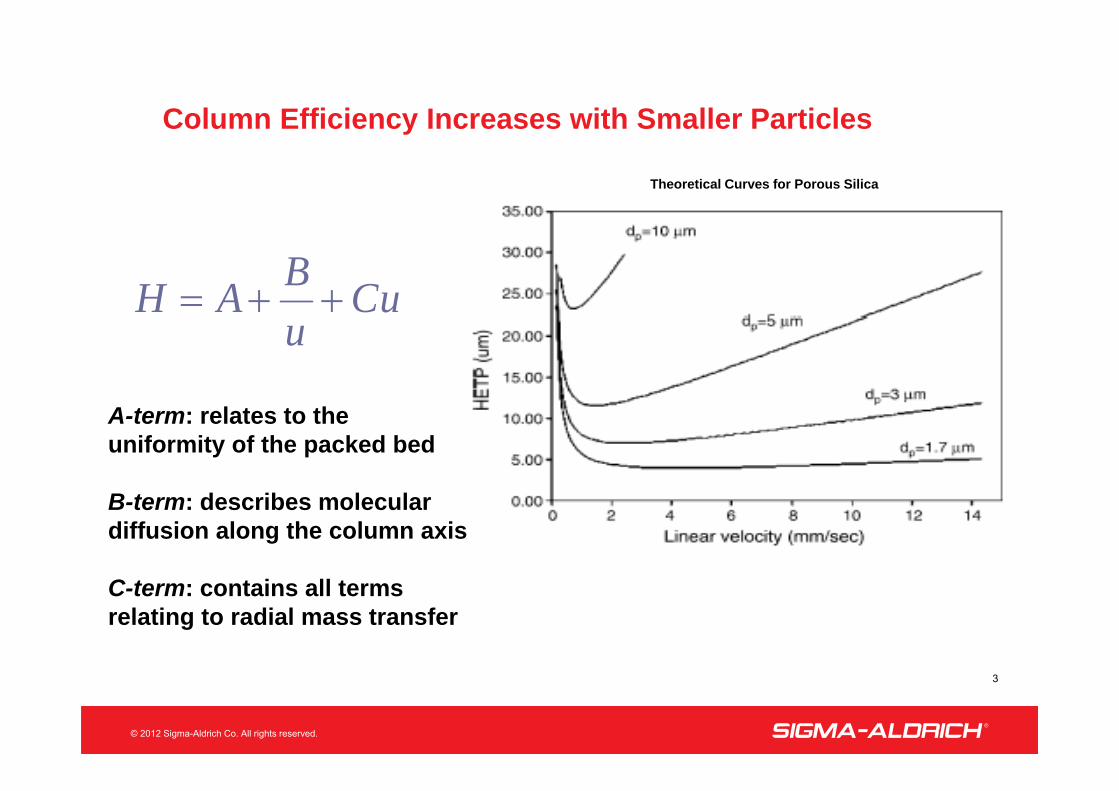
Column Efficiency Increases with Smaller Particles
Theoretical Curves for Porous Silica
CuuBAH
A-term: relates to the uniformity of the packed bed
B-term: describes molecular diffusion along the column axis
C-term: contains all terms relating to radial mass transfer
© 2012 Sigma-Aldrich Co. All rights reserved.
4
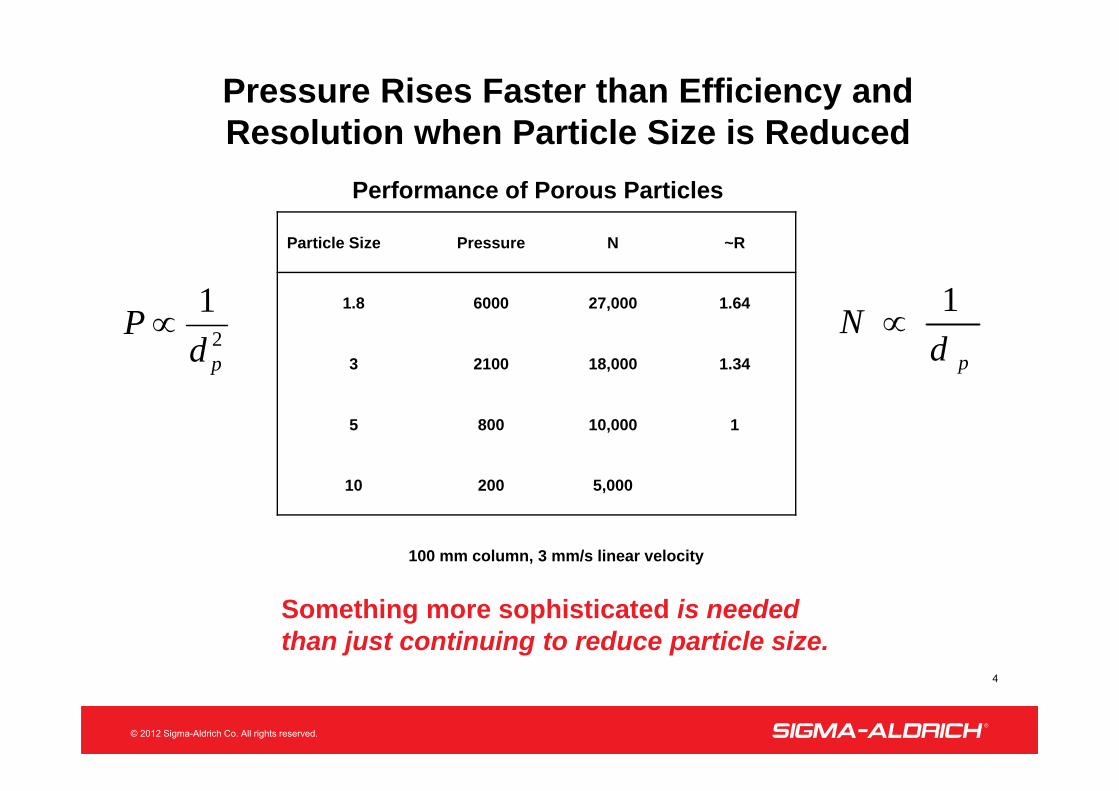
Particle Size Pressure N ~R
1.8 6000 27,000 1.64
3 2100 18,000 1.34
5 800 10,000 1
10 200 5,000
100 mm column, 3 mm/s linear velocity
pdN 1
2
1
pdP
Something more sophisticated is needed than just continuing to reduce particle size.
Pressure Rises Faster than Efficiency and Resolution when Particle Size is Reduced
Performance of Porous Particles

© 2012 Sigma-Aldrich Co. All rights reserved.
5
Fused Core Technology
• Another approach to reducing dispersion (increasing efficiency) is shown above• By placing a solid core at the center of a particle, the potential diffusion path length of an analyte molecule is effectively shortened
• A larger particle then can theoretically generate similar efficiency of a smaller totally porous particle without generating high backpressures

© 2012 Sigma-Aldrich Co. All rights reserved.
Efficiency comparison between fully porous and Fused Core 5 mm columns
250x4.6 mm 5 µm columns. Test compound: benzophenone, mobile phase ACN/H20, k' = 6.2 (isoelutropic conditions)
5
10
15
20
25
0 2 4 6 8
Supelco 5mu fitSupelco 5mu dataAgilent 5mu dataSeries4
u0 (mm/s)
H (µm)
K. Broeckhoven, D. Cabooter, G. Desmet., Kinetic performance comparison of fully and superficially porous particles with sizes ranging between 2.7 µm and 5 µm: Intrinsic evaluation and application to a pharmaceutical test compound, J. Pharm. Anal. (2013)
Fully Porous
Fused-Core
Hmin = 9.9µm
Hmin = 7.2µm
© 2012 Sigma-Aldrich Co. All rights reserved.
0.1
1.0
10.0
100.0
1000.0
10000 100000 1000000
2.7 mu 600 bar data2.7 mu 600 bar fit5mu supelco data5 mu supelco fit3.5 mu Agilent data3.5 mu Agilent fit5mu Agilent data5mu Agilent fitSupelco 2.7mu dataSupelco 2.7mu fit
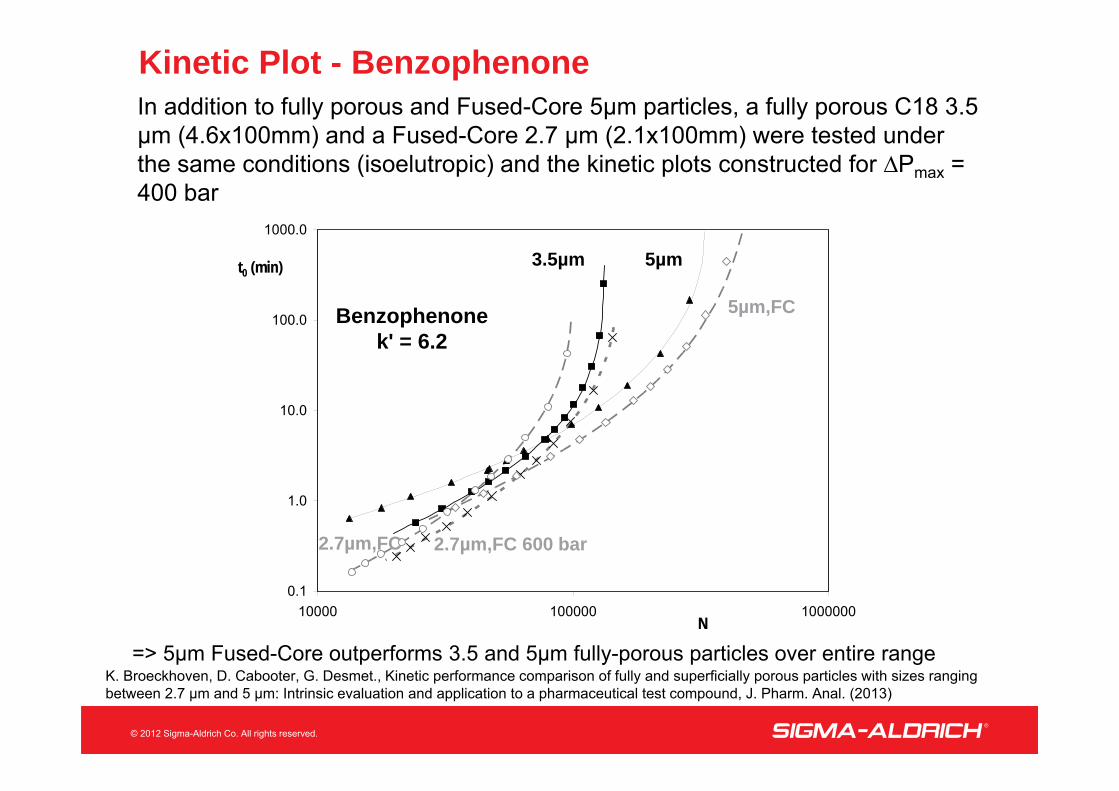
Kinetic Plot - BenzophenoneIn addition to fully porous and Fused-Core 5µm particles, a fully porous C18 3.5 µm (4.6x100mm) and a Fused-Core 2.7 µm (2.1x100mm) were tested under the same conditions (isoelutropic) and the kinetic plots constructed for ∆Pmax = 400 bar
=> 5µm Fused-Core outperforms 3.5 and 5µm fully-porous particles over entire range
5µm,FC
2.7µm,FC
5µm3.5µm
2.7µm,FC 600 bar
Benzophenonek' = 6.2
t0 (min)
N
K. Broeckhoven, D. Cabooter, G. Desmet., Kinetic performance comparison of fully and superficially porous particles with sizes ranging between 2.7 µm and 5 µm: Intrinsic evaluation and application to a pharmaceutical test compound, J. Pharm. Anal. (2013)
© 2012 Sigma-Aldrich Co. All rights reserved.
Desirability of Monodisperse Particles in HPLC
8
• Desmet, et. al. (1) observed a strong trend between narrow silica particle size distribution (PSD) and good column performance.
• Particles with standard deviation range between 5 and 20% PSD showed a near linear relationship between the A-term constant, hmin value, and minimum separation impedance.
• Desmet’s findings supported previous observations that porous-layer particles with very narrow PSD demonstrate superior efficiency and kinetic performance.
• Results suggest that performance of columns with fully porous particles might be significantly improved by very narrow PSD and become the new standard.
• A commercial process called Ecoporous™ was developed to produce silica particles with ca. 6% standard deviation that would not require further sizing.
1. D. Cabooter, A. Fanigliulo, G. Bellazzi, B. Allieri, A. Rottigni, G. Desmet, J. of Chromatography A, 1217 (2010) 7074–7081.

© 2012 Sigma-Aldrich Co. All rights reserved.
Monodisperse Particle Advantages
During our (and others) studies of Fused-Core particles, there always seemed to be an extra reason beyond the short diffusion path when trying to fully explain the increase in efficiency obtained using Fused-Core particles.
One possible theory was that the inherent monodispersity of the Fused-Core particles may be providing a significant contribution toward efficiency through:
improved packing of the bedlower eddy diffusion due to more uniform paths
To begin to study this more closely, an economical process was developed to produce monodisperse, fully porous particles.
© 2012 Sigma-Aldrich Co. All rights reserved.
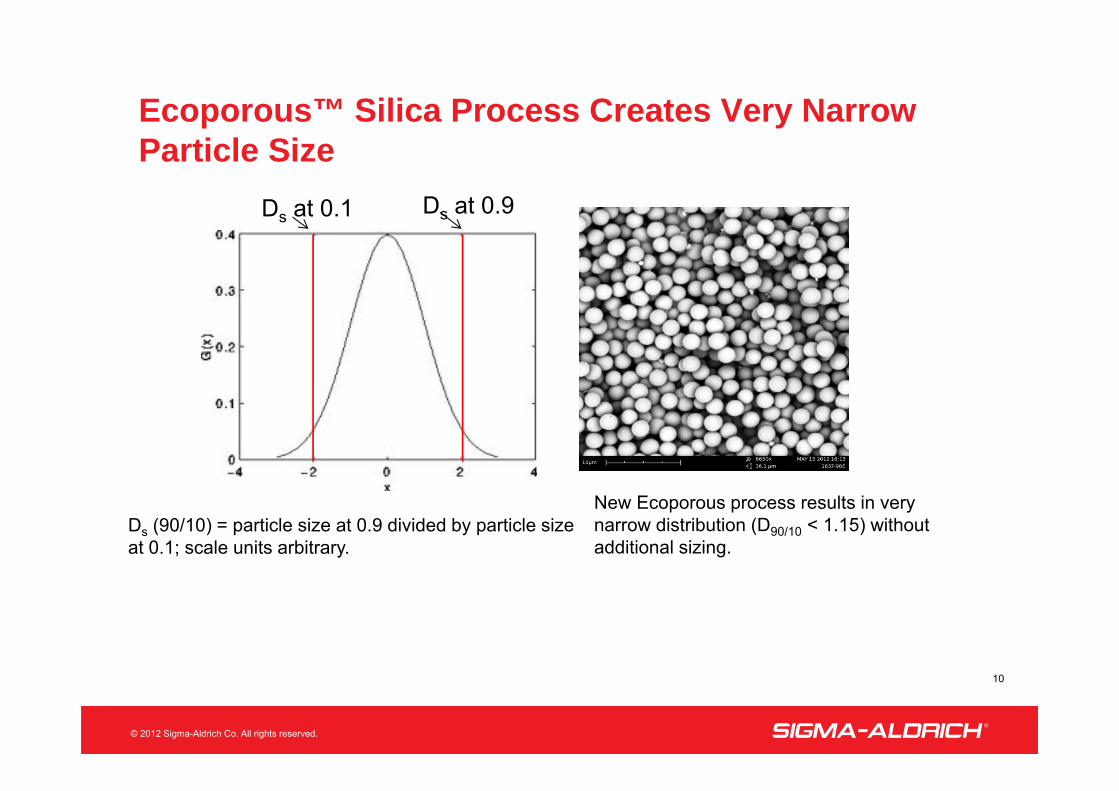
Ecoporous™ Silica Process Creates Very Narrow Particle Size
10
Ds (90/10) = particle size at 0.9 divided by particle size at 0.1; scale units arbitrary.
Ds at 0.1 Ds at 0.9
New Ecoporous process results in very narrow distribution (D90/10 < 1.15) without additional sizing.
© 2012 Sigma-Aldrich Co. All rights reserved.
0
2
4
6
8
10
12
14
16
0 1 2 3 4 5 6
number
count
(
%)
Particle Size (m)
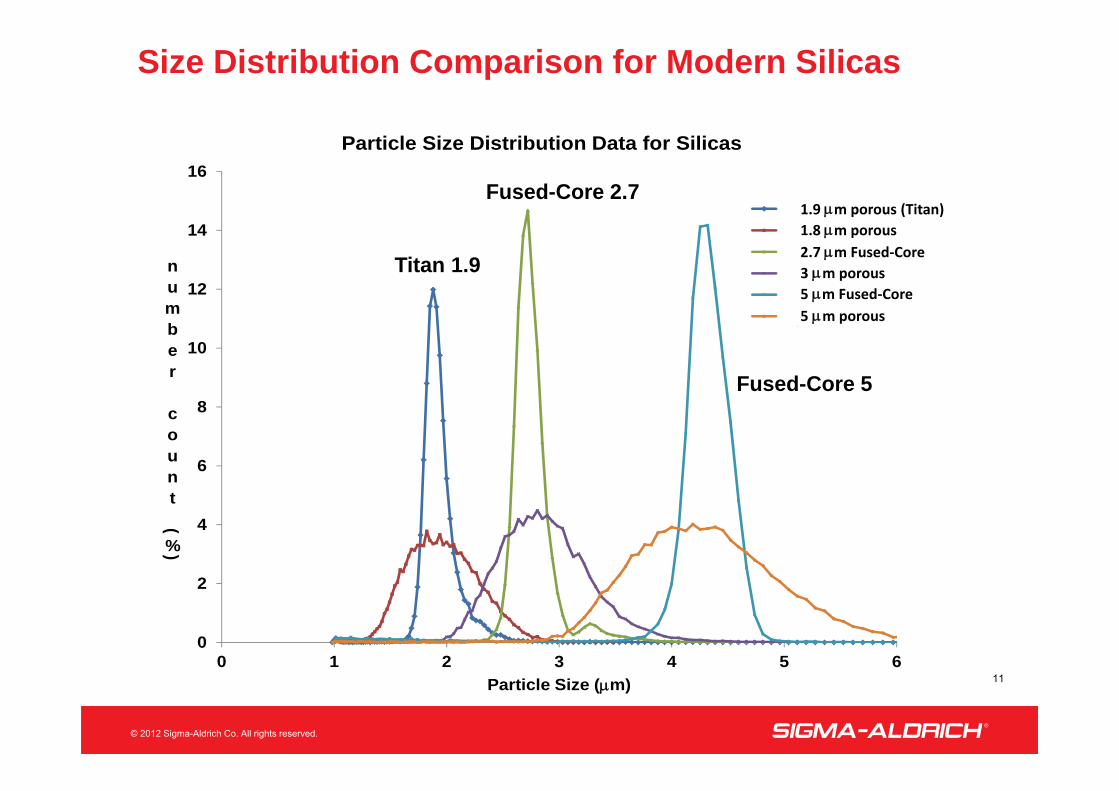
Particle Size Distribution Data for Silicas
Size Distribution Comparison for Modern Silicas
11
Titan 1.9
Fused-Core 2.7
Fused-Core 5
1.9 m porous (Titan)1.8 m porous2.7 m Fused‐Core3 m porous5 m Fused‐Core5 m porous

© 2012 Sigma-Aldrich Co. All rights reserved.
A New Line of Monodisperse, Fully PorousSub-2 µm Columns
• A new monomeric C18 chemistry has been constructed using the new particle design and dubbed Titan™.
Particle Size1
µmPore Diameter
ÅSurface area
m2/gPore Volume
cc/g
1.9 80 410 0.76
Titan Porous Silica Characteristics
© 2012 Sigma-Aldrich Co. All rights reserved.
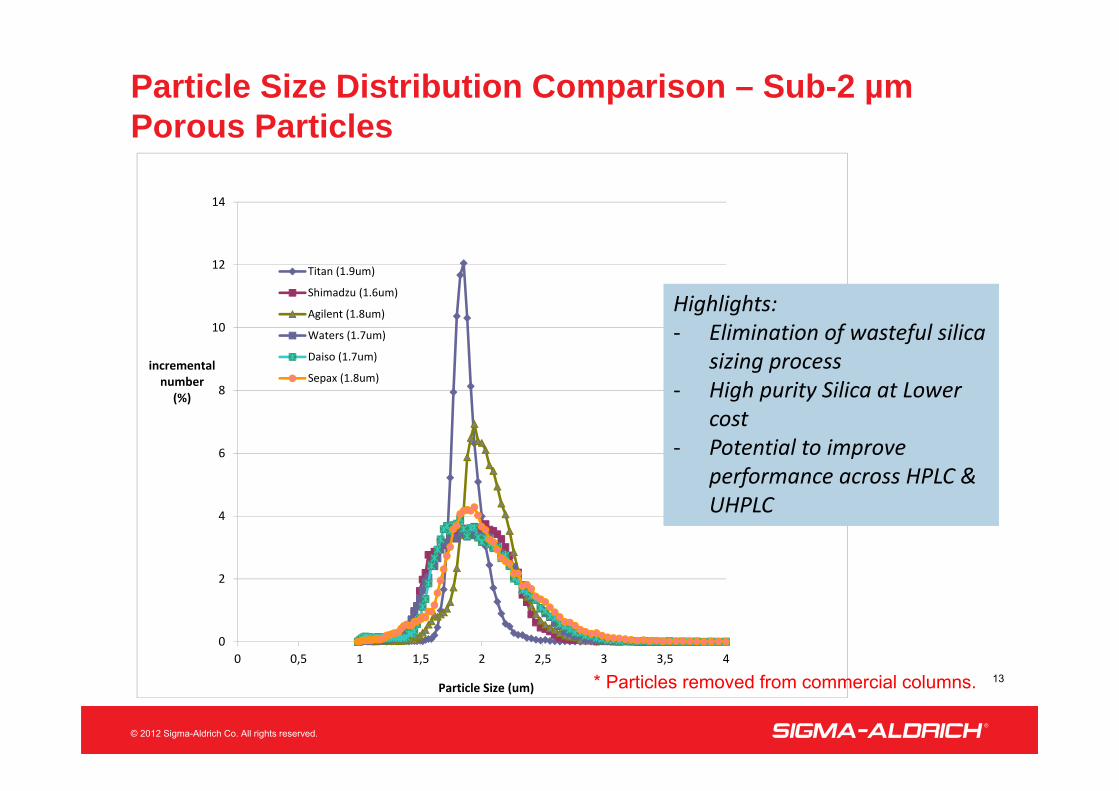
Particle Size Distribution Comparison – Sub-2 µm Porous Particles
13
0
2
4
6
8
10
12
14
0 0,5 1 1,5 2 2,5 3 3,5 4
incrementalnumber(%)
Particle Size (um)
Titan (1.9um)
Shimadzu (1.6um)
Agilent (1.8um)
Waters (1.7um)
Daiso (1.7um)
Sepax (1.8um)
* Particles removed from commercial columns.
Highlights:‐ Elimination of wasteful silica
sizing process‐ High purity Silica at Lower
cost‐ Potential to improve
performance across HPLC & UHPLC

© 2012 Sigma-Aldrich Co. All rights reserved.
0
4
8
12
16
20
0 1 2 3 4 5 6
u0 (mm/s)
H (µ
m) Ascentis 2.7µm
Poroshell - Agilent 2.7µmWaters XP 2.5µmTitan - 1.9µmWaters BEH 1.7µm
Plate height measurements
Butyrophenone, k' = 7 (ACN ~ 40%, adjusted for each column), isocratic separation. (New 1.9 monodisperse, 2.7 Fused Core, 1.7 fully porous and 2.5 fully porous)
Improved efficiency over 1.7 FP, lowest H
Data courtesy of Ken Broeckhoven, Vrije Universiteit Brussel
© 2012 Sigma-Aldrich Co. All rights reserved.
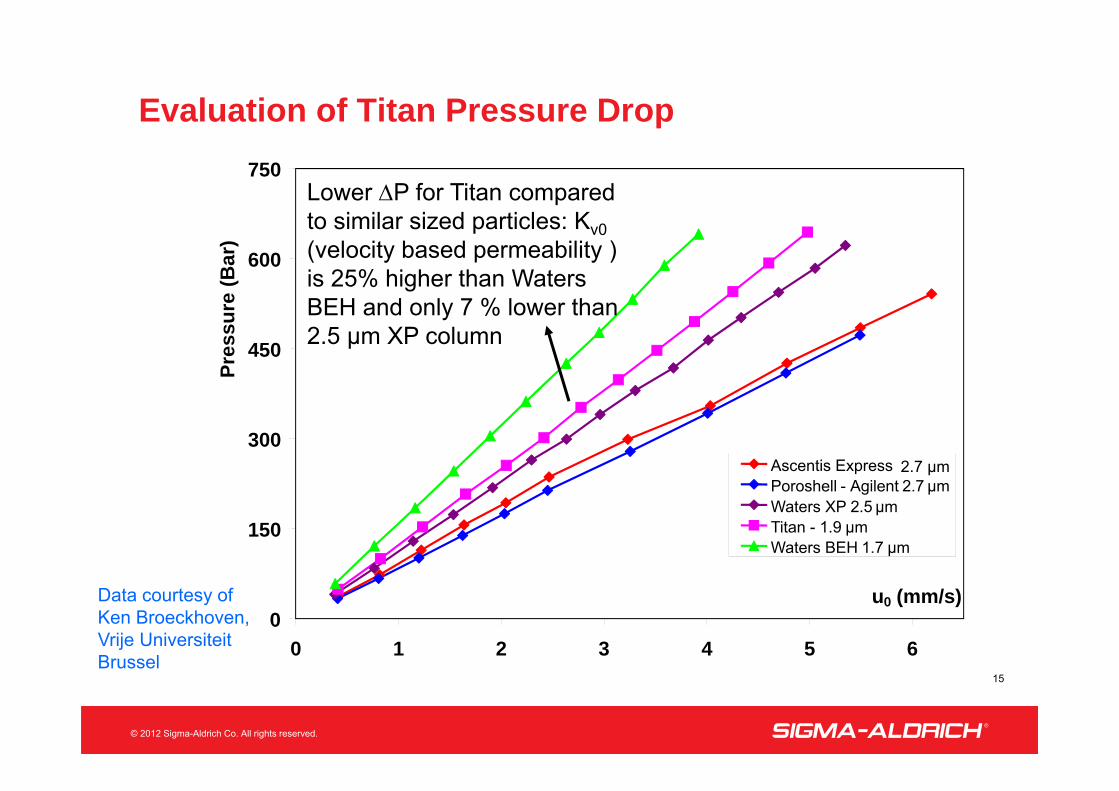
Evaluation of Titan Pressure Drop
15
0
150
300
450
600
750
0 1 2 3 4 5 6
u0 (mm/s)
Pres
sure
(Bar
)
Ascentis Express 2.7 µm Poroshell - Agilent 2.7 µmWaters XP 2.5 µmTitan - 1.9 µmWaters BEH 1.7 µm
Lower P for Titan compared to similar sized particles: Kv0(velocity based permeability ) is 25% higher than Waters BEH and only 7 % lower than2.5 µm XP column
Data courtesy of Ken Broeckhoven, Vrije Universiteit Brussel
© 2012 Sigma-Aldrich Co. All rights reserved.
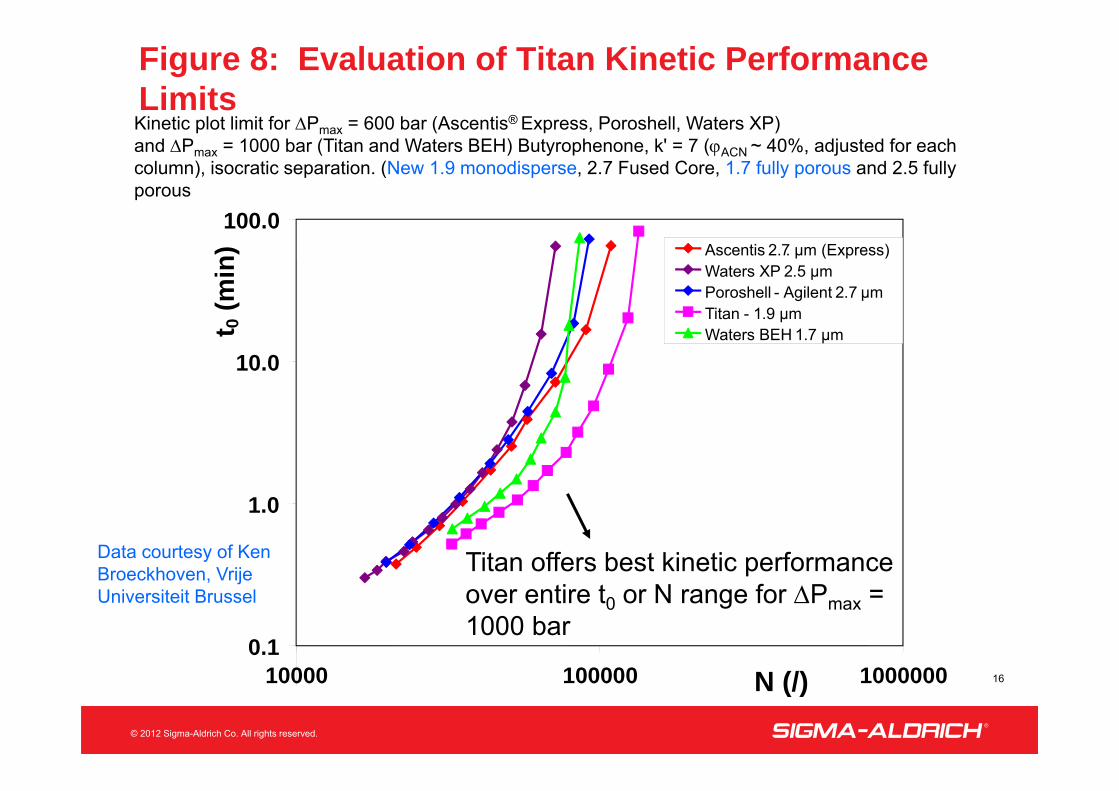
Figure 8: Evaluation of Titan Kinetic Performance Limits
16
0.1
1.0
10.0
100.0
10000 100000 1000000N (/)
t 0(m
in) Ascentis 2. .7 µm (Express)
Waters XP 2.5 µmPoroshell - Agilent 2.7 µmTitan - 1.9 µmWaters BEH 1.7 µm
Kinetic plot limit for Pmax = 600 bar (Ascentis® Express, Poroshell, Waters XP)and Pmax = 1000 bar (Titan and Waters BEH) Butyrophenone, k' = 7 (ACN ~ 40%, adjusted for each column), isocratic separation. (New 1.9 monodisperse, 2.7 Fused Core, 1.7 fully porous and 2.5 fully porous
Titan offers best kinetic performance over entire t0 or N range for Pmax = 1000 bar
Data courtesy of Ken Broeckhoven, Vrije Universiteit Brussel
© 2012 Sigma-Aldrich Co. All rights reserved.
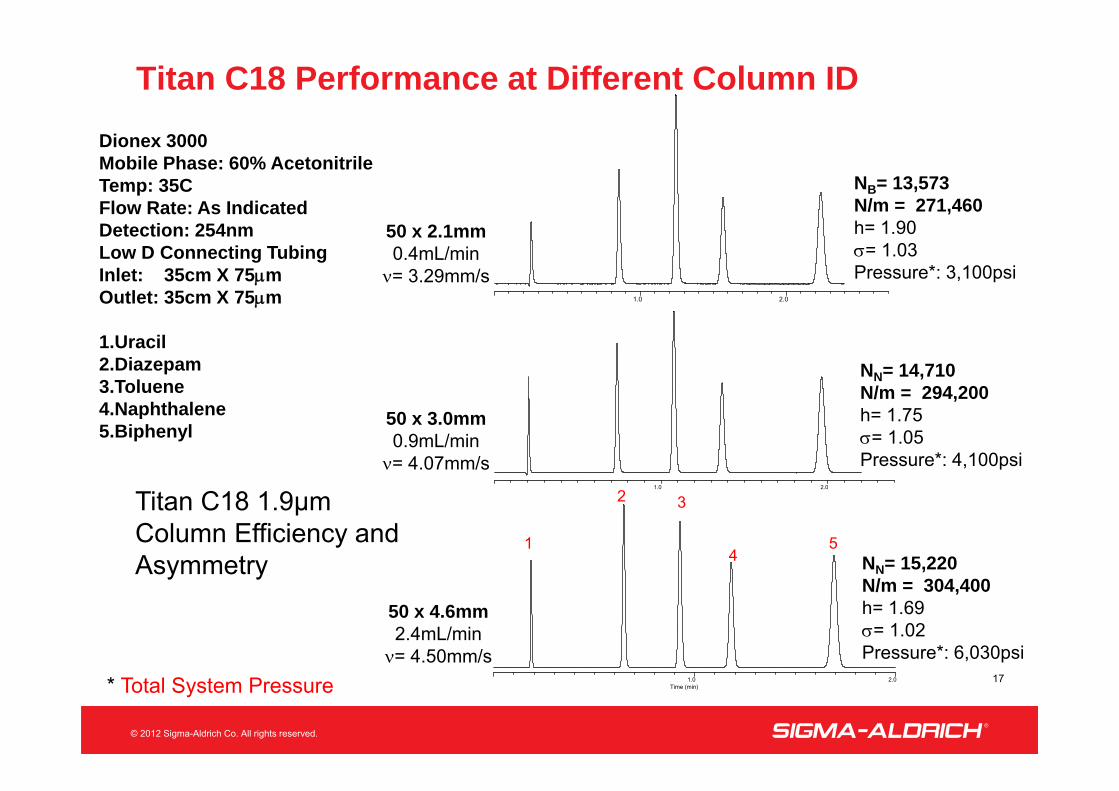
Titan C18 1.9µm Column Efficiency and Asymmetry
1.0 2.0
NB= 13,573N/m = 271,460h= 1.90= 1.03Pressure*: 3,100psi
50 x 2.1mm0.4mL/min
= 3.29mm/s
1.0 2.0
NN= 14,710N/m = 294,200h= 1.75= 1.05Pressure*: 4,100psi
50 x 3.0mm0.9mL/min
= 4.07mm/s
2
1.0 2.0Time (min)
NN= 15,220N/m = 304,400h= 1.69= 1.02Pressure*: 6,030psi
50 x 4.6mm2.4mL/min
= 4.50mm/s
1
3
45
Dionex 3000Mobile Phase: 60% AcetonitrileTemp: 35CFlow Rate: As IndicatedDetection: 254nmLow D Connecting TubingInlet: 35cm X 75mOutlet: 35cm X 75m
1.Uracil2.Diazepam3.Toluene4.Naphthalene5.Biphenyl
Titan C18 Performance at Different Column ID
17* Total System Pressure

© 2012 Sigma-Aldrich Co. All rights reserved.
Waters BEH C18 1.7um
Agilent C18 Eclipse Plus 1.8um
Titan C18 1.9um
Dionex 3000 (Low D tubing)Column: 50 X 3.0mmMobile Phase: 60% AcetonitrileTemp: 35CFlow Rate: 0.9mL/min (4 mm/s)Detection: 254nm
1.Uracil2.Diazepam3.Toluene4.Naphthalene5.Biphenyl
NNap= 9,783Nnap/m= 195,700 Pressure*= 4,900psi
NNap= 9,260NNap/m= 185,200Pressure*= 4,650psi
Titan C18 Performance Comparison in ACN
18
1.0 2.0
NNap= 14,710N/m = 294,200Pressure*= 4,100psi
1.0 2.0
1.0 2.0
1
23
4 5
* Total System Pressure

© 2012 Sigma-Aldrich Co. All rights reserved.
0 2 4 6 8Time (min)
0.46
3
2.52
3
2.93
1
3.34
93.
473
4.64
14.
847
5.30
6
5.56
5
7.78
8
TolueneD8
H8
Naphthalene
D8
H8
P-Xylene
D10
H10
Dionex 3000 (low D tubing)Column: Titan C18 1.9mmDimension: 100 x 2.1mmMobile Phase: 50% ACNTemperature: 35CFlow Rate: 0.4mL/minDetection: UV / 254nmPressure: 5650 psi/390 bar
Dia
zepa
m
N,N
-Dim
etyl
anili
ne
Bip
heny
l
N = 25,530N/m = 255,000
Titan C18: High Speed and High Resolution
19
Deuterated isomers separation
© 2012 Sigma-Aldrich Co. All rights reserved.
20
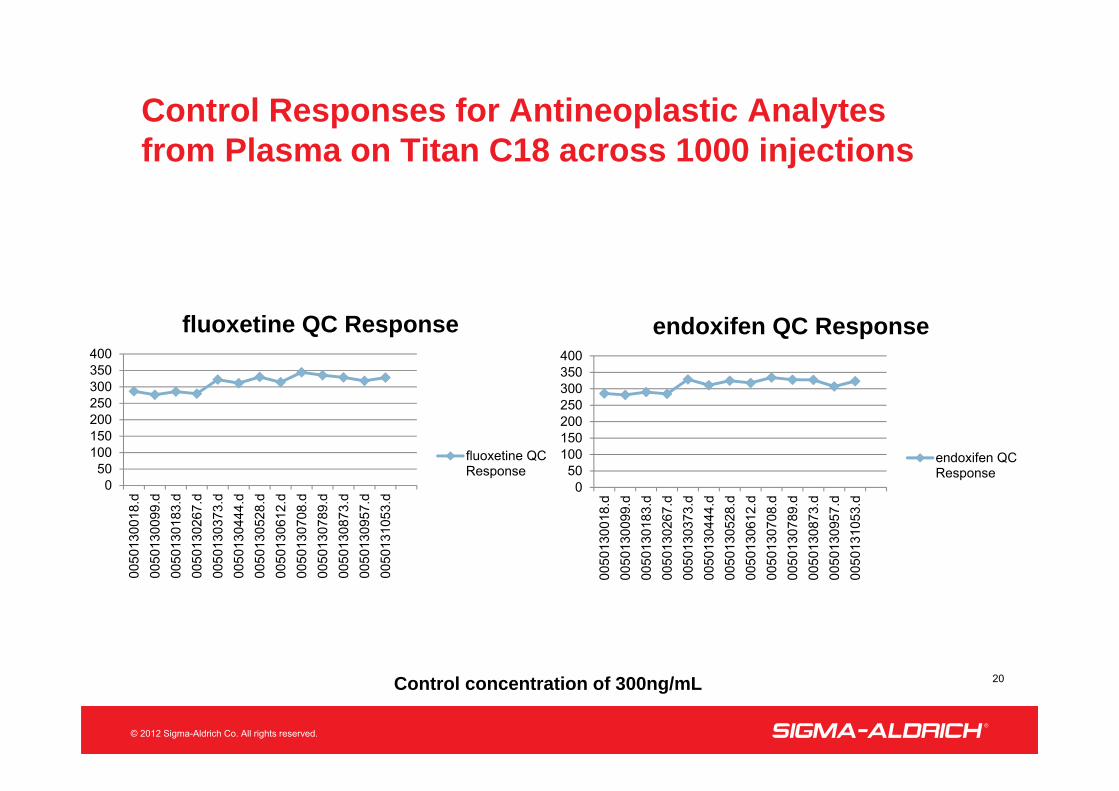
Control Responses for Antineoplastic Analytesfrom Plasma on Titan C18 across 1000 injections
Control concentration of 300ng/mL
050
100150200250300350400
0050
1300
18.d
0050
1300
99.d
0050
1301
83.d
0050
1302
67.d
0050
1303
73.d
0050
1304
44.d
0050
1305
28.d
0050
1306
12.d
0050
1307
08.d
0050
1307
89.d
0050
1308
73.d
0050
1309
57.d
0050
1310
53.d
fluoxetine QC Response
fluoxetine QCResponse
050
100150200250300350400
0050
1300
18.d
0050
1300
99.d
0050
1301
83.d
0050
1302
67.d
0050
1303
73.d
0050
1304
44.d
0050
1305
28.d
0050
1306
12.d
0050
1307
08.d
0050
1307
89.d
0050
1308
73.d
0050
1309
57.d
0050
1310
53.d
endoxifen QC Response
endoxifen QCResponse

© 2012 Sigma-Aldrich Co. All rights reserved.
Conclusions
21
• A new process called Ecoporous has been developed for making porous silica that matches the narrow size distribution of Fused-Core particles; no extra sizing step is required; no silica is wasted; a new standard has been established.
• Particles with 80 Å pores and 410 m2/g have been prepared in 1.9 µm with a 6% standard deviation in PSD.
• Efficiency matches or exceeds porous particles of 1.7 and 1.8 µm size while pressure drop for the larger Titan particle is lower.
• Uniform Titan particles pack into rugged column beds that are stable over a range of UHPLC flow and pressure conditions.
• Excellent batch reproducibility and robustness is observed.

© 2012 Sigma-Aldrich Co. All rights reserved.
References and Acknowledgements
22
1. D. Cabooter, A. Fanigliulo, G. Bellazzi, B. Allieri, A. Rottigni, G. Desmet, J. of Chromatography A, 1217 (2010) 7074–7081.
2. M. R. Euerby and P. Petersson, J. of Chromatography A, 994 (2003) 13–36.
The assistance of Ken Broeckhoven, Vrije Universiteit Brussel, Department of Chemical Engineering, Belgium is appreciated for performing a kinetic evaluation of columns with 1.9 µm Titan C18 particles.
William Campbell, Bill Betz, Craig Aurand, Hillel Brandes, Carmen Santasania, Gaurang Parmar, Richard Henry
Ascentis® is a registered trademark of Sigma-Aldrich Co. LLC; Titan™ and Ecoporous™ are trademarks of Sigma-Aldrich Co. LLC; Fused-Core® is a registered trademark of Advanced Materials Technology, Inc.