hsbc collective investment trust · annual report 2019. contents page 1. hsbc collective...
TRANSCRIPT

HSBC Collective Investment TrustAnnual Report 2019

Contents
Page1. HSBCCOLLECTIVEINVESTMENTTRUST
1.1 HSBCCHINAMULTI-ASSETINCOMEFUND
1.2 HSBCALLCHINABONDFUND(formerlyknownasHSBCRQFIICHINESEFIxEDINCOMEFUND)
1.3 HSBCASIAPACIFICExJAPANEQUITYVOLATILITYFOCUSEDFUND
1.4 HSBCEUROMULTI-ASSETINCOMEFUND
1.5 HSBCASIAHIGHINCOMEBONDFUND
Investment Adviser’s Reports 1Trustee’s Report 4Independent Auditors’ Report to the Unitholders 5Statement of Assets and Liabilities 8Statement of Comprehensive Income 17Statement of Changes in Net Assets Attributable to Unitholders 21Cash Flow Statement 29Distribution Statement 33Notes to the Financial Statements 46Portfolio Statement (Unaudited) 105Statement of Movements in Portfolio Holdings (Unaudited) 120Performance Record (Unaudited) 125
2. ADMINISTRATION 140

1
Investment Adviser’s Report
HSBCChinaMulti-AssetIncomeFund
The HSBC China Multi Asset Income Fund registered a negative return for the 1-year period ending 31 March 2019, mainly driven by the unfavorable performance of Chinese equities. The asset class returned quite negatively over the year, dragging on the overall fund performance. Market sentiment was affected by the ongoing trade disputes between the US and China, coupled with general concerns that global economies may be in the early stages of a slowdown. On the other hand, the fixed income sleeve returned favorably offsetting part of the unfavorable equity performance. Offshore RMB bond yields declined over the year, and offshore RMB bonds returned positively. US dollar denominated Chinese fixed income provided good diversification effect as well over the period, adding value to the portfolio.
Given resilience in the economy, strong credit growth, and concerns about asset price bubbles forming in the equity market and to some extent the property markets in larger cities, it is not surprising to see the government turning more cautious about rolling out further stimulus measures, and instead, turning its attention to structural issues weighing on the economy. However it is the case this time around that policy easing recently has focused on the private sector, encouraging banks to lend to private firms, tax cuts and SOE reforms under the principle of competitive neutrality. Policy stimulus and structural reforms focusing on the far more efficient private sector could generate larger, broader based, and sustainable benefits in terms of economic development.
We therefore believe that the economy can continue to perform well and provide a supportive background for bond and equity markets. So although we do not expect equity prices in particular to continue to gain at the rate they have done so far this year we do expect long term returns to be attractive. Price to earnings ratios in the region of 12 times for both onshore and offshore markets represent an earnings yield of over 8% which will be enhanced by earnings growth over time. A balanced portfolio of Chinese equities and bonds offers investors the prospects of attractive returns without excessive volatility.
HSBCAllChinaBondFund(formerlyknownasHSBCRQFIIChineseFixedIncomeFund)
For the year ending 31 March 2019, the sub-fund fared well and registered positive return in RMB terms. Over the review period, duration positioning to RMB added the most value to performance, as the Chinese government turned more accommodative on its monetary policies. Meanwhile, the
sub-fund ramped up allocation to USD bonds in July 2018, and benefitted from the falling yields when the Fed turned more dovish in October 2018. In addition, credit exposure also boosted returns, with the real estate, investment companies and industrial sectors yielding good value. Other than that, yield carry over the period also contributed to performance.
Over the course of 2018, the two headlines that lingered throughout most part of the year were US-China trade tensions and concerns on slowdown in China. The US and China went through rounds of negotiations and escalations on topics surrounding trade, intellectual property protection and technology transfer. The uncertainties prevailed when the two countries imposed tariffs on each other. As a result, the RMB weakened meaningfully against USD, especially when the US earnings growth came in promising and the Fed stuck to its plan for four rate hikes in 2018. In addition, signals for a market slowdown emerged from multiple aspects, such as falling credit growth, retail sales and investments. What exacerbated the worries was the refinancing pressure, which accumulated throughout the leverage crackdown campaign. In light of these external and internal headwinds, the government shifted gear to monetary easing by rolling out RRR cut and lending facilities. Meanwhile, the regulatory grip on shadow-banking also loosened up. The policy support provided by government led to a sharp fall in yields and boosted bond market returns. However, state-owned enterprises often received more support than the private sector, in which small medium-sized firms’ funding cost continued to mount. As such, credit spreads narrowed for high quality names, but less so for low quality counterparts, indicating issue on credit transmission.
Coming into 2019, the government further focused on channeling funding to private firms instead of providing blanket liquidity boost. Of note, foreign investors continued to pile up holdings in onshore bonds ahead of the long await inclusion of the government and policy bank bonds into the Bloomberg Barclays Global Aggregate Index, one of the most tracked indices globally, starting from April 2019, adding more fuel to the RMB strength. Meanwhile on the currency, pressure on RMB also eased as the Fed turned more dovish in light of US growth slowdown and as the US-China trade talks showed further progression. Looking ahead, we are still constructive on Chinese bonds amidst the favourable backdrop. On one hand, market volatility should prevail surrounding the US-China trade talks and will affect sentiment and growth outlook. Hence, we believe policy will remain broadly accommodative because higher yields do not seem to bode well with the government’s target for stability. As such, we anticipate targeted support down the road to the

2
Investment Adviser’s Report
private sector. Meanwhile, authorities could further stimulate infrastructure investment to counter growth downward pressure, as evident from higher quota for special local government bond this year. This means elevated yield levels do not seem to be in the interest of the policy makers. From a global perspective, the dovish pivot of the US Fed has led us to believe that there is now less pressure for US yields to rise.
This should in turn reduce upward pressure on RMB bond yields given the reduced interest rate differential between the US and China. In the scheme of things, we believe Chinese authorities will likely turn more cautious on their policy, tilting more towards stabilizing than stimulating growth. After the recent rally in yields, we believe this market is presenting a broadly favourable policy environment and attractive yields for bond investors to consider investing for the long term.
HSBCAsiaPacificexJapanEquityVolatilityFocusedFund
For the reported period, the fund delivered positive returns of 0.6% and outperformed the benchmark MSCI AC Asia Pacific ex Japan Net by 4.1%. Asian equities traded lower in 2018 as market sentiment was impacted by global trade tensions, spike in global yields, a resurgent US dollar and weaker macro data from China. In particular, China was one of the key underperformers in 2018 driven by heightened trade tension, softer macro, weaker RMB and domestic headwinds. Nervousness around the trade tensions has dominated investor sentiment, and a risk-off tone has emerged with foreigners turning into net sellers of Asian equities. Korea was another key underperformer led by weakness in the IT sector as memory (eg. DRAM and NAND) faced faster than expected price decline. However, Asian equities rebounded strongly in the first quarter of 2019 driven mostly by the dovish tilt of the Fed, which has sparked a risk-on sentiment among investors. China and Hong Kong markets were amongst the best performing market in the first quarter supported by steady progress on trade talk and stronger domestic policy support. Australia market also ended the quarter on a strong note driven by a more neutral policy stance of RBA and solid economic data.
Asian equities rebounded strongly year-to-date thanks to progress in US-China trade talks and the dovish shift by major central banks. However, we believe those easy gains are behind us as valuations have traded back to its mean levels and investors’ positioning is relatively full. Looking ahead, we need to see how corporate earnings pick up to justify the
valuations. We believe market performance in 2H19 will be in line with earnings trend, and growth stocks will outperform. Potential negative surprises from the trade negotiation definitely remain a key risk to the Asian market. Nonetheless, we think the current macro backdrop is quite different from 2018, where central banks’ policies were tight, and global growth outlook was stark. In contrast, this year, central banks have capitulated to a more accommodative stance. On the growth front, China has launched a string of favourable polices since 3Q 2018 to drive growth. The recent strength in China data helped confirm a growth bottom in this major market of the region. Therefore, the overall growth profile in the region looks much better than 2018. Looking ahead, increasing volatility could become a feature with political and policy uncertainty remaining elevated. We believe bottom-up stock selection remains key to outperform.
HSBCEuroMulti-AssetIncomeFund
The HSBC Euro Multi-Asset Income fund registered a negative total return for 12 months ending 31 March 2019 due to the negative performance of our equity sleeve that more than offset the positive contributions of both our credit and government bond sleeves.
Q2 2018 saw risk assets rebound after the large and sudden correction they experienced early February. The easing of political tensions between the US and North-Korea acted as a strong positive signal to investors. The rebound was short-lived, however, as political tensions created by the US administration around tariffs and uncertainties around the Brexit and Italian elections weighed negatively on investors’ sentiment. In this context, equity and credit markets had erased their year-to-date gains as at the end of June.
The summer of 2018 was relatively quiet, except for emerging markets that saw most of the currencies experience large depreciation versus the dollar, pricing in the effect of higher tariffs. Besides, higher inflation expectations combined to central banks turning more hawkish pushed most real interest rates up. The negative effect of higher rates on bonds was partially offset by the compression of credit spreads, reflecting a globally strong credit quality.
The significant increase of rates, especially in the US with the 10-year rate reaching 3.2% in November, negatively impacted the risk assets. A temporarily inverted US yield curve early December fueled volatility of equity markets while investors entered into a “risk-off” mood. Equity markets experienced a significant correction while sovereign yields, on the back of a flight-to-quality, decreased substantially.

3
Investment Adviser’s Report
The more dovish stance hold by the main central banks towards the end of 2018 and early 2019 helped the main equity markets start 2019 in a bull mode, delivering double digits return in January and bond markets deliver strong returns as well. Overall, the first quarter of 2019 was very positive for bond and equity markets, although volatility remains at higher levels than during the past 2 or 3 years.
Eurozone’s economy significantly slowed down over the past 12 months due to a combination of transitory and cyclical factors. A recession in the Eurozone is unlikely, hence we still find it attractive on the back of compelling equity valuation levels and strong credit quality. Services remain solid and should act on a tailwind to the Eurozone’s growth perspective while the manufacturing sector has a significant potential for rebound. Besides, the European Central Bank remains highly supportive, with clear signals that rates won’t be increased in 2019. In this context, we see more value in riskier assets such as equities and, to a lesser extent, high-yield bonds than in the more defensive sovereign and investment-grade bonds.
HSBCAsiaHighIncomeBondFund
For the year ending 31 March 2019, the fund delivered return in positive territory, but marginally underperformed its benchmark. In relative terms, non-USD currency exposure was the major detractor to performance, as USD strengthened against most Asian currencies on the back of solid US earnings growth and on-track Fed rate hike cycle in 2018. Nevertheless, the currencies have started recouping losses as the greenback pared gains amidst a more dovish Fed since late-2018. On the contrary, credit exposure contributed to relative returns, with overweight in real estate and bank subordinated debt sectors faring the best. At the same time, the duration overweight also added value to performance as global yields grinded lower.
Over the review period, Asian credit market generated decent returns, with investment grade bonds outperforming the high yield bonds. US treasury yields crept higher in early-2018 as the Fed stayed on track for rate hikes and US economy was robust. However, the yields collapsed towards end-2018 when investors showed concern about global growth slowdown and the Fed turned more dovish. Meanwhile, credit spreads widened throughout the year and high yield names came under pressure in light of the contagion in the emerging market. In addition, bonds from deficit countries, such as Indonesia and Philippines, were heavily dumped as their currencies weakened against USD and prompted the respective central banks to tightened liquidity aggressively to curb capital outflows. Furthermore, US-China trade
tensions entered an impasse after the two countries imposed tariffs on each other, leading to greater risk aversion in Asian credit market. Coming into Q1 2019, market sentiment quickly improved as the Fed adopted a more patient approach on future rates changes with plans to end its balance sheet reduction by September this year. In the meantime, optimism on US-China trade talks built up further as officials from both countries released positive signals on progress. Against such backdrop, Asian credit market continued to rally due to a combination of declined US treasury yields and tightened credit spreads. Issuance pipeline for Asian credit picked up, but demand has been able to cope with the new bonds given the attractive yields offered.
Looking ahead, despite the fact that spreads have already had a nice run, our outlook for this asset class remains constructive mainly because of the favorable global macro environment. As the US Federal Reserve turns more dovish and global growth outlook remains mixed, we believe the pressure on US treasury yields to move higher has eased. This is arguably a reverse of what we saw last year when there was broad-based expectation that global yields were going to move higher. The situation is now changed that global central banks are now more dovish in their policies. Amidst the growing expectation of lower yields for longer, investor demand for higher growth and/or higher yielding assets should return. This should be broadly favourable for credit, particularly for Asian credit, given the more attractive valuations relative to other major credit markets and decent growth within the region. Meanwhile, despite the positive progress made so far in the trade negotiation between the US and China, it remains uncertain that how things will pan out. We believe investors will remain sensitive to any related news headlines, potentially leading to volatility in global financial markets. However, market uncertainties and equity market volatility typically lead to greater demand for safe haven assets and drive US treasury yields lower. This should help buffer against any spreads widening as the trade negotiation continues to drag on.
4
Trustee’s Report
HSBCCollectiveInvestmentTrust(“theTrust”)
We hereby confirm that, in our opinion, the Manager of HSBC China Multi-Asset Income Fund, HSBC All China Bond Fund (formerly known as HSBC RQFII Chinese Fixed Income Fund), HSBC Asia Pacific ex Japan Equity Volatility Focused Fund, HSBC Euro Multi-Asset Income Fund and HSBC Asia High Income Bond Fund within the Trust (“the sub-funds”) has, in all material respects, managed the sub-funds in accordance with the provisions of the Trust Deed dated 27 February 2014, as amended, for the year ended 31 March 2019.
) ) For and on behalf of ) HSBC Institutional Trust Services (Asia) Limited, ) Trustee )
31 July 2019
5
Independent Auditor’s Report to the Unitholders ofHSBC Collective Investment Trust
ReportontheAuditofFinancialStatements
Opinion
We have audited the financial statements of HSBC China Multi-Asset Income Fund, HSBC All China Bond Fund (formerly known as HSBC RQFII Chinese Fixed Income Fund), HSBC Asia Pacific ex Japan Equity Volatility Focused Fund, HSBC Euro Multi-Asset Income Fund and HSBC Asia High Income Bond Fund (“the sub-funds”) within HSBC Collective Investment Trust set out on pages 8 to 104, which comprise the statement of assets and liabilities as at 31 March 2019, the statement of comprehensive income, the statement of changes in net assets attributable to unitholders, the cash flow statement and the distribution statement for the year then ended and notes to the financial statements, including a summary of significant accounting policies.
In our opinion, the financial statements give a true and fair view of the financial disposition of the sub-funds as at 31 March 2019 and of its financial transactions and cash flows for the year then ended in accordance with Hong Kong Financial Reporting Standards (“HKFRSs”) issued by the Hong Kong Institute of Certified Public Accountants (“HKICPA”).
Basis for Opinion
We conducted our audit in accordance with Hong Kong Standards on Auditing (“HKSAs”) issued by the HKICPA. Our responsibilities under those standards are further described in the Auditor’s Responsibilities for the Audit of the Financial Statements section of our report. We are independent of the sub-funds in accordance with the HKICPA’s Code of Ethics for Professional Accountants (“the Code”) and we have fulfilled our other ethical responsibilities in accordance with the Code. We believe that the audit evidence we have obtained is sufficient and appropriate to provide a basis for our opinion.
Information Other than the Financial Statements and Auditor’s Report Thereon
The Manager and the Trustee of the sub-funds are responsible for the other information. The other information comprises all the information included in the annual report, other than the financial statements and our auditor’s report thereon.
Our opinion on the financial statements does not cover the other information and we do not express any form of assurance conclusion thereon.
In connection with our audit of the financial statements, our responsibility is to read the other information and, in doing so, consider whether the other information is materially inconsistent with the financial statements or our knowledge obtained in the audit or otherwise appears to be materially misstated. If, based on the work we have performed, we conclude that there is a material misstatement of this other information, we are required to report that fact. We have nothing to report in this regard.
Responsibilities of the Manager and the Trustee of the sub-funds for the Financial Statements
The Manager and the Trustee of the sub-funds are responsible for the preparation of financial statements that give a true and fair view in accordance with HKFRSs issued by the HKICPA and for such internal control as the Manager and the Trustee of the sub-funds determine is necessary to enable the preparation of financial statements that are free from material misstatement, whether due to fraud or error.
In preparing the financial statements, the Manager and the Trustee of the sub-funds are responsible for assessing the sub-funds’ ability to continue as a going concern, disclosing, as applicable, matters related to going concern and using the going concern basis of accounting unless the Manager and the Trustee of the sub-funds either intend to liquidate the sub-funds or to cease operations, or have no realistic alternative but to do so.

6
Independent Auditor’s Report to the Unitholders ofHSBC Collective Investment Trust
Responsibilities of the Manager and the Trustee of the sub-funds for the Financial Statements (continued)
In addition, the Manager and the Trustee of the sub-funds are required to ensure that the financial statements have been properly prepared in accordance with the relevant provisions of the Trust Deed, as amended (“the Trust Deed”), and the relevant disclosure provisions of Appendix E of the Code on Unit Trusts and Mutual Funds (“the SFC Code”) issued by the Hong Kong Securities and Futures Commission.
Auditor’s Responsibilities for the Audit of the Financial Statements
Our objectives are to obtain reasonable assurance about whether the financial statements as a whole are free from material misstatement, whether due to fraud or error, and to issue an auditor’s report that includes our opinion. This report is made solely to you, as a body, and for no other purpose. We do not assume responsibility towards or accept liability to any other person for the contents of this report.
Reasonable assurance is a high level of assurance but is not a guarantee that an audit conducted in accordance with HKSAs will always detect a material misstatement when it exists. Misstatements can arise from fraud or error and are considered material if, individually or in the aggregate, they could reasonably be expected to influence the economic decisions of users taken on the basis of these financial statements. In addition, we are required to assess whether the financial statements of the sub-funds have been properly prepared, in all material respects, in accordance with the relevant provisions of the Trust Deed and the relevant disclosure provisions of Appendix E of the SFC Code.
As part of an audit in accordance with HKSAs, we exercise professional judgement and maintain professional scepticism throughout the audit. We also:
• Identify and assess the risks of material misstatement of the financial statements, whether due to fraud or error, design and perform audit procedures responsive to those risks, and obtain audit evidence that is sufficient and appropriate to provide a basis for our opinion. The risk of not detecting a material misstatement resulting from fraud is higher than for one resulting from error, as fraud may involve collusion, forgery, intentional omissions, misrepresentations or the override of internal control.
• Obtain an understanding of internal control relevant to the audit in order to design audit procedures that are appropriate in the circumstances but not for the purpose of expressing an opinion on the effectiveness of the sub-funds’ internal control.
• Evaluate the appropriateness of accounting policies used and the reasonableness of accounting estimates and related disclosures made by the Manager and the Trustee of the sub-funds.
• Conclude on the appropriateness of the Manager’s and the Trustee’s use of the going concern basis of accounting and, based on the audit evidence obtained, whether a material uncertainty exists related to events or conditions that may cast significant doubt on the sub-funds’ ability to continue as a going concern. If we conclude that a material uncertainty exists, we are required to draw attention in our auditor’s report to the related disclosures in the financial statements or, if such disclosures are inadequate, to modify our opinion. Our conclusions are based on the audit evidence obtained up to the date of our auditor’s report. However, future events or conditions may cause the sub-funds to cease to continue as a going concern.
• Evaluate the overall presentation, structure and content of the financial statements, including the disclosures, and whether the financial statements represent the underlying transactions and events in a manner that achieves fair presentation.
We communicate with the Manager and the Trustee of the sub-funds regarding, among other matters, the planned scope and timing of the audit and significant audit findings, including any significant deficiencies in internal control that we identify during our audit.

7
Independent Auditor’s Report to the Unitholders ofHSBC Collective Investment Trust
ReportonmattersundertherelevantprovisionsoftheTrustDeedandtherelevantdisclosureprovisionsofAppendixEoftheSFCCode
In our opinion, the financial statements have been properly prepared, in all material respects, in accordance with the relevant provisions of the Trust Deed and the relevant disclosure provisions of Appendix E of the SFC Code.
KPMGCertified Public Accountants
8th Floor, Prince’s Building10 Chater RoadCentral, Hong Kong
31 July 2019
8
Statement of Assets and Liabilities
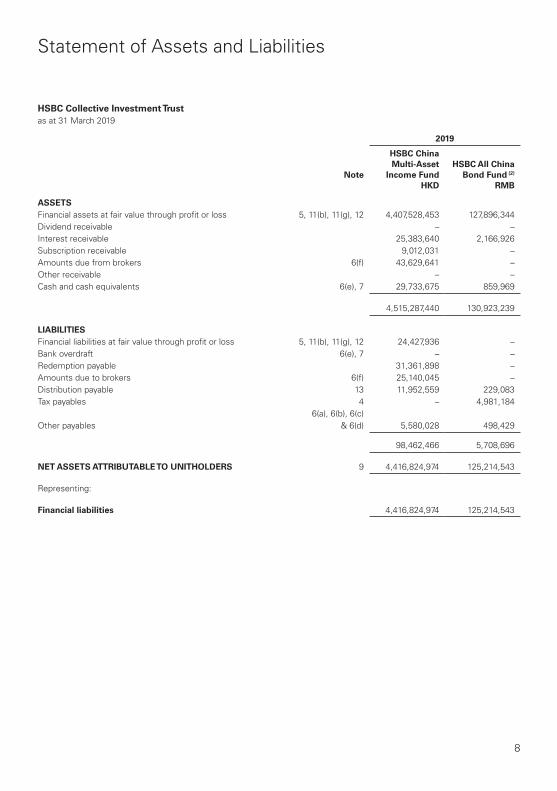
HSBCCollectiveInvestmentTrustas at 31 March 2019
2019
Note
HSBCChinaMulti-Asset
IncomeFundHSBCAllChina
BondFund(2)
HKD RMB
ASSETSFinancial assets at fair value through profit or loss 5, 11(b), 11(g), 12 4,407,528,453 127,896,344Dividend receivable – –Interest receivable 25,383,640 2,166,926Subscription receivable 9,012,031 –Amounts due from brokers 6(f) 43,629,641 –Other receivable – –Cash and cash equivalents 6(e), 7 29,733,675 859,969
4,515,287,440 130,923,239
LIABILITIESFinancial liabilities at fair value through profit or loss 5, 11(b), 11(g), 12 24,427,936 –Bank overdraft 6(e), 7 – –Redemption payable 31,361,898 –Amounts due to brokers 6(f) 25,140,045 –Distribution payable 13 11,952,559 229,083Tax payables 4 – 4,981,184
Other payables6(a), 6(b), 6(c)
& 6(d) 5,580,028 498,429
98,462,466 5,708,696
NETASSETSATTRIBUTABLETOUNITHOLDERS 9 4,416,824,974 125,214,543
Representing:
Financialliabilities 4,416,824,974 125,214,543

9
Statement of Assets and Liabilities
HSBCCollectiveInvestmentTrustas at 31 March 2019
2019
Note
HSBCChinaMulti-Asset
IncomeFundHSBCAllChina
BondFund(2)
HKD RMB
Numberofunitsinissue 8
– Class AC – USD – 20,014– Class AM2 – USD 26,484,630 434,622– Class AM3H – USD – –– Class AC – RMB – 2,237,757– Class AM2 – RMB 20,399,021 3,793,844– Class AM3H – RMB – –– Class AM3O – RMB – –– Class AM2 – HKD 135,046,227 658,347– Class AM3H – HKD – –– Class AM2 – EUR – –– Class AM3O – EUR – –– Class AM2 – AUD – –– Class AM3H – AUD – –– Class AM3O – AUD 1,499,234 –– Class AM2 – CAD – –– Class AM3H – CAD – –– Class AM3O – CAD – –– Class AM3H – NZD – –– Class AM3O – GBP – –– Class AM3O – SGD 14,989 –– Class ZC – USD – 450,000– Class BC – HKD – –– Class BC – RMB – –– Class BC – USD – –– Class BM2 – HKD – –– Class BM2 – RMB – –– Class BM2 – USD – –
Netassetvalueperunit 8
– Class AC – USD – 72.005– Class AM2 – USD 91.926 58.360– Class AM3H – USD – –– Class AC – RMB – 11.506– Class AM2 – RMB 14.999 9.432– Class AM3H – RMB – –– Class AM3O – RMB – –– Class AM2 – HKD 11.852 7.507– Class AM3H – HKD – –– Class AM2 – EUR – –– Class AM3O – EUR – –– Class AM2 – AUD – –– Class AM3H – AUD – –– Class AM3O – AUD 49.897 –– Class AM2 – CAD – –– Class AM3H – CAD – –– Class AM3O – CAD – –– Class AM3H – NZD – –– Class AM3O – GBP – –– Class AM3O – SGD 58.530 –– Class ZC – USD – 71.016– Class BC – HKD – –– Class BC – RMB – –– Class BC – USD – –– Class BM2 – HKD – –– Class BM2 – RMB – –– Class BM2 – USD – –

10
Statement of Assets and Liabilities
HSBCCollectiveInvestmentTrustas at 31 March 2019
2019
Note
HSBCAsiaPacificexJapanEquityVolatility
FocusedFund
HSBCEuroMulti-Asset
IncomeFund
HSBCAsiaHighIncomeBond
Fund(1)
US$ EUR US$
ASSETSFinancial assets at fair value through profit or loss 5, 11(b), 11(g), 12 98,812,543 42,007,555 810,974,318Dividend receivable 551,090 30,313 –Interest receivable 689 50,887 10,378,057Subscription receivable 2,278,165 103,613 19,152,746Amounts due from brokers 6(f) 1,139,361 100,482 23,270,744Other receivable – 292 –Cash and cash equivalents 6(e), 7 317,576 3,749,057 6,616,593
103,099,424 46,042,199 870,392,458
LIABILITIESFinancial liabilities at fair value through profit or loss 5, 11(b), 11(g), 12 – 2,495 283,951Bank overdraft 6(e), 7 130,941 68,915 –Redemption payable 542,670 89,099 7,530,007Amounts due to brokers 6(f) 1,805,053 850,569 27,316,267Distribution payable 13 318,550 171,955 3,760,440Tax payables 4 – – 20,133Other payables 6(a), 6(b), 6(c)
& 6(d) 324,479 98,914 955,124
3,121,693 1,281,947 39,865,922
NETASSETSATTRIBUTABLETOUNITHOLDERS 9 99,977,731 44,760,252 830,526,536
Representing:
Financialliabilities 99,977,731 44,760,252 830,526,536

11
Statement of Assets and Liabilities
HSBCCollectiveInvestmentTrustas at 31 March 2019
2019
Note
HSBCAsiaPacificexJapanEquityVolatility
FocusedFund
HSBCEuroMulti-Asset
IncomeFund
HSBCAsiaHighIncomeBond
Fund(1)
US$ EUR US$
Numberofunitsinissue 8
– Class AC – USD – – 276,374– Class AM2 – USD 6,317,366 – 43,473,562– Class AM3H – USD – 2,058,418 –– Class AC – RMB – – –– Class AM2 – RMB – – 1,627,164– Class AM3H – RMB – 2,213,187 –– Class AM3O – RMB – – 13,944,153– Class AM2 – HKD 23,907,417 – 247,523,023– Class AM3H – HKD – 9,123,947 –– Class AM2 – EUR – 532,223 69,349– Class AM3O – EUR – – 45,310– Class AM2 – AUD – – 1,046,447– Class AM3H – AUD – 877,328 –– Class AM3O – AUD – – 5,154,197– Class AM2 – CAD – – 423,743– Class AM3H – CAD – 286,804 –– Class AM3O – CAD – – 2,414,152– Class AM3H – NZD – 284,369 –– Class AM3O – GBP – – 760,294– Class AM3O – SGD – – 100– Class ZC – USD – – –– Class BC – HKD 110,922 – –– Class BC – RMB 846,306 – –– Class BC – USD 207,593 – –– Class BM2 – HKD 329,993 – –– Class BM2 – RMB 986,397 – –– Class BM2 – USD 124,265 – –
Netassetvalueperunit 8
– Class AC – USD – – 10.245– Class AM2 – USD 9.933 – 9.708– Class AM3H – USD – 8.674 –– Class AC – RMB – – –– Class AM2 – RMB – – 1.416– Class AM3H – RMB – 1.289 –– Class AM3O – RMB – – 1.424– Class AM2 – HKD 1.277 – 1.251– Class AM3H – HKD – 1.102 –– Class AM2 – EUR – 9.616 10.269– Class AM3O – EUR – – 10.707– Class AM2 – AUD – – 7.448– Class AM3H – AUD – 6.105 –– Class AM3O – AUD – – 6.783– Class AM2 – CAD – – 7.382– Class AM3H – CAD – 6.402 –– Class AM3O – CAD – – 7.134– Class AM3H – NZD – 5.941 –– Class AM3O – GBP – – 12.414– Class AM3O – SGD – – 7.053– Class ZC – USD – – –– Class BC – HKD 1.298 – –– Class BC – RMB 1.504 – –– Class BC – USD 10.188 – –– Class BM2 – HKD 1.294 – –– Class BM2 – RMB 1.502 – –– Class BM2 – USD 10.154 – –
(1) The date of commencement for HSBC Asia High Income Bond Fund was 27 February 2017.(2) The HSBC All China Bond Fund is formerly known as “HSBC RQFII Chinese Fixed Income Fund”.

12
Statement of Assets and Liabilities
HSBCCollectiveInvestmentTrustas at 31 March 2019
2018
Note
HSBCChinaMulti-Asset
IncomeFundHSBCAllChina
BondFund(2)
HKD RMB
ASSETSFinancial assets at fair value through profit or loss 5, 11(b), 11(g), 12 6,397,388,010 145,738,040Dividend receivable 1,825,920 –Interest receivable 42,909,291 4,297,257Subscription receivable 159,426,228 –Amounts due from brokers 6(f) 35,952,464 –Other receivable – 62,299Cash and cash equivalents 6(e), 7 81,296,793 353,261
6,718,798,706 150,450,857
LIABILITIESFinancial liabilities at fair value through profit or loss 5, 11(b), 11(g), 12 22,692 –Bank overdraft 6(e), 7 7,538 –Redemption payable 83,970,071 19,848,672Amounts due to brokers 6(f) 85,330,383 –Distribution payable 13 18,885,313 326,281Tax payables 4 – 4,490,516
Other payables6(a), 6(b), 6(c)
& 6(d) 9,159,404 767,353
197,375,401 25,432,822
NETASSETSATTRIBUTABLETOUNITHOLDERS 9 6,521,423,305 125,018,035
Representing:
Financialliabilities 6,521,423,305 125,018,035
13
Statement of Assets and Liabilities
HSBCCollectiveInvestmentTrustas at 31 March 2019
2018
Note
HSBCChinaMulti-Asset
IncomeFundHSBCAllChina
BondFund(2)
HKD RMB
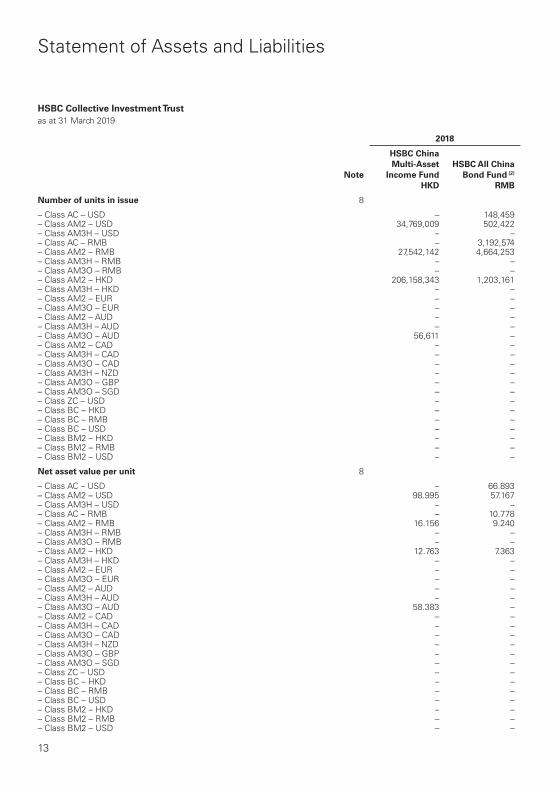
Numberofunitsinissue 8
– Class AC – USD – 148,459– Class AM2 – USD 34,769,009 502,422– Class AM3H – USD – –– Class AC – RMB – 3,192,574– Class AM2 – RMB 27,542,142 4,664,253– Class AM3H – RMB – –– Class AM3O – RMB – –– Class AM2 – HKD 206,158,343 1,203,161– Class AM3H – HKD – –– Class AM2 – EUR – –– Class AM3O – EUR – –– Class AM2 – AUD – –– Class AM3H – AUD – –– Class AM3O – AUD 56,611 –– Class AM2 – CAD – –– Class AM3H – CAD – –– Class AM3O – CAD – –– Class AM3H – NZD – –– Class AM3O – GBP – –– Class AM3O – SGD – –– Class ZC – USD – –– Class BC – HKD – –– Class BC – RMB – –– Class BC – USD – –– Class BM2 – HKD – –– Class BM2 – RMB – –– Class BM2 – USD – –
Netassetvalueperunit 8
– Class AC – USD – 66.893– Class AM2 – USD 98.995 57.167– Class AM3H – USD – –– Class AC – RMB – 10.778– Class AM2 – RMB 16.156 9.240– Class AM3H – RMB – –– Class AM3O – RMB – –– Class AM2 – HKD 12.763 7.363– Class AM3H – HKD – –– Class AM2 – EUR – –– Class AM3O – EUR – –– Class AM2 – AUD – –– Class AM3H – AUD – –– Class AM3O – AUD 58.383 –– Class AM2 – CAD – –– Class AM3H – CAD – –– Class AM3O – CAD – –– Class AM3H – NZD – –– Class AM3O – GBP – –– Class AM3O – SGD – –– Class ZC – USD – –– Class BC – HKD – –– Class BC – RMB – –– Class BC – USD – –– Class BM2 – HKD – –– Class BM2 – RMB – –– Class BM2 – USD – –

14
Statement of Assets and Liabilities
HSBCCollectiveInvestmentTrustas at 31 March 2019
2018
Note
HSBCAsiaPacificexJapanEquityVolatility
FocusedFund
HSBCEuroMulti-Asset
IncomeFund
HSBCAsiaHighIncomeBond
Fund(1)
US$ EUR US$
ASSETSFinancial assets at fair value through profit or loss 5, 11(b), 11(g), 12 126,029,736 65,273,389 1,272,964,281Dividend receivable 293,143 37,917 –Interest receivable 67 60,352 17,015,889Subscription receivable 5,842,470 480,073 4,422,888Amounts due from brokers 6(f) 774,069 3,515,435 48,101,883Other receivable – – –Cash and cash equivalents 6(e), 7 903,296 788,564 24,131,700
133,842,781 70,155,730 1,366,636,641
LIABILITIESFinancial liabilities at fair value through profit or loss 5, 11(b), 11(g), 12 – 27,262 438,964Bank overdraft 6(e), 7 5,585 – 5,207Redemption payable 507,138 1,393,776 25,038,786Amounts due to brokers 6(f) 4,151,511 1,590,359 34,674,117Distribution payable 13 390,002 261,195 4,740,050Tax payables 4 – – –Other payables 6(a), 6(b), 6(c)
& 6(d) 287,957 128,380 1,568,208
5,342,193 3,400,972 66,465,332
NETASSETSATTRIBUTABLETOUNITHOLDERS 9 128,500,588 66,754,758 1,300,171,309
Representing:
Financialliabilities 128,500,588 66,754,758 1,300,171,309
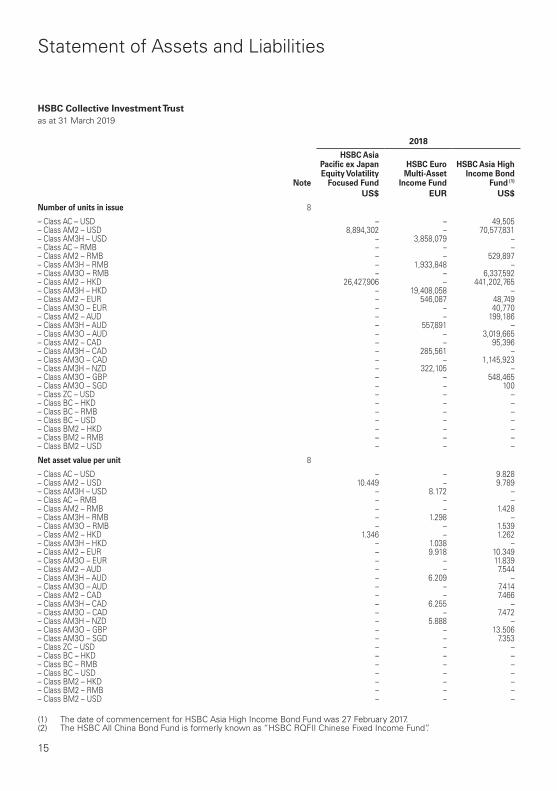
15
Statement of Assets and Liabilities
HSBCCollectiveInvestmentTrustas at 31 March 2019
2018
Note
HSBCAsiaPacificexJapanEquityVolatility
FocusedFund
HSBCEuroMulti-Asset
IncomeFund
HSBCAsiaHighIncomeBond
Fund(1)
US$ EUR US$
Numberofunitsinissue 8
– Class AC – USD – – 49,505– Class AM2 – USD 8,894,302 – 70,577,831– Class AM3H – USD – 3,858,079 –– Class AC – RMB – – –– Class AM2 – RMB – – 529,897– Class AM3H – RMB – 1,933,848 –– Class AM3O – RMB – – 6,337,592– Class AM2 – HKD 26,427,906 – 441,202,765– Class AM3H – HKD – 19,408,058 –– Class AM2 – EUR – 546,087 48,749– Class AM3O – EUR – – 40,770– Class AM2 – AUD – – 199,186– Class AM3H – AUD – 557,891 –– Class AM3O – AUD – – 3,019,665– Class AM2 – CAD – – 95,396– Class AM3H – CAD – 285,561 –– Class AM3O – CAD – – 1,145,923– Class AM3H – NZD – 322,105 –– Class AM3O – GBP – – 548,465– Class AM3O – SGD – – 100– Class ZC – USD – – –– Class BC – HKD – – –– Class BC – RMB – – –– Class BC – USD – – –– Class BM2 – HKD – – –– Class BM2 – RMB – – –– Class BM2 – USD – – –
Netassetvalueperunit 8
– Class AC – USD – – 9.828– Class AM2 – USD 10.449 – 9.789– Class AM3H – USD – 8.172 –– Class AC – RMB – – –– Class AM2 – RMB – – 1.428– Class AM3H – RMB – 1.298 –– Class AM3O – RMB – – 1.539– Class AM2 – HKD 1.346 – 1.262– Class AM3H – HKD – 1.038 –– Class AM2 – EUR – 9.918 10.349– Class AM3O – EUR – – 11.839– Class AM2 – AUD – – 7.544– Class AM3H – AUD – 6.209 –– Class AM3O – AUD – – 7.414– Class AM2 – CAD – – 7.466– Class AM3H – CAD – 6.255 –– Class AM3O – CAD – – 7.472– Class AM3H – NZD – 5.888 –– Class AM3O – GBP – – 13.506– Class AM3O – SGD – – 7.353– Class ZC – USD – – –– Class BC – HKD – – –– Class BC – RMB – – –– Class BC – USD – – –– Class BM2 – HKD – – –– Class BM2 – RMB – – –– Class BM2 – USD – – –
(1) The date of commencement for HSBC Asia High Income Bond Fund was 27 February 2017.(2) The HSBC All China Bond Fund is formerly known as “HSBC RQFII Chinese Fixed Income Fund”.

16
Statement of Assets and Liabilities
HSBCCollectiveInvestmentTrustas at 31 March 2019
Approved by the Trustee and the Manager on 31 July 2019
) ) For and on behalf of ) HSBC Institutional Trust Services (Asia) Limited, ) Trustee
) ) For and on behalf of ) HSBC Investment Funds (Hong Kong) Limited, ) Manager
The notes on pages 46 to 104 form part of these financial statements.

17
Statement of Comprehensive Income
HSBCCollectiveInvestmentTrustfor the year ended 31 March 2019
2019
Note
HSBCChinaMulti-Asset
IncomeFundHSBCAllChina
BondFund(2)
HKD RMB
Interest income from cash and cash equivalents 6(e) 1,022,739 14,978Interest income from financial assets at fair value through profit or loss 114,497,359 6,341,538Dividend income 82,681,873 –Net (losses)/gains from financial assets at fair value through profit or loss 3 (555,214,793) 4,621,006Net foreign exchange (loss)/gain (28,346,392) 157,421Other income 6(b) 2,244 275,215
Totalrevenue (385,356,970) 11,410,158
Management fees 6(a) 75,999,084 1,189,568Transaction costs 6(f) 11,794,348 11,364Trustee’s fees 6(b) 4,573,317 870,068Auditor’s remuneration 79,680 73,546Registrar's fees 6(c) – –Transfer agency fee 6(d) 502,608 295,012Establishment cost – –Professional fees 155,749 136,137Safe custody fees, bank charges and miscellaneous expenses 6(b) 1,391,139 204,364
Totaloperatingexpenses 94,495,925 2,780,059
Net(loss)/profitfromoperationsbeforetaxation (479,852,895) 8,630,099
Taxation 4 (6,165,143) (120,694)
Net(loss)/profitfromoperationsbeforedistributions (486,018,038) 8,509,405
Distributions to unitholders 13 (192,706,814) (3,399,558)
(Decrease)/increaseinnetassetsattributabletounitholdersandtotalcomprehensiveincomefortheyear/period (678,724,852) 5,109,847
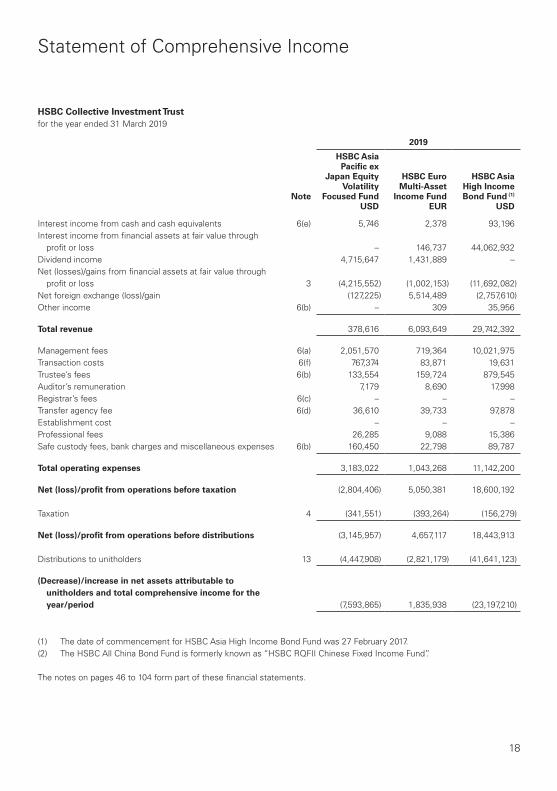
18
Statement of Comprehensive Income
HSBCCollectiveInvestmentTrustfor the year ended 31 March 2019
2019
Note
HSBCAsiaPacificex
JapanEquityVolatility
FocusedFund
HSBCEuroMulti-Asset
IncomeFund
HSBCAsiaHighIncomeBondFund(1)
USD EUR USD
Interest income from cash and cash equivalents 6(e) 5,746 2,378 93,196Interest income from financial assets at fair value through
profit or loss – 146,737 44,062,932Dividend income 4,715,647 1,431,889 –Net (losses)/gains from financial assets at fair value through
profit or loss 3 (4,215,552) (1,002,153) (11,692,082)Net foreign exchange (loss)/gain (127,225) 5,514,489 (2,757,610)Other income 6(b) – 309 35,956
Totalrevenue 378,616 6,093,649 29,742,392
Management fees 6(a) 2,051,570 719,364 10,021,975Transaction costs 6(f) 767,374 83,871 19,631Trustee’s fees 6(b) 133,554 159,724 879,545Auditor’s remuneration 7,179 8,690 17,998Registrar’s fees 6(c) – – –Transfer agency fee 6(d) 36,610 39,733 97,878Establishment cost – – –Professional fees 26,285 9,088 15,386Safe custody fees, bank charges and miscellaneous expenses 6(b) 160,450 22,798 89,787
Totaloperatingexpenses 3,183,022 1,043,268 11,142,200
Net(loss)/profitfromoperationsbeforetaxation (2,804,406) 5,050,381 18,600,192
Taxation 4 (341,551) (393,264) (156,279)
Net(loss)/profitfromoperationsbeforedistributions (3,145,957) 4,657,117 18,443,913
Distributions to unitholders 13 (4,447,908) (2,821,179) (41,641,123)
(Decrease)/increaseinnetassetsattributabletounitholdersandtotalcomprehensiveincomefortheyear/period (7,593,865) 1,835,938 (23,197,210)
(1) The date of commencement for HSBC Asia High Income Bond Fund was 27 February 2017.(2) The HSBC All China Bond Fund is formerly known as “HSBC RQFII Chinese Fixed Income Fund”.
The notes on pages 46 to 104 form part of these financial statements.

19
Statement of Comprehensive Income
HSBCCollectiveInvestmentTrustfor the year ended 31 March 2019
2018
Note
HSBCChinaMulti-Asset
IncomeFundHSBCAllChina
BondFund(2)
HKD RMB
Interest income from cash and cash equivalents 6(e) 775,840 21,232Interest income from financial assets at fair value through profit or loss 91,714,590 7,362,105Dividend income 41,062,758 –Net gains/(losses) from financial assets at fair value through profit or loss 3 795,741,894 (3,618,415)Net foreign exchange (loss)/gain (25,104,626) 83,379Other income 6(b) 5,146,758 90,257
Totalrevenue 909,337,214 3,938,558
Management fees 6(a) 58,082,631 1,731,277Transaction costs 6(f) 10,197,696 2,834Trustee’s fees 6(b) 3,820,897 969,269Auditor’s remuneration (96,101) 4,078Registrar’s fees 6(c) 160,572 9,514Transfer agency fee 6(d) 844,127 121,648Establishment cost – –Professional fees 138,765 189,667Safe custody fees, bank charges and miscellaneous expenses 6(b) 866,985 632,273
Totaloperatingexpenses 74,015,572 3,660,560
Netprofitfromoperationsbeforetaxation 835,321,642 277,998
Taxation 4 (2,642,113) (1,721,479)
Netprofit/(loss)fromoperationsbeforedistributions 832,679,529 (1,443,481)
Distributions to unitholders 13 (148,275,174) (5,161,200)
Increase/(decrease)innetassetsattributabletounitholdersandtotalcomprehensiveincomefortheyear/period 684,404,355 (6,604,681)

20
Statement of Comprehensive Income
HSBCCollectiveInvestmentTrustfor the year ended 31 March 2019
2018
Note
HSBCAsiaPacificex
JapanEquityVolatility
FocusedFund
HSBCEuroMulti-Asset
IncomeFund
HSBCAsiaHighIncomeBondFund(1)
USD EUR USD
Interest income from cash and cash equivalents 6(e) 1,126 991 43,061Interest income from financial assets at fair value through
profit or loss – 162,137 77,377,914Dividend income 2,915,025 921,540 1,223,918Net gains/(losses) from financial assets at fair value through
profit or loss 3 6,482,715 (844,549) (29,543,972)Net foreign exchange (loss)/gain (101,770) (7,440,468) 48,411Other income 6(b) 92,713 70,147 377,514
Totalrevenue 9,389,809 (7,130,202) 49,526,846
Management fees 6(a) 1,516,604 1,137,577 18,881,046Transaction costs 6(f) 395,771 235,528 29,944Trustee’s fees 6(b) 115,604 202,415 1,510,431Auditor’s remuneration 13,031 4,923 12,698Registrar’s fees 6(c) 13,516 13,418 50,336Transfer agency fee 6(d) 28,021 32,027 122,170Establishment cost – – 111,868Professional fees 29,518 34,670 68,199Safe custody fees, bank charges and miscellaneous expenses 6(b) 114,894 136,857 198,189
Totaloperatingexpenses 2,226,959 1,797,415 20,984,881
Netprofit/(loss)fromoperationsbeforetaxation 7,162,850 (8,927,617) 28,541,965
Taxation 4 (224,314) (243,434) (516,539)
Netprofit/(loss)fromoperationsbeforedistributions 6,938,536 (9,171,051) 28,025,426
Distributions to unitholders 13 (3,262,569) (3,320,130) (68,462,510)
Increase/(decrease)innetassetsattributabletounitholdersandtotalcomprehensiveincomefortheyear/period 3,675,967 (12,491,181) (40,437,084)
(1) The date of commencement for HSBC Asia High Income Bond Fund was 27 February 2017.(2) The HSBC All China Bond Fund is formerly known as “HSBC RQFII Chinese Fixed Income Fund”.
The notes on pages 46 to 104 form part of these financial statements.
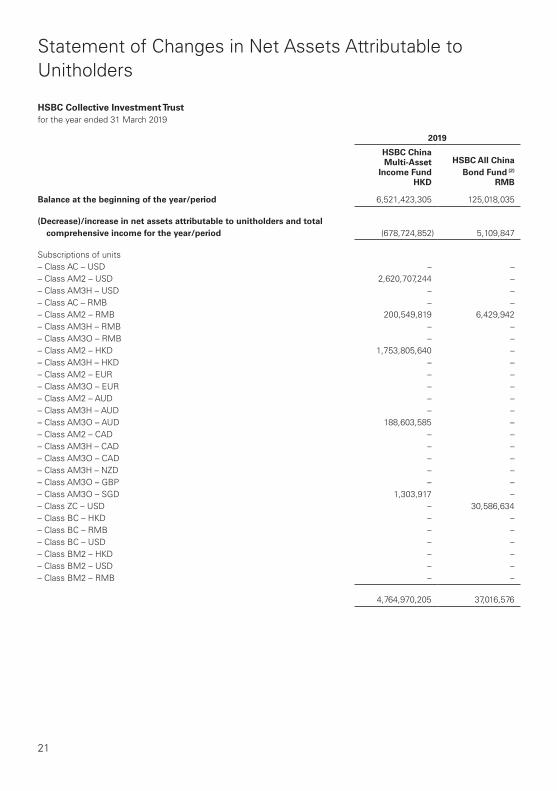
21
Statement of Changes in Net Assets Attributable to Unitholders
HSBCCollectiveInvestmentTrustfor the year ended 31 March 2019
2019 HSBCChinaMulti-Asset
IncomeFundHSBCAllChina
BondFund(2)
HKD RMB
Balanceatthebeginningoftheyear/period 6,521,423,305 125,018,035
(Decrease)/increaseinnetassetsattributabletounitholdersandtotalcomprehensiveincomefortheyear/period (678,724,852) 5,109,847
Subscriptions of units– Class AC – USD – –– Class AM2 – USD 2,620,707,244 –– Class AM3H – USD – –– Class AC – RMB – –– Class AM2 – RMB 200,549,819 6,429,942– Class AM3H – RMB – –– Class AM3O – RMB – –– Class AM2 – HKD 1,753,805,640 –– Class AM3H – HKD – –– Class AM2 – EUR – –– Class AM3O – EUR – –– Class AM2 – AUD – –– Class AM3H – AUD – –– Class AM3O – AUD 188,603,585 –– Class AM2 – CAD – –– Class AM3H – CAD – –– Class AM3O – CAD – –– Class AM3H – NZD – –– Class AM3O – GBP – –– Class AM3O – SGD 1,303,917 –– Class ZC – USD – 30,586,634– Class BC – HKD – –– Class BC – RMB – –– Class BC – USD – –– Class BM2 – HKD – –– Class BM2 – USD – –– Class BM2 – RMB – –
4,764,970,205 37,016,576

22
Statement of Changes in Net Assets Attributable to Unitholders
HSBCCollectiveInvestmentTrustfor the year ended 31 March 2019
2019 HSBCChinaMulti-Asset
IncomeFundHSBCAllChina
BondFund(2)
HKD RMB
Redemptions of units– Class AC – USD – (9,020,903)– Class AM2 – USD (3,261,488,572) (3,934,766)– Class AM3H – USD – –– Class AC – RMB – (10,409,481)– Class AM2 – RMB (299,580,432) (14,493,272)– Class AM3H – RMB – –– Class AM3O – RMB – –– Class AC – HKD – –– Class AM2 – HKD (2,524,469,905) (4,071,493)– Class AM3H – HKD – –– Class AM2 – EUR – –– Class AM3O – EUR – –– Class AM2 – AUD – –– Class AM3H – AUD – –– Class AM3O – AUD (104,870,620) –– Class AM2 – CAD – –– Class AM3H – CAD – –– Class AM3O – CAD – –– Class AM3H – NZD – –– Class AM3O – GBP – –– Class AM3O – SGD (434,155) –
(6,190,843,684) (41,929,915)
Totaltransactionswithunitholders (1,425,873,479) (4,913,339)
Balanceattheendoftheyear/period 4,416,824,974 125,214,543

23
Statement of Changes in Net Assets Attributable to Unitholders
HSBCCollectiveInvestmentTrustfor the year ended 31 March 2019
2019 HSBCAsia
PacificexJapanEquity
VolatilityFocusedFund
HSBCEuroMulti-Asset
IncomeFund
HSBCAsiaHighIncomeBondFund(1)
USD EUR USD
Balanceatthebeginningoftheyear/period 128,500,588 66,754,758 1,300,171,309
(Decrease)/increaseinnetassetsattributabletounitholdersandtotalcomprehensiveincomefortheyear/period (7,593,865) 1,835,938 (23,197,210)
Subscriptions of units– Class AC – USD – – 3,581,342– Class AM2 – USD 62,919,765 – 208,702,410– Class AM3H – USD – 25,485,988 –– Class AC – RMB – – –– Class AM2 – RMB – – 1,869,719– Class AM3H – RMB – 3,613,063 –– Class AM3O – RMB – – 18,516,232– Class AM2 – HKD 43,592,318 – 164,685,120– Class AM3H – HKD – 11,700,056 –– Class AM2 – EUR – 3,432,650 454,131– Class AM3O – EUR – – 3,154,968– Class AM2 – AUD – – 10,265,713– Class AM3H – AUD – 8,503,159 –– Class AM3O – AUD – – 54,911,466– Class AM2 – CAD – – 3,254,961– Class AM3H – CAD – 1,583,264 –– Class AM3O – CAD – – 21,536,367– Class AM3H – NZD – 8,777,641 –– Class AM3O – GBP – – 9,144,057– Class AM3O – SGD – – –– Class ZC – USD – – –– Class BC – HKD 143,466 – –– Class BC – RMB 1,270,368 – –– Class BC – USD 2,111,590 – –– Class BM2 – HKD 427,297 – –– Class BM2 – USD 1,265,405 – –– Class BM2 – RMB 1,480,230 – –
113,210,439 63,095,821 500,076,486

24
Statement of Changes in Net Assets Attributable to Unitholders
HSBCCollectiveInvestmentTrustfor the year ended 31 March 2019
2019 HSBCAsia
PacificexJapanEquity
VolatilityFocusedFund
HSBCEuroMulti-Asset
IncomeFund
HSBCAsiaHighIncomeBondFund(1)
USD EUR USD
Redemptions of units– Class AC – USD – – (1,307,957)– Class AM2 – USD (87,840,101) – (466,636,595)– Class AM3H – USD – (40,638,293) –– Class AC – RMB – – –– Class AM2 – RMB – – (350,093)– Class AM3H – RMB – (3,227,762) –– Class AM3O – RMB – – (8,001,447)– Class AC – HKD – – –– Class AM2 – HKD (46,299,330) – (402,266,763)– Class AM3H – HKD – (22,781,003) –– Class AM2 – EUR – (3,468,165) (250,984)– Class AM3O – EUR – – (3,010,802)– Class AM2 – AUD – – (4,184,411)– Class AM3H – AUD – (6,540,335) –– Class AM3O – AUD – – (40,294,887)– Class AM2 – CAD – – (895,029)– Class AM3H – CAD – (1,590,220) –– Class AM3O – CAD – – (12,643,104)– Class AM3H – NZD – (8,680,487) –– Class AM3O – GBP – – (6,681,977)– Class AM3O – SGD – – –
(134,139,431) (86,926,265) (946,524,049)
Totaltransactionswithunitholders (20,928,992) (23,830,444) (446,447,563)
Balanceattheendoftheyear/period 99,977,731 44,760,252 830,526,536
(1) The date of commencement for HSBC Asia High Income Bond Fund was 27 February 2017.(2) The HSBC All China Bond Fund is formerly known as “HSBC RQFII Chinese Fixed Income Fund”.
The notes on pages 46 to 104 form part of these financial statements.

25
Statement of Changes in Net Assets Attributable to Unitholders
HSBCCollectiveInvestmentTrustfor the year ended 31 March 2019
2018 HSBCChinaMulti-Asset
IncomeFundHSBCAllChina
BondFund(2)
HKD RMB
Balanceatthebeginningoftheyear/period 3,083,696,483 159,800,438
Increase/(decrease)innetassetsattributabletounitholdersandtotalcomprehensiveincomefortheyear/period 684,404,355 (6,604,681)
Subscriptions of units– Class AC – USD – –– Class AM2 – USD 5,293,109,148 –– Class AM3H – USD – –– Class AC – RMB – 31,275,246– Class AM2 – RMB 392,665,401 10,808,690– Class AM3H – RMB – –– Class AM3O – RMB – –– Class AM2 – HKD 4,081,787,352 –– Class AM3H – HKD – –– Class AM2 – EUR – –– Class AM3O – EUR – –– Class AM2 – AUD – –– Class AM3H – AUD – –– Class AM3O – AUD 3,406,044 –– Class AM2 – CAD – –– Class AM3H – CAD – –– Class AM3O – CAD – –– Class AM3H – NZD – –– Class AM3O – GBP – –– Class AM3O – SGD – –– Class ZC – USD – –– Class BC – HKD – –– Class BC – RMB – –– Class BC – USD – –– Class BM2 – HKD – –– Class BM2 – USD – –– Class BM2 – RMB – –
9,770,967,945 42,083,936
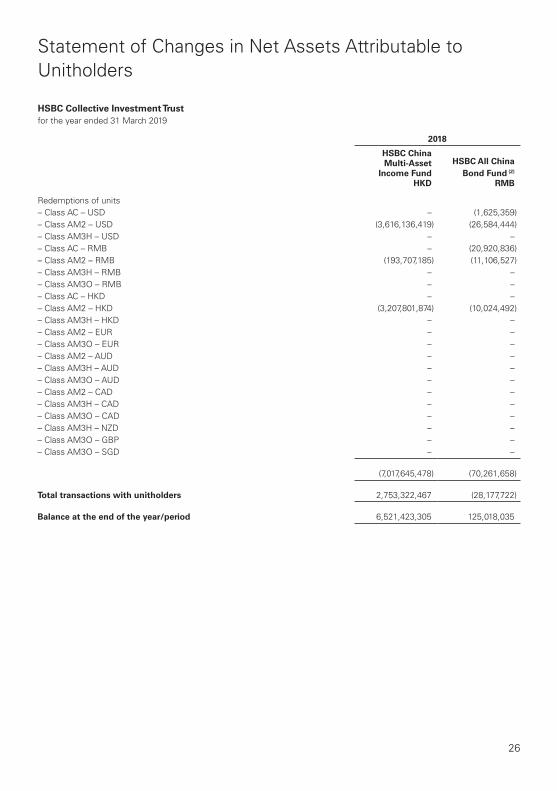
26
Statement of Changes in Net Assets Attributable to Unitholders
HSBCCollectiveInvestmentTrustfor the year ended 31 March 2019
2018 HSBCChinaMulti-Asset
IncomeFundHSBCAllChina
BondFund(2)
HKD RMB
Redemptions of units– Class AC – USD – (1,625,359)– Class AM2 – USD (3,616,136,419) (26,584,444)– Class AM3H – USD – –– Class AC – RMB – (20,920,836)– Class AM2 – RMB (193,707,185) (11,106,527)– Class AM3H – RMB – –– Class AM3O – RMB – –– Class AC – HKD – –– Class AM2 – HKD (3,207,801,874) (10,024,492)– Class AM3H – HKD – –– Class AM2 – EUR – –– Class AM3O – EUR – –– Class AM2 – AUD – –– Class AM3H – AUD – –– Class AM3O – AUD – –– Class AM2 – CAD – –– Class AM3H – CAD – –– Class AM3O – CAD – –– Class AM3H – NZD – –– Class AM3O – GBP – –– Class AM3O – SGD – –
(7,017,645,478) (70,261,658)
Totaltransactionswithunitholders 2,753,322,467 (28,177,722)
Balanceattheendoftheyear/period 6,521,423,305 125,018,035

27
Statement of Changes in Net Assets Attributable to Unitholders
HSBCCollectiveInvestmentTrustfor the year ended 31 March 2019
2018 HSBCAsia
PacificexJapanEquity
VolatilityFocusedFund
HSBCEuroMulti-Asset
IncomeFund
HSBCAsiaHighIncomeBondFund(1)
USD EUR USD
Balanceatthebeginningoftheyear/period 83,760,093 27,441,444 –
(Decrease)/increaseinnetassetsattributabletounitholdersandtotalcomprehensiveincomefortheyear/period 3,675,967 (12,491,181) (40,437,084)
Subscriptions of units– Class AC – USD – – 495,050– Class AM2 – USD 137,772,759 – 1,817,295,731– Class AM3H – USD – 89,098,475 –– Class AC – RMB – – –– Class AM2 – RMB – – 5,111,146– Class AM3H – RMB – 3,522,578 –– Class AM3O – RMB – – 11,973,119– Class AM2 – HKD 69,792,046 – 1,379,890,932– Class AM3H – HKD – 75,894,966 –– Class AM2 – EUR – 7,028,979 929,563– Class AM3O – EUR – – 567,221– Class AM2 – AUD – – 5,978,404– Class AM3H – AUD – 9,905,783 –– Class AM3O – AUD – – 44,001,415– Class AM2 – CAD – – 2,327,260– Class AM3H – CAD – 9,954,384 –– Class AM3O – CAD – – 10,441,551– Class AM3H – NZD – 7,631,895 –– Class AM3O – GBP – – 11,339,912– Class AM3O – SGD – – 738– Class ZC – USD – – –– Class BC – HKD – – –– Class BC – RMB – – –– Class BC – USD – – –– Class BM2 – HKD – – –– Class BM2 – USD – – –– Class BM2 – RMB – – –
207,564,805 203,037,060 3,290,352,042

28
Statement of Changes in Net Assets Attributable to Unitholders
HSBCCollectiveInvestmentTrustfor the year ended 31 March 2019
2018 HSBCAsia
PacificexJapanEquity
VolatilityFocusedFund
HSBCEuroMulti-Asset
IncomeFund
HSBCAsiaHighIncomeBondFund(1)
USD EUR USD
Redemptions of units– Class AC – USD – – –– Class AM2 – USD (100,526,746) – (1,103,886,826)– Class AM3H – USD – (62,467,669) –– Class AC – RMB – – –– Class AM2 – RMB – – (4,333,911)– Class AM3H – RMB – (1,712,622) –– Class AM3O – RMB – – (2,236,180)– Class AC – HKD – – –– Class AM2 – HKD (65,973,531) – (805,835,995)– Class AM3H – HKD – (61,029,378) –– Class AM2 – EUR – (3,207,045) (411,896)– Class AM3O – EUR – – (82,877)– Class AM2 – AUD – – (4,446,953)– Class AM3H – AUD – (7,502,352) –– Class AM3O – AUD – – (21,286,065)– Class AM2 – CAD – – (1,598,508)– Class AM3H – CAD – (9,586,142) –– Class AM3O – CAD – – (1,589,181)– Class AM3H – NZD – (5,727,357) –– Class AM3O – GBP – – (4,035,257)– Class AM3O – SGD – – –
(166,500,277) (151,232,565) (1,949,743,649)
Totaltransactionswithunitholders 41,064,528 51,804,495 1,340,608,393
Balanceattheendoftheyear/period 128,500,588 66,754,758 1,300,171,309
(1) The date of commencement for HSBC Asia High Income Bond Fund was 27 February 2017.(2) The HSBC All China Bond Fund is formerly known as “HSBC RQFII Chinese Fixed Income Fund”.
The notes on pages 46 to 104 form part of these financial statements.

29
Cash Flow Statement
HSBCCollectiveInvestmentTrustfor the year ended 31 March 2019
2019
Note
HSBCChinaMulti-Asset
IncomeFundHSBCAllChina
BondFund(2)
HKD RMB
OperatingactivitiesInterest received 133,045,749 8,486,847Dividends received 84,507,793 –Management fees paid (78,008,580) (1,233,771)Trustee’s fees paid (4,702,958) (904,111)Payments for purchase of investments (4,773,655,031) (93,605,707)Proceeds from sale of investments 6,150,826,534 116,068,409Tax (paid)/recovered (6,165,143) 369,974Other operating expenses paid (29,696,921) (416,166)
Cashgeneratedfromoperatingactivities 1,476,151,443 28,765,475
FinancingactivitiesProceeds from issue of units 4,915,384,402 37,016,576Payments for redemption of units (6,243,451,857) (61,778,587)Distributions paid (199,639,568) (3,496,756)
Cashusedinfinancingactivities (1,527,707,023) (28,258,767)
Net(decrease)/increaseincashandcashequivalents (51,555,580) 506,708
Cashandcashequivalentsatthebeginningoftheyear/period 81,289,255 353,261
Cashandcashequivalentsattheendoftheyear/period 7 29,733,675 859,969

30
Cash Flow Statement
HSBCCollectiveInvestmentTrustfor the year ended 31 March 2019
2019
Note
HSBCAsiaPacificex
JapanEquityVolatility
FocusedFund
HSBCEuroMulti-Asset
IncomeFund
HSBCAsiaHighIncomeBondFund(1)
USD EUR USD
OperatingactivitiesInterest received 5,124 158,580 50,793,960Dividends received 4,457,700 1,439,493 –Management fees paid (2,072,268) (751,857) (10,567,722)Trustee’s fees paid (130,181) (167,426) (926,183)Payments for purchase of investments (169,063,570) (37,255,132) (1,530,697,703)Proceeds from sale of investments 189,353,461 62,304,940 1,998,532,826Tax paid (341,551) (393,264) (136,146)Other operating expenses paid (1,071,276) 5,225,324 (3,201,999)
Cashgeneratedfromoperatingactivities 21,137,439 30,560,658 503,797,033
FinancingactivitiesProceeds from issue of units 116,774,744 63,472,281 485,346,628Payments for redemption of units (134,103,899) (88,230,942) (964,032,828)Distributions paid (4,519,360) (2,910,419) (42,620,733)
Cashusedinfinancingactivities (21,848,515) (27,669,080) (521,306,933)
Net(decrease)/increaseincashandcashequivalents (711,076) 2,891,578 (17,509,900)
Cashandcashequivalentsatthebeginningoftheyear/period 897,711 788,564 24,126,493
Cashandcashequivalentsattheendoftheyear/period 7 186,635 3,680,142 6,616,593
(1) The date of commencement for HSBC Asia High Income Bond Fund was 27 February 2017.(2) The HSBC All China Bond Fund is formerly known as “HSBC RQFII Chinese Fixed Income Fund”.
The notes on pages 46 to 104 form part of these financial statements.

31
Cash Flow Statement
HSBCCollectiveInvestmentTrustfor the year ended 31 March 2019
2018
Note
HSBCChinaMulti-Asset
IncomeFundHSBCAllChina
BondFund(2)
HKD RMB
OperatingactivitiesInterest received 69,685,492 7,379,799Dividends received 39,244,758 –Management fees paid (54,929,957) (1,760,578)Trustee’s fees paid (3,725,873) (943,742)Payments for purchase of investments (7,957,590,521) (27,960,740)Proceeds from sale of investments 5,482,106,428 31,958,547Tax paid (2,642,113) (107,463)Other operating expenses paid (33,377,379) (374,622)
Cash(usedin)/generatedfromoperatingactivities (2,461,229,165) 8,191,201
FinancingactivitiesProceeds from issue of units 9,617,299,185 42,083,936Payments for redemption of units (6,968,640,721) (52,024,014)Distributions paid (139,126,599) (5,332,065)
Cashgeneratedfrom/(usedin)financingactivities 2,509,531,865 (15,272,143)
Netincrease/(decrease)incashandcashequivalents 48,302,700 (7,080,942)
Cashandcashequivalentsatthebeginningoftheyear/period 32,986,555 7,434,203
Cashandcashequivalentsattheendoftheyear/period 7 81,289,255 353,261

32
Cash Flow Statement
HSBCCollectiveInvestmentTrustfor the year ended 31 March 2019
2018
Note
HSBCAsiaPacificex
JapanEquityVolatility
FocusedFund
HSBCEuroMulti-Asset
IncomeFund
HSBCAsiaHighIncomeBondFund(1)
USD EUR USD
OperatingactivitiesInterest received 1,066 112,006 60,405,086Dividends received 3,009,404 914,270 1,223,918Management fees paid (1,471,027) (1,093,934) (17,606,086)Trustee’s fees paid (116,060) (204,825) (1,405,756)Payments for purchase of investments (160,071,524) (147,337,459) (4,010,517,696)Proceeds from sale of investments 115,455,879 103,223,847 2,694,584,125Tax paid (224,314) (243,434) (516,539)Other operating expenses paid (708,957) (7,739,205) 457,610
Cashusedinoperatingactivities (44,125,533) (52,368,734) (1,273,375,338)
FinancingactivitiesProceeds from issue of units 216,023,691 204,361,605 3,285,929,154Payments for redemption of units (168,227,917) (150,050,627) (1,924,704,863)Distributions paid (3,093,156) (3,139,267) (63,722,460)
Cashgeneratedfromfinancingactivities 44,702,618 51,171,711 1,297,501,831
Netincrease/(decrease)incashandcashequivalents 577,085 (1,197,023) 24,126,493
Cashandcashequivalentsatthebeginningoftheyear/period 320,626 1,985,587 –
Cashandcashequivalentsattheendoftheyear/period 7 897,711 788,564 24,126,493
(1) The date of commencement for HSBC Asia High Income Bond Fund was 27 February 2017.(2) The HSBC All China Bond Fund is formerly known as “HSBC RQFII Chinese Fixed Income Fund”.
The notes on pages 46 to 104 form part of these financial statements.

33
Distribution Statement
HSBCCollectiveInvestmentTrustfor the year ended 31 March 2019
2019
Note
HSBCChinaMulti-Asset
IncomeFundHSBCAllChina
BondFund(2)
HKD RMB
Amountavailablefordistributionatthebeginningoftheyear/period 6,521,423,305 125,018,035
Net paid or payable on issue and redemption of units (1,425,873,479) (4,913,339)(Loss)/profit before distributions after taxation (486,018,038) 8,509,405
Amount available for distributions to unitholders* 4,609,531,788 128,614,101Distributions to unitholders 13 (192,706,814) (3,399,558)
Amountavailablefordistributionattheendoftheyear/period 4,416,824,974 125,214,543
2019
Note
HSBCAsiaPacificex
JapanEquityVolatility
FocusedFund
HSBCEuroMulti-Asset
IncomeFund
HSBCAsiaHighIncomeBondFund(1)
USD EUR USD
Amountavailablefordistributionatthebeginningoftheyear/period 128,500,588 66,754,758 1,300,171,309
Net paid or payable on issue and redemption of units (20,928,992) (23,830,444) (446,447,563)(Loss)/profit before distributions after taxation (3,145,957) 4,657,117 18,443,913
Amount available for distributions to unitholders* 104,425,639 47,581,431 872,167,659Distributions to unitholders 13 (4,447,908) (2,821,179) (41,641,123)
Amountavailablefordistributionattheendoftheyear/period 99,977,731 44,760,252 830,526,536
* Amount available for distributions to unitholders is derived based on the relevant clauses of the Trust Deed.(1) The date of commencement for HSBC Asia High Income Bond Fund was 27 February 2017.(2) The HSBC All China Bond Fund is formerly known as “HSBC RQFII Chinese Fixed Income Fund”.

34
Distribution Statement
HSBCCollectiveInvestmentTrustfor the year ended 31 March 2019
2018
Note
HSBCChinaMulti-Asset
IncomeFundHSBCAllChina
BondFund(2)
HKD RMB
Amountavailablefordistributionatthebeginningoftheyear/period 3,083,696,483 159,800,438
Net received or receivable/(paid or payable) on issue and redemption of units 2,753,322,467 (28,177,722)
Profit/(loss) before distributions after taxation 832,679,529 (1,443,481)
Amount available for distributions to unitholders* 6,669,698,479 130,179,235Distributions to unitholders 13 (148,275,174) (5,161,200)
Amountavailablefordistributionattheendoftheyear/period 6,521,423,305 125,018,035
2018
Note
HSBCAsiaPacificex
JapanEquityVolatility
FocusedFund
HSBCEuroMulti-Asset
IncomeFund
HSBCAsiaHighIncomeBondFund(1)
USD EUR USD
Amountavailablefordistributionatthebeginningoftheyear/period 83,760,093 27,441,444 –
Net received or receivable on issue and redemption of units 41,064,528 51,804,495 1,340,608,393Profit/(loss) before distributions after taxation 6,938,536 (9,171,051) 28,025,426
Amount available for distributions to unitholders* 131,763,157 70,074,888 1,368,633,819Distributions to unitholders 13 (3,262,569) (3,320,130) (68,462,510)
Amountavailablefordistributionattheendoftheyear/period 128,500,588 66,754,758 1,300,171,309
* Amount available for distributions to unitholders is derived based on the relevant clauses of the Trust Deed.(1) The date of commencement for HSBC Asia High Income Bond Fund was 27 February 2017.(2) The HSBC All China Bond Fund is formerly known as “HSBC RQFII Chinese Fixed Income Fund”.
The notes on pages 46 to 104 form part of these financial statements.

35
Distribution Statement
HSBCCollectiveInvestmentTrustfor the year ended 31 March 2019
Distributionhistory–HSBCChinaMulti-AssetIncomeFund
Yearended31March2019 Yearended31March2018
NoteDistribution
perunit DateofdistributionDistribution
perunit DateofdistributionHKD HKD
ClassAM2–USD First distribution 13 0.2731 27 April 2018 0.2404 28 April 2017Second distribution 13 0.2519 31 May 2018 0.2416 31 May 2017Third distribution 13 0.2590 29 June 2018 0.2568 30 June 2017Fourth distribution 13 0.2574 31 July 2018 0.2686 31 July 2017Fifth distribution 13 0.2692 31 August 2018 0.2629 31 August 2017Sixth distribution 13 0.2736 28 September 2018 0.2601 29 September 2017Seventh distribution 13 0.2691 31 October 2018 0.2590 31 October 2017Eighth distribution 13 0.2745 30 November 2018 0.2585 30 November 2017Ninth distribution 13 0.2702 28 December 2018 0.2619 29 December 2017Tenth distribution 13 0.2635 31 January 2019 0.2675 31 January 2018Eleventh distribution 13 0.2535 28 February 2019 0.2779 28 February 2018Twelfth distribution 13 0.2465 29 March 2019 0.2888 29 March 2018
ClassAM2–RMB First distribution 13 0.0443 27 April 2018 0.0391 28 April 2017Second distribution 13 0.0407 31 May 2018 0.0398 31 May 2017Third distribution 13 0.0408 29 June 2018 0.0422 30 June 2017Fourth distribution 13 0.0408 31 July 2018 0.0439 31 July 2017Fifth distribution 13 0.0436 31 August 2018 0.0434 31 August 2017Sixth distribution 13 0.0443 28 September 2018 0.0421 29 September 2017Seventh distribution 13 0.0433 31 October 2018 0.0424 31 October 2017Eighth distribution 13 0.0451 30 November 2018 0.0424 30 November 2017Ninth distribution 13 0.0447 28 December 2018 0.0433 29 December 2017Tenth distribution 13 0.0442 31 January 2019 0.0450 31 January 2018Eleventh distribution 13 0.0415 28 February 2019 0.0453 28 February 2018Twelfth distribution 13 0.0401 29 March 2019 0.0474 29 March 2018

36
Distribution Statement
HSBCCollectiveInvestmentTrustfor the year ended 31 March 2019
Distributionhistory–HSBCChinaMulti-AssetIncomeFund
Yearended31March2019 Yearended31March2018
NoteDistribution
perunit DateofdistributionDistribution
perunit DateofdistributionHKD HKD
ClassAM2–HKD First distribution 13 0.0352 27 April 2018 0.0310 28 April 2017Second distribution 13 0.0325 31 May 2018 0.0311 31 May 2017Third distribution 13 0.0334 29 June 2018 0.0331 30 June 2017Fourth distribution 13 0.0332 31 July 2018 0.0346 31 July 2017Fifth distribution 13 0.0347 31 August 2018 0.0339 31 August 2017Sixth distribution 13 0.0354 28 September 2018 0.0336 29 September 2017Seventh distribution 13 0.0346 31 October 2018 0.0335 31 October 2017Eighth distribution 13 0.0355 30 November 2018 0.0333 30 November 2017Ninth distribution 13 0.0348 28 December 2018 0.0338 29 December 2017Tenth distribution 13 0.0340 31 January 2019 0.0344 31 January 2018Eleventh distribution 13 0.0326 28 February 2019 0.0358 28 February 2018Twelfth distribution 13 0.0318 29 March 2019 0.0372 29 March 2018
ClassAM3O–AUD First distribution 13 0.1903 27 April 2018 0.1964 29 March 2018Second distribution 13 0.1641 31 May 2018 – –Third distribution 13 0.1498 29 June 2018 – –Fourth distribution 13 0.1657 31 July 2018 – –Fifth distribution 13 0.1673 31 August 2018 – –Sixth distribution 13 0.1341 28 September 2018 – –Seventh distribution 13 0.1562 31 October 2018 – –Eighth distribution 13 0.1820 30 November 2018 – –Ninth distribution 13 0.1639 28 December 2018 – –Tenth distribution 13 0.1592 31 January 2019 – –Eleventh distribution 13 0.1811 28 February 2019 – –Twelfth distribution 13 0.1729 29 March 2019 – –

37
Distribution Statement
HSBCCollectiveInvestmentTrustfor the year ended 31 March 2019
Distributionhistory–HSBCAllChinaBondFund(1)
Yearended31March2019 Yearended31March2018
NoteDistribution
perunit DateofdistributionDistribution
perunit DateofdistributionRMB RMB
ClassAM2–USD First distribution 13 0.2291 27 April 2018 0.2706 28 April 2017Second distribution 13 0.2228 31 May 2018 0.2862 31 May 2017Third distribution 13 0.2403 29 June 2018 0.3050 30 June 2017Fourth distribution 13 0.2343 31 July 2018 0.2910 31 July 2017Fifth distribution 13 0.2294 31 August 2018 0.2691 31 August 2017Sixth distribution 13 0.2266 28 September 2018 0.2243 29 September 2017Seventh distribution 13 0.2351 31 October 2018 0.2130 31 October 2017Eighth distribution 13 0.2324 30 November 2018 0.2209 30 November 2017Ninth distribution 13 0.2275 28 December 2018 0.2351 29 December 2017Tenth distribution 13 0.2274 31 January 2019 0.2227 31 January 2018Eleventh distribution 13 0.2237 28 February 2019 0.2334 28 February 2018Twelfth distribution 13 0.2029 29 March 2019 0.2308 29 March 2018
ClassAM2–RMB First distribution 13 0.0368 27 April 2018 0.0437 28 April 2017Second distribution 13 0.0356 31 May 2018 0.0467 31 May 2017Third distribution 13 0.0375 29 June 2018 0.0495 30 June 2017Fourth distribution 13 0.0368 31 July 2018 0.0472 31 July 2017Fifth distribution 13 0.0368 31 August 2018 0.0441 31 August 2017Sixth distribution 13 0.0363 28 September 2018 0.0360 29 September 2017Seventh distribution 13 0.0374 31 October 2018 0.0345 31 October 2017Eighth distribution 13 0.0378 30 November 2018 0.0358 30 November 2017Ninth distribution 13 0.0372 28 December 2018 0.0385 29 December 2017Tenth distribution 13 0.0378 31 January 2019 0.0372 31 January 2018Eleventh distribution 13 0.0362 28 February 2019 0.0377 28 February 2018Twelfth distribution 13 0.0326 29 March 2019 0.0375 29 March 2018
ClassAM2–HKD First distribution 13 0.0294 27 April 2018 0.0349 28 April 2017Second distribution 13 0.0286 31 May 2018 0.0368 31 May 2017Third distribution 13 0.0310 29 June 2018 0.0392 30 June 2017Fourth distribution 13 0.0302 31 July 2018 0.0375 31 July 2017Fifth distribution 13 0.0296 31 August 2018 0.0346 31 August 2017Sixth distribution 13 0.0292 28 September 2018 0.0290 29 September 2017Seventh distribution 13 0.0301 31 October 2018 0.0275 31 October 2017Eighth distribution 13 0.0300 30 November 2018 0.0284 30 November 2017Ninth distribution 13 0.0292 28 December 2018 0.0302 29 December 2017Tenth distribution 13 0.0293 31 January 2019 0.0286 31 January 2018Eleventh distribution 13 0.0287 28 February 2019 0.0301 28 February 2018Twelfth distribution 13 0.0262 29 March 2019 0.0297 29 March 2018
(1) The HSBC All China Bond Fund is formerly known as “HSBC RQFII Chinese Fixed Income Fund”.

38
Distribution Statement
HSBCCollectiveInvestmentTrustfor the year ended 31 March 2019
Distributionhistory–HSBCAsiaPacificexJapanEquityVolatilityFocusedFund
Yearended31March2019 Yearended31March2018
NoteDistribution
perunit DateofdistributionDistribution
perunit DateofdistributionUSD USD
ClassAM2–USD First distribution 13 0.0319 30 April 2018 0.0284 28 April 2017Second distribution 13 0.0325 31 May 2018 0.0286 31 May 2017Third distribution 13 0.0325 29 June 2018 0.0292 30 June 2017Fourth distribution 13 0.0321 31 July 2018 0.0314 31 July 2017Fifth distribution 13 0.0327 31 August 2018 0.0307 31 August 2017Sixth distribution 13 0.0323 28 September 2018 0.0325 29 September 2017Seventh distribution 13 0.0327 31 October 2018 0.0346 31 October 2017Eighth distribution 13 0.0331 30 November 2018 0.0341 30 November 2017Ninth distribution 13 0.0320 31 December 2018 0.0328 29 December 2017Tenth distribution 13 0.0312 31 January 2019 0.0309 31 January 2018Eleventh distribution 13 0.0320 28 February 2019 0.0318 28 February 2018Twelfth distribution 13 0.0329 29 March 2019 0.0321 29 March 2018
ClassAM2–HKD First distribution 13 0.0041 30 April 2018 0.0036 28 April 2017Second distribution 13 0.0042 31 May 2018 0.0037 31 May 2017Third distribution 13 0.0042 29 June 2018 0.0038 30 June 2017Fourth distribution 13 0.0041 31 July 2018 0.0040 31 July 2017Fifth distribution 13 0.0042 31 August 2018 0.0039 31 August 2017Sixth distribution 13 0.0042 28 September 2018 0.0042 29 September 2017Seventh distribution 13 0.0042 31 October 2018 0.0045 31 October 2017Eighth distribution 13 0.0043 30 November 2018 0.0044 30 November 2017Ninth distribution 13 0.0041 31 December 2018 0.0042 29 December 2017Tenth distribution 13 0.0040 31 January 2019 0.0040 31 January 2018Eleventh distribution 13 0.0041 28 February 2019 0.0041 28 February 2018Twelfth distribution 13 0.0042 29 March 2019 0.0041 29 March 2018
ClassBM2–USD First distribution 13 0.0336 29 March 2019 – –
ClassBM2–HKD First distribution 13 0.0043 29 March 2019 – –
ClassBM2–RMB First distribution 13 0.0049 29 March 2019 – –

39
Distribution Statement
HSBCCollectiveInvestmentTrustfor the year ended 31 March 2019
Distributionhistory–HSBCEuroMulti-AssetIncomeFund
Yearended31March2019 Yearended31March2018
NoteDistribution
perunit DateofdistributionDistribution
perunit DateofdistributionEUR EUR
ClassAM3H–USD First distribution 13 0.0365 30 April 2018 0.0309 28 April 2017Second distribution 13 0.0389 31 May 2018 0.0300 31 May 2017Third distribution 13 0.0395 29 June 2018 0.0298 30 June 2017Fourth distribution 13 0.0410 31 July 2018 0.0294 31 July 2017Fifth distribution 13 0.0394 31 August 2018 0.0288 31 August 2017Sixth distribution 13 0.0372 28 September 2018 0.0287 29 September 2017Seventh distribution 13 0.0434 31 October 2018 0.0303 31 October 2017Eighth distribution 13 0.0405 30 November 2018 0.0306 30 November 2017Ninth distribution 13 0.0415 31 December 2018 0.0303 29 December 2017Tenth distribution 13 0.0457 31 January 2019 0.0312 31 January 2018Eleventh distribution 13 0.0399 28 February 2019 0.0323 28 February 2018Twelfth distribution 13 0.0392 29 March 2019 0.0341 29 March 2018
ClassAM3H–RMB First distribution 13 0.0073 30 April 2018 0.0080 28 April 2017Second distribution 13 0.0078 31 May 2018 0.0065 31 May 2017Third distribution 13 0.0078 29 June 2018 0.0083 30 June 2017Fourth distribution 13 0.0075 31 July 2018 0.0063 31 July 2017Fifth distribution 13 0.0061 31 August 2018 0.0062 31 August 2017Sixth distribution 13 0.0058 28 September 2018 0.0055 29 September 2017Seventh distribution 13 0.0085 31 October 2018 0.0066 31 October 2017Eighth distribution 13 0.0073 30 November 2018 0.0069 30 November 2017Ninth distribution 13 0.0070 31 December 2018 0.0069 29 December 2017Tenth distribution 13 0.0067 31 January 2019 0.0069 31 January 2018Eleventh distribution 13 0.0058 28 February 2019 0.0078 28 February 2018Twelfth distribution 13 0.0055 29 March 2019 0.0074 29 March 2018
ClassAM3H–HKD First distribution 13 0.0037 30 April 2018 0.0032 28 April 2017Second distribution 13 0.0042 31 May 2018 0.0031 31 May 2017Third distribution 13 0.0045 29 June 2018 0.0031 30 June 2017Fourth distribution 13 0.0049 31 July 2018 0.0030 31 July 2017Fifth distribution 13 0.0046 31 August 2018 0.0030 31 August 2017Sixth distribution 13 0.0040 28 September 2018 0.0032 29 September 2017Seventh distribution 13 0.0054 31 October 2018 0.0033 31 October 2017Eighth distribution 13 0.0043 30 November 2018 0.0035 30 November 2017Ninth distribution 13 0.0041 31 December 2018 0.0035 29 December 2017Tenth distribution 13 0.0050 31 January 2019 0.0037 31 January 2018Eleventh distribution 13 0.0037 28 February 2019 0.0036 28 February 2018Twelfth distribution 13 0.0036 29 March 2019 0.0036 29 March 2018

40
Distribution Statement
HSBCCollectiveInvestmentTrustfor the year ended 31 March 2019
Distributionhistory–HSBCEuroMulti-AssetIncomeFund
Yearended31March2019 Yearended31March2018
NoteDistribution
perunit DateofdistributionDistribution
perunit DateofdistributionEUR EUR
ClassAM2–EUR First distribution 13 0.0230 30 April 2018 0.0217 28 April 2017Second distribution 13 0.0230 31 May 2018 0.0211 31 May 2017Third distribution 13 0.0239 29 June 2018 0.0211 30 June 2017Fourth distribution 13 0.0242 31 July 2018 0.0209 31 July 2017Fifth distribution 13 0.0235 31 August 2018 0.0206 31 August 2017Sixth distribution 13 0.0236 28 September 2018 0.0202 29 September 2017Seventh distribution 13 0.0236 31 October 2018 0.0213 31 October 2017Eighth distribution 13 0.0239 30 November 2018 0.0218 30 November 2017Ninth distribution 13 0.0246 31 December 2018 0.0211 29 December 2017Tenth distribution 13 0.0245 31 January 2019 0.0219 31 January 2018Eleventh distribution 13 0.0236 28 February 2019 0.0220 28 February 2018Twelfth distribution 13 0.0212 29 March 2019 0.0228 29 March 2018 ClassAM3H–CAD First distribution 13 0.0247 30 April 2018 0.0210 28 April 2017Second distribution 13 0.0261 31 May 2018 0.0205 31 May 2017Third distribution 13 0.0260 29 June 2018 0.0208 30 June 2017Fourth distribution 13 0.0267 31 July 2018 0.0212 31 July 2017Fifth distribution 13 0.0268 31 August 2018 0.0220 31 August 2017Sixth distribution 13 0.0252 28 September 2018 0.0225 29 September 2017Seventh distribution 13 0.0276 31 October 2018 0.0234 31 October 2017Eighth distribution 13 0.0268 30 November 2018 0.0233 30 November 2017Ninth distribution 13 0.0305 31 December 2018 0.0230 29 December 2017Tenth distribution 13 0.0282 31 January 2019 0.0239 31 January 2018Eleventh distribution 13 0.0260 28 February 2019 0.0242 28 February 2018Twelfth distribution 13 0.0245 29 March 2019 0.0243 29 March 2018 ClassAM3H–AUD First distribution 13 0.0251 30 April 2018 0.0254 28 April 2017Second distribution 13 0.0267 31 May 2018 0.0248 31 May 2017Third distribution 13 0.0264 29 June 2018 0.0251 30 June 2017Fourth distribution 13 0.0300 31 July 2018 0.0253 31 July 2017Fifth distribution 13 0.0274 31 August 2018 0.0241 31 August 2017Sixth distribution 13 0.0258 28 September 2018 0.0238 29 September 2017Seventh distribution 13 0.0299 31 October 2018 0.0246 31 October 2017Eighth distribution 13 0.0273 30 November 2018 0.0243 30 November 2017Ninth distribution 13 0.0260 31 December 2018 0.0244 29 December 2017Tenth distribution 13 0.0298 31 January 2019 0.0252 31 January 2018Eleventh distribution 13 0.0255 28 February 2019 0.0246 28 February 2018Twelfth distribution 13 0.0244 29 March 2019 0.0246 29 March 2018

41
Distribution Statement
HSBCCollectiveInvestmentTrustfor the year ended 31 March 2019
Distributionhistory–HSBCEuroMulti-AssetIncomeFund
Yearended31March2019 Yearended31March2018
NoteDistribution
perunit DateofdistributionDistribution
perunit DateofdistributionEUR EUR
ClassAM3H–NZD First distribution 13 0.0242 30 April 2018 0.0256 28 April 2017Second distribution 13 0.0257 31 May 2018 0.0255 31 May 2017Third distribution 13 0.0251 29 June 2018 0.0259 30 June 2017Fourth distribution 13 0.0275 31 July 2018 0.0256 31 July 2017Fifth distribution 13 0.0261 31 August 2018 0.0238 31 August 2017Sixth distribution 13 0.0245 28 September 2018 0.0239 29 September 2017Seventh distribution 13 0.0277 31 October 2018 0.0238 31 October 2017Eighth distribution 13 0.0259 30 November 2018 0.0240 30 November 2017Ninth distribution 13 0.0252 31 December 2018 0.0237 29 December 2017Tenth distribution 13 0.0280 31 January 2019 0.0238 31 January 2018Eleventh distribution 13 0.0241 28 February 2019 0.0239 28 February 2018Twelfth distribution 13 0.0233 29 March 2019 0.0244 29 March 2018

42
Distribution Statement
HSBCCollectiveInvestmentTrustfor the year ended 31 March 2019
Distributionhistory–HSBCAsiaHighIncomeBondFund
Yearended31March2019
Periodfrom27February2017(commencementofoperations)to
31March2018
NoteDistribution
perunit DateofdistributionDistribution
perunit DateofdistributionUSD USD
ClassAM2–USD First distribution 13 0.0353 30 April 2018 0.0367 28 April 2017Second distribution 13 0.0348 31 May 2018 0.0367 31 May 2017Third distribution 13 0.0347 29 June 2018 0.0368 30 June 2017Fourth distribution 13 0.0396 31 July 2018 0.0368 31 July 2017Fifth distribution 13 0.0396 31 August 2018 0.0369 31 August 2017Sixth distribution 13 0.0393 28 September 2018 0.0370 29 September 2017Seventh distribution 13 0.0389 31 October 2018 0.0368 31 October 2017Eighth distribution 13 0.0385 30 November 2018 0.0368 30 November 2017Ninth distribution 13 0.0389 31 December 2018 0.0366 29 December 2017Tenth distribution 13 0.0438 31 January 2019 0.0366 31 January 2018Eleventh distribution 13 0.0446 28 February 2019 0.0359 28 February 2018Twelfth distribution 13 0.0448 29 March 2019 0.0355 29 March 2018
ClassAM2–RMB First distribution 13 0.0051 30 April 2018 0.0053 28 April 2017Second distribution 13 0.0050 31 May 2018 0.0054 31 May 2017Third distribution 13 0.0050 29 June 2018 0.0054 30 June 2017Fourth distribution 13 0.0058 31 July 2018 0.0054 31 July 2017Fifth distribution 13 0.0057 31 August 2018 0.0055 31 August 2017Sixth distribution 13 0.0057 28 September 2018 0.0053 29 September 2017Seventh distribution 13 0.0057 31 October 2018 0.0053 31 October 2017Eighth distribution 13 0.0056 30 November 2018 0.0054 30 November 2017Ninth distribution 13 0.0057 31 December 2018 0.0054 29 December 2017Tenth distribution 13 0.0065 31 January 2019 0.0054 31 January 2018Eleventh distribution 13 0.0065 28 February 2019 0.0053 28 February 2018Twelfth distribution 13 0.0065 29 March 2019 0.0052 29 March 2018
ClassAM3O–RMB First distribution 13 0.0072 30 April 2018 0.0080 30 November 2017Second distribution 13 0.0072 31 May 2018 0.0081 29 December 2017Third distribution 13 0.0072 29 June 2018 0.0081 31 January 2018Fourth distribution 13 0.0073 31 July 2018 0.0086 28 February 2018Fifth distribution 13 0.0058 31 August 2018 0.0078 29 March 2018Sixth distribution 13 0.0058 28 September 2018 – –Seventh distribution 13 0.0079 31 October 2018 – –Eighth distribution 13 0.0069 30 November 2018 – –Ninth distribution 13 0.0067 31 December 2018 – –Tenth distribution 13 0.0061 31 January 2019 – –Eleventh distribution 13 0.0062 28 February 2019 – –Twelfth distribution 13 0.0064 29 March 2019 – –

43
Distribution Statement
HSBCCollectiveInvestmentTrustfor the year ended 31 March 2019
Distributionhistory–HSBCAsiaHighIncomeBondFund
Yearended31March2019
Periodfrom27February2017(commencementofoperations)to
31March2018
NoteDistribution
perunit DateofdistributionDistribution
perunit DateofdistributionUSD USD
ClassAM2–HKD First distribution 13 0.0045 30 April 2018 0.0047 28 April 2017Second distribution 13 0.0045 31 May 2018 0.0047 31 May 2017Third distribution 13 0.0045 29 June 2018 0.0047 30 June 2017Fourth distribution 13 0.0051 31 July 2018 0.0047 31 July 2017Fifth distribution 13 0.0051 31 August 2018 0.0048 31 August 2017Sixth distribution 13 0.0051 28 September 2018 0.0048 29 September 2017Seventh distribution 13 0.0050 31 October 2018 0.0047 31 October 2017Eighth distribution 13 0.0050 30 November 2018 0.0047 30 November 2017Ninth distribution 13 0.0050 31 December 2018 0.0047 29 December 2017Tenth distribution 13 0.0056 31 January 2019 0.0047 31 January 2018Eleventh distribution 13 0.0057 28 February 2019 0.0046 28 February 2018Twelfth distribution 13 0.0058 29 March 2019 0.0046 29 March 2018 ClassAM2–EUR First distribution 13 0.0369 30 April 2018 0.0393 28 April 2017Second distribution 13 0.0365 31 May 2018 0.0390 31 May 2017Third distribution 13 0.0366 29 June 2018 0.0400 30 June 2017Fourth distribution 13 0.0418 31 July 2018 0.0392 31 July 2017Fifth distribution 13 0.0425 31 August 2018 0.0395 31 August 2017Sixth distribution 13 0.0412 28 September 2018 0.0388 29 September 2017Seventh distribution 13 0.0407 31 October 2018 0.0383 31 October 2017Eighth distribution 13 0.0407 30 November 2018 0.0392 30 November 2017Ninth distribution 13 0.0413 31 December 2018 0.0390 29 December 2017Tenth distribution 13 0.0465 31 January 2019 0.0392 31 January 2018Eleventh distribution 13 0.0468 28 February 2019 0.0377 28 February 2018Twelfth distribution 13 0.0467 29 March 2019 0.0377 29 March 2018 ClassAM3O–EUR First distribution 13 0.0184 30 April 2018 0.0274 30 November 2017Second distribution 13 0.0170 31 May 2018 0.0265 29 December 2017Third distribution 13 0.0168 29 June 2018 0.0255 31 January 2018Fourth distribution 13 0.0197 31 July 2018 0.0240 28 February 2018Fifth distribution 13 0.0213 31 August 2018 0.0214 29 March 2018Sixth distribution 13 0.0235 28 September 2018 – –Seventh distribution 13 0.0157 31 October 2018 – –Eighth distribution 13 0.0190 30 November 2018 – –Ninth distribution 13 0.0182 31 December 2018 – –Tenth distribution 13 0.0120 31 January 2019 – –Eleventh distribution 13 0.0250 28 February 2019 – –Twelfth distribution 13 0.0244 29 March 2019 – –

44
Distribution Statement
HSBCCollectiveInvestmentTrustfor the year ended 31 March 2019
Distributionhistory–HSBCAsiaHighIncomeBondFund
Yearended31March2019
Periodfrom27February2017(commencementofoperations)to
31March2018
NoteDistribution
perunit DateofdistributionDistribution
perunit DateofdistributionUSD USD
ClassAM2–AUD First distribution 13 0.0269 30 April 2018 0.0281 28 April 2017Second distribution 13 0.0269 31 May 2018 0.0285 31 May 2017Third distribution 13 0.0266 29 June 2018 0.0289 30 June 2017Fourth distribution 13 0.0305 31 July 2018 0.0284 31 July 2017Fifth distribution 13 0.0301 31 August 2018 0.0284 31 August 2017Sixth distribution 13 0.0299 28 September 2018 0.0279 29 September 2017Seventh distribution 13 0.0300 31 October 2018 0.0277 31 October 2017Eighth distribution 13 0.0299 30 November 2018 0.0285 30 November 2017Ninth distribution 13 0.0298 31 December 2018 0.0287 29 December 2017Tenth distribution 13 0.0348 31 January 2019 0.0284 31 January 2018Eleventh distribution 13 0.0335 28 February 2019 0.0273 28 February 2018Twelfth distribution 13 0.0342 29 March 2019 0.0272 29 March 2018
ClassAM3O–AUD First distribution 13 0.0238 30 April 2018 0.0288 30 November 2017Second distribution 13 0.0234 31 May 2018 0.0292 29 December 2017Third distribution 13 0.0225 29 June 2018 0.0293 31 January 2018Fourth distribution 13 0.0279 31 July 2018 0.0272 28 February 2018Fifth distribution 13 0.0272 31 August 2018 0.0253 29 March 2018Sixth distribution 13 0.0268 28 September 2018 – –Seventh distribution 13 0.0264 31 October 2018 – –Eighth distribution 13 0.0257 30 November 2018 – –Ninth distribution 13 0.0234 31 December 2018 – –Tenth distribution 13 0.0271 31 January 2019 – –Eleventh distribution 13 0.0279 28 February 2019 – –Twelfth distribution 13 0.0277 29 March 2019 – –
ClassAM2–CAD First distribution 13 0.0268 30 April 2018 0.0276 28 April 2017Second distribution 13 0.0265 31 May 2018 0.0283 31 May 2017Third distribution 13 0.0265 29 June 2018 0.0287 30 June 2017Fourth distribution 13 0.0304 31 July 2018 0.0283 31 July 2017Fifth distribution 13 0.0303 31 August 2018 0.0281 31 August 2017Sixth distribution 13 0.0297 28 September 2018 0.0280 29 September 2017Seventh distribution 13 0.0296 31 October 2018 0.0274 31 October 2017Eighth distribution 13 0.0294 30 November 2018 0.0279 30 November 2017Ninth distribution 13 0.0295 31 December 2018 0.0285 29 December 2017Tenth distribution 13 0.0347 31 January 2019 0.0280 31 January 2018Eleventh distribution 13 0.0338 28 February 2019 0.0272 28 February 2018Twelfth distribution 13 0.0334 29 March 2019 0.0273 29 March 2018

45
Distribution Statement
HSBCCollectiveInvestmentTrustfor the year ended 31 March 2019
Distributionhistory–HSBCAsiaHighIncomeBondFund
Yearended31March2019
Periodfrom27February2017(commencementofoperations)to
31March2018
NoteDistribution
perunit DateofdistributionDistribution
perunit DateofdistributionUSD USD
ClassAM3O–CAD First distribution 13 0.0232 30 April 2018 0.0279 30 November 2017Second distribution 13 0.0225 31 May 2018 0.0277 29 December 2017Third distribution 13 0.0221 29 June 2018 0.0279 31 January 2018Fourth distribution 13 0.0246 31 July 2018 0.0267 28 February 2018Fifth distribution 13 0.0262 31 August 2018 0.0249 29 March 2018Sixth distribution 13 0.0259 28 September 2018 – –Seventh distribution 13 0.0238 31 October 2018 – –Eighth distribution 13 0.0246 30 November 2018 – –Ninth distribution 13 0.0235 31 December 2018 – –Tenth distribution 13 0.0235 31 January 2019 – –Eleventh distribution 13 0.0282 28 February 2019 – –Twelfth distribution 13 0.0277 29 March 2019 – –
ClassAM3O–GBP First distribution 13 0.0303 30 April 2018 0.0372 30 November 2017Second distribution 13 0.0298 31 May 2018 0.0385 29 December 2017Third distribution 13 0.0284 29 June 2018 0.0384 31 January 2018Fourth distribution 13 0.0326 31 July 2018 0.0363 28 February 2018Fifth distribution 13 0.0354 31 August 2018 0.0307 29 March 2018Sixth distribution 13 0.0374 28 September 2018 – –Seventh distribution 13 0.0308 31 October 2018 – –Eighth distribution 13 0.0332 30 November 2018 – –Ninth distribution 13 0.0322 31 December 2018 – –Tenth distribution 13 0.0304 31 January 2019 – –Eleventh distribution 13 0.0403 28 February 2019 – –Twelfth distribution 13 0.0396 29 March 2019 – –
ClassAM3O–SGD First distribution 13 0.0220 30 April 2018 0.0255 30 November 2017Second distribution 13 0.0217 31 May 2018 0.0250 29 December 2017Third distribution 13 0.0213 29 June 2018 0.0249 31 January 2018Fourth distribution 13 0.0241 31 July 2018 0.0229 28 February 2018Fifth distribution 13 0.0243 31 August 2018 0.0234 29 March 2018Sixth distribution 13 0.0253 28 September 2018 – –Seventh distribution 13 0.0237 31 October 2018 – –Eighth distribution 13 0.0229 30 November 2018 – –Ninth distribution 13 0.0237 31 December 2018 – –Tenth distribution 13 0.0269 31 January 2019 – –Eleventh distribution 13 0.0283 28 February 2019 – –Twelfth distribution 13 0.0286 29 March 2019 – –
The notes on pages 46 to 104 form part of these financial statements.

46
Notes to the Financial Statements
1 TheTrust
HSBC China Multi-Asset Income Fund, HSBC All China Bond Fund (formerly known as HSBC RQFII Chinese Fixed Income Fund), HSBC Asia Pacific ex Japan Equity Volatility Focused Fund, HSBC Euro Multi-Asset Income Fund and HSBC Asia High Income Bond Fund (“the sub-funds”) presented in the financial statements represent the sub-funds within HSBC Collective Investment Trust (“the Trust”) which is an open-ended umbrella unit trust established under the laws of Hong Kong by its Trust Deed dated 27 February 2014, as amended (“the Trust Deed”). These sub-funds were launched on the dates of commencement as set out below:
Dates of commencement
HSBC China Multi-Asset Income Fund
21 November 2014
HSBC All China Bond Fund (formerly known as HSBC RQFII Chinese Fixed Income Fund)
14 July 2014
HSBC Asia Pacific ex Japan Equity Volatility Focused Fund
27 March 2015
HSBC Euro Multi-Asset Income Fund 18 March 2016HSBC Asia High Income Bond Fund 27 February 2017
HSBC China Multi-Asset Income Fund aims to provide income and moderate capital growth, through an active asset allocation in a diversified portfolio of a minimum of 70% of its net asset value in fixed income and equity securities as well as money market and cash instruments that are related to China.
HSBC All China Bond Fund (formerly known as HSBC RQFII Chinese Fixed Income Fund) aims to invest for total return (i.e. via both income and capital appreciation), through investments primarily in a portfolio of onshore and offshore Mainland Chinese fixed income securities. The sub-fund invests primarily in fixed income securities including:
– offshore fixed income securities denominated in any currencies and issued outside Mainland China by the Mainland China government or Mainland China companies;
– offshore RMB denominated fixed income securities issued outside Mainland China by non-Mainland China entities;
– onshore fixed income securities denominated in RMB, issued within Mainland China and traded on the China Interbank Bond Market through Bond Connect, the RQFII quota of the Investment Adviser and/or other means as may be permitted by the relevant regulations from time to time;
– onshore exchange traded fixed income securities issued within Mainland China and traded on the stock exchanges in Mainland China through the RQFII quota of the Investment Adviser.
HSBC Asia Pacific ex Japan Equity Volatility Focused Fund aims to provide long-term total return by investing in a portfolio of equities and invests (normally a minimum 90% of its net assets) in equities and equity equivalent securities of companies which have their registered office in, and with an official listing on a major stock exchange or other regulated market of any Asia Pacific country (excluding Japan) as well as companies which carry out a preponderant part of their economic activities in the Asia Pacific region (excluding Japan). The sub-fund may invest the remaining assets in money market instruments, cash instruments and cash.
HSBC Euro Multi-Asset Income Fund aims to provide income and moderate capital growth through a diversified portfolio of Eurozone equities, Euro-denominated fixed income securities as well as money market instruments, cash instruments and collective investment schemes that invests in Eurozone securities.
HSBC Asia High Income Bond Fund aims to invest in fixed income securities which provide higher yield compared to their peers and the potential for capital appreciation over the medium to long-term. A minimum of 70% of the sub-fund’s net asset value will be invested in a diversified portfolio of fixed income securities issued or guaranteed by government, government agencies or supranational bodies in Asia, or issued by companies which are domiciled in, based in or carry out the larger part of their business in Asia.
The sub-funds are authorised by the Securities and Futures Commission in Hong Kong (“the SFC”) under Section 104 of the Hong Kong Securities and Futures Ordinance and are governed by the Hong Kong Code on Unit Trusts and Mutual Funds (“the SFC Code”) issued by the SFC.
The Trust Deed does not contain any requirement that a combined set of financial statements for the Trust itself be prepared.

47
Notes to the Financial Statements
2 Significantaccountingpolicies
(a) Statementofcompliance
The financial statements have been prepared in accordance with all applicable Hong Kong Financial Reporting Standards (“HKFRSs”), which collective term includes all applicable individual Hong Kong Financial Reporting Standards, Hong Kong Accounting Standards (“HKASs”) and Interpretations issued by the Hong Kong Institute of Certified Public Accountants (“HKICPA”), accounting principles generally accepted in Hong Kong, the relevant disclosure provisions of the Trust Deed and the relevant disclosure requirements of the SFC Code issued by the SFC. A summary of the significant accounting policies adopted by the sub-funds is set out below.
The HKICPA has issued certain new and revised HKFRSs that are first effective or available for early adoption for the current accounting period of the sub-funds. Note 2(c) provides information on any changes in accounting policies resulting from initial application of these developments to the extent that they are relevant to the sub-funds for the current and prior accounting periods reflected in these financial statements.
(b) Basisofpreparationofthefinancialstatements
The functional and presentation currency of HSBC China Multi-Asset Income Fund is the Hong Kong dollar, the functional and presentation currency of HSBC All China Bond Fund (formerly known as HSBC RQFII Chinese Fixed Income Fund) is the Renminbi, the functional and presentation currency of HSBC Asia Pacific ex Japan Equity Volatility Focused Fund is the United States dollar, the functional and presentation currency of HSBC Euro Multi-Asset Income Fund is the Euro and the functional and presentation currency of HSBC Asia High Income Bond Fund is the United States dollar.
The financial statements are prepared on a fair value basis for financial assets and financial liabilities at fair value through profit or loss. Other financial assets and financial liabilities are stated at amortised cost or redemption amount (redeemable units).
The preparation of financial statements in conformity with HKFRSs requires the Manager and the Trustee to make judgements, estimates and assumptions that affect the application of policies and reported amounts of assets, liabilities, income and expenses. The estimates and associated assumptions are based on historical experience and various other factors that are believed to be reasonable
under the circumstances, the results of which form the basis of making the judgements about carrying values of assets and liabilities that are not readily apparent from other sources. Actual results may differ from these estimates.
The estimates and underlying assumptions are reviewed on an ongoing basis. Revisions to accounting estimates are recognised in the period in which the estimate is revised if the revision affects only that period or in the period of the revision and future periods if the revision affects both current and future periods.
(c) Changesinaccountingpolicies
The HKICPA has issued a number of new HKFRSs and amendments to HKFRSs that are first effective for the current accounting period of the sub-funds. Of these, the following developments are relevant to the sub-funds’ financial statements:
(i) HKFRS 9, Financial instruments
The sub-funds have not applied any new standard or interpretation that is not yet effective for the current accounting period (see note 15), except for the amendments to HKFRS 9, Prepayment features with negative compensation which have been adopted at the same time as HKFRS 9.
As permitted by the transition provisions of HKFRS 9, comparative information throughout these financial statements has not generally been restated to reflect the requirements of the standard.
Except for the changes below, the sub-funds have consistently applied the accounting policies as set out in Note 2(e) to all periods presented in these financial statements.
HKFRS9, Financialinstruments
HKFRS 9 sets out requirements for recognising and measuring financial assets, financial liabilities and some contracts to buy or sell non-financial items. This standard replaces HKAS 39 Financial Instruments: Recognition and Measurement.
As a result of the adoption of HKFRS 9, the sub-funds have adopted consequential amendments to HKAS 1 Presentation of Financial Statements, which require:

48
Notes to the Financial Statements
• impairment of financial assets to be presented in a separate line item in the statement of comprehensive income. The sub-funds did not previously report any incurred losses; and
• separate presentation in the statement of comprehensive income of interest revenue from financial assets measured at amortised cost or fair value through other comprehensive income (“FVOCI”) calculated using the effective interest method.
Additionally, the sub-funds have adopted consequential amendments to HKFRS 7 Financial Instruments: Disclosures, which are applied to disclosures about 2019 but have not generally been applied to comparative information.
The adoption of HKFRS 9 had no material impact on the net assets attributable to unitholders of the sub-funds.
i. Classification and measurement of financial assets and financial liabilities
HKFRS 9 contains three principal classification categories for financial assets: measured at amortised cost, FVOCI and fair value through profit or loss (“FVTPL”). The classification of financial assets under HKFRS 9 is generally based on the business model in which a financial asset is managed and its contractual cash flow characteristics. HKFRS 9 eliminates the previous HKAS 39 categories of held to maturity, loans and receivables and available for sale. Under HKFRS 9, derivatives embedded in contracts where the host is a financial asset in the scope of the standard are never separated. Instead, the hybrid financial instrument as a whole is assessed for classification.
HKFRS 9 largely retains the existing requirements in HKAS 39 for the c lassif icat ion and measurement of financial liabilities.
The adoption of HKFRS 9 has not had a significant effect on the sub-funds’ accounting policies related to financial liabilities and derivative financial instruments.
For an explanation of how the sub-funds classify and measure financial instruments and account for related gains and losses under HKFRS 9, see Note 2(e).
The following table below explains the original measurement categories under HKAS 39 and the new measurement categories under HKFRS 9 for each class of the sub-funds’ financial assets as at 1 April 2018.
Original classification under HKAS 39
New classification under HKFRS 9
Financialassets
Amounts due from brokers
Loans and receivables Amortised cost
Dividend receivable Loans and receivables Amortised costInterest receivable Loans and receivables Amortised costSubscription
receivableLoans and receivables Amortised cost
Other receivable Loans and receivables Amortised costCash and cash
equivalentsLoans and receivables Amortised cost
Equity instruments Held-for-trading Mandatorily at FVTPL
Debt instruments Held-for-trading Mandatorily at FVTPL
Collective investment schemes
Held-for-trading Mandatorily at FVTPL
Derivative financial instruments
Held-for-trading Mandatorily at FVTPL
The measurement categories for all financial liabilities remain the same. The carrying amounts for all financial liabilities at 1 April 2018 have not been impacted by the initial application of HKFRS 9.
ii. Impairment of financial assets
HKFRS 9 replaces the “incurred loss” model in HKAS 39 with an expected credit losses (“ECLs”) model. The new impairment model applies to financial assets measured at amortised cost and debt instruments at FVOCI, but not to investments in equity instruments. Under HKFRS 9, credit losses are recognised earlier than under HKAS 39.

49
Notes to the Financial Statements
The effect of adopting HKFRS 9 on the carrying amounts of financial assets at 1 April 2018 relates solely to the new impairment requirements. The Manager considers the probability of default to be close to zero as the counterparties have a strong capacity to meet their contractual obligations in the near term. There is no impairment allowance recognised on dividend receivable, interest receivable, subscription receivable, amounts due from brokers, other receivable and cash and cash equivalents on the initial application of HKFRS 9’s impairment requirements as at 1 April 2018. Therefore, the carrying amounts of the financial assets remain the same.
iii. Transition
Changes in accounting policies resulting from the adoption of HKFRS 9 have been applied retrospectively, except as described below.
• Comparative periods have not generally been restated. Differences in the carrying amounts of financial assets resulting from the adoption of HKFRS 9 are recognised in net assets attributable to unitholders as at 1 April 2018. Accordingly, the information presented for 2017 does not reflect the requirements of HKFRS 9, but rather those of HKAS 39.
The Fund has used the exemption not to rest ate comparat ive per iods but considering that the amendments made by HKFRS 9 to HKAS 1 introduced the requirement to present interest income from financial assets that are subsequently measured at amortised cost or FVOCI as a separate line item in the statement of comprehensive income, the Fund has reclassified comparative interest income on financial instruments designated as at FVTPL to “interest income from financial assets at fair value through profit or loss”.
• The following assessments have been made on the basis of the facts and circumstances that existed at the date of initial application.
– The determination of the business model within which a financial asset is held.
– The revoca t ion o f p rev ious designations of certain financial assets as measured at FVTPL.
(d) Translationofforeigncurrency
Foreign currency transactions during the year/period are translated into functional and presentation currencies of the sub-funds at the exchange rates ruling at the transaction dates. Monetary assets and liabilities denominated in foreign currencies that are stated at fair value are translated into functional and presentation currencies of the sub-funds at the foreign exchange rates ruling at the date of the statement of assets and liabilities. Foreign currency exchange differences arising on translation and realised gains and losses on disposal or settlement of monetary assets and liabilities are recognised in profit or loss. Foreign currency exchange differences relating to financial assets at fair value through profit or loss are included in net gains from financial assets at fair value through profit or loss. All other foreign currency exchange differences relating to monetary items including cash and cash equivalents are presented separately in profit or loss.
(e) Financialinstruments
(i) Classification
(A) Policy applicable from 1 April 2018
On initial recognition, the sub-funds classify financial assets as measured at amortised cost or FVTPL.
A financial asset is measured at amortised cost if it meets both of the following conditions and is not designated as at FVTPL:
• it is held within a business model whose objective is to hold assets to collect contractual cash flows; and
• its contractual terms give rise on specified dates to cash flows that are solely payments of principal and interest (“SPPI”).
All other financial assets of the sub-funds are measured at FVTPL.

50
Notes to the Financial Statements
Business model assessment
In making an assessment of the objective of the business model in which a financial asset is held, the sub-funds consider all of the relevant information about how the business is managed, including:
• the documented investment strategy and the execution of this strategy in practice. This includes whether the investment strategy focuses on earning contractual interest income, maintaining a particular interest rate profile, matching the duration of the financial assets to the duration of any related liabilities or expected cash outflows or realising cash flows through the sale of the assets;
• how the performance of the portfolio is evaluated and reported to the sub-funds’ management;
• the risks that affect the performance of the business model (and the financial assets held within that business model) and how those risks are managed;
• how the investment manager is compensated: e.g. whether compensation is based on the fair value of the assets managed or the contractual cash flows collected; and
• the frequency, volume and timing of sales of financial assets in prior periods, the reasons for such sales and expectations about future sales activity.
Transfers of financial assets to third parties in transactions that do not qualify for derecognition are not considered sales for this purpose, consistent with the sub-funds’ continuing recognition of the assets.
The sub-funds have determined that they have two business models.
• Held-to-collect business model: this includes dividend receivable, interest receivable, subscription receivable, amounts due from brokers, other receivable and cash and cash equivalents. These financial assets are held to collect contractual cash flow.
• Other business model: this includes debt instruments, equity instruments, collective investment schemes and derivatives. These financial assets are managed and their performance is evaluated, on a fair value basis, with frequent sales taking place.
Assessment whether contractual cash flows are SPPI
For the purposes of this assessment, “principal” is defined as the fair value of the financial asset on initial recognition. “Interest” is defined as consideration for the time value of money and for the credit risk associated with the principal amount outstanding during a particular period of time and for other basic lending risks and costs (e.g. liquidity risk and administrative costs), as well as a profit margin.
In assessing whether the contractual cash flows are SPPI, the sub-funds considers the contractual terms of the instrument. This includes assessing whether the financial asset contains a contractual term that could change the timing or amount of contractual cash flows such that it would not meet this condition. In making this assessment, the sub-funds consider:
• contingent events that would change the amount or timing of cash flows;
• leverage features;
• prepayment and extension features;
• terms that limit the sub-funds’ claim to cash flows from specified assets (e.g. non-recourse features); and
• features that modify consideration for of the time value of money (e.g. periodical reset of interest rates).
51
Notes to the Financial Statements
The sub-funds classify their investments based on the business model and contractual cash flows assessment. Accordingly, the sub-funds classify all their investments, including debt instruments, equity instruments, collective investment schemes and derivatives, into financial assets at FVTPL category. Financial assets measured at amortised cost include dividend receivable, interest receivable, subscription receivable, amounts due from brokers, other receivable and cash and cash equivalents. Financial liabilities that are not at fair value through profit or loss include bank overdraft, redemption payable, amounts due to brokers, distribution payable, tax payables and other payables.
All derivatives in a net receivable position (positive fair value) are reported as financial assets. All derivatives in a net payable position (negative fair value) are reported as financial liabilities.
Reclassifications
Financial assets are not reclassified subsequent to their initial recognition unless the sub-funds were to change its business model for managing financial assets, in which case all affected financial assets would be reclassified on the first day of the first reporting period following the change in the business model.
(B) Policy applicable prior to 1 April 2018
All of the sub-funds’ investments were classified as financial assets or financial liabilities at fair value through profit or loss. This category comprised financial instruments held for trading, which were instruments that the sub-funds had acquired principally for the purpose of short-term profit-taking. These included investments in equities, debt securities, equity-linked instruments, unit trusts and forward contracts.
All derivatives in a net receivable position (positive fair value) were reported as financial assets. All derivatives in a net payable position (negative fair value) were reported as financial liabilities.
Financial assets that were classified as loans and receivables included dividend receivable, interest receivable, subscription receivable, amounts due from brokers and other receivable.
Financial liabilities that were not at fair value through profit or loss included redemption payable, amounts due to brokers, distribution payable, tax payables and other payables.
(ii) Recognition
The sub-funds recognise financial assets and financial liabilities on the date they become a party to the contractual provisions of the instruments.
A regular way purchase or sale of financial assets and financial liabilities is recognised using trade date accounting. From this date, any gains and losses arising from changes in fair value of the financial assets or financial liabilities are recorded.
Financial liabilities are not recognised unless one of the parties has performed their obligations under the contract or the contract is a derivative contract not exempted from the scope of HKFRS 9.
(iii) Measurement
Financial instruments are measured initially at fair value (transaction price). Transaction costs on financial assets and liabilities at fair value through profit or loss are expensed immediately, while those on other financial instruments are amortised.
Subsequent to initial recognition, all instruments classified at fair value through profit or loss are measured at fair value with changes in their fair value recognised in profit or loss in the year in which they arise.
Financial assets classified measured at amortised cost are carried at amortised cost using the effective interest rate method, less impairment losses, if any.
Financial liabilities, other than those at fair value through profit or loss, are measured at amortised cost using the effective interest rate method. Financial liabilities arising from the redeemable units issued by the sub-funds are carried at the redemption amount representing the unitholders’ right to a residual interest in the sub-funds’ assets.

52
Notes to the Financial Statements
(iv) Fair value measurement principles
Fair value is the price that would be received to sell an asset or paid to transfer a liability in an orderly transaction between market participants at the measurement date in the principal or, in its absence, the most advantageous market to which the sub-funds have access at that date. The fair value of a liability reflects its non-performance risk.
When available, the sub-funds measure the fair value of an instrument using the quoted price in an active market for that instrument provided such price is within the bid-ask spread. A market is regarded as active if transactions for the asset or liability take place with sufficient frequency and volume to provide pricing information on an ongoing basis. In circumstances where the quoted price is not within the bid-ask spread, the manager of the sub-funds will determine the points within the bid-ask spreads that are most representative of the fair value.
When there is no quoted price in an active market, the sub-funds use valuation techniques that maximise the use of relevant observable inputs and minimise the use of unobservable inputs. The chosen valuation technique incorporates all the factors that market participants would take into account in pricing a transaction.
The best evidence of the fair value of a financial instrument at initial recognition is normally the transaction price – i.e. the fair value of the consideration given or received. If the sub-funds determine that the fair value at initial recognition differs from the transaction price and the fair value is evidenced neither by a quoted price in an active market for an identical asset or liability nor based on a valuation technique that uses only data from observable markets, the financial instrument is initially measured at fair value, adjusted to defer the difference between the fair value at initial recognition and the transaction price. Subsequently, that difference is recognised in profit or loss on an appropriate basis over the life of the instrument but no later than when the valuation is supported wholly by observable market data or the transaction is closed out.
Portfolios of financial assets and financial liabilities that are exposed to market risk and credit risk that are managed by the sub-funds on the basis of the net
exposure to either market or credit risk, are measured on the basis of a price that would be received to sell a net long position (or paid to transfer a net short position) for a particular risk exposure. Those portfolio-level adjustments are allocated to the individual assets and liabilities on the basis of the relative risk adjustment of each of the individual instruments in the portfolio.
The sub-funds recognise transfers between levels of the fair value hierarchy as at the end of the reporting period during which the change has occurred.
(v) Impairment
(A) Policy applicable from 1 April 2018
The sub-funds recognise loss allowances for expected credit losses (“ECLs”) on financial assets measured at amortised cost.
The sub-funds measure loss allowances at an amount equal to lifetime ECLs, except for the following, which are measured at 12-month ECLs:
• financial assets that are determined to have low credit risk at the reporting date; and
• other financial assets for which credit risk (i.e. the risk of default occurring over the expected life of the asset) has not increased significantly since initial recognition.
When determining whether the credit risk of a financial asset has increased significantly since initial recognition and when estimating ECLs, the sub-funds consider reasonable and supportable information that is relevant and available without undue cost or effort. This includes both quantitative and qualitative information and analysis, based on the sub-funds historical experience and informed credit assessment and including forward-looking information.
The sub-funds assume that the credit risk on a financial asset has increased significantly if it is more than 30 days past due.
The sub-funds consider a financial asset to be in default when:
53
Notes to the Financial Statements
• the borrower is unlikely to pay its credit obligations to the sub-funds in full, without recourse by the sub-funds to actions such as realising security (if any is held); or
• the financial asset is more than 90 days past due.
The sub-funds consider a financial asset to have low credit risk when the credit rating of the counterparty is equivalent to the globally understood definition of ‘investment grade’. The sub-funds consider this to be Baa3 or higher per Moody’s or BBB- or higher per Standard & Poor’s.
Lifetime ECLs are the ECLs that result from all possible default events over the expected life of a financial instrument.
12-month ECLs are the portion of ECLs that result from default events that are possible within the 12 months after the reporting date (or a shorter period if the expected life of the instrument is less than 12 months).
The maximum period considered when estimating ECLs is the maximum contractual period over which the sub-funds is exposed to credit risk.
Measurement of ECLs
ECLs are a probability-weighted estimate of credit losses. Credit losses are measured as the present value of all cash shortfalls (i.e. the difference between the cash flows due to the entity in accordance with the contract and the cash flows that the sub-funds expect to receive). ECLs are discounted at the effective interest rate of the financial asset.
Credit-impaired financial assets
At each reporting date, the sub-funds assess whether financial assets carried at amortised cost are credit-impaired. A financial asset is ‘credit-impaired’ when one or more events that have a detrimental impact on the estimated future cash flows of the financial asset have occurred.
Evidence that a financial asset is credit-impaired includes the following observable data:
• significant financial difficulty of the borrower or issuer;
• a breach of contract such as a default or being more than 90 days past due; or
• it is probable that the borrower will enter bankruptcy or other financial reorganisation.
Presentation of allowance for ECLs in the statement of assets and liabilities
Loss allowances for financial assets measured at amortised cost are deducted from the gross carrying amount of the assets.
Write-off
The gross carrying amount of a financial asset is written off when the sub-funds have no reasonable expectations of recovering a financial asset in its entirety or a portion thereof.
(B) Policy applicable prior 1 April 2018
Financial assets that were stated at cost or amortised cost were reviewed at each date of the statement of assets and liabilities to determine whether there is objective evidence of impairment. If any such indication exists, an impairment loss is recognised in profit or loss as the difference between the asset’s carrying amount and the present value of estimated future cash flows discounted at the financial asset’s original effective interest rate.
If in a subsequent period the amount of an impairment loss recognised on a financial asset carried at amortised cost decreases and the decrease can be linked objectively to an event occurring after the write-down, the write-down was reversed through profit or loss.
(vi) Derecognition
The sub-funds derecognise a financial asset when the contractual rights to receive the cash flows from the financial assets expire or they transfer the financial asset and the transfer qualifies for derecognition in accordance with HKFRS 9.

54
Notes to the Financial Statements
The sub-funds use the weighted average method to determine realised gains and losses on derecognition.
A financial liability is derecognised when the obligation specified in the contract is discharged, cancelled or has expired.
(vii) Offsetting
Financial assets and liabilities are offset and the net amount is reported in the statement of assets and liabilities when, and only when, the sub-funds have a legally enforceable right to offset the recognised amounts and the transactions are intended either to be settled on a net basis or simultaneously, e.g. through a market clearing mechanism.
(viii) Specific instruments
Cash and cash equivalents
Cash and cash equivalents comprise current deposits with banks and short-term highly liquid investments that are readily convertible to known amounts of cash, are subject to an insignificant risk of changes in value, and are held for the purpose of meeting short-term cash commitments rather than for investment or other purposes. Bank overdrafts that are repayable on demand and form an integral part of the company’s cash management are also included as a component of cash and cash equivalents for the purpose of the cash flow statement.
(f) Revenuerecognition
Revenue is recognised in profit or loss as follows:
Dividend income
Dividend income from listed investments is recognised when the share price of the investment goes ex-dividend. Dividends from other investments are recognised in profit or loss as dividend income when declared.
Interest income
Interest income is recognised in profit or loss as it accrues under the effective interest rate method using the rate that exactly discounts estimated future cash receipts through the expected life of the financial asset to the gross carrying amount of the financial asset. Interest income includes interest from cash and cash equivalents. Interest income from financial assets at fair value through profit or loss includes interest from debt securities.
Interest income is recognised on a gross basis, including withholding tax, if any.
(g) Expenses
All expenses are recognised in profit or loss on an accrual basis.
(h) Taxation
Taxation comprises current tax and deferred tax. Current tax and movements in deferred tax assets and liabilities are recognised in the statement of comprehensive income.
Current tax is the expected tax payable on the taxable income for the year, using tax rates enacted or substantively enacted at the date of the statement of assets and liabilities.
Deferred tax liabilities arise from deductible and taxable temporary differences, being the differences between the carrying amounts of assets and liabilities for financial reporting purposes and their tax bases.
Apart from certain limited exceptions, all deferred tax liabilities, and all deferred tax assets to the extent that is probable that future taxable profits will be available against which the asset can be utilised, are recognised.
(i) Structuredentities
A structured entity is an entity that has been designed so that voting or similar rights are not the dominant factor in deciding who controls the entity, such as when any voting rights relate to administrative tasks only and the relevant activities are directed by means of contractual arrangements. A structured entity often has some or all of the following features or attributes: (a) restricted activities; (b) a narrow and well-defined objective, such as to provide investment opportunities for investors by passing on risks and rewards associated with the assets of the structured entity to investors; (c) insufficient equity to permit the structured entity to finance its activities without subordinated financial support; and (d) financing in the form of multiple contractually linked instruments to investors that create concentrations of credit or other risks (tranches).
The sub-funds consider all of their investments in other funds (‘‘underlying funds’’) to be investments in unconsolidated structured entities. The sub-funds invest in underlying funds whose objectives range from achieving medium to long-term capital growth and whose investment strategy does not include the use of leverage.

55
Notes to the Financial Statements
(j) Foreignexchangegainsandlosses
Foreign exchange gains and losses on financial assets and financial liabilities at fair value through profit or loss are recognised together with other changes in the fair value. Included in profit or loss line item Net foreign exchange (loss)/gain are net foreign exchange gains and losses on financial assets and financial liabilities other than those classified as fair value through profit or loss.
(k) Establishmentcost
The establishment costs of the sub-funds consist of costs incurred to establish the sub-funds and enable them legally to do business. The establishment costs are recognised as an expense in the period in which they are incurred.
(l) Relatedparties
(a) A person, or a close member of that person’s family, is related to the Trust if that person:
(i) has control or joint control over the Trust;
(ii) has significant influence over the Trust; or
(iii) is a member of the key management personnel of the Trust.
(b) An entity is related to the Trust if any of the following conditions applies:
(i) The entity and the Trust are members of the same group (which means that each parent, subsidiary and fellow subsidiary is related to the others);
(ii) One entity is an associate or joint venture of the other entity (or an associate or joint venture of a member of a group of which the other entity is a member);
(iii) Both entities are joint ventures of the same third party;
(iv) One entity is a joint venture of a third entity and the other entity is an associate of the third entity;
(v) The entity is a post-employment benefit plan for the benefit of employees of either the Trust or an entity related to the Trust;
(vi) The entity is controlled or jointly controlled by a person identified in (a);
(vii) A person identified in (a)(i) has significant influence over the entity or is a member of the key management personnel of the entity (or of a parent of the entity); or
(viii) The entity, or any member of a group of which it is a part, provides key management personnel services to the Trust.
Close members of the family of a person are those family members who may be expected to influence, or be influenced by, that person in their dealings with the entity.
(m) Subscriptionsandredemptions
The sub-funds recognise unitholders’ subscriptions and allots units upon receipt of a valid subscription application and derecognise them upon receipt of a valid redemption application.
(n) Unitsinissue
The sub-funds classify financial instruments issued as financial liabilities or equity instruments in accordance with the substance of the contractual terms of the instruments.
A puttable financial instrument that includes a contractual obligation for the issuer to repurchase or redeem that instrument for cash or another financial asset is classified as an equity instrument if it meets the following conditions:
(i) it entitles the holder to a pro rata share of the sub-funds’ net assets in the event of the sub-funds’ liquidation;
(ii) it is in the class of instruments that is subordinate to all other classes of instruments;
(iii) all financial instruments in the class of instruments that is subordinate to all other classes of instruments have identical features;
(iv) apart from the contractual obligation for the sub-funds to repurchase or redeem the instrument for cash or another financial asset, the instrument does not include any other features that would require classification as a liability; and
(v) the total expected cash flows attributable to the instrument over its life are based substantially on profit or loss, the change in the recognised net assets or the change in the fair value of the recognised and unrecognised net assets of the sub-funds over the life of the instrument.

56
Notes to the Financial Statements
All sub-funds have multiple classes of redeemable units in issue. All the classes are the most subordinate classes of financial instruments in the respective sub-funds and rank pari passu in all material respects and have the same terms and conditions other than different currencies and management fees rates, and/or different distribution policies, etc. The redeemable units provide unitholders with the right to require redemption for cash at a value proportionate to the unitholders’ share in the sub-funds’ net assets at each redemption date, and also in the event of the sub-funds’ liquidation. The redeemable units of these sub-funds are classified as financial liabilities and are measured at the present value of the redemption amounts.
(o) Distributionstoholdersofredeemableunits
Distributions to holders of redeemable units classified as financial liabilities are recognised in profit or loss as finance costs when they are authorised and no longer at the discretion of the sub-funds.
3 Net(losses)/gainsfromfinancialassetsatfairvaluethroughprofitorloss
2019
HSBCChinaMulti-Asset
IncomeFundHSBCAllChina
BondFund(2)
HKD RMB
Net realised losses (234,808,477) (3,020,213)Net unrealised (losses)/
gains (320,406,316) 7,641,219
(555,214,793) 4,621,006
2019
HSBCAsiaPacificexJapanEquity
VolatilityFocusedFund
HSBCEuroMulti-Asset
IncomeFund
HSBCAsiaHighIncomeBond
Fund(1)
USD EUR USD
Net realised losses (4,362,073) (1,718,507) (47,788,303)Net unrealised gains 146,521 716,354 36,096,221
(4,215,552) (1,002,153) (11,692,082)
2018
HSBCChinaMulti-Asset
IncomeFundHSBCAllChina
BondFund(2)
HKD RMB
Net realised gains/(losses) 222,936,259 (1,562,389)Net unrealised gains/
(losses) 572,805,635 (2,056,026)
795,741,894 (3,618,415)
2018
HSBCAsiaPacificexJapanEquity
VolatilityFocusedFund
HSBCEuroMulti-Asset
IncomeFund
HSBCAsiaHighIncomeBond
Fund(1)
USD EUR USD
Net realised gains/(losses) 10,082,959 1,816,004 (9,210,869)
Net unrealised losses (3,600,244) (2,660,553) (20,333,103)
6,482,715 (844,549) (29,543,972)
(1) The date of commencement for HSBC Asia High Income Bond Fund was 27 February 2017.
(2) The HSBC All China Bond Fund is formerly known as “HSBC RQFII Chinese Fixed Income Fund”.
4 Taxation
No provision for Hong Kong Profits Tax has been made in the financial statements as the sub-funds are exempted from taxation under section 26A (1A) of the Hong Kong Inland Revenue Ordinance.
Capital gains, interest and dividend income received by the sub-funds may be subject to non-recoverable withholding tax imposed in the country of origin. Capital gains and investment income are recorded gross of such taxes and the withholding tax is recognised in profit or loss as taxation expenses as incurred.
Under the current general provisions of the PRC Corporate Income Tax (“CIT”) Law and published tax circulars, the sub-funds would be subject to PRC withholding tax at the rate of 10% in respect of its PRC sourced income earned, including capital gains realised on the sales of PRC A Shares, B Shares, H Shares listed companies and PRC bonds, dividend income derived from PRC A Shares, B Shares and H Shares listed companies and interest income earned in

57
Notes to the Financial Statements
respect of PRC bank deposits and corporate bonds. This withholding taxation basis should apply as it is intended that the sub-funds would be managed and operated in such a manner that it would not be considered a tax resident enterprise in China or otherwise as having a taxable permanent establishment in the PRC. The 10% withholding tax rate may be further reduced under an applicable tax treaty which the PRC has entered into with the jurisdiction in which the beneficial owner of the relevant income is a resident.
The Explanatory Memorandum of the sub-funds give the Manager the right to provide for withholding tax on such gains or income and withhold the tax for the account of the sub-funds. On the basis of the available information, the Manager has determined that it is appropriate to provide for PRC taxation at the withholding tax rate of 10% on realised gains on PRC bonds, dividend income from A Shares, B Shares and H Shares, and interest income from PRC bank deposits and corporate bonds in the financial statements.
Effective from 14 November 2014, the Ministry of Finance (“MOF”), the State Administration of Tax (“SAT”) and the China Securities Regulatory Commission have jointly promulgated the Circular Concerning the Temporary Exemption of the Enterprise Income Tax for Gains Earned by Qualified Foreign Institutional Investors and Renminbi Qualified Foreign Institutional Investors from the Transfer of Domestic Shares and Other Equity Interest Investment in China and Circular on the Taxation Policy of the Pilot Programme for the Mutual Stock Market Access between Shanghai and Hong Kong Stock Markets.
As a result of the announcement of the Circulars the sub-funds will not withhold 10% of realised and unrealised gains on their investments in China A-Shares Access Products and China A-Shares through Shanghai-Hong Kong Stock Connect as tax provisions.
For the HSBC All China Bond Fund (formerly known as HSBC RQFII Chinese Fixed Income Fund) (“CFIF”), the Manager after making assessment and having taken and considered independent professional tax advice and acting based on such advice, considered that CFIF should qualify as a Hong Kong tax resident. The Manager then issued a notice on 11 January 2016 to inform CFIF’s unitholders that as from 21 December 2015, no tax provision would be made on the gross realised and unrealised capital gains derived from the disposal of investment in PRC onshore bonds, and the tax provisions previously made in respect of CFIF’s investments would be reversed.
In November 2018, the MOF and the SAT jointly issued [Caishui [2018] No. 108] (“Circular 108”) which provides that foreign institutional investors are exempted from Mainland China CIT and VAT in respect of bond interest income received from 7 November 2018 to 6 November 2021 (“Tax Exempt Period”) from investments in the Mainland China onshore bond market.
Such CIT exemption does not apply to foreign institutional investors having “an establishment or place of business” or “permanent establishment” in Mainland China and deriving bond interest income therefrom.
Based on the prevailing VAT regulations, coupon interest derived by a sub-fund from Mainland China onshore non-government bonds and offshore bonds issued by Mainland China tax resident companies (“relevant bonds”) should be subject to VAT at 6% plus local surcharges from 1 May 2016.
Taxation in statement of comprehensive income represents:
2019
HSBCChinaMulti-Asset
IncomeFundHSBCAllChina
BondFund(2)
HKD RMB
PRC withholding tax (6,165,143) 73,374Overseas withholding tax – –Overseas capital gain tax – –Value-added tax – (194,068)
(6,165,143) (120,694)
2019
HSBCAsiaPacificexJapanEquity
VolatilityFocusedFund
HSBCEuroMulti-Asset
IncomeFund
HSBCAsiaHighIncomeBond
Fund(1)
USD EUR USD
PRC withholding tax – – –Overseas withholding tax (314,646) (381,676) (57,508)Overseas capital gain tax (26,905) (11,588) (91,114)Value-added tax – – (7,657)
(341,551) (393,264) (156,279)

58
Notes to the Financial Statements
2018
HSBCChinaMulti-Asset
IncomeFundHSBCAllChina
BondFund(2)
HKD RMB
PRC withholding tax (2,642,113) (786,054)Overseas withholding tax – –Overseas capital gain tax – (2,209)Value-added tax – (933,216)
(2,642,113) (1,721,479)
2018
HSBCAsiaPacificexJapanEquity
VolatilityFocusedFund
HSBCEuroMulti-Asset
IncomeFund
HSBCAsiaHighIncomeBond
Fund(1)
USD EUR USD
PRC withholding tax – – –Overseas withholding tax (193,997) (248,747) (387,841)Overseas capital gain tax (30,317) 5,313 (128,698)Value-added tax – – –
(224,314) (243,434) (516,539)
(1) The date of commencement for HSBC Asia High Income Bond Fund was 27 February 2017.
(2) The HSBC All China Bond Fund is formerly known as “HSBC RQFII Chinese Fixed Income Fund”.
5 Financialassetsandfinancialliabilitiesatfairvaluethroughprofitorloss
2019
HSBCChinaMulti-Asset
IncomeFundHSBCAllChina
BondFund(2)
HKD RMB
Financialassetsatfairvaluethroughprofitorloss
Equities
Listed shares 2,310,004,709 –
Debtsecurities
Listed bonds 2,008,002,921 127,896,344Unlisted but quoted bonds 39,338,702 –
2,047,341,623 127,896,344
Otherinvestments
Equity-linkedinstruments
Unlisted but quoted investment funds 39,787,867 –
Others
Foreign currency forward contracts 10,394,254 –
50,182,121 –
4,407,528,453 127,896,344
Financialliabilitiesatfairvaluethroughprofitorloss
Otherinvestments
Foreign currency forward contracts (24,427,936) –
4,383,100,517 127,896,344
Investments, at cost 4,134,274,720 127,061,573Net unrealised appreciation
in value of investments 248,825,797 834,771
Investments, at fair value 4,383,100,517 127,896,344
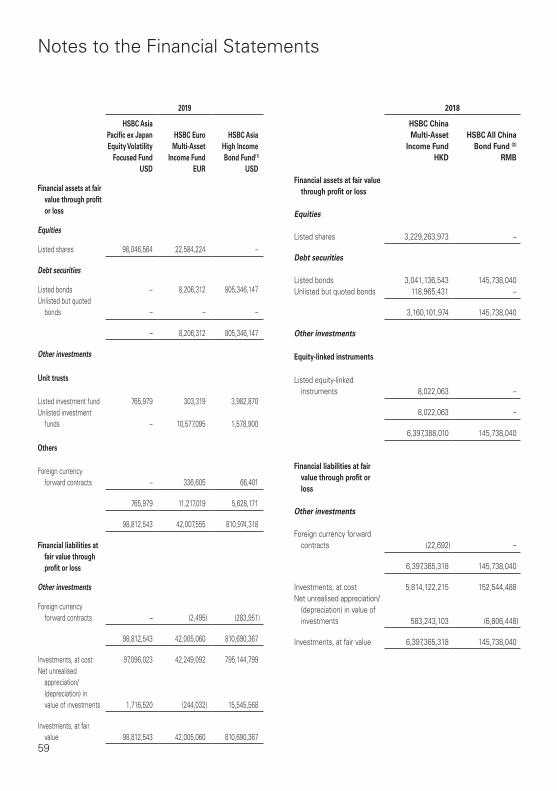
59
Notes to the Financial Statements
2019
HSBCAsiaPacificexJapanEquityVolatility
FocusedFund
HSBCEuroMulti-Asset
IncomeFund
HSBCAsiaHighIncomeBondFund(1)
USD EUR USD
Financialassetsatfairvaluethroughprofitorloss
Equities
Listed shares 98,046,564 22,584,224 –
Debtsecurities
Listed bonds – 8,206,312 805,346,147Unlisted but quoted
bonds – – –
– 8,206,312 805,346,147
Otherinvestments
Unittrusts
Listed investment fund 765,979 303,319 3,982,870Unlisted investment
funds – 10,577,095 1,578,900
Others
Foreign currency forward contracts – 336,605 66,401
765,979 11,217,019 5,628,171
98,812,543 42,007,555 810,974,318
Financialliabilitiesatfairvaluethroughprofitorloss
Otherinvestments
Foreign currency forward contracts – (2,495) (283,951)
98,812,543 42,005,060 810,690,367
Investments, at cost 97,096,023 42,249,092 795,144,799Net unrealised
appreciation/(depreciation) in value of investments 1,716,520 (244,032) 15,545,568
Investments, at fair value 98,812,543 42,005,060 810,690,367
2018
HSBCChinaMulti-Asset
IncomeFundHSBCAllChina
BondFund(2)
HKD RMB
Financialassetsatfairvaluethroughprofitorloss
Equities
Listed shares 3,229,263,973 –
Debtsecurities
Listed bonds 3,041,136,543 145,738,040Unlisted but quoted bonds 118,965,431 –
3,160,101,974 145,738,040
Otherinvestments
Equity-linkedinstruments
Listed equity-linked instruments 8,022,063 –
8,022,063 –
6,397,388,010 145,738,040
Financialliabilitiesatfairvaluethroughprofitorloss
Otherinvestments
Foreign currency forward contracts (22,692) –
6,397,365,318 145,738,040
Investments, at cost 5,814,122,215 152,544,488Net unrealised appreciation/
(depreciation) in value of investments 583,243,103 (6,806,448)
Investments, at fair value 6,397,365,318 145,738,040

60
Notes to the Financial Statements
2018
HSBCAsiaPacificexJapanEquityVolatility
FocusedFund
HSBCEuroMulti-Asset
IncomeFund
HSBCAsiaHighIncomeBondFund(1)
USD EUR USD
Financialassetsatfairvaluethroughprofitorloss
Equities
Listed shares 126,029,736 37,370,061 –
Debtsecurities
Listed bonds – 12,208,668 1,263,869,657Unlisted but quoted
bonds – – –
– 12,208,668 1,263,869,657
Otherinvestments
Unittrusts
Listed investment fund – 506,872 9,092,176Unlisted investment
funds – 14,962,147 –
Others
Foreign currency forward contracts – 225,641 2,448
– 15,694,660 9,094,624
126,029,736 65,273,389 1,272,964,281
Financialliabilitiesatfairvaluethroughprofitorloss
Otherinvestments
Foreign currency forward contracts – (27,262) (438,964)
126,029,736 65,246,127 1,272,525,317
Investments, at cost 124,459,737 66,342,244 1,293,294,936Net unrealised
appreciation/(depreciation) in value of investments 1,569,999 (1,096,117) (20,769,619)
Investments, at fair value 126,029,736 65,246,127 1,272,525,317
(1) The date of commencement for HSBC Asia High Income Bond Fund was 27 February 2017.
(2) The HSBC All China Bond Fund is formerly known as “HSBC RQFII Chinese Fixed Income Fund”.
6 Relatedpartytransactions
The following is a summary of significant related party transactions or transactions entered into during the year/period between the Trust and the Trustee, the Manager and their Connected Persons. Connected Persons are those as defined in the Code issued by the SFC. All transactions during the year/period between the Trust and the Manager and its Connected Persons were entered into in the ordinary course of business and under normal commercial terms. To the best of the knowledge of the Trustee and the Manager, the sub-funds do not have any other transactions with Connected Persons except for those disclosed below.
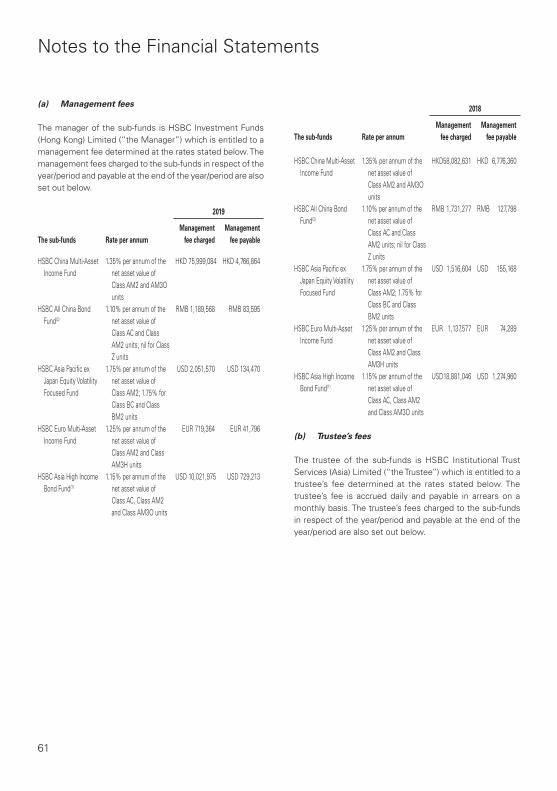
61
Notes to the Financial Statements
(a) Managementfees
The manager of the sub-funds is HSBC Investment Funds (Hong Kong) Limited (“the Manager”) which is entitled to a management fee determined at the rates stated below. The management fees charged to the sub-funds in respect of the year/period and payable at the end of the year/period are also set out below.
2019
Thesub-funds RateperannumManagement
feechargedManagement
feepayable
HSBC China Multi-Asset Income Fund
1.35% per annum of the net asset value of Class AM2 and AM3O units
HKD 75,999,084 HKD 4,766,864
HSBC All China Bond Fund(2)
1.10% per annum of the net asset value of Class AC and Class AM2 units; nil for Class Z units
RMB 1,189,568 RMB 83,595
HSBC Asia Pacific ex Japan Equity Volatility Focused Fund
1.75% per annum of the net asset value of Class AM2; 1.75% for Class BC and Class BM2 units
USD 2,051,570 USD 134,470
HSBC Euro Multi-Asset Income Fund
1.25% per annum of the net asset value of Class AM2 and Class AM3H units
EUR 719,364 EUR 41,796
HSBC Asia High Income Bond Fund(1)
1.15% per annum of the net asset value of Class AC, Class AM2 and Class AM3O units
USD 10,021,975 USD 729,213
2018
Thesub-funds RateperannumManagement
feechargedManagement
feepayable
HSBC China Multi-Asset Income Fund
1.35% per annum of the net asset value of Class AM2 and AM3O units
HKD 58,082,631 HKD 6,776,360
HSBC All China Bond Fund(2)
1.10% per annum of the net asset value of Class AC and Class AM2 units; nil for Class Z units
RMB 1,731,277 RMB 127,798
HSBC Asia Pacific ex Japan Equity Volatility Focused Fund
1.75% per annum of the net asset value of Class AM2; 1.75% for Class BC and Class BM2 units
USD 1,516,604 USD 155,168
HSBC Euro Multi-Asset Income Fund
1.25% per annum of the net asset value of Class AM2 and Class AM3H units
EUR 1,137,577 EUR 74,289
HSBC Asia High Income Bond Fund(1)
1.15% per annum of the net asset value of Class AC, Class AM2 and Class AM3O units
USD 18,881,046 USD 1,274,960
(b) Trustee’sfees
The trustee of the sub-funds is HSBC Institutional Trust Services (Asia) Limited (“the Trustee”) which is entitled to a trustee’s fee determined at the rates stated below. The trustee’s fee is accrued daily and payable in arrears on a monthly basis. The trustee’s fees charged to the sub-funds in respect of the year/period and payable at the end of the year/period are also set out below.

62
Notes to the Financial Statements
Rateperannumofthenetassetvalueofthesub-fund
Thesub-fundsFrom
3July2018
From1July2017to3July2018
Until30June2017
HSBC China Multi-Asset Income Fund 0.07% 0.07% 0.10%
HSBC All China Bond Fund(2) 0.07% 0.15% 0.16%HSBC Asia Pacific ex Japan
Equity Volatility Focused Fund 0.07% 0.07% 0.10%
HSBC Euro Multi-Asset Income Fund 0.07% 0.07% 0.10%
HSBC Asia High Income Bond Fund(1) 0.07% 0.07% 0.10%
2019
Thesub-fundsTrustee’s
feechargedTrustee’s
feepayable
HSBC China Multi-Asset Income Fund HKD 4,573,317 HKD 287,598
HSBC All China Bond Fund(2) RMB 870,068 RMB 49,430HSBC Asia Pacific ex Japan
Equity Volatility Focused Fund USD 133,554 USD 13,779
HSBC Euro Multi-Asset Income Fund EUR 159,724 EUR 6,660
HSBC Asia High Income Bond Fund(1) USD 879,545 USD 58,037
2018
Thesub-fundsTrustee’s
feechargedTrustee’s
feepayable
HSBC China Multi-Asset Income Fund HKD 3,820,897 HKD 351,326
HSBC All China Bond Fund(2) RMB 969,269 RMB 17,427HSBC Asia Pacific ex Japan
Equity Volatility Focused Fund USD 115,604 USD 10,406
HSBC Euro Multi-Asset Income Fund EUR 202,415 EUR 14,362
HSBC Asia High Income Bond Fund(1) USD 1,510,431 USD 104,675
During the year/period, the rebated trustee’s fee by the Trustee to the sub-funds recognised as other income in the statement of comprehensive income are set out below.
Rebatedtrustee’sfee
Thesub-funds 2019 2018
HSBC China Multi-Asset Income Fund HKD – HKD 5,146,748
HSBC All China Bond Fund(2) RMB – RMB 90,257HSBC Asia Pacific ex Japan
Equity Volatility Focused Fund USD – USD 84,902
HSBC Euro Multi-Asset Income Fund EUR – EUR 70,147
HSBC Asia High Income Bond Fund(1) USD – USD 218,939
During the year/period, safe custody fees and bank charges charged to the sub-funds by HSBC Institutional Trust Services (Asia) Limited, the Trustee, and Bank of Communications Co., Ltd., respectively, on purchases and sales of investments and sub-custody of investments and corresponding payable at the end of the year/period are set out below.
2019
Safecustodyfeesandbankcharges
charged
Safecustodyfeesandbankcharges
payable
HSBC China Multi-Asset Income Fund HKD 844,138 HKD 62,055
HSBC All China Bond Fund(2) RMB 24,617 RMB 5,647HSBC Asia Pacific ex Japan
Equity Volatility Focused Fund USD 40,656 USD 2,872
HSBC Euro Multi-Asset Income Fund EUR 2,656 EUR 351
HSBC Asia High Income Bond Fund(1) USD 55,215 USD 4,762

63
Notes to the Financial Statements
2018
Safecustodyfeesandbankcharges
charged
Safecustodyfeesandbankcharges
payable
HSBC China Multi-Asset Income Fund HKD 856,797 HKD 116,483
HSBC All China Bond Fund(2) RMB 10,724 RMB 7,824HSBC Asia Pacific ex Japan
Equity Volatility Focused Fund USD 38,118 USD 12,139
HSBC Euro Multi-Asset Income Fund EUR 11,615 EUR 4,460
HSBC Asia High Income Bond Fund(1) USD 184,533 USD 7,825
(c) Registrar’sfees
Until 30 June 2017, HSBC Institutional Trust Services (Asia) Limited was entitled to a registrar’s fee determined at the rates stated below. The registrar’s fees charged to the sub-funds in respect of the year/period and payable at the end of the year/period are set out below.
2019
Thesub-funds FeerateRegistrar’s
feechargedRegistrar’s
feepayable
HSBC China Multi-Asset Income Fund
HKD15,000 per annum and HKD150 per transaction
HKD – HKD –
HSBC All China Bond Fund(2)
RMB15,000 per annum and RMB125 per transaction
RMB – RMB –
HSBC Asia Pacific ex Japan Equity Volatility Focused Fund
USD3,300 per annum and USD20 per transaction
USD – USD –
HSBC Euro Multi-Asset Income Fund
EUR1,800 per annum and EUR18 per transaction
EUR – EUR –
HSBC Asia High Income Bond Fund(1)
USD3,300 per annum and USD20 per transaction
USD – USD –
2018
Thesub-funds FeerateRegistrar’s
feechargedRegistrar’s
feepayable
HSBC China Multi-Asset Income Fund
HKD15,000 per annum and HKD150 per transaction
HKD 160,572 HKD –
HSBC All China Bond Fund(2)
RMB15,000 per annum and RMB125 per transaction
RMB 9,514 RMB –
HSBC Asia Pacific ex Japan Equity Volatility Focused Fund
USD3,300 per annum and USD20 per transaction
USD 13,516 USD –
HSBC Euro Multi-Asset Income Fund
EUR1,800 per annum and EUR18 per transaction
EUR 13,418 EUR –
HSBC Asia High Income Bond Fund(1)
USD3,300 per annum and USD20 per transaction
USD 50,336 USD –
(d) Transferagencyfees
From 1 July 2017, HSBC Institutional Trust Services (Asia) Limited charges transfer agency fees determined at USD120 per share class per month, USD10-18 per transaction and additional fees for various transfer agency functions. The transfer agency fees charged to the sub-funds in respect of the year/period and payable at the end of the year/period are also set out below.
2019
Thesub-fundsTransferagency
feechargedTransferagency
feepayable
HSBC China Multi-Asset Income Fund HKD 502,608 HKD 40,429
HSBC All China Bond Fund(2) RMB 295,012 RMB 22,638HSBC Asia Pacific ex Japan
Equity Volatility Focused Fund USD 36,610 USD 3,896
HSBC Euro Multi-Asset Income Fund EUR 39,733 EUR 2,979
HSBC Asia High Income Bond Fund(1) USD 97,878 USD 10,418

64
Notes to the Financial Statements
2018
Thesub-fundsTransferagency
feechargedTransferagency
feepayable
HSBC China Multi-Asset Income Fund HKD 844,127 HKD 69,460
HSBC All China Bond Fund(2) RMB 121,648 RMB 23,140HSBC Asia Pacific ex Japan
Equity Volatility Focused Fund USD 28,021 USD 3,234
HSBC Euro Multi-Asset Income Fund EUR 32,027 EUR 3,028
HSBC Asia High Income Bond Fund(1) USD 122,170 USD 9,260
(e) Bankaccountsanddepositswithrelatedparties
Bank accounts are maintained and deposits are made with The Hong Kong and Shanghai Banking Corporation Limited, a member of HSBC Group, margin account is maintained with HSBC Bank Plc, a member of HSBC Group and Bank of Communications Co., Ltd., the RQFII custodian of HSBC All China Bond Fund (formerly known as HSBC RQFII Chinese Fixed Income Fund). Details of such balances and deposits held as at 31 March 2019 and interest income earned from the deposits during the year/period then ended are shown below.
2019
HSBCChinaMulti-Asset
IncomeFundHSBCAllChina
BondFund(2)
HKD RMB
HSBC Group– cash at bank 29,733,675 263,874– margin deposits – –– bank overdraft – –– interest income earned
from deposits 114,456 8,526Bank of Communications
Co., Ltd.– cash at bank – 596,095– interest income earned
from deposits – 6,452
2019
HSBCAsiaPacific
exJapanEquityVolatility
FocusedFund
HSBCEuroMulti-Asset
IncomeFund
HSBCAsiaHighIncomeBondFund(1)
USD EUR USD
HSBC Group– cash at bank 317,576 3,749,057 6,616,593– margin deposits – – 323,245– bank overdraft (130,941) (68,915) –– interest income
earned from deposits 5,746 2,378 93,196
Bank of Communications Co., Ltd.
– cash at bank – – –– interest income
earned from deposits – – –
2018
HSBCChinaMulti-Asset
IncomeFundHSBCAllChina
BondFund(2)
HKD RMB
HSBC Group– cash at bank 47,538,337 –– margin deposits – –– bank overdraft (7,538) –– interest income earned
from deposits 24,776 –Bank of Communications
Co., Ltd.– cash at bank – 353,261– interest income earned
from deposits – 21,232

65
Notes to the Financial Statements
2018
HSBCAsiaPacific
exJapanEquityVolatility
FocusedFund
HSBCEuroMulti-Asset
IncomeFund
HSBCAsiaHighIncomeBondFund(1)
USD EUR USD
HSBC Group– cash at bank 903,296 788,564 24,131,700– margin deposits – – –– bank overdraft (5,585) – (5,207)– interest income
earned from deposits 1,126 991 43,061
Bank of Communications Co., Ltd.
– cash at bank – – –– interest income
earned from deposits – – –
(1) The date of commencement for HSBC Asia High Income Bond Fund was 27 February 2017.
(2) The HSBC All China Bond Fund is formerly known as “HSBC RQFII Chinese Fixed Income Fund”.
(f) Investmenttransactionswithrelatedparties
In their purchases and sales of investments, the sub-funds utilise the services of The Hong Kong and Shanghai Banking Corporation Limited and HSBC Investment Funds Hong Kong Ltd, members of HSBC Group, and Bank of Communications Co., Ltd., the RQFII custodian of HSBC All China Bond Fund (formerly known as HSBC RQFII Chinese Fixed Income Fund). Details of such transactions executed and fees paid during the year/period ended 31 March 2019 are shown below.
HSBCChinaMulti-AssetIncomeFund
Yearended31March2019
Yearended31March2018
HKD HKD
The Hong Kong and Shanghai Banking Corporation Limited
Total aggregate value of such transactions for the year 1,127,402,600 1,106,102,888
Percentage of such transactions in value to total transactions for the year 10.37% 8.22%
Commissions paid for the year 661,481 517,749Average rate of commission 0.06% 0.05%Amounts due from brokers as at
31 March 2019 11,723,013 –Amounts due to brokers as at 31
March 2019 – 41,251,122
HSBCAllChinaBondFund (formerlyknownasHSBCRQFIIChineseFixedIncomeFund)
Yearended31March2019
Yearended31March2018
RMB RMB
Bank of Communications Co., Ltd.Total aggregate value of such
transactions for the year 109,119,280 59,134,740Percentage of such transactions in
value to total transactions for the year 52.04% 97.70%
Commissions paid for the year – –Average rate of commission – –
The Hong Kong and Shanghai Banking Corporation Limited
Total aggregate value of such transactions for the year 12,679,313 –
Percentage of such transactions in value to total transactions for the year 6.05% –
Commissions paid for the year – –Average rate of commission – –

66
Notes to the Financial Statements
HSBCAsiaPacificexJapanEquityVolatilityFocusedFund
Yearended31March2019
Yearended31March2018
USD USD
The Hong Kong and Shanghai Banking Corporation Limited
Total aggregate value of such transactions for the year 26,868,673 10,062,495
Percentage of such transactions in value to total transactions for the year 7.54% 3.60%
Commissions paid for the year 43,534 7,672Average rate of commission 0.16% 0.08%Amounts due from brokers as at
31 March 2019 – –Amounts due to brokers as at 31
March 2019 – –
HSBCEuroMulti-AssetIncomeFund
Yearended31March2019
Yearended31March2018
EUR EUR
The Hong Kong and Shanghai Banking Corporation Limited
Total aggregate value of such transactions for the period 68,611,867 11,946,463
Percentage of such transactions in value to total transactions for the year 71.92% 4.77%
Commissions paid for the year 3,987 7,230Average rate of commission 0.01% 0.06%Amount due from brokers as at 31
March 2019 – –Amount due to brokers as at 31
March 2019 – –
HSBCAsiaHighIncomeBondFund
Yearended31March2019
Periodfrom27February2017(commencementofoperations)to
31March2018USD USD
The Hong Kong and Shanghai Banking Corporation Limited
Total aggregate value of such transactions for the period 411,059,047 787,730,737
Percentage of such transactions in value to total transactions for the period 11.75% 11.60%
Commissions paid for the year/period 1,584 –
Average rate of commission 0.00% –Amounts due from brokers as at
31 March 2019 – 2,548,603Amounts due to brokers as at 31
March 2019 – –
The figures for commissions paid do not include any trade margin which may be reflected in the market price of transactions with these entities or any transactions by the sub-funds during the year/period.
Yearended31March2019
Periodfrom27February2017(commencementofoperations)to
31March2018USD USD
HSBC Investment Funds Hong Kong Ltd
Total aggregate value of such transactions for the period 28,429,617 28,162,258
Percentage of such transactions in value to total transactions for the period 0.81% 0.41%
Commissions paid for the year/period – –
Average rate of commission – –Amounts due from brokers as at
31 March 2019 – –Amounts due to brokers as at 31
March 2019 – –

67
Notes to the Financial Statements
7 Cashandcashequivalents
2019
HSBCChinaMulti-Asset
IncomeFundHSBCAllChina
BondFundHKD RMB
Cash at bank 29,733,675 859,969
Cash and cash equivalents in the statement of assets and liabilities 29,733,675 859,969
Bank overdraft – –
Cash and cash equivalents in the cash flow statement 29,733,675 859,969
2019
HSBCAsiaPacific
exJapanEquity
VolatilityFocusedFund
HSBCEuroMulti-Asset
IncomeFund
HSBCAsiaHighIncome
BondFundUSD EUR USD
Cash at bank 317,576 3,749,057 6,616,593
Cash and cash equivalents in the statement of assets and liabilities 317,576 3,749,057 6,616,593
Bank overdraft (130,941) (68,915) –
Cash and cash equivalents in the cash flow statement 186,635 3,680,142 6,616,593
2018
HSBCChinaMulti-Asset
IncomeFundHSBCAllChina
BondFundHKD RMB
Cash at bank 81,296,793 353,261
Cash and cash equivalents in the statement of assets and liabilities 81,296,793 353,261
Bank overdraft (7,538) –
Cash and cash equivalents in the cash flow statement 81,289,255 353,261
2018
HSBCAsiaPacific
exJapanEquity
VolatilityFocusedFund
HSBCEuroMulti-Asset
IncomeFund
HSBCAsiaHighIncome
BondFundUSD EUR USD
Cash at bank 903,296 788,564 24,131,700
Cash and cash equivalents in the statement of assets and liabilities 903,296 788,564 24,131,700
Bank overdraft (5,585) – (5,207)
Cash and cash equivalents in the cash flow statement 897,711 788,564 24,126,493

68
Notes to the Financial Statements
8 Unitsissuedandredeemed
HSBCChinaMulti-AssetIncomeFund
2019
ClassAM2–USDunits
ClassAM2–RMBunits
ClassAM2–HKDunits
ClassAM3O–AUDunits
ClassAM3O–SGDunits Total
Number of units in issue at 1 April 34,769,009 27,542,142 206,158,343 56,611 – 268,526,105Subscriptions of units during the year 27,207,781 12,950,097 141,419,493 3,576,236 22,514 185,176,121Redemptions of units during the year (35,492,160) (20,093,218) (212,531,609) (2,133,613) (7,525) (270,258,125)
Number of units in issue at 31 March 26,484,630 20,399,021 135,046,227 1,499,234 14,989 183,444,101
2018
ClassAM2–USDunits
ClassAM2–RMBunits
ClassAM2–HKDunits
ClassAM3O–AUDunits Total
Number of units in issue at 1 April 17,655,543 15,428,935 138,538,831 – 171,623,309Subscriptions of units during the year 55,028,818 24,346,640 326,236,945 56,611 405,669,014Redemptions of units during the year (37,915,352) (12,233,433) (258,617,433) – (308,766,218)
Number of units in issue at 31 March 34,769,009 27,542,142 206,158,343 56,611 268,526,105
HSBCAllChinaBondFund(formerlyknownasHSBCRQFIIChineseFixedIncomeFund)(2)
2019
ClassAC–USDunits
ClassAM2–USDunits
ClassAC–RMBunits
ClassAM2–RMBunits
ClassAM2–HKDunits
ClassZC–USDunits Total
Number of units in issue at 1 April 148,459 502,422 3,192,574 4,664,253 1,203,161 – 9,710,869Subscriptions of units during the year – – – 680,073 – 450,000 1,130,073Redemptions of units during the year (128,445) (67,800) (954,817) (1,550,482) (544,814) – (3,246,358)
Number of units in issue at 31 March 20,014 434,622 2,237,757 3,793,844 658,347 450,000 7,594,584
2018
ClassAC–USDunits
ClassAM2–USDunits
ClassAC–RMBunits
ClassAM2–RMBunits
ClassAM2–HKDunits Total
Number of units in issue at 1 April 172,682 958,025 2,265,430 4,716,994 2,518,625 10,631,756Subscriptions of units during the year – – 2,882,457 1,116,965 – 3,999,422Redemptions of units during the year (24,223) (455,603) (1,955,313) (1,169,706) (1,315,464) (4,920,309)
Number of units in issue at 31 March 148,459 502,422 3,192,574 4,664,253 1,203,161 9,710,869

69
Notes to the Financial Statements
HSBCAsiaPacificexJapanEquityVolatilityFocusedFund
2019
ClassAM2–USDunits
ClassAM2–HKDunits
ClassBC–HKDunits
ClassBC–RMBunits
ClassBC–USDunits
ClassBM2–HKDunits
ClassBM2–USDunits
ClassBM2–RMBunits Total
Number of units in issue at 1 April 8,894,302 26,427,906 – – – – – – 35,322,208Subscriptions of units during the year 6,107,988 32,712,739 110,922 846,306 207,593 329,993 124,265 986,397 41,426,203Redemptions of units during the year (8,684,924) (35,233,228) – – – – – – (43,918,152)
Number of units in issue at 31 March 6,317,366 23,907,417 110,922 846,306 207,593 329,993 124,265 986,397 32,830,259
2018
ClassAM2–USDunits
ClassAM2–HKDunits Total
Number of units in issue at 1 April 5,534,311 23,899,412 29,433,723Subscriptions of units during the year 13,170,647 52,485,058 65,655,705Redemptions of units during the year (9,810,656) (49,956,564) (59,767,220)
Number of units in issue at 31 March 8,894,302 26,427,906 35,322,208
HSBCEuroMulti-AssetIncomeFund
2019
ClassAM3H–USDunits
ClassAM3H–RMBunits
ClassAM3H–HKDunits
ClassAM2–EURunits
ClassAM3H–AUDunits
ClassAM3H–CADunits
ClassAM3H–NZDunits Total
Number of units in issue at 1 April 3,858,079 1,933,848 19,408,058 546,087 557,891 285,561 322,105 26,911,629Subscriptions of units during the year 2,946,134 2,817,854 10,638,904 340,742 1,372,936 247,139 1,492,005 19,855,714Redemptions of units during the year (4,745,795) (2,538,515) (20,923,015) (354,606) (1,053,499) (245,896) (1,529,741) (31,391,067)
Number of units in issue at 31 March 2,058,418 2,213,187 9,123,947 532,223 877,328 286,804 284,369 15,376,276
2018
ClassAM3H–USDunits
ClassAM3H–RMBunits
ClassAM3H–HKDunits
ClassAM2–EURunits
ClassAM3H–AUDunits
ClassAM3H–CADunits
ClassAM3H–NZDunits Total
Number of units in issue at 1 April 1,213,610 618,303 7,402,636 183,334 213,252 243,727 45,134 9,919,996Subscriptions of units during the year 9,712,621 2,583,479 65,453,767 674,467 1,428,532 1,418,670 1,180,819 82,452,355Redemptions of units during the year (7,068,152) (1,267,934) (53,448,345) (311,714) (1,083,893) (1,376,836) (903,848) (65,460,722)
Number of units in issue at 31 March 3,858,079 1,933,848 19,408,058 546,087 557,891 285,561 322,105 26,911,629

70
Notes to the Financial Statements
HSBCAsiaHighIncomeBondFund(1)
2019
ClassAC–USDunits
ClassAM2–USDunits
ClassAM2–RMBunits
ClassAM3O–RMBunits
ClassAM2–HKDunits
ClassAM2–EURunits
ClassAM3O–EURunits
ClassAM2–AUDunits
Number of units in issue at 1 April 49,505 70,577,831 529,897 6,337,592 441,202,765 48,749 40,770 199,186Subscriptions of units during the year 361,161 21,842,137 1,349,765 13,305,388 133,466,111 45,545 289,817 1,421,885Redemptions of units during the year (134,292) (48,946,406) (252,498) (5,698,827) (327,145,853) (24,945) (285,277) (574,624)
Number of units in issue at 31 March 276,374 43,473,562 1,627,164 13,944,153 247,523,023 69,349 45,310 1,046,447
2019
ClassAM3O–AUDunits
ClassAM2–CADunits
ClassAM3O–CADunits
ClassAM3O–GBPunits
ClassAM3O–SGDunits Total
Number of units in issue at 1 April 3,019,665 95,396 1,145,923 548,465 100 523,795,844Subscriptions of units during the year 7,964,729 451,129 3,062,237 749,142 – 184,309,046Redemptions of units during the year (5,830,197) (122,782) (1,794,008) (537,313) – (391,347,022)
Number of units in issue at 31 March 5,154,197 423,743 2,414,152 760,294 100 316,757,868
2018
ClassAC–USDunits
ClassAM2–USDunits
ClassAM2–RMBunits
ClassAM3O–RMBunits
ClassAM2–HKDunits
ClassAM2–EURunits
ClassAM3O–EURunits
ClassAM2–AUDunits
Number of units in issue at 27 February 2017 (commencement of operations) – – – – – – – –
Subscriptions of units during the period 49,505 180,331,320 3,478,261 7,784,886 1,062,485,661 87,303 47,816 770,508Redemptions of units during the period – (109,753,489) (2,948,364) (1,447,294) (621,282,896) (38,554) (7,046) (571,322)
Number of units in issue at 31 March 49,505 70,577,831 529,897 6,337,592 441,202,765 48,749 40,770 199,186
2018
ClassAM3O–AUDunits
ClassAM2–CADunits
ClassAM3O–CADunits
ClassAM3O–GBPunits
ClassAM3O–SGDunits Total
Number of units in issue 27 February 2017 (commencement of operations) – – – – – –
Subscriptions of units during the period 5,753,285 303,544 1,350,678 847,786 100 1,263,290,653Redemptions of units during the period (2,733,620) (208,148) (204,755) (299,321) – (739,494,809)
Number of units in issue at 31 March 3,019,665 95,396 1,145,923 548,465 100 523,795,844
(1) The date of commencement for HSBC Asia High Income Bond Fund was 27 February 2017.(2) The HSBC All China Bond Fund is formerly known as “HSBC RQFII Chinese Fixed Income Fund”.

71
Notes to the Financial Statements
9 Reconciliationofnetassetvalues
The net asset value presented in the financial statements and that quoted for pricing purposes at the period end (“Dealing NAV”) are different as the principles for calculating the Dealing NAV as set out in the Explanatory Memorandum are different from those required for financial reporting purposes under HKFRSs. The following reconciliation provides details of these differences:
2019
HSBCChinaMulti-Asset
IncomeFundHSBCAllChina
BondFund(2)
HKD RMB
Net assets as reported in the financial statements as at 31 March 4,416,824,974 125,214,543
Adjustment for different basis adopted by the sub-funds in arriving at the Dealing NAV:
– Establishment cost – –
Dealing NAV as at 31 March 4,416,824,974 125,214,543
2019
HSBCAsiaPacificex
JapanEquityVolatility
FocusedFund
HSBCEuroMulti-Asset
IncomeFund
HSBCAsiaHighIncomeBondFund(1)
USD EUR USD
Net assets as reported in the financial statements as at 31 March 99,977,731 44,760,252 830,526,536
Adjustment for different basis adopted by the sub-funds in arriving at the Dealing NAV:
– Establishment cost 125,609 17,917 65,880
Dealing NAV as at 31 March 100,103,340 44,778,169 830,592,416
2018
HSBCChinaMulti-Asset
IncomeFundHSBCAllChina
BondFund(2)
HKD RMB
Net assets as reported in the financial statements as at 31 March 6,521,423,305 125,018,035
Adjustment for different basis adopted by the sub-funds in arriving at the Dealing NAV:
– Establishment cost 160,591 66,070
Dealing NAV as at 31 March 6,521,583,896 125,084,105
2018
HSBCAsiaPacificex
JapanEquityVolatility
FocusedFund
HSBCEuroMulti-Asset
IncomeFund
HSBCAsiaHighIncomeBondFund(1)
USD EUR USD
Net assets as reported in the financial statements as at 31 March 128,500,588 66,754,758 1,300,171,309
Adjustment for different basis adopted by the sub-funds in arriving at the Dealing NAV:
– Establishment cost 29,323 26,863 87,820
Dealing NAV as at 31 March 128,529,911 66,781,621 1,300,259,129
(1) The date of commencement for HSBC Asia High Income Bond Fund was 27 February 2017.
(2) The HSBC All China Bond Fund is formerly known as “HSBC RQFII Chinese Fixed Income Fund”.

72
Notes to the Financial Statements
10 Involvement with unconsolidated structuredentities
The sub-funds have concluded that the investment funds in which they invest but are not consolidated by the sub-funds meet the definition of structured entities because:
– the voting rights in the investment funds are not dominant rights in deciding who controls them as they relate to administrative tasks only;
– each investment fund’s activities are restricted by its prospectus; and
– the investment funds have narrow and well-defined objectives to provide investment opportunities to investors.
The table below describes the types of structured entities that the sub-funds do not consolidated but in which the sub-funds hold an interest.
Typeofstructuredentity Natureandpurpose
Interestheldbytheinvestmentfunds
Investment funds To manage assets on behalf of third party
investors and generate fees for the investment
manager.
These vehicles are financed through the
issues of units to investors.
Investments in units issued by the
investment funds
The table below sets out interests held by the sub-funds in unconsolidated structured entities. The maximum exposure to loss is the carrying amount of the financial assets held.
Asat31March2019
Numberofinvestments
Totalnetassets
Carryingamount
includedininvestments
USD USD
HSBCAsiaPacificexJapanEquityVolatilityFocusedFund
Real estate investment trust 1 24,043,491,000 765,979
EUR EUR
HSBCEuroMulti-AssetIncomeFund
Real estate investment trust 1 10,357,600,000 303,319
Unlisted investment funds 2 87,983,915 10,577,095
USD USD
HSBCAsiaHighIncomeBondFund
Listed investment fund 1 47,484,150 3,982,870
Unlisted investment fund 1 125,214,543 1,578,900
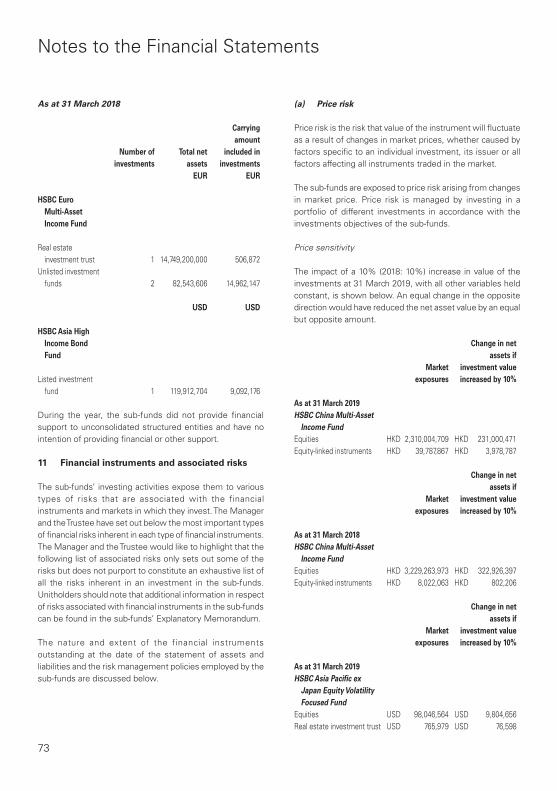
73
Notes to the Financial Statements
Asat31March2018
Numberofinvestments
Totalnetassets
Carryingamount
includedininvestments
EUR EUR
HSBCEuroMulti-AssetIncomeFund
Real estate investment trust 1 14,749,200,000 506,872
Unlisted investment funds 2 82,543,606 14,962,147
USD USD
HSBCAsiaHighIncomeBondFund
Listed investment fund 1 119,912,704 9,092,176
During the year, the sub-funds did not provide financial support to unconsolidated structured entities and have no intention of providing financial or other support.
11 Financialinstrumentsandassociatedrisks
The sub-funds’ investing activities expose them to various types of risks that are associated with the financial instruments and markets in which they invest. The Manager and the Trustee have set out below the most important types of financial risks inherent in each type of financial instruments. The Manager and the Trustee would like to highlight that the following list of associated risks only sets out some of the risks but does not purport to constitute an exhaustive list of all the risks inherent in an investment in the sub-funds. Unitholders should note that additional information in respect of risks associated with financial instruments in the sub-funds can be found in the sub-funds’ Explanatory Memorandum.
The nature and extent of the financial instruments outstanding at the date of the statement of assets and liabilities and the risk management policies employed by the sub-funds are discussed below.
(a) Pricerisk
Price risk is the risk that value of the instrument will fluctuate as a result of changes in market prices, whether caused by factors specific to an individual investment, its issuer or all factors affecting all instruments traded in the market.
The sub-funds are exposed to price risk arising from changes in market price. Price risk is managed by investing in a portfolio of different investments in accordance with the investments objectives of the sub-funds.
Price sensitivity
The impact of a 10% (2018: 10%) increase in value of the investments at 31 March 2019, with all other variables held constant, is shown below. An equal change in the opposite direction would have reduced the net asset value by an equal but opposite amount.
Marketexposures
Changeinnetassetsif
investmentvalueincreasedby10%
Asat31March2019HSBCChinaMulti-Asset
IncomeFundEquities HKD 2,310,004,709 HKD 231,000,471Equity-linked instruments HKD 39,787,867 HKD 3,978,787
Marketexposures
Changeinnetassetsif
investmentvalueincreasedby10%
Asat31March2018HSBCChinaMulti-Asset
IncomeFundEquities HKD 3,229,263,973 HKD 322,926,397Equity-linked instruments HKD 8,022,063 HKD 802,206
Marketexposures
Changeinnetassetsif
investmentvalueincreasedby10%
Asat31March2019HSBCAsiaPacificex
JapanEquityVolatilityFocusedFund
Equities USD 98,046,564 USD 9,804,656Real estate investment trust USD 765,979 USD 76,598
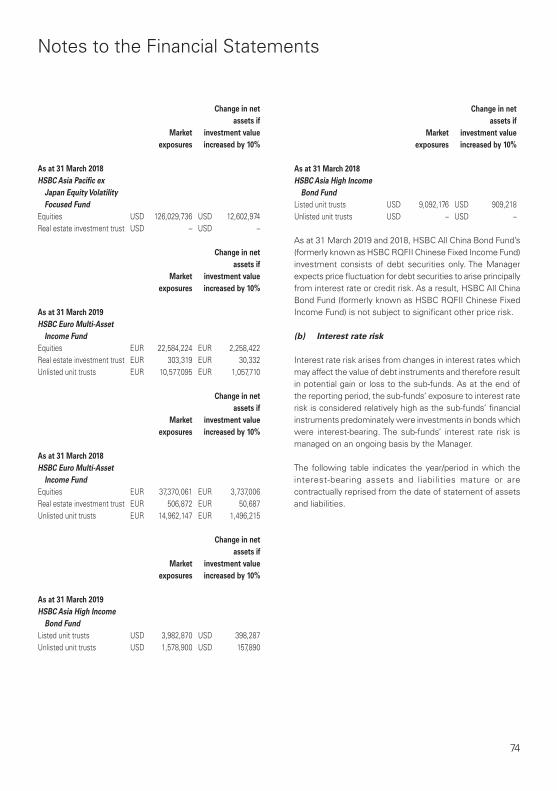
74
Notes to the Financial Statements
Marketexposures
Changeinnetassetsif
investmentvalueincreasedby10%
Asat31March2018HSBCAsiaPacificex
JapanEquityVolatilityFocusedFund
Equities USD 126,029,736 USD 12,602,974Real estate investment trust USD – USD –
Marketexposures
Changeinnetassetsif
investmentvalueincreasedby10%
Asat31March2019HSBCEuroMulti-Asset
IncomeFundEquities EUR 22,584,224 EUR 2,258,422Real estate investment trust EUR 303,319 EUR 30,332Unlisted unit trusts EUR 10,577,095 EUR 1,057,710
Marketexposures
Changeinnetassetsif
investmentvalueincreasedby10%
Asat31March2018HSBCEuroMulti-Asset
IncomeFundEquities EUR 37,370,061 EUR 3,737,006Real estate investment trust EUR 506,872 EUR 50,687Unlisted unit trusts EUR 14,962,147 EUR 1,496,215
Marketexposures
Changeinnetassetsif
investmentvalueincreasedby10%
Asat31March2019HSBCAsiaHighIncome
BondFundListed unit trusts USD 3,982,870 USD 398,287Unlisted unit trusts USD 1,578,900 USD 157,890
Marketexposures
Changeinnetassetsif
investmentvalueincreasedby10%
Asat31March2018HSBCAsiaHighIncome
BondFundListed unit trusts USD 9,092,176 USD 909,218Unlisted unit trusts USD – USD –
As at 31 March 2019 and 2018, HSBC All China Bond Fund’s (formerly known as HSBC RQFII Chinese Fixed Income Fund) investment consists of debt securities only. The Manager expects price fluctuation for debt securities to arise principally from interest rate or credit risk. As a result, HSBC All China Bond Fund (formerly known as HSBC RQFII Chinese Fixed Income Fund) is not subject to significant other price risk.
(b) Interestraterisk
Interest rate risk arises from changes in interest rates which may affect the value of debt instruments and therefore result in potential gain or loss to the sub-funds. As at the end of the reporting period, the sub-funds’ exposure to interest rate risk is considered relatively high as the sub-funds’ financial instruments predominately were investments in bonds which were interest-bearing. The sub-funds’ interest rate risk is managed on an ongoing basis by the Manager.
The following table indicates the year/period in which the interest-bearing assets and liabilities mature or are contractually reprised from the date of statement of assets and liabilities.
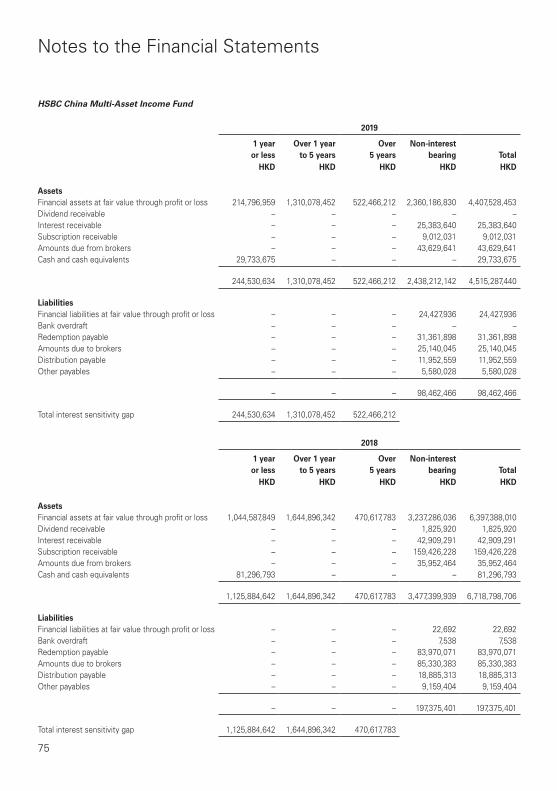
75
Notes to the Financial Statements
HSBCChinaMulti-AssetIncomeFund
2019
1yearorless
Over1yearto5years
Over5years
Non-interestbearing Total
HKD HKD HKD HKD HKD
AssetsFinancial assets at fair value through profit or loss 214,796,959 1,310,078,452 522,466,212 2,360,186,830 4,407,528,453Dividend receivable – – – – –Interest receivable – – – 25,383,640 25,383,640Subscription receivable – – – 9,012,031 9,012,031Amounts due from brokers – – – 43,629,641 43,629,641Cash and cash equivalents 29,733,675 – – – 29,733,675
244,530,634 1,310,078,452 522,466,212 2,438,212,142 4,515,287,440
LiabilitiesFinancial liabilities at fair value through profit or loss – – – 24,427,936 24,427,936Bank overdraft – – – – –Redemption payable – – – 31,361,898 31,361,898Amounts due to brokers – – – 25,140,045 25,140,045Distribution payable – – – 11,952,559 11,952,559Other payables – – – 5,580,028 5,580,028
– – – 98,462,466 98,462,466
Total interest sensitivity gap 244,530,634 1,310,078,452 522,466,212
2018
1yearorless
Over1yearto5years
Over5years
Non-interestbearing Total
HKD HKD HKD HKD HKD
AssetsFinancial assets at fair value through profit or loss 1,044,587,849 1,644,896,342 470,617,783 3,237,286,036 6,397,388,010Dividend receivable – – – 1,825,920 1,825,920Interest receivable – – – 42,909,291 42,909,291Subscription receivable – – – 159,426,228 159,426,228Amounts due from brokers – – – 35,952,464 35,952,464Cash and cash equivalents 81,296,793 – – – 81,296,793
1,125,884,642 1,644,896,342 470,617,783 3,477,399,939 6,718,798,706
LiabilitiesFinancial liabilities at fair value through profit or loss – – – 22,692 22,692Bank overdraft – – – 7,538 7,538Redemption payable – – – 83,970,071 83,970,071Amounts due to brokers – – – 85,330,383 85,330,383Distribution payable – – – 18,885,313 18,885,313Other payables – – – 9,159,404 9,159,404
– – – 197,375,401 197,375,401
Total interest sensitivity gap 1,125,884,642 1,644,896,342 470,617,783

76
Notes to the Financial Statements
HSBCAllChinaBondFund(formerlyknownasHSBCRQFIIChineseFixedIncomeFund)
2019
1yearorless
Over1yearto5years
Over5years
Non-interestbearing Total
RMB RMB RMB RMB RMB
AssetsFinancial assets at fair value through profit or loss 5,013,865 86,834,350 36,048,129 – 127,896,344Interest receivable – – – 2,166,926 2,166,926Other receivable – – – – –Cash and cash equivalents 859,969 – – – 859,969
5,873,834 86,834,350 36,048,129 2,166,926 130,923,239
LiabilitiesRedemption payable – – – – –Distribution payable – – – 229,083 229,083Tax payables – – – 4,981,184 4,981,184Other payables – – – 498,429 498,429
– – – 5,708,696 5,708,696
Total interest sensitivity gap 5,873,834 86,834,350 36,048,129
2018
1yearorless
Over1yearto5years
Over5years
Non-interestbearing Total
RMB RMB RMB RMB RMB
AssetsFinancial assets at fair value through profit or loss – 96,285,530 49,452,510 – 145,738,040Interest receivable – – – 4,297,257 4,297,257Other receivable – – – 62,299 62,299Cash and cash equivalents 353,261 – – – 353,261
353,261 96,285,530 49,452,510 4,359,556 150,450,857
LiabilitiesRedemption payable – – – 19,848,672 19,848,672Distribution payable – – – 326,281 326,281Tax payables – – – 4,490,516 4,490,516Other payables – – – 767,353 767,353
– – – 25,432,822 25,432,822
Total interest sensitivity gap 353,261 96,285,530 49,452,510

77
Notes to the Financial Statements
HSBCEuroMulti-AssetIncomeFund
2019
1yearorless
Over1yearto5years
Over5years
Non-interestbearing Total
EUR EUR EUR EUR EUR
AssetsFinancial assets at fair value through profit or loss – 396,481 7,809,831 33,801,243 42,007,555Dividend receivable – – – 30,313 30,313Interest receivable – – – 50,887 50,887Subscription receivable – – – 103,613 103,613Amounts due from brokers – – – 100,482 100,482Other receivable – – – 292 292Cash and cash equivalents 3,749,057 – – – 3,749,057
3,749,057 396,481 7,809,831 34,086,830 46,042,199
LiabilitiesFinancial liabilities at fair value through profit or loss – – – 2,495 2,495Bank overdraft – – – 68,915 68,915Redemption payable – – – 89,099 89,099Amounts due to brokers – – – 850,569 850,569Distribution payable – – – 171,955 171,955Other payables – – – 98,914 98,914
– – – 1,281,947 1,281,947
Total interest sensitivity gap 3,749,057 396,481 7,809,831
2018
1yearorless
Over1yearto5years
Over5years
Non-interestbearing Total
EUR EUR EUR EUR EUR
AssetsFinancial assets at fair value through profit or loss – – 12,208,668 53,064,721 65,273,389Dividend receivable – – – 37,917 37,917Interest receivable – – – 60,352 60,352Subscription receivable – – – 480,073 480,073Amounts due from brokers – – – 3,515,435 3,515,435Cash and cash equivalents 788,564 – – – 788,564
788,564 – 12,208,668 57,158,498 70,155,730
LiabilitiesFinancial liabilities at fair value through profit or loss – – – 27,262 27,262Redemption payable – – – 1,393,776 1,393,776Amounts due to brokers – – – 1,590,359 1,590,359Distribution payable – – – 261,195 261,195Other payables – – – 128,380 128,380
– – – 3,400,972 3,400,972
Total interest sensitivity gap 788,564 – 12,208,668

78
Notes to the Financial Statements
HSBCAsiaHighIncomeBondFund
2019
1yearorless
Over1yearto5years
Over5years
Non-interestbearing Total
USD USD USD USD USD
AssetsFinancial assets at fair value through profit or loss 31,571,164 420,136,639 353,638,344 5,628,171 810,974,318Interest receivable – – – 10,378,057 10,378,057Subscription receivable – – – 19,152,746 19,152,746Amounts due from brokers – – – 23,270,744 23,270,744Cash and cash equivalents 6,616,593 – – – 6,616,593
38,187,757 420,136,639 353,638,344 58,429,718 870,392,458
LiabilitiesFinancial liabilities at fair value through profit or loss – – – 283,951 283,951Redemption payable – – – 7,530,007 7,530,007Amounts due to brokers – – – 27,316,267 27,316,267Distribution payable – – – 3,760,440 3,760,440Tax payables – – – 20,133 20,133Other payables – – – 955,124 955,124
– – – 39,865,922 39,865,922
Total interest sensitivity gap 38,187,757 420,136,639 353,638,344
2018
1yearorless
Over1yearto5years
Over5years
Non-interestbearing Total
USD USD USD USD USD
AssetsFinancial assets at fair value through profit or loss 27,941,140 715,594,036 520,334,481 9,094,624 1,272,964,281Interest receivable – – – 17,015,889 17,015,889Subscription receivable – – – 4,422,888 4,422,888Amounts due from brokers – – – 48,101,883 48,101,883Cash and cash equivalents 24,131,700 – – – 24,131,700
52,072,840 715,594,036 520,334,481 78,635,284 1,366,636,641
LiabilitiesFinancial liabilities at fair value through profit or loss – – – 438,964 438,964Bank overdraft – – – 5,207 5,207Redemption payable – – – 25,038,786 25,038,786Amounts due to brokers – – – 34,674,117 34,674,117Distribution payable – – – 4,740,050 4,740,050Other payables – – – 1,568,208 1,568,208
– – – 66,465,332 66,465,332
Total interest sensitivity gap 52,072,840 715,594,036 520,334,481
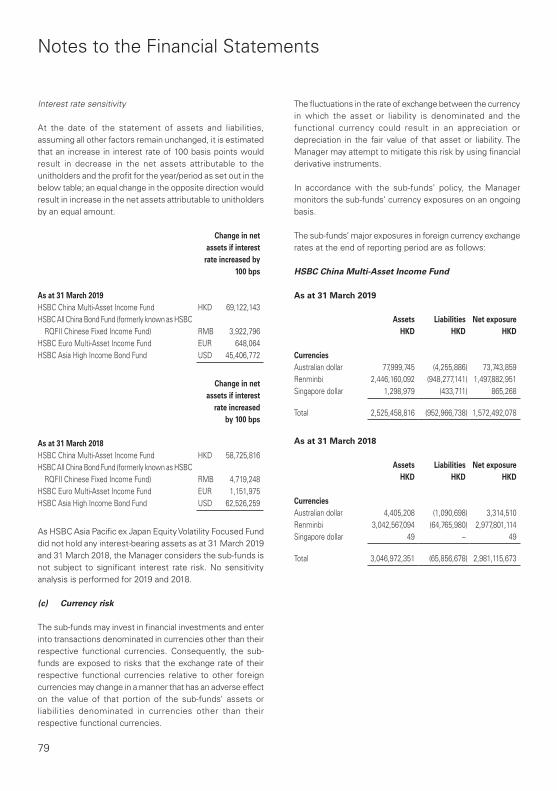
79
Notes to the Financial Statements
Interest rate sensitivity
At the date of the statement of assets and liabilities, assuming all other factors remain unchanged, it is estimated that an increase in interest rate of 100 basis points would result in decrease in the net assets attributable to the unitholders and the profit for the year/period as set out in the below table; an equal change in the opposite direction would result in increase in the net assets attributable to unitholders by an equal amount.
Changeinnetassetsifinterest
rateincreasedby100bps
Asat31March2019HSBC China Multi-Asset Income Fund HKD 69,122,143HSBC All China Bond Fund (formerly known as HSBC
RQFII Chinese Fixed Income Fund) RMB 3,922,796HSBC Euro Multi-Asset Income Fund EUR 648,064HSBC Asia High Income Bond Fund USD 45,406,772
Changeinnetassetsifinterest
rateincreasedby100bps
Asat31March2018HSBC China Multi-Asset Income Fund HKD 58,725,816HSBC All China Bond Fund (formerly known as HSBC
RQFII Chinese Fixed Income Fund) RMB 4,719,248HSBC Euro Multi-Asset Income Fund EUR 1,151,975HSBC Asia High Income Bond Fund USD 62,526,259
As HSBC Asia Pacific ex Japan Equity Volatility Focused Fund did not hold any interest-bearing assets as at 31 March 2019 and 31 March 2018, the Manager considers the sub-funds is not subject to significant interest rate risk. No sensitivity analysis is performed for 2019 and 2018.
(c) Currencyrisk
The sub-funds may invest in financial investments and enter into transactions denominated in currencies other than their respective functional currencies. Consequently, the sub-funds are exposed to risks that the exchange rate of their respective functional currencies relative to other foreign currencies may change in a manner that has an adverse effect on the value of that portion of the sub-funds’ assets or liabilities denominated in currencies other than their respective functional currencies.
The fluctuations in the rate of exchange between the currency in which the asset or liability is denominated and the functional currency could result in an appreciation or depreciation in the fair value of that asset or liability. The Manager may attempt to mitigate this risk by using financial derivative instruments.
In accordance with the sub-funds’ policy, the Manager monitors the sub-funds’ currency exposures on an ongoing basis.
The sub-funds’ major exposures in foreign currency exchange rates at the end of reporting period are as follows:
HSBCChinaMulti-AssetIncomeFund
Asat31March2019
Assets Liabilities NetexposureHKD HKD HKD
CurrenciesAustralian dollar 77,999,745 (4,255,886) 73,743,859Renminbi 2,446,160,092 (948,277,141) 1,497,882,951Singapore dollar 1,298,979 (433,711) 865,268
Total 2,525,458,816 (952,966,738) 1,572,492,078
Asat31March2018
Assets Liabilities NetexposureHKD HKD HKD
CurrenciesAustralian dollar 4,405,208 (1,090,698) 3,314,510Renminbi 3,042,567,094 (64,765,980) 2,977,801,114Singapore dollar 49 – 49
Total 3,046,972,351 (65,856,678) 2,981,115,673
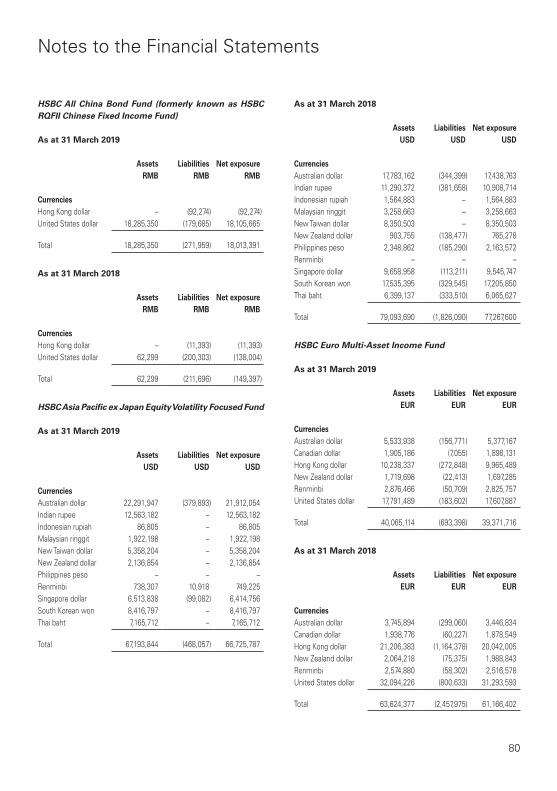
80
Notes to the Financial Statements
HSBCAllChinaBondFund (formerlyknownasHSBCRQFIIChineseFixedIncomeFund)
Asat31March2019
Assets Liabilities NetexposureRMB RMB RMB
CurrenciesHong Kong dollar – (92,274) (92,274)United States dollar 18,285,350 (179,685) 18,105,665
Total 18,285,350 (271,959) 18,013,391
Asat31March2018
Assets Liabilities NetexposureRMB RMB RMB
CurrenciesHong Kong dollar – (11,393) (11,393)United States dollar 62,299 (200,303) (138,004)
Total 62,299 (211,696) (149,397)
HSBCAsiaPacificexJapanEquityVolatilityFocusedFund
Asat31March2019
Assets Liabilities NetexposureUSD USD USD
CurrenciesAustralian dollar 22,291,947 (379,893) 21,912,054Indian rupee 12,563,182 – 12,563,182Indonesian rupiah 86,805 – 86,805Malaysian ringgit 1,922,198 – 1,922,198New Taiwan dollar 5,358,204 – 5,358,204New Zealand dollar 2,136,854 – 2,136,854Philippines peso – – –Renminbi 738,307 10,918 749,225Singapore dollar 6,513,838 (99,082) 6,414,756South Korean won 8,416,797 – 8,416,797Thai baht 7,165,712 – 7,165,712
Total 67,193,844 (468,057) 66,725,787
Asat31March2018
Assets Liabilities NetexposureUSD USD USD
CurrenciesAustralian dollar 17,783,162 (344,399) 17,438,763Indian rupee 11,290,372 (381,658) 10,908,714Indonesian rupiah 1,564,883 – 1,564,883Malaysian ringgit 3,258,663 – 3,258,663New Taiwan dollar 8,350,503 – 8,350,503New Zealand dollar 903,755 (138,477) 765,278Philippines peso 2,348,862 (185,290) 2,163,572Renminbi – – –Singapore dollar 9,658,958 (113,211) 9,545,747South Korean won 17,535,395 (329,545) 17,205,850Thai baht 6,399,137 (333,510) 6,065,627
Total 79,093,690 (1,826,090) 77,267,600
HSBCEuroMulti-AssetIncomeFund
Asat31March2019
Assets Liabilities NetexposureEUR EUR EUR
CurrenciesAustralian dollar 5,533,938 (156,771) 5,377,167Canadian dollar 1,905,186 (7,055) 1,898,131Hong Kong dollar 10,238,337 (272,848) 9,965,489New Zealand dollar 1,719,698 (22,413) 1,697,285Renminbi 2,876,466 (50,709) 2,825,757United States dollar 17,791,489 (183,602) 17,607,887
Total 40,065,114 (693,398) 39,371,716
Asat31March2018
Assets Liabilities NetexposureEUR EUR EUR
CurrenciesAustralian dollar 3,745,894 (299,060) 3,446,834Canadian dollar 1,938,776 (60,227) 1,878,549Hong Kong dollar 21,206,383 (1,164,378) 20,042,005New Zealand dollar 2,064,218 (75,375) 1,988,843Renminbi 2,574,880 (58,302) 2,516,578United States dollar 32,094,226 (800,633) 31,293,593
Total 63,624,377 (2,457,975) 61,166,402

81
Notes to the Financial Statements
HSBCAsiaHighIncomeBondFund
Asat31March2019
Assets Liabilities NetexposureUSD USD USD
CurrenciesAustralian dollar 36,500,641 (1,632,890) 34,867,751Canadian dollar 18,061,219 (833,841) 17,227,378Euro 640,376 (137,703) 502,673Indian rupee – – –Indonesian rupiah 9,943,293 ( 10,006,420) (63,127)Malaysian ringgit 6,092,590 – 6,092,590Pound sterling 10,522,094 (1,086,067) 9,436,027Renminbi 45,195,784 (1,584,804) 43,610,980Singapore dollar 707 (3) 704
Total 126,956,704 (15,281,728) 111,674,976
Asat31March2018
Assets Liabilities NetexposureUSD USD USD
CurrenciesAustralian dollar 23,086,218 (1,019,176) 22,067,042Canadian dollar 8,692,704 (185,034) 8,507,670Euro 41,424,411 (3,658) 41,420,753Indian rupee 22,559,223 (22,101,305) 457,918Indonesian rupiah 32,811,428 – 32,811,428Malaysian ringgit – – –Pound sterling 7,728,499 (388,777) 7,339,722Renminbi 59,488,950 (2,732,993) 56,755,957Singapore dollar 737 (2) 735
Total 195,792,170 (26,430,945) 169,361,225
The amounts in the above table are based on the carrying value of the assets and liabilities.
Currency sensitivity
As the Hong Kong dollar (“HKD”) is pegged to the United States dollar (“USD”), the sub-funds do not expect any significant movements in USD/HKD exchange rate. At 31 March 2019 and 2018, had the sub-funds’ respective functional currencies weakened in relation to the above currencies by 10%, with all other variables held constant, net assets attributable to unitholders would have changed by the amounts shown in the following table.
Changeinnetassetsif
thesub-funds’respectivefunctionalcurrencies
weakenedby10%
Asat31March2019HSBC China Multi-Asset Income Fund HKD 157,249,208
HSBC All China Bond Fund (formerly known as HSBC RQFII Chinese Fixed Income Fund) RMB 1,801,339
HSBC Asia Pacific ex Japan Equity Volatility Focused Fund USD 6,672,579
HSBC Euro Multi-Asset Income Fund EUR 3,937,172
HSBC Asia High Income Bond Fund USD 11,167,498
Changeinnetassetsif
thesub-funds’respectivefunctionalcurrencies
weakenedby10%
Asat31March2018HSBC China Multi-Asset Income Fund HKD 298,111,567
HSBC All China Bond Fund (formerly known as HSBC RQFII Chinese Fixed Income Fund) RMB (14,940)
HSBC Asia Pacific ex Japan Equity Volatility Focused Fund USD 7,726,759
HSBC Euro Multi-Asset Income Fund EUR 6,114,982
HSBC Asia High Income Bond Fund USD 16,936,123
A 10% strengthening of the sub-funds’ respective functional currencies against the above currencies would have resulted in an equal but opposite effect on the basis that all other variables remain constant.
(d) Creditandcounterpartyrisk
Credit risk is the risk that counterparty to a financial instrument will fail to discharge an obligation or commitment that it has entered into with the sub-funds. The sub-funds’

82
Notes to the Financial Statements
exposure to credit risk is monitored by the Manager on an ongoing basis.
At 31 March 2019 and 2018, all of the sub-funds’ financial assets were exposed to credit risk. These include investments and cash and cash equivalents placed with banks and the custodian.
The majority of the cash held by the sub-funds is deposited with HSBC Hong Kong and Bank of Communications Co., Ltd. Bankruptcy or insolvency of the banks may cause the sub-funds’ rights with respect to the cash held by the bank to be delayed or limited. The Manager monitors the credit rating and financial position of the banks on an ongoing basis.
Substantially all the assets of the sub-funds are held by the custodian. Bankruptcy or insolvency of the custodian may cause the sub-funds’ right with respect to securities held by the custodian to be delayed or limited. The Manager monitors the credit rating and financial position of the custodian on an ongoing basis.
At the date of statement of assets and liabilities, the sub-funds, HSBC China Multi-Asset Income Fund, HSBC All China Bond Fund (formerly known as HSBC RQFII Chinese Fixed Income Fund), HSBC Euro Multi-Asset Income Fund and HSBC Asia High Income Bond Fund have invested in debt securities with the following credit quality expressed as a percentage of their net assets:
HSBCChinaMulti-AssetIncomeFund
Asat31March
2019%ofnet
assetvalue
Asat31March
2018%ofnet
assetvalue
Rating(Moody’s/S&P)
Aa1/AA+ 0.27 0.86Aa2/AA 2.73 1.50Aa3/AA- 1.61 2.16A1/A+ 13.23 17.18A2/A 1.82 2.04A3/A- 4.49 4.00Baa1/BBB+ 1.87 3.31Baa2/BBB – 0.78Baa3/BBB- 3.48 1.20Ba1/BB+ 0.94 –Ba2/BB 0.26 0.77Ba3/BB- 0.22 –B1/B+ 0.59 1.17B2/B 1.45 0.54B3/B- 0.52 0.61NR 12.87 12.34
Total 46.35 48.46

83
Notes to the Financial Statements
HSBCAllChinaBondFund (formerlyknownasHSBCRQFIIChineseFixedIncomeFund)
Asat31March
2019%ofnet
assetvalue
Asat31March
2018%ofnet
assetvalue
Rating(Moody’s/S&P)
Aaa/AAA 50.32 69.14Aa1/AA+ – 16.22Aa2/AA 1.62 –A1/A+ 12.40 –A2/A 1.64 7.96A3/A- 2.43 –Baa1/BBB+ 1.12 –Baa3/BBB- 8.41 –Ba2/BB 1.94 –Ba3/BB- 3.55 –B1/B 1.12 –B2/B+ 5.46 –NR 12.11 23.25
Total 102.12 116.57
HSBCEuroMulti-AssetIncomeFund
Asat31March
2019%ofnet
assetvalue
Asat31March
2018%ofnet
assetvalue
Rating(Moody’s/S&P)
Aaa/AAA 3.15 5.00Aa1/AA+ 1.30 –Aa2/AA – 4.27A2/A 1.20 –Baa1/BBB+ 4.11 –Baa2/BBB – 6.79Baa3/BBB- 5.53 –NR 3.04 2.23
Total 18.33 18.29
HSBCAsiaHighIncomeBondFund
Asat31March
2019%ofnet
assetvalue
Asat31March
2018%ofnet
assetvalue
Rating(Moody’s/S&P)
Aaa/AAA 1.00 0.15Aa1/AA+ 1.36 0.60Aa2/AA 1.91 2.44Aa3/AA- 0.60 0.75A1/A+ 2.63 3.69A2/A 4.46 5.04A3/A- 2.41 5.69Baa1/BBB+ 10.26 5.47Baa2/BBB 19.21 7.48Baa3/BBB- 7.25 17.01Ba1/BB+ 1.35 –Ba2/BB 6.64 4.37Ba3/BB- 8.54 8.99B1/B+ 4.76 8.16B2/B 9.84 6.88B3/B- 3.82 1.71NR 10.93 18.78
Total 96.97 97.21
The major domestic credit rating agencies in China include Dagong Global Credit Rating Co., Ltd.; China Chengxin International Credit Rating Co., Ltd (in partnership with Moody’s); China Chengxin Security Rating Co., Ltd; China Lianhe Credit Rating Co., Ltd (in partnership with Fitch Ratings); Shanghai Brilliance Credit Rating & Investors Service Co., Ltd.
Credit risk arising from transactions with brokers relates to transactions awaiting settlement. Risk relating to unsettled transactions is considered small due to the short settlement period involved and the high credit quality of the brokers used.
The carrying amounts of financial assets best represent the maximum credit risk exposure at the date of statement of assets and liabilities.
As at 31 March 2019 and 2018, there were no significant concentrations of credit risk to counterparties except to the custodian. The Manager considers that none of these assets are impaired nor past due at the end of the reporting periods.

84
Notes to the Financial Statements
AmountsarisingfromECL
Impairment on dividend receivable, interest receivable, subscription receivable, amounts due from brokers, other receivable and cash and cash equivalents has been measured on a 12-month expected loss basis and reflects the short maturities of the exposures. The sub-funds considers that these exposures have low credit risk based on the external credit ratings of the counterparties.
The sub-funds monitors changes in credit risk on these exposures by tracking published external credit ratings of the counterparties and/or performed ongoing review of the counterparties.
On initial application of HKFRS 9 as at 1 April 2018, the Managers considers the probability of default to be close to zero as the counterparties have a strong capacity to meet their contractual obligations in the near term. There is no impairment allowance recognised on dividend receivable, interest receivable, subscription receivable, amounts due from brokers, other receivable and cash and cash equivalents. The amount of the loss allowance did not change during 2018.
(e) Liquidityrisk
Liquidity risk arises from the risk that Manager may not be able to convert investments into cash to meet liquidity needs in a timely manner. The sub-funds are exposed to daily liquidity risk on redemption of units.
The sub-funds’ policy is to regularly monitor current and expected liquidity requirements to ensure that it maintains sufficient reserves of cash and readily realisable marketable securities to meet its liquidity requirements in the short and longer term.
The sub-funds’ listed and quoted investments are considered to have insignificant exposures to liquidity risk as they are all readily realisable under normal market conditions.
HSBC Chinese Multi-Asset Income Fund, however, also invests in unlisted bonds, which are not publicly traded on exchanges and may be illiquid. The total value of unlisted bonds as at 31 March 2019 was HKD39,338,702 (2018: HKD 118,965,431).
HSBC China Multi-Asset Income Fund’s redemption policy allows redemptions on any business day in Hong Kong and the PRC, subject to a minimum redemption amount of USD1,000 for Class AM2-USD, RMB10,000 for Class AM2-RMB, HKD10,000 for Class AM2-HKD, AUD1,500 for Class AM3O-AUD and SGD1,000 for Class AM3O-SGD.
HSBC All China Bond Fund’s (formerly known as HSBC RQFII Chinese Fixed Income Fund) redemption policy allows redemptions on any business day in Hong Kong and the PRC, subject to a minimum redemption amount of USD1,000 for Class AC-USD and Class AM2-USD, RMB10,000 for Class AC-RMB and Class AM2-RMB and HKD10,000 for Class AM2-HKD. There is no minimum redemption amount for Class ZC – USD.
HSBC Asia Pacific ex Japan Equity Volatility Focused Fund’s redemption policy allows redemptions on any business day in Hong Kong and the PRC, subject to a minimum redemption amount of USD1,000 for Class AM2-USD and HKD10,000 for Class AM2-HKD. There is no minimum redemption amount for Class BC – HKD, Class BC – RMB, Class BC – USD, Class BM2 – HKD, Class BM2 – RMB and Class BM2 – USD.
HSBC Euro Multi-Asset Income Fund’s redemption policy allows redemptions on any business day in Hong Kong and the PRC, subject to a minimum redemption amount of EUR1,000 for class AM2-EUR, USD 1,000 for class AM3H-USD, RMB 10,000 for class AM3H-RMB, HKD10,000 for class AM3H-HKD, CAD 1,000 for class AM3H-CAD, AUD1,500 for class AM3H-AUD and NZD1,500 for class AM3H-NZD.
HSBC Asia High Income Bond Fund’s redemption policy allows redemptions on any business day in Hong Kong and the PRC, subject to a minimum redemption amount of EUR850 for class AM2 – EUR and class AM3O – EUR, USD 1,000 for class AC – USD and class AM2 – USD, RMB 10,000 for class AM2 – RMB and class AM3O – RMB, HKD10,000 for class AM2 – HKD, CAD 1,000 for class AM2 – CAD and class AM3O – CAD, AUD1,500 for class AM2 – AUD and class AM3O – AUD, GBP650 for class AM3O – GBP and SGD1,000 for class AM3O – SGD.
As at 31 March 2019 and 2018, the sub-funds’ financial liabilities were due within one year.
(f) Capitalmanagement
The sub-funds’ capital as at the period end date is represented by their redeemable units.
The sub-funds’ objective in managing the capital is to ensure a stable and strong base to achieve long-term capital growth, and to manage liquidity risk arising from the redemptions. The Manager manages the capital of the sub-funds in accordance with the sub-funds’ investment objectives and policies stated in the sub-funds’ Explanatory Memorandum.
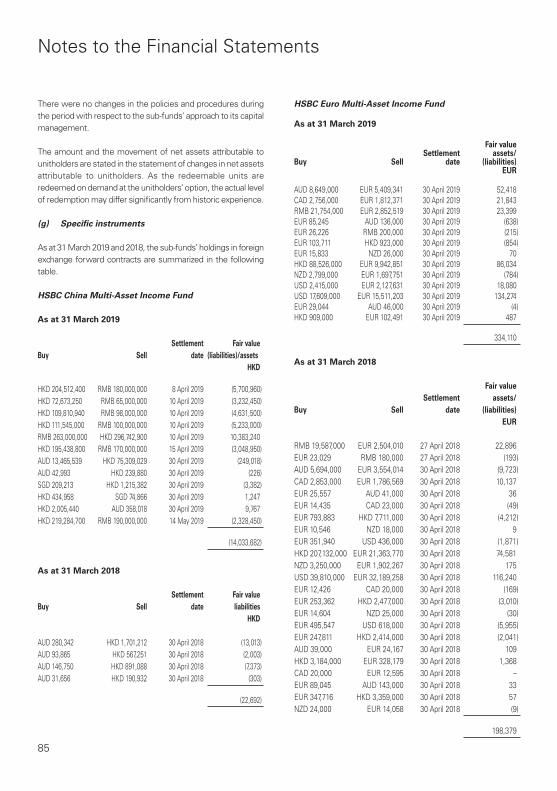
85
Notes to the Financial Statements
There were no changes in the policies and procedures during the period with respect to the sub-funds’ approach to its capital management.
The amount and the movement of net assets attributable to unitholders are stated in the statement of changes in net assets attributable to unitholders. As the redeemable units are redeemed on demand at the unitholders’ option, the actual level of redemption may differ significantly from historic experience.
(g) Specificinstruments
As at 31 March 2019 and 2018, the sub-funds’ holdings in foreign exchange forward contracts are summarized in the following table.
HSBCChinaMulti-AssetIncomeFund
Asat31March2019
Buy SellSettlement
dateFairvalue
(liabilities)/assetsHKD
HKD 204,512,400 RMB 180,000,000 8 April 2019 (5,700,960)HKD 72,673,250 RMB 65,000,000 10 April 2019 (3,232,450)HKD 109,810,940 RMB 98,000,000 10 April 2019 (4,631,500)HKD 111,545,000 RMB 100,000,000 10 April 2019 (5,233,000)RMB 263,000,000 HKD 296,742,900 10 April 2019 10,383,240HKD 195,438,800 RMB 170,000,000 15 April 2019 (3,048,950)AUD 13,465,539 HKD 75,309,029 30 April 2019 (249,018)AUD 42,993 HKD 239,880 30 April 2019 (226)SGD 209,213 HKD 1,215,382 30 April 2019 (3,382)HKD 434,958 SGD 74,866 30 April 2019 1,247HKD 2,005,440 AUD 358,018 30 April 2019 9,767HKD 219,284,700 RMB 190,000,000 14 May 2019 (2,328,450)
(14,033,682)
Asat31March2018
Buy SellSettlement
dateFairvalueliabilities
HKD
AUD 280,342 HKD 1,701,212 30 April 2018 (13,013)AUD 93,865 HKD 567,251 30 April 2018 (2,003)AUD 146,750 HKD 891,088 30 April 2018 (7,373)AUD 31,656 HKD 190,932 30 April 2018 (303)
(22,692)
HSBCEuroMulti-AssetIncomeFund
Asat31March2019
Buy SellSettlement
date
Fairvalueassets/
(liabilities)EUR
AUD 8,649,000 EUR 5,409,341 30 April 2019 52,418CAD 2,756,000 EUR 1,812,371 30 April 2019 21,843RMB 21,754,000 EUR 2,852,519 30 April 2019 23,399EUR 85,245 AUD 136,000 30 April 2019 (638)EUR 26,226 RMB 200,000 30 April 2019 (215)EUR 103,711 HKD 923,000 30 April 2019 (854)EUR 15,833 NZD 26,000 30 April 2019 70HKD 88,526,000 EUR 9,942,851 30 April 2019 86,034NZD 2,799,000 EUR 1,697,751 30 April 2019 (784)USD 2,415,000 EUR 2,127,631 30 April 2019 18,080USD 17,609,000 EUR 15,511,203 30 April 2019 134,274EUR 29,044 AUD 46,000 30 April 2019 (4)HKD 909,000 EUR 102,491 30 April 2019 487
334,110
Asat31March2018
Buy SellSettlement
date
Fairvalueassets/
(liabilities)EUR
RMB 19,587,000 EUR 2,504,010 27 April 2018 22,896EUR 23,029 RMB 180,000 27 April 2018 (193)AUD 5,694,000 EUR 3,554,014 30 April 2018 (9,723)CAD 2,853,000 EUR 1,786,569 30 April 2018 10,137EUR 25,557 AUD 41,000 30 April 2018 36EUR 14,435 CAD 23,000 30 April 2018 (49)EUR 793,883 HKD 7,711,000 30 April 2018 (4,212)EUR 10,546 NZD 18,000 30 April 2018 9EUR 351,940 USD 436,000 30 April 2018 (1,871)HKD 207,132,000 EUR 21,363,770 30 April 2018 74,581NZD 3,250,000 EUR 1,902,267 30 April 2018 175USD 39,810,000 EUR 32,189,258 30 April 2018 116,240EUR 12,426 CAD 20,000 30 April 2018 (169)EUR 253,362 HKD 2,477,000 30 April 2018 (3,010)EUR 14,604 NZD 25,000 30 April 2018 (30)EUR 495,547 USD 618,000 30 April 2018 (5,955)EUR 247,811 HKD 2,414,000 30 April 2018 (2,041)AUD 39,000 EUR 24,167 30 April 2018 109HKD 3,184,000 EUR 328,179 30 April 2018 1,368CAD 20,000 EUR 12,595 30 April 2018 –EUR 89,045 AUD 143,000 30 April 2018 33EUR 347,716 HKD 3,359,000 30 April 2018 57NZD 24,000 EUR 14,058 30 April 2018 (9)
198,379

86
Notes to the Financial Statements
HSBCAsiaHighIncomeBondFund
Asat31March2019
Buy SellSettlement
dateFairvalue
(liabilities)/assetsUSD
AUD 49,614,802 USD 35,393,116 30 April 2019 (129,743)AUD 754,212 USD 536,832 30 April 2019 (781)CAD 22,121,334 USD 16,540,824 30 April 2019 29,390RMB 130,470,763 USD 19,423,634 30 April 2019 (10,459)RMB 2,048,925 USD 305,098 30 April 2019 (231)EUR 215,260 USD 244,340 30 April 2019 (2,064)GBP 7,573,392 USD 10,016,849 30 April 2019 (134,405)USD 659,244 GBP 498,593 30 April 2019 8,635SGD 957 USD 709 30 April 2019 (2)USD 10,033,679 IDR 143,000,000,000 30 April 2019 27,260AUD 307,071 USD 219,398 30 April 2019 (1,149)USD 377,537 CAD 505,196 30 April 2019 (886)RMB 743,908 USD 110,654 30 April 2019 34EUR 59,250 USD 67,006 30 April 2019 (320)GBP 173,112 USD 229,066 30 April 2019 (3,174)USD 251,819 RMB 1,697,133 30 April 2019 (703)AUD 10,866 USD 7,695 30 April 2019 28RMB 1,771,566 USD 262,798 30 April 2019 799EUR 59,145 USD 66,602 30 April 2019 (34)USD 61,397 GBP 46,856 30 April 2019 255
(217,550)
Asat31March2018
Buy SellSettlement
dateFairvalue
(liabilities)/assetsUSD
USD 22,000,000 INR 1,439,900,000 4 June 2018 (101,305)RMB 61,627,581 USD 9,821,828 27 April 2018 (16,611)USD 40,639 RMB 257,730 27 April 2018 (367)AUD 28,157,087 USD 21,801,047 30 April 2018 (172,856)AUD 167,218 USD 128,909 30 April 2018 (465)CAD 10,133,143 USD 7,891,635 30 April 2018 (24,501)EUR 392,565 USD 488,162 30 April 2018 (4,310)GBP 5,507,944 USD 7,841,654 30 April 2018 (113,155)USD 310,053 GBP 219,224 30 April 2018 2,448SGD 966 USD 737 30 April 2018 –AUD 205,496 USD 158,727 30 April 2018 (880)CAD 51,057 USD 39,706 30 April 2018 (66)AUD 656,444 USD 508,442 30 April 2018 (4,211)CAD 93,159 USD 72,563 30 April 2018 (237)
(436,516)
Forward contracts are commitments either to purchase or sell a designated financial instrument, currency, commodity or index at a specified future date for a specified price and may be settled in cash or the underlying financial asset.
Forward contracts result in exposure to market risk based on changes in market prices relative to contracted prices. Market risks arise due to the possible movement in foreign currency exchange rates, indices and securities’ values underlying these instruments. In addition, because of the law margin deposits normally required in relation to notional contract sizes, a high degree of leverage may be typical of a forward contract and may result in substantial losses to the sub-funds. Forward contracts are generally subject to liquidity risk.
12 Fairvalueinformation
The sub-funds’ financial instruments are measured at fair value on the date of statement of assets and liabilities. Fair value estimates are made at a specified point in time, based on market conditions and information about the financial instruments. Usually, fair values can be reliably determined within a reasonable range of estimates. For certain other financial instruments including dividend receivable, interest receivable, subscription receivable, amounts due from brokers, redemption payable, amounts due to brokers, distribution payable, tax payables and other payables, the carrying amounts approximate fair values due to the immediate or short-term nature of these financial instruments.
Valuationoffinancialinstruments
The sub-funds’ accounting policy on fair value measurements is detailed in significant accounting policies in note 2(e)(iv).
The sub-funds measure fair values using the following fair value hierarchy that reflects the significance of the inputs used in making the measurements.
– Level 1: Inputs that are quoted market prices (unadjusted) in active markets for identical instruments.
– Level 2: Inputs other than quoted prices included within Level 1 that are observable either directly (i.e. as prices) or indirectly (i.e. derived from prices). The category includes instruments valued using: quoted market price in active markets for similar instruments; quoted prices for identical or similar instruments in markets that are considered less than active; or other valuation techniques in which all significant inputs are directly or indirectly observable from market data.

87
Notes to the Financial Statements
– Level 3: Inputs that are unobservable. This category includes all instruments for which the valuation technique includes inputs not based on observable data and the unobservable inputs have a significant effect on the instrument’s valuation. This category includes instruments that are valued based on quoted prices for similar instruments but for which significant unobservable adjustments or assumptions are required to reflect differences between the instruments.
The fair values of financial assets that are traded in active markets, such as equities and debt securities which are listed on exchanges or have daily quoted prices are based on quoted market prices or dealer price quotations. For all other financial instruments, the sub-funds determine fair value using valuation techniques.
The sub-funds use widely recognised valuation models for determining the fair value of financial instruments which do not have quoted market prices in an active market. Valuation techniques include comparison to quoted prices for identical instruments that are considered less than active and other valuation models.
The following analyses financial instruments measured at fair value at the date of the statement of assets and liabilities by the level in the fair value hierarchy into which the fair value measurement is categorised.
HSBCChinaMulti-AssetIncomeFund
2019
Level1 Level2 Level3 TotalHKD HKD HKD HKD
Financialassets
Listed equities 2,310,004,709 – – 2,310,004,709Debt securities – 2,047,341,623 – 2,047,341,623Equity-linked
instruments – 39,787,867 – 39,787,867Foreign currency
forward contracts – 10,394,254 – 10,394,254
2,310,004,709 2,097,523,744 – 4,407,528,453
Financialliabilities
Foreign currency forward contracts – (24,427,936) – (24,427,936)
2018
Level1 Level2 Level3 TotalHKD HKD HKD HKD
Financialassets
Listed equities 3,229,263,973 – – 3,229,263,973Debt securities – 3,160,101,974 – 3,160,101,974Equity-linked
instruments – 8,022,063 – 8,022,063
3,229,263,973 3,168,124,037 – 6,397,388,010
Financialliabilities
Foreign currency forward contracts – (22,692) – (22,692)
HSBCAllChinaBondFund (formerlyknownasHSBCRQFIIChineseFixedIncomeFund)
2019
Level1 Level2 Level3 TotalRMB RMB RMB RMB
Debt securities – 127,896,344 – 127,896,344
2018
Level1 Level2 Level3 TotalRMB RMB RMB RMB
Debt securities – 145,738,040 – 145,738,040
HSBCAsiaPacificexJapanEquityVolatilityFocusedFund
2019
Level1 Level2 Level3 TotalUSD USD USD USD
Listed equities 98,046,564 – – 98,046,564Unit trusts 765,979 – – 765,979
98,812,543 – – 98,812,543
2018
Level1 Level2 Level3 TotalUSD USD USD USD
Listed equities 126,029,736 – – 126,029,736
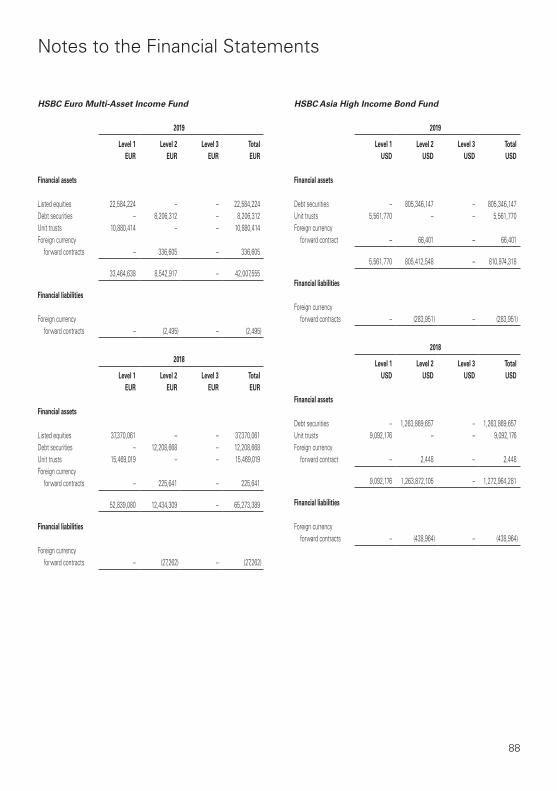
88
Notes to the Financial Statements
HSBCEuroMulti-AssetIncomeFund
2019
Level1 Level2 Level3 TotalEUR EUR EUR EUR
Financialassets
Listed equities 22,584,224 – – 22,584,224Debt securities – 8,206,312 – 8,206,312Unit trusts 10,880,414 – – 10,880,414Foreign currency
forward contracts – 336,605 – 336,605
33,464,638 8,542,917 – 42,007,555
Financialliabilities
Foreign currency forward contracts – (2,495) – (2,495)
2018
Level1 Level2 Level3 TotalEUR EUR EUR EUR
Financialassets
Listed equities 37,370,061 – – 37,370,061Debt securities – 12,208,668 – 12,208,668Unit trusts 15,469,019 – – 15,469,019Foreign currency
forward contracts – 225,641 – 225,641
52,839,080 12,434,309 – 65,273,389
Financialliabilities
Foreign currency forward contracts – (27,262) – (27,262)
HSBCAsiaHighIncomeBondFund
2019
Level1 Level2 Level3 TotalUSD USD USD USD
Financialassets
Debt securities – 805,346,147 – 805,346,147Unit trusts 5,561,770 – – 5,561,770Foreign currency
forward contract – 66,401 – 66,401
5,561,770 805,412,548 – 810,974,318
Financialliabilities
Foreign currency forward contracts – (283,951) – (283,951)
2018
Level1 Level2 Level3 TotalUSD USD USD USD
Financialassets
Debt securities – 1,263,869,657 – 1,263,869,657Unit trusts 9,092,176 – – 9,092,176Foreign currency
forward contract – 2,448 – 2,448
9,092,176 1,263,872,105 – 1,272,964,281
Financialliabilities
Foreign currency forward contracts – (438,964) – (438,964)

89
Notes to the Financial Statements
13 Distributions
HSBCChinaMulti-AssetIncomeFund
Yearended31March2019
HKD
ClassAM2–USD
Distributions attributable to the year
Distributions declared and paid during the year– US$0.0348 per unit on 38,958,236 units in April 2018 10,638,205– US$0.0321 per unit on 41,837,077 units in May 2018 10,536,810– US$0.0330 per unit on 41,221,941 units in June 2018 10,676,163– US$0.0328 per unit on 40,069,215 units in July 2018 10,314,984– US$0.0343 per unit on 35,622,217 units in August 2018 9,590,177– US$0.0350 per unit on 31,799,399 units in September 2018 8,700,880– US$0.0343 per unit on 29,108,422 units in October 2018 7,833,145– US$0.0351 per unit on 27,936,145 units in November 2018 7,668,949– US$0.0345 per unit on 27,733,285 units in December 2018 7,494,554– US$0.0336 per unit on 26,400,627 units in January 2019 6,957,353– US$0.0323 per unit on 27,020,791 units in February 2019 6,849,356
97,260,576
Distribution declared during the year– US$0.0314 per unit on 26,688,722 units in March 2019 6,579,667
Yearended31March2018
HKD
ClassAM2–USD
Distributions attributable to the year
Distributions declared and paid during the year– US$0.0309 per unit on 16,702,101 units in April 2017 4,015,967– US$0.0310 per unit on 15,452,181 units in May 2017 3,732,625– US$0.0329 per unit on 15,207,803 units in June 2017 3,905,478– US$0.0344 per unit on 19,041,182 units in July 2017 5,115,254– US$0.0336 per unit on 21,911,229 units in August 2017 5,760,753– US$0.0333 per unit on 23,005,307 units in September 2017 5,984,170– US$0.0332 per unit on 24,730,515 units in October 2017 6,404,255– US$0.0331 per unit on 27,231,420 units in November 2017 7,038,225– US$0.0335 per unit on 26,953,412 units in December 2017 7,058,593– US$0.0342 per unit on 29,327,839 units in January 2018 7,843,805– US$0.0355 per unit on 30,502,374 units in February 2018 8,475,238
65,334,363
Distribution declared during the year– US$0.0368 per unit on 34,340,850 units in March 2018 9,917,456
Yearended31March2019
HKD
ClassAM2–RMB
Distributions attributable to the year
Distributions declared and paid during the year– RMB0.0357 per unit on 29,290,819 units in April 2018 1,296,754– RMB0.0332 per unit on 30,634,999 units in May 2018 1,246,269– RMB0.0345 per unit on 31,044,004 units in June 2018 1,266,326– RMB0.0355 per unit on 29,105,980 units in July 2018 1,187,163– RMB0.0382 per unit on 27,705,707 units in August 2018 1,209,337– RMB0.0390 per unit on 26,501,434 units in September 2018 1,173,239– RMB0.0385 per unit on 25,122,319 units in October 2018 1,087,896– RMB0.0400 per unit on 23,966,147 units in November 2018 1,080,637– RMB0.0392 per unit on 23,487,279 units in December 2018 1,049,219– RMB0.0378 per unit on 24,331,811 units in January 2019 1,075,352– RMB0.0353 per unit on 24,959,427 units in February 2019 1,034,657
12,706,849
Distribution declared during the year– RMB0.0344 per unit on 20,399,021 units in March 2019 818,407
Yearended31March2018
HKD
ClassAM2–RMB
Distributions attributable to the year
Distributions declared and paid during the year– RMB0.0347 per unit on 15,137,420 units in April 2017 592,108– RMB0.0349 per unit on 14,597,612 units in May 2017 581,241– RMB0.0367 per unit on 14,313,184 units in June 2017 603,667– RMB0.0379 per unit on 14,766,251 units in July 2017 648,750– RMB0.0366 per unit on 15,091,315 units in August 2017 655,266– RMB0.0359 per unit on 15,763,176 units in September 2017 664,045– RMB0.0361 per unit on 17,649,106 units in October 2017 748,867– RMB0.0359 per unit on 18,138,321 units in November 2017 768,693– RMB0.0362 per unit on 18,177,207 units in December 2017 787,576– RMB0.0364 per unit on 21,638,628 units in January 2018 973,579– RMB0.0366 per unit on 22,116,392 units in February 2018 999,188
8,022,980
Distribution declared during the year– RMB0.0380 per unit on 27,438,260 units in March 2018 1,303,352

90
Notes to the Financial Statements
Yearended31March2019
HKD
ClassAM2–HKD
Distributions attributable to the year
Distributions declared and paid during the year– HK$0.0352 per unit on 225,171,861 units in April 2018 7,926,050– HK$0.0325 per unit on 224,958,232 units in May 2018 7,311,143– HK$0.0334 per unit on 229,043,889 units in June 2018 7,650,066– HK$0.0332 per unit on 218,424,431 units in July 2018 7,251,691– HK$0.0347 per unit on 189,828,771 units in August 2018 6,587,058– HK$0.0354 per unit on 172,022,591 units in September 2018 6,089,600– HK$0.0346 per unit on 158,288,537 units in October 2018 5,476,783– HK$0.0355 per unit on 149,882,619 units in November 2018 5,320,833– HK$0.0348 per unit on 143,571,771 units in December 2018 4,996,298– HK$0.0340 per unit on 142,112,580 units in January 2019 4,831,828– HK$0.0326 per unit on 140,200,867 units in February 2019 4,570,548
68,011,898
Distribution declared during the year– HK$0.0318 per unit on 135,148,857 units in March 2019 4,297,734
Yearended31March2018
HKD
ClassAM2–HKD
Distributions attributable to the year
Distributions declared and paid during the year– HK$0.0310 per unit on 134,763,563 units in April 2017 4,177,670– HK$0.0311 per unit on 127,079,156 units in May 2017 3,952,162– HK$0.0331 per unit on 120,701,490 units in June 2017 3,995,219– HK$0.0346 per unit on 131,599,882 units in July 2017 4,553,356– HK$0.0339 per unit on 142,106,620 units in August 2017 4,817,414– HK$0.0336 per unit on 139,316,723 units in September 2017 4,681,042– HK$0.0335 per unit on 160,542,466 units in October 2017 5,378,173– HK$0.0333 per unit on 164,738,458 units in November 2017 5,485,791– HK$0.0338 per unit on 161,362,506 units in December 2017 5,454,053– HK$0.0344 per unit on 188,396,847 units in January 2018 6,480,851– HK$0.0358 per unit on 197,116,969 units in February 2018 7,056,787
56,032,518
Distribution declared during the year– HK$0.0372 per unit on 205,736,205 units in March 2018 7,653,387
Yearended31March2019
HKD
ClassAM3O–AUD
Distributions attributable to the year
Distributions declared and paid during the year – AUD0.0321 per unit on 1,009,866 units in April 2018 192,211– AUD0.0276 per unit on 1,147,812 units in May 2018 188,318– AUD0.0260 per unit on 1,262,663 units in June 2018 189,142– AUD0.0285 per unit on 1,395,199 units in July 2018 231,235– AUD0.0294 per unit on 1,672,057 units in August 2018 279,697– AUD0.0238 per unit on 1,855,800 units in September 2018 248,954– AUD0.0281 per unit on 1,854,474 units in October 2018 289,702– AUD0.0318 per unit on 1,789,065 units in November 2018 325,684– AUD0.0297 per unit on 1,736,837 units in December 2018 284,697– AUD0.0280 per unit on 1,620,738 units in January 2019 258,030– AUD0.0324 per unit on 1,585,878 units in February 2019 287,262
2,774,932
Distribution declared during the year– AUD0.031 per unit on 1,485,129 units in March 2019 256,751
Yearended31March2018
HKD
ClassAM3O–AUD
Distributions attributable to the year
Distribution declared during the year– AUD0.0327 per unit on 56,611 units in March 2018 11,118

91
Notes to the Financial Statements
HSBCAllChinaBondFund (formerlyknownasHSBCRQFIIChineseFixedIncomeFund)
Yearended31March2019
RMB
ClassAM2–USD
Distributions attributable to the year
Distributions declared and paid during the year– US$0.0362 per unit on 502,422 units in April 2018 115,084– US$0.0348 per unit on 502,422 units in May 2018 111,953– US$0.0362 per unit on 496,659 units in June 2018 119,341– US$0.0343 per unit on 494,108 units in July 2018 115,771– US$0.0334 per unit on 494,108 units in August 2018 113,361– US$0.0329 per unit on 484,172 units in September 2018 109,703– US$0.0337 per unit on 484,172 units in October 2018 113,812– US$0.0335 per unit on 484,172 units in November 2018 112,534– US$0.0331 per unit on 484,172 units in December 2018 110,155– US$0.0339 per unit on 484,172 units in January 2019 110,105– US$0.0334 per unit on 434,622 units in February 2019 97,209
1,229,028
Distribution declared during the year– US$0.0302 per unit on 434,622 units in March 2019 88,174
Yearended31March2018
RMB
ClassAM2–USD
Distributions attributable to the year
Distributions declared and paid during the year– US$0.0392 per unit on 941,440 units in April 2017 254,753– US$0.0419 per unit on 871,683 units in May 2017 249,452– US$0.0449 per unit on 816,760 units in June 2017 249,091– US$0.0432 per unit on 816,760 units in July 2017 237,698– US$0.0408 per unit on 782,926 units in August 2017 210,691– US$0.0337 per unit on 667,467 units in September 2017 149,738– US$0.0321 per unit on 667,467 units in October 2017 142,186– US$0.0334 per unit on 657,547 units in November 2017 145,270– US$0.0360 per unit on 631,878 units in December 2017 148,573– US$0.0352 per unit on 601,845 units in January 2018 134,032– US$0.0369 per unit on 601,845 units in February 2018 140,683
2,062,167
Distribution declared during the year– US$0.0367 per unit on 502,422 units in March 2018 115,758
Yearended31March2019
RMB
ClassAM2–RMB
Distributions attributable to the year
Distributions declared and paid during the year– RMB0.0368 per unit on 4,564,657 units in April 2018 167,979– RMB0.0356 per unit on 4,559,745 units in May 2018 162,327– RMB0.0375 per unit on 4,416,480 units in June 2018 165,618– RMB0.0368 per unit on 4,048,657 units in July 2018 148,991– RMB0.0368 per unit on 4,048,657 units in August 2018 148,991– RMB0.0363 per unit on 3,950,749 units in September 2018 143,412– RMB0.0374 per unit on 3,950,749 units in October 2018 147,758– RMB0.0378 per unit on 3,950,749 units in November 2018 149,338– RMB0.0372 per unit on 3,938,937 units in December 2018 146,528– RMB0.0378 per unit on 4,152,407 units in January 2019 156,961– RMB0.0362 per unit on 3,925,741 units in February 2019 142,112
1,680,015
Distribution declared during the year– RMB0.0326 per unit on 3,793,844 units in March 2019 123,679
Yearended31March2018
RMB
ClassAM2–RMB
Distributions attributable to the year
Distributions declared and paid during the year– RMB0.0437 per unit on 4,504,210 units in April 2017 196,834– RMB0.0467 per unit on 4,464,936 units in May 2017 208,513– RMB0.0495 per unit on 4,233,540 units in June 2017 209,560– RMB0.0472 per unit on 5,111,752 units in July 2017 241,275– RMB0.0441 per unit on 5,196,927 units in August 2017 229,184– RMB0.0360 per unit on 5,152,211 units in September 2017 185,480– RMB0.0345 per unit on 5,103,073 units in October 2017 176,056– RMB0.0358 per unit on 5,027,950 units in November 2017 180,001– RMB0.0385 per unit on 5,027,950 units in December 2017 193,576– RMB0.0372 per unit on 4,993,552 units in January 2018 185,760– RMB0.0377 per unit on 4,792,632 units in February 2018 180,682
2,186,921
Distribution declared during the year– RMB0.0375 per unit on 4,664,253 units in March 2018 174,910

92
Notes to the Financial Statements
Yearended31March2019
RMB
ClassAM2–HKD
Distributions attributable to the year
Distributions declared and paid during the year– HK$0.0365 per unit on 1,203,161 units in April 2018 35,413– HK$0.0351 per unit on 1,148,245 units in May 2018 32,892– HK$0.0366 per unit on 1,136,440 units in June 2018 35,179– HK$0.0347 per unit on 737,092 units in July 2018 22,261– HK$0.0338 per unit on 658,347 units in August 2018 19,474– HK$0.0332 per unit on 658,347 units in September 2018 19,255– HK$0.0339 per unit on 658,347 units in October 2018 19,842– HK$0.0338 per unit on 658,347 units in November 2018 19,740– HK$0.0333 per unit on 658,347 units in December 2018 19,238– HK$0.0342 per unit on 658,347 units in January 2019 19,257– HK$0.0337 per unit on 658,347 units in February 2019 18,881
261,432
Distribution declared during the year– HK$0.0305 per unit on 658,347 units in March 2019 17,230
Yearended31March2018
RMB
ClassAM2–HKD
Distributions attributable to the year
Distributions declared and paid during the year– HK$0.0393 per unit on 2,478,625 units in April 2017 86,414– HK$0.0420 per unit on 2,438,616 units in May 2017 89,773– HK$0.0451 per unit on 1,807,615 units in June 2017 70,939– HK$0.0435 per unit on 1,618,225 units in July 2017 60,724– HK$0.0411 per unit on 1,562,205 units in August 2017 54,122– HK$0.0340 per unit on 1,433,154 units in September 2017 41,525– HK$0.0323 per unit on 1,433,154 units in October 2017 39,384– HK$0.0335 per unit on 1,232,581 units in November 2017 34,978– HK$0.0362 per unit on 1,232,581 units in December 2017 37,279– HK$0.0354 per unit on 1,203,161 units in January 2018 34,458– HK$0.0372 per unit on 1,203,161 units in February 2018 36,235
585,831
Distribution declared during the year– HK$0.0370 per unit on 1,203,161 units in March 2018 35,613
HSBCAsiaPacificexJapanEquityVolatilityFocusedFund
Yearended31March2019
USD
ClassAM2–USD
Distributions attributable to the year
Distributions declared and paid during the year– US$0.0319 per unit on 9,091,453 units in April 2018 290,017– US$0.0325 per unit on 10,018,400 units in May 2018 325,598– US$0.0325 per unit on 10,410,431 units in June 2018 338,339– US$0.0321 per unit on 9,879,532 units in July 2018 317,133– US$0.0327 per unit on 8,341,492 units in August 2018 272,767– US$0.0323 per unit on 7,744,825 units in September 2018 250,158– US$0.0327 per unit on 7,007,634 units in October 2018 229,150– US$0.0331 per unit on 6,374,785 units in November 2018 211,005– US$0.0320 per unit on 6,280,705 units in December 2018 200,983– US$0.0312 per unit on 6,375,456 units in January 2019 198,914– US$0.0320 per unit on 6,773,551 units in February 2019 216,754
2,850,818
Distributions declared during the year– US$0.0329 per unit on 6,336,359 units in March 2019 208,466
Yearended31March2018
USD
ClassAM2–USD
Distributions attributable to the year
Distributions declared and paid during the year– US$0.0284 per unit on 4,947,250 units in April 2017 140,502– US$0.0286 per unit on 4,438,548 units in May 2017 126,942– US$0.0292 per unit on 4,848,098 units in June 2017 141,564– US$0.0314 per unit on 5,294,838 units in July 2017 166,258– US$0.0307 per unit on 5,393,990 units in August 2017 165,595– US$0.0325 per unit on 4,849,978 units in September 2017 157,624– US$0.0346 per unit on 5,434,521 units in October 2017 188,034– US$0.0341 per unit on 5,502,984 units in November 2017 187,652– US$0.0328 per unit on 4,795,577 units in December 2017 157,295– US$0.0309 per unit on 5,697,396 units in January 2018 176,050– US$0.0318 per unit on 6,844,866 units in February 2018 217,667
1,825,183
Distributions declared during the year– US$0.0321 per unit on 8,840,023 units in March 2018 283,765
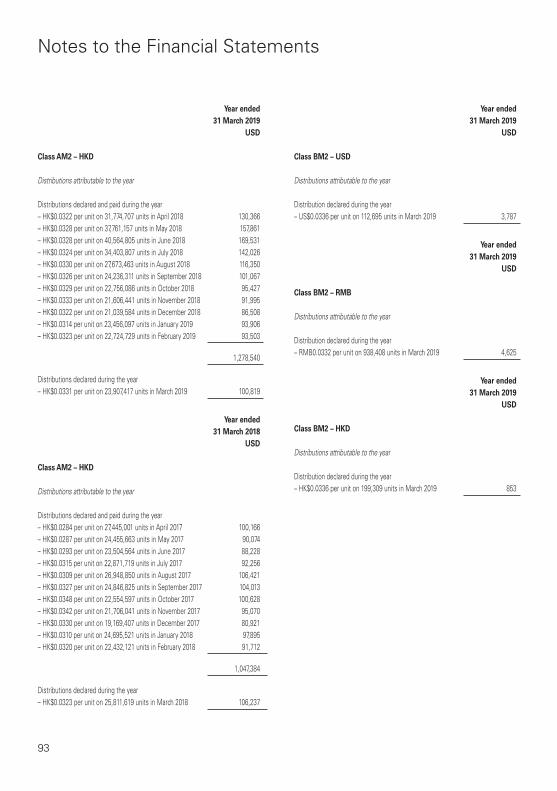
93
Notes to the Financial Statements
Yearended31March2019
USD
ClassAM2–HKD
Distributions attributable to the year
Distributions declared and paid during the year– HK$0.0322 per unit on 31,774,707 units in April 2018 130,366– HK$0.0328 per unit on 37,761,157 units in May 2018 157,861– HK$0.0328 per unit on 40,564,805 units in June 2018 169,531– HK$0.0324 per unit on 34,403,807 units in July 2018 142,026– HK$0.0330 per unit on 27,673,463 units in August 2018 116,350– HK$0.0326 per unit on 24,236,311 units in September 2018 101,067– HK$0.0329 per unit on 22,756,086 units in October 2018 95,427– HK$0.0333 per unit on 21,606,441 units in November 2018 91,995– HK$0.0322 per unit on 21,039,584 units in December 2018 86,508– HK$0.0314 per unit on 23,456,097 units in January 2019 93,906– HK$0.0323 per unit on 22,724,729 units in February 2019 93,503
1,278,540
Distributions declared during the year– HK$0.0331 per unit on 23,907,417 units in March 2019 100,819
Yearended31March2018
USD
ClassAM2–HKD
Distributions attributable to the year
Distributions declared and paid during the year– HK$0.0284 per unit on 27,445,001 units in April 2017 100,166– HK$0.0287 per unit on 24,455,663 units in May 2017 90,074– HK$0.0293 per unit on 23,504,564 units in June 2017 88,228– HK$0.0315 per unit on 22,871,719 units in July 2017 92,256– HK$0.0309 per unit on 26,948,850 units in August 2017 106,421– HK$0.0327 per unit on 24,846,825 units in September 2017 104,013– HK$0.0348 per unit on 22,554,597 units in October 2017 100,628– HK$0.0342 per unit on 21,706,041 units in November 2017 95,070– HK$0.0330 per unit on 19,169,407 units in December 2017 80,921– HK$0.0310 per unit on 24,695,521 units in January 2018 97,895– HK$0.0320 per unit on 22,432,121 units in February 2018 91,712
1,047,384
Distributions declared during the year– HK$0.0323 per unit on 25,811,619 units in March 2018 106,237
Yearended31March2019
USD
ClassBM2–USD
Distributions attributable to the year
Distribution declared during the year– US$0.0336 per unit on 112,695 units in March 2019 3,787
Yearended31March2019
USD
ClassBM2–RMB
Distributions attributable to the year
Distribution declared during the year– RMB0.0332 per unit on 938,408 units in March 2019 4,625
Yearended31March2019
USD
ClassBM2–HKD
Distributions attributable to the year
Distribution declared during the year– HK$0.0336 per unit on 199,309 units in March 2019 853
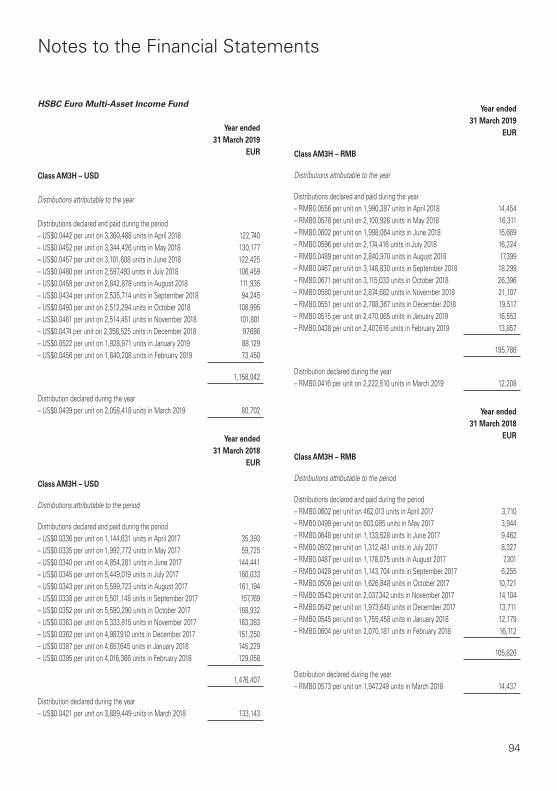
94
Notes to the Financial Statements
HSBCEuroMulti-AssetIncomeFund
Yearended31March2019
EUR
ClassAM3H–USD
Distributions attributable to the year
Distributions declared and paid during the period– US$0.0442 per unit on 3,360,488 units in April 2018 122,740– US$0.0452 per unit on 3,344,426 units in May 2018 130,177– US$0.0457 per unit on 3,101,608 units in June 2018 122,425– US$0.0480 per unit on 2,597,493 units in July 2018 106,459– US$0.0459 per unit on 2,842,878 units in August 2018 111,935– US$0.0434 per unit on 2,535,714 units in September 2018 94,245– US$0.0493 per unit on 2,512,294 units in October 2018 108,995– US$0.0461 per unit on 2,514,451 units in November 2018 101,801– US$0.0474 per unit on 2,356,525 units in December 2018 97,686– US$0.0522 per unit on 1,928,971 units in January 2019 88,129– US$0.0456 per unit on 1,840,208 units in February 2019 73,450
1,158,042
Distribution declared during the year– US$0.0439 per unit on 2,058,418 units in March 2019 80,702
Yearended31March2018
EUR
ClassAM3H–USD
Distributions attributable to the period
Distributions declared and paid during the period– US$0.0336 per unit on 1,144,631 units in April 2017 35,393– US$0.0335 per unit on 1,992,772 units in May 2017 59,725– US$0.0340 per unit on 4,854,281 units in June 2017 144,441– US$0.0345 per unit on 5,449,019 units in July 2017 160,033– US$0.0343 per unit on 5,599,723 units in August 2017 161,194– US$0.0338 per unit on 5,501,148 units in September 2017 157,769– US$0.0352 per unit on 5,580,290 units in October 2017 168,932– US$0.0363 per unit on 5,333,815 units in November 2017 163,383– US$0.0362 per unit on 4,987,910 units in December 2017 151,250– US$0.0387 per unit on 4,657,645 units in January 2018 145,229– US$0.0395 per unit on 4,016,366 units in February 2018 129,058
1,476,407
Distribution declared during the year– US$0.0421 per unit on 3,889,449 units in March 2018 133,143
Yearended31March2019
EUR
ClassAM3H–RMB
Distributions attributable to the year
Distributions declared and paid during the year– RMB0.0556 per unit on 1,990,387 units in April 2018 14,454– RMB0.0578 per unit on 2,100,926 units in May 2018 16,311– RMB0.0602 per unit on 1,998,064 units in June 2018 15,669– RMB0.0596 per unit on 2,174,416 units in July 2018 16,224– RMB0.0489 per unit on 2,840,970 units in August 2018 17,399– RMB0.0467 per unit on 3,148,830 units in September 2018 18,299– RMB0.0671 per unit on 3,115,033 units in October 2018 26,396– RMB0.0580 per unit on 2,874,682 units in November 2018 21,107– RMB0.0551 per unit on 2,788,367 units in December 2018 19,517– RMB0.0515 per unit on 2,470,065 units in January 2019 16,553– RMB0.0438 per unit on 2,407,616 units in February 2019 13,857
195,786
Distribution declared during the year– RMB0.0416 per unit on 2,222,510 units in March 2019 12,208
Yearended31March2018
EUR
ClassAM3H–RMB
Distributions attributable to the period
Distributions declared and paid during the period– RMB0.0602 per unit on 462,013 units in April 2017 3,710– RMB0.0499 per unit on 603,085 units in May 2017 3,944– RMB0.0648 per unit on 1,133,528 units in June 2017 9,462– RMB0.0502 per unit on 1,312,481 units in July 2017 8,327– RMB0.0487 per unit on 1,178,075 units in August 2017 7,301– RMB0.0429 per unit on 1,143,704 units in September 2017 6,255– RMB0.0509 per unit on 1,626,848 units in October 2017 10,721– RMB0.0543 per unit on 2,037,342 units in November 2017 14,104– RMB0.0542 per unit on 1,973,645 units in December 2017 13,711– RMB0.0545 per unit on 1,755,458 units in January 2018 12,179– RMB0.0604 per unit on 2,070,181 units in February 2018 16,112
105,826
Distribution declared during the year– RMB0.0573 per unit on 1,947,249 units in March 2018 14,437

95
Notes to the Financial Statements
Yearended31March2019
EUR
ClassAM3H–HKD
Distributions attributable to the year
Distributions declared and paid during the period– HK$0.0349 per unit on 17,707,085 units in April 2018 65,069– HK$0.0382 per unit on 16,586,188 units in May 2018 69,530– HK$0.0411 per unit on 14,611,363 units in June 2018 66,089– HK$0.0448 per unit on 14,301,148 units in July 2018 69,708– HK$0.0422 per unit on 13,915,353 units in August 2018 64,177– HK$0.0362 per unit on 12,349,131 units in September 2018 48,996– HK$0.0479 per unit on 13,092,314 units in October 2018 70,362– HK$0.0381 per unit on 12,529,649 units in November 2018 53,593– HK$0.0366 per unit on 12,222,443 units in December 2018 49,963– HK$0.0452 per unit on 10,332,547 units in January 2019 52,111– HK$0.0334 per unit on 9,987,056 units in February 2019 37,334
646,932
Distribution declared during the year– HK$0.0315 per unit on 9,132,445 units in March 2019 32,618
Yearended31March2018
EUR
ClassAM3H–HKD
Distributions attributable to the period
Distributions declared and paid during the period– HK$0.0274 per unit on 6,842,291 units in April 2017 22,174– HK$0.0270 per unit on 8,693,086 units in May 2017 26,944– HK$0.0273 per unit on 23,077,912 units in June 2017 70,644– HK$0.0273 per unit on 38,016,300 units in July 2017 113,110– HK$0.0276 per unit on 45,044,572 units in August 2017 133,318– HK$0.0291 per unit on 47,400,310 units in September 2017 149,859– HK$0.0303 per unit on 42,679,281 units in October 2017 142,586– HK$0.0322 per unit on 25,335,351 units in November 2017 88,160– HK$0.0327 per unit on 24,157,987 units in December 2017 84,667– HK$0.0355 per unit on 23,862,648 units in January 2018 87,283– HK$0.0348 per unit on 21,154,111 units in February 2018 76,552
995,297
Distribution declared during the year– HK$0.0353 per unit on 19,828,619 units in March 2018 72,517
Yearended31March2019
EUR
ClassAM2–EUR
Distributions attributable to the year
Distributions declared and paid during the period– EUR0.0230 per unit on 721,685 units in April 2018 16,599– EUR0.0230 per unit on 798,990 units in May 2018 18,377– EUR0.0239 per unit on 783,829 units in June 2018 18,734– EUR0.0242 per unit on 756,714 units in July 2018 18,312– EUR0.0235 per unit on 632,080 units in August 2018 14,854– EUR0.0236 per unit on 623,472 units in September 2018 14,714– EUR0.0236 per unit on 652,703 units in October 2018 15,404– EUR0.0239 per unit on 558,848 units in November 2018 13,356– EUR0.0246 per unit on 548,715 units in December 2018 13,498– EUR0.0245 per unit on 556,736 units in January 2019 13,640– EUR0.0236 per unit on 556,748 units in February 2019 13,139
170,627
Distribution declared during the year– EUR0.0212 per unit on 535,294 units in March 2019 11,348
Yearended31March2018
EUR
ClassAM2–EUR
Distributions attributable to the period
Distributions declared and paid during the period– EUR0.0217 per unit on 182,826 units in April 2017 3,967– EUR0.0211 per unit on 276,389 units in May 2017 5,832– EUR0.0211 per unit on 553,113 units in June 2017 11,671– EUR0.0209 per unit on 605,764 units in July 2017 12,661– EUR0.0206 per unit on 375,201 units in August 2017 7,729– EUR0.0202 per unit on 416,490 units in September 2017 8,413– EUR0.0213 per unit on 438,575 units in October 2017 9,342– EUR0.0218 per unit on 443,800 units in November 2017 9,675– EUR0.0211 per unit on 443,981 units in December 2017 9,368– EUR0.0219 per unit on 521,283 units in January 2018 11,416– EUR0.0220 per unit on 531,039 units in February 2018 11,683
101,757
Distribution declared during the year– EUR0.0228 per unit on 527,103 units in March 2018 12,018

96
Notes to the Financial Statements
Yearended31March2019
EUR
ClassAM3H–CAD
Distributions attributable to the year
Distributions declared and paid during the period– CAD0.0384 per unit on 297,756 units in April 2018 7,346– CAD0.0390 per unit on 311,644 units in May 2018 8,127– CAD0.0399 per unit on 250,242 units in June 2018 6,502– CAD0.0407 per unit on 234,339 units in July 2018 6,265– CAD0.0405 per unit on 226,271 units in August 2018 6,062– CAD0.0384 per unit on 240,222 units in September 2018 6,046– CAD0.0412 per unit on 232,239 units in October 2018 6,411– CAD0.0406 per unit on 296,803 units in November 2018 7,968– CAD0.0476 per unit on 302,682 units in December 2018 9,241– CAD0.0426 per unit on 330,071 units in January 2019 9,323– CAD0.0389 per unit on 266,459 units in February 2019 6,929
80,220
Distribution declared during the year– CAD0.0369 per unit on 286,804 units in March 2019 7,016
Yearended31March2018
EUR
ClassAM3H–CAD
Distributions attributable to the period
Distributions declared and paid during the period– CAD0.0311 per unit on 183,937 units in April 2017 3,857– CAD0.0309 per unit on 455,481 units in May 2017 9,350– CAD0.0308 per unit on 906,009 units in June 2017 18,802– CAD0.0310 per unit on 710,123 units in July 2017 15,084– CAD0.0330 per unit on 773,445 units in August 2017 16,980– CAD0.0330 per unit on 710,960 units in September 2017 15,970– CAD0.0349 per unit on 860,451 units in October 2017 20,123– CAD0.0355 per unit on 521,421 units in November 2017 12,156– CAD0.0345 per unit on 521,421 units in December 2017 11,967– CAD0.0366 per unit on 399,183 units in January 2018 9,550– CAD0.0378 per unit on 413,062 units in February 2018 9,975
143,814
Distribution declared during the year– CAD0.0387 per unit on 285,561 units in March 2018 6,970
Yearended31March2019
EUR
ClassAM3H–AUD
Distributions attributable to the year
Distributions declared and paid during the period– AUD0.0401 per unit on 602,812 units in April 2018 15,118– AUD0.0411 per unit on 788,589 units in May 2018 21,088– AUD0.0416 per unit on 761,595 units in June 2018 20,103– AUD0.0475 per unit on 690,089 units in July 2018 20,736– AUD0.0438 per unit on 659,142 units in August 2018 18,040– AUD0.0418 per unit on 713,698 units in September 2018 18,444– AUD0.0478 per unit on 772,523 units in October 2018 23,109– AUD0.0425 per unit on 768,237 units in November 2018 20,968– AUD0.0423 per unit on 649,541 units in December 2018 16,908– AUD0.0474 per unit on 702,202 units in January 2019 20,949– AUD0.0406 per unit on 642,455 units in February 2019 16,367
211,830
Distribution declared during the year– AUD0.0388 per unit on 877,328 units in March 2019 21,444
Yearended31March2018
EUR
ClassAM3H–AUD
Distributions attributable to the period
Distributions declared and paid during the period– AUD0.0371 per unit on 287,465 units in April 2017 7,312– AUD0.0372 per unit on 308,768 units in May 2017 7,662– AUD0.0374 per unit on 528,138 units in June 2017 13,274– AUD0.0371 per unit on 587,356 units in July 2017 14,848– AUD0.0363 per unit on 520,961 units in August 2017 12,544– AUD0.0358 per unit on 543,574 units in September 2017 12,937– AUD0.0373 per unit on 495,837 units in October 2017 12,212– AUD0.0380 per unit on 591,311 units in November 2017 14,364– AUD0.0374 per unit on 591,240 units in December 2017 14,432– AUD0.0386 per unit on 641,425 units in January 2018 16,137– AUD0.0386 per unit on 578,770 units in February 2018 14,189
139,911
Distribution declared during the year– AUD0.0397 per unit on 574,752 units in March 2018 14,231

97
Notes to the Financial Statements
Yearended31March2019
EUR
ClassAM3H–NZD
Distributions attributable to the year
Distributions declared and paid during the period– NZD0.0415 per unit on 290,600 units in April 2018 7,041– NZD0.0427 per unit on 466,313 units in May 2018 11,967– NZD0.0430 per unit on 323,246 units in June 2018 8,105– NZD0.0472 per unit on 1,041,140 units in July 2018 28,661– NZD0.0457 per unit on 1,251,992 units in August 2018 32,668– NZD0.0432 per unit on 1,312,979 units in September 2018 32,193– NZD0.0480 per unit on 648,255 units in October 2018 17,963– NZD0.0429 per unit on 566,775 units in November 2018 14,653– NZD0.0430 per unit on 540,581 units in December 2018 13,608– NZD0.0468 per unit on 405,475 units in January 2019 11,349– NZD0.0401 per unit on 314,048 units in February 2019 7,579
185,787
Distribution declared during the year– NZD0.0385 per unit on 284,369 units in March 2019 6,619
Yearended31March2018
EUR
ClassAM3H–NZD
Distributions attributable to the period
Distributions declared and paid during the period– NZD0.0405 per unit on 32,756 units in April 2017 838– NZD0.0403 per unit on 83,458 units in May 2017 2,132– NZD0.0405 per unit on 182,551 units in June 2017 4,723– NZD0.0400 per unit on 231,088 units in July 2017 5,908– NZD0.0393 per unit on 174,262 units in August 2017 4,142– NZD0.0391 per unit on 202,070 units in September 2017 4,837– NZD0.0403 per unit on 500,923 units in October 2017 11,926– NZD0.0412 per unit on 769,447 units in November 2017 18,431– NZD0.0399 per unit on 776,629 units in December 2017 18,401– NZD0.0402 per unit on 643,148 units in January 2018 15,298– NZD0.0404 per unit on 389,538 units in February 2018 9,287
95,923
Distribution declared during the year– NZD0.0417 per unit on 322,105 units in March 2018 7,879
HSBCAsiaHighIncomeBondFund
Yearended31March2019
USD
ClassAM2–USD
Distributions attributable to the period
Distributions declared and paid during the period– US$0.0353 per unit on 65,834,152 units in April 2018 2,323,946– US$0.0348 per unit on 58,431,621 units in May 2018 2,033,420– US$0.0347 per unit on 54,742,072 units in June 2018 1,899,550– US$0.0396 per unit on 51,112,661 units in July 2018 2,024,061– US$0.0396 per unit on 48,155,592 units in August 2018 1,906,961– US$0.0393 per unit on 45,723,608 units in September 2018 1,796,938– US$0.0389 per unit on 43,338,990 units in October 2018 1,685,887– US$0.0385 per unit on 40,842,008 units in November 2018 1,572,417– US$0.0389 per unit on 39,581,118 units in December 2018 1,539,706– US$0.0438 per unit on 39,975,439 units in January 2019 1,750,924– US$0.0446 per unit on 42,714,708 units in February 2019 1,905,076
20,438,886
Distribution declared during the year– US$0.0448 per unit on 43,508,272 units in March 2019 1,949,171
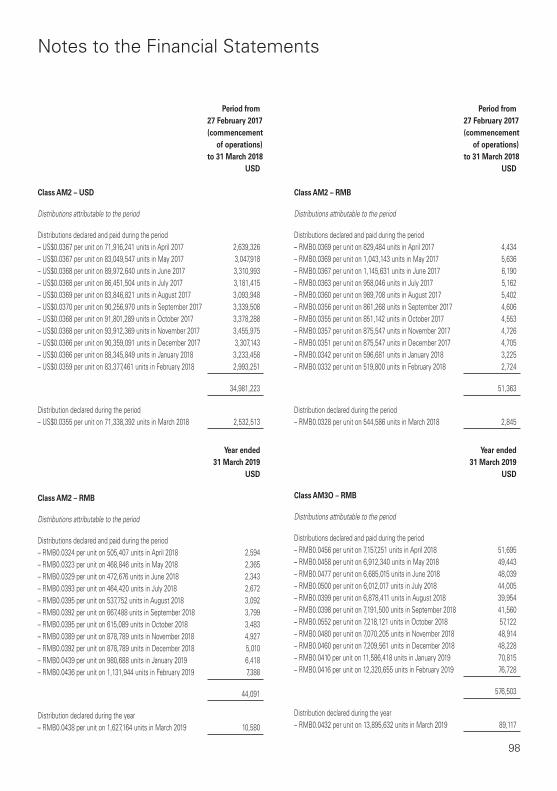
98
Notes to the Financial Statements
Periodfrom27February2017(commencement
ofoperations)to31March2018
USD
ClassAM2–USD
Distributions attributable to the period
Distributions declared and paid during the period– US$0.0367 per unit on 71,916,241 units in April 2017 2,639,326– US$0.0367 per unit on 83,049,547 units in May 2017 3,047,918– US$0.0368 per unit on 89,972,640 units in June 2017 3,310,993– US$0.0368 per unit on 86,451,504 units in July 2017 3,181,415– US$0.0369 per unit on 83,846,821 units in August 2017 3,093,948– US$0.0370 per unit on 90,256,970 units in September 2017 3,339,508– US$0.0368 per unit on 91,801,289 units in October 2017 3,378,288– US$0.0368 per unit on 93,912,369 units in November 2017 3,455,975– US$0.0366 per unit on 90,359,091 units in December 2017 3,307,143– US$0.0366 per unit on 88,345,849 units in January 2018 3,233,458– US$0.0359 per unit on 83,377,461 units in February 2018 2,993,251
34,981,223
Distribution declared during the period– US$0.0355 per unit on 71,338,392 units in March 2018 2,532,513
Yearended31March2019
USD
ClassAM2–RMB
Distributions attributable to the period
Distributions declared and paid during the period– RMB0.0324 per unit on 505,407 units in April 2018 2,594– RMB0.0323 per unit on 468,846 units in May 2018 2,365– RMB0.0329 per unit on 472,676 units in June 2018 2,343– RMB0.0393 per unit on 464,420 units in July 2018 2,672– RMB0.0395 per unit on 537,752 units in August 2018 3,092– RMB0.0392 per unit on 667,488 units in September 2018 3,799– RMB0.0395 per unit on 615,089 units in October 2018 3,483– RMB0.0389 per unit on 878,789 units in November 2018 4,927– RMB0.0392 per unit on 878,789 units in December 2018 5,010– RMB0.0439 per unit on 980,688 units in January 2019 6,418– RMB0.0436 per unit on 1,131,944 units in February 2019 7,388
44,091
Distribution declared during the year– RMB0.0438 per unit on 1,627,164 units in March 2019 10,580
Periodfrom27February2017(commencement
ofoperations)to31March2018
USD
ClassAM2–RMB
Distributions attributable to the period
Distributions declared and paid during the period– RMB0.0369 per unit on 829,484 units in April 2017 4,434– RMB0.0369 per unit on 1,043,143 units in May 2017 5,636– RMB0.0367 per unit on 1,145,631 units in June 2017 6,190– RMB0.0363 per unit on 958,046 units in July 2017 5,162– RMB0.0360 per unit on 989,708 units in August 2017 5,402– RMB0.0356 per unit on 861,268 units in September 2017 4,606– RMB0.0355 per unit on 851,142 units in October 2017 4,553– RMB0.0357 per unit on 875,547 units in November 2017 4,726– RMB0.0351 per unit on 875,547 units in December 2017 4,705– RMB0.0342 per unit on 596,681 units in January 2018 3,225– RMB0.0332 per unit on 519,800 units in February 2018 2,724
51,363
Distribution declared during the period– RMB0.0328 per unit on 544,586 units in March 2018 2,845
Yearended31March2019
USD
ClassAM3O–RMB
Distributions attributable to the period
Distributions declared and paid during the period– RMB0.0456 per unit on 7,157,251 units in April 2018 51,695– RMB0.0458 per unit on 6,912,340 units in May 2018 49,443– RMB0.0477 per unit on 6,685,015 units in June 2018 48,039– RMB0.0500 per unit on 6,012,017 units in July 2018 44,005– RMB0.0399 per unit on 6,878,411 units in August 2018 39,954– RMB0.0398 per unit on 7,191,500 units in September 2018 41,560– RMB0.0552 per unit on 7,218,121 units in October 2018 57,122– RMB0.0480 per unit on 7,070,205 units in November 2018 48,914– RMB0.0460 per unit on 7,209,561 units in December 2018 48,228– RMB0.0410 per unit on 11,586,418 units in January 2019 70,815– RMB0.0416 per unit on 12,320,655 units in February 2019 76,728
576,503
Distribution declared during the year– RMB0.0432 per unit on 13,895,632 units in March 2019 89,117

99
Notes to the Financial Statements
Periodfrom27February2017(commencement
ofoperations)to31March2018
USD
ClassAM3O–RMB
Distributions attributable to the period
Distributions declared and paid during the period– RMB0.0531 per unit on 1,798,340 units in November 2017 14,437– RMB0.0530 per unit on 2,584,311 units in December 2017 20,971– RMB0.0511 per unit on 4,020,757 units in January 2018 32,475– RMB0.0547 per unit on 6,069,966 units in February 2018 52,400
120,283
Distribution declared during the period– RMB0.0492 per unit on 6,337,592 units in March 2018 49,668
Yearended31March2019
USD
ClassAM2–HKD
Distributions attributable to the period
Distributions declared and paid during the period– HK$0.0357 per unit on 410,646,135 units in April 2018 1,867,941– HK$0.0352 per unit on 361,729,132 units in May 2018 1,622,869– HK$0.0350 per unit on 320,277,754 units in June 2018 1,428,308– HK$0.0400 per unit on 307,993,149 units in July 2018 1,569,702– HK$0.0401 per unit on 282,845,106 units in August 2018 1,445,045– HK$0.0396 per unit on 261,339,444 units in September 2018 1,323,805– HK$0.0393 per unit on 239,215,778 units in October 2018 1,198,282– HK$0.0389 per unit on 225,830,663 units in November 2018 1,123,234– HK$0.0393 per unit on 220,330,203 units in December 2018 1,105,681– HK$0.0442 per unit on 215,668,324 units in January 2019 1,215,397– HK$0.0451 per unit on 226,533,595 units in February 2019 1,300,642
15,200,906
Distribution declared during the year– HK$0.0454 per unit on 245,032,244 units in March 2019 1,418,116
Periodfrom27February2017(commencement
ofoperations)to31March2018
USD
ClassAM2–HKD
Distributions attributable to the period
Distributions declared and paid during the period– HK$0.0368 per unit on 407,233,972 units in April 2017 1,925,889– HK$0.0368 per unit on 476,438,790 units in May 2017 2,250,049– HK$0.0370 per unit on 527,738,437 units in June 2017 2,501,547– HK$0.0370 per unit on 552,400,853 units in July 2017 2,617,226– HK$0.0372 per unit on 543,959,442 units in August 2017 2,586,046– HK$0.0372 per unit on 571,871,739 units in September 2017 2,723,391– HK$0.0370 per unit on 605,214,389 units in October 2017 2,870,870– HK$0.0370 per unit on 616,478,527 units in November 2017 2,921,157– HK$0.0369 per unit on 594,361,630 units in December 2017 2,805,547– HK$0.0369 per unit on 527,935,624 units in January 2018 2,491,074– HK$0.0362 per unit on 494,006,861 units in February 2018 2,284,728
27,977,524
Distribution declared during the period– HK$0.0359 per unit on 442,466,894 units in March 2018 2,024,117
Yearended31March2019
USD
ClassAM2–EUR
Distributions attributable to the period
Distributions declared and paid during the period– EUR0.0304 per unit on 54,357 units in April 2018 2,004– EUR0.0313 per unit on 51,794 units in May 2018 1,891– EUR0.0316 per unit on 51,794 units in June 2018 1,894– EUR0.0357 per unit on 59,188 units in July 2018 2,474– EUR0.0364 per unit on 59,188 units in August 2018 2,513– EUR0.0354 per unit on 59,188 units in September 2018 2,439– EUR0.0359 per unit on 58,955 units in October 2018 2,401– EUR0.0357 per unit on 67,318 units in November 2018 2,737– EUR0.0361 per unit on 67,318 units in December 2018 2,782– EUR0.0405 per unit on 79,830 units in January 2019 3,714– EUR0.0411 per unit on 76,743 units in February 2019 3,588
28,437
Distribution declared during the year– EUR0.0416 per unit on 69,349 units in March 2019 3,240

100
Notes to the Financial Statements
Periodfrom27February2017(commencement
ofoperations)to31March2018
USD
ClassAM2–EUR
Distributions attributable to the period
Distributions declared and paid during the period– EUR0.0362 per unit on 30,234 units in April 2017 1,189– EUR0.0349 per unit on 19,888 units in May 2017 775– EUR0.0350 per unit on 19,888 units in June 2017 795– EUR0.0334 per unit on 17,282 units in July 2017 678– EUR0.0332 per unit on 19,324 units in August 2017 763– EUR0.0329 per unit on 21,874 units in September 2017 848– EUR0.0329 per unit on 32,638 units in October 2017 1,251– EUR0.0331 per unit on 41,925 units in November 2017 1,645– EUR0.0326 per unit on 41,925 units in December 2017 1,633– EUR0.0316 per unit on 37,904 units in January 2018 1,487– EUR0.0308 per unit on 44,805 units in February 2018 1,690
12,754
Distribution declared during the period– EUR0.0306 per unit on 48,749 units in March 2018 1,835
Yearended31March2019
USD
ClassAM3O–EUR
Distributions attributable to the period
Distributions declared and paid during the period– EUR0.0152 per unit on 39,691 units in April 2018 732– EUR0.0146 per unit on 275,778 units in May 2018 4,696– EUR0.0145 per unit on 264,140 units in June 2018 4,431– EUR0.0168 per unit on 264,140 units in July 2018 5,195– EUR0.0183 per unit on 264,140 units in August 2018 5,639– EUR0.0202 per unit on 257,966 units in September 2018 6,067– EUR0.0138 per unit on 32,428 units in October 2018 508– EUR0.0166 per unit on 4,581 units in November 2018 87– EUR0.0159 per unit on 6,314 units in December 2018 115– EUR0.0104 per unit on 19,315 units in January 2019 231– EUR0.0220 per unit on 6,314 units in February 2019 158
27,859
Distribution declared during the year– EUR0.0217 per unit on 34,981 units in March 2019 853
Periodfrom27February2017(commencement
ofoperations)to31March2018
USD
ClassAM3O–EUR
Distributions attributable to the period
Distributions declared and paid during the period– EUR0.0231 per unit on 15,156 units in November 2017 415– EUR0.0222 per unit on 15,156 units in December 2017 402– EUR0.0205 per unit on 47,731 units in January 2018 1,215– EUR0.0196 per unit on 47,731 units in February 2018 1,144
3,176
Distribution declared during the period– EUR0.0174 per unit on 40,770 units in March 2018 873
Yearended31March2019
USD
ClassAM2–AUD
Distributions attributable to the period
Distributions declared and paid during the period– AUD0.0355 per unit on 184,036 units in April 2018 4,949– AUD0.0355 per unit on 186,287 units in May 2018 5,010– AUD0.0362 per unit on 254,561 units in June 2018 6,765– AUD0.0412 per unit on 330,567 units in July 2018 10,091– AUD0.0415 per unit on 432,697 units in August 2018 13,017– AUD0.0415 per unit on 462,904 units in September 2018 13,851– AUD0.0423 per unit on 411,531 units in October 2018 12,335– AUD0.0409 per unit on 623,358 units in November 2018 18,661– AUD0.0423 per unit on 621,389 units in December 2018 18,541– AUD0.0480 per unit on 1,121,274 units in January 2019 39,018– AUD0.0469 per unit on 1,077,150 units in February 2019 36,063
178,301
Distribution declared during the year– AUD0.0483 per unit on 1,046,447 units in March 2019 35,818

101
Notes to the Financial Statements
Periodfrom27February2017(commencement
ofoperations)to31March2018
USD
ClassAM2–AUD
Distributions attributable to the period
Distributions declared and paid during the period– AUD0.0376 per unit on 169,721 units in April 2017 4,768– AUD0.0382 per unit on 167,717 units in May 2017 4,786– AUD0.0375 per unit on 181,427 units in June 2017 5,240– AUD0.0357 per unit on 179,731 units in July 2017 5,109– AUD0.0359 per unit on 227,565 units in August 2017 6,470– AUD0.0356 per unit on 241,775 units in September 2017 6,757– AUD0.0361 per unit on 321,017 units in October 2017 8,898– AUD0.0376 per unit on 302,422 units in November 2017 8,608– AUD0.0368 per unit on 288,359 units in December 2017 8,277– AUD0.0352 per unit on 210,222 units in January 2018 5,970– AUD0.0351 per unit on 199,186 units in February 2018 5,427
70,310
Distribution declared during the period– AUD0.0355 per unit on 199,186 units in March 2018 5,431
Yearended31March2019
USD
ClassAM3O–AUD
Distributions attributable to the period
Distributions declared and paid during the period– AUD0.0314 per unit on 4,965,354 units in April 2018 118,111– AUD0.0309 per unit on 3,645,994 units in May 2018 85,358– AUD0.0307 per unit on 3,240,196 units in June 2018 73,024– AUD0.0376 per unit on 2,933,127 units in July 2018 81,716– AUD0.0375 per unit on 2,626,291 units in August 2018 71,392– AUD0.0372 per unit on 2,649,396 units in September 2018 71,060– AUD0.0372 per unit on 2,570,472 units in October 2018 67,757– AUD0.0351 per unit on 2,313,192 units in November 2018 59,429– AUD0.0332 per unit on 2,220,944 units in December 2018 52,013– AUD0.0374 per unit on 2,845,491 units in January 2019 77,150– AUD0.0391 per unit on 3,726,398 units in February 2019 104,010
861,020
Distribution declared during the year– AUD0.0391 per unit on 5,297,883 units in March 2019 146,795
Periodfrom27February2017(commencement
ofoperations)to31March2018
USD
ClassAM3O–AUD
Distributions attributable to the period
Distributions declared and paid during the period– AUD0.0381 per unit on 2,746,820 units in November 2017 79,223– AUD0.0375 per unit on 3,407,431 units in December 2017 99,661– AUD0.0363 per unit on 3,730,955 units in January 2018 109,268– AUD0.0349 per unit on 2,460,537 units in February 2018 66,616
354,768
Distribution declared during the period– AUD0.0331 per unit on 3,019,665 units in March 2018 76,772
Yearended31March2019
USD
ClassAM2–CAD
Distributions attributable to the period
Distributions declared and paid during the period– CAD0.0344 per unit on 58,927 units in April 2018 1,579– CAD0.0341 per unit on 61,819 units in May 2018 1,637– CAD0.0351 per unit on 61,819 units in June 2018 1,636– CAD0.0396 per unit on 61,819 units in July 2018 1,879– CAD0.0394 per unit on 61,575 units in August 2018 1,867– CAD0.0387 per unit on 82,441 units in September 2018 2,448– CAD0.0388 per unit on 90,655 units in October 2018 2,683– CAD0.0390 per unit on 79,345 units in November 2018 2,330– CAD0.0402 per unit on 69,928 units in December 2018 2,064– CAD0.0456 per unit on 280,151 units in January 2019 9,719– CAD0.0445 per unit on 282,209 units in February 2019 9,543
37,385
Distribution declared during the year– CAD0.0449 per unit on 423,743 units in March 2019 14,171

102
Notes to the Financial Statements
Periodfrom27February2017(commencement
ofoperations)to31March2018
USD
ClassAM2–CAD
Distributions attributable to the period
Distributions declared and paid during the period– CAD0.0377 per unit on 121,896 units in April 2017 3,370– CAD0.0381 per unit on 167,907 units in May 2017 4,754– CAD0.0373 per unit on 194,676 units in June 2017 5,594– CAD0.0353 per unit on 55,519 units in July 2017 1,571– CAD0.0355 per unit on 55,519 units in August 2017 1,561– CAD0.0348 per unit on 33,177 units in September 2017 929– CAD0.0351 per unit on 35,096 units in October 2017 960– CAD0.0359 per unit on 40,676 units in November 2017 1,135– CAD0.0358 per unit on 40,676 units in December 2017 1,159– CAD0.0346 per unit on 37,225 units in January 2018 1,045– CAD0.0347 per unit on 81,232 units in February 2018 2,201
24,279
Distribution declared during the period– CAD0.0353 per unit on 95,396 units in March 2018 2,613
Yearended31March2019
USD
ClassAM3O–CAD
Distributions attributable to the period
Distributions declared and paid during the period– CAD0.0298 per unit on 923,501 units in April 2018 21,441– CAD0.0290 per unit on 934,988 units in May 2018 21,052– CAD0.0293 per unit on 934,683 units in June 2018 20,653– CAD0.0321 per unit on 918,342 units in July 2018 22,627– CAD0.0340 per unit on 868,293 units in August 2018 22,718– CAD0.0338 per unit on 785,435 units in September 2018 20,373– CAD0.0312 per unit on 992,126 units in October 2018 23,608– CAD0.0327 per unit on 1,015,929 units in November 2018 25,009– CAD0.0320 per unit on 1,531,574 units in December 2018 35,983– CAD0.0309 per unit on 1,354,647 units in January 2019 31,845– CAD0.0371 per unit on 1,736,752 units in February 2019 48,963
294,272
Distribution declared during the year– CAD0.0372 per unit on 2,263,316 units in March 2019 62,711
Periodfrom27February2017(commencement
ofoperations)to31March2018
USD
ClassAM3O–CAD
Distributions attributable to the period
Distributions declared and paid during the period– CAD0.0359 per unit on 504,043 units in November 2017 14,065– CAD0.0348 per unit on 573,119 units in December 2017 15,877– CAD0.0344 per unit on 776,096 units in January 2018 21,650– CAD0.0341 per unit on 812,738 units in February 2018 21,637
73,229
Distribution declared during the period– CAD0.0322 per unit on 1,065,530 units in March 2018 26,624
Yearended31March2019
USD
ClassAM3O–GBP
Distributions attributable to the period
Distributions declared and paid during the period– GBP0.0220 per unit on 472,862 units in April 2018 14,330– GBP0.0224 per unit on 503,608 units in May 2018 15,001– GBP0.0217 per unit on 492,496 units in June 2018 13,973– GBP0.0248 per unit on 455,480 units in July 2018 14,834– GBP0.0272 per unit on 430,001 units in August 2018 15,223– GBP0.0286 per unit on 458,208 units in September 2018 17,140– GBP0.0242 per unit on 464,661 units in October 2018 14,289– GBP0.0260 per unit on 509,695 units in November 2018 16,938– GBP0.0254 per unit on 561,028 units in December 2018 18,083– GBP0.0232 per unit on 678,429 units in January 2019 20,631– GBP0.0303 per unit on 806,980 units in February 2019 32,556
192,998
Distribution declared during the year– GBP0.0303 per unit on 754,686 units in March 2019 29,865

103
Notes to the Financial Statements
Periodfrom27February2017(commencement
ofoperations)to31March2018
USD
ClassAM3O–GBP
Distributions attributable to the period
Distributions declared and paid during the period– GBP0.0277 per unit on 390,711 units in November 2017 14,518– GBP0.0286 per unit on 255,748 units in December 2017 9,836– GBP0.0271 per unit on 376,245 units in January 2018 14,439– GBP0.0261 per unit on 404,828 units in February 2018 14,748
53,541
Distribution declared during the period– GBP0.0218 per unit on 548,465 units in March 2018 16,757
Yearended31March2019
USD
ClassAM3O–SGD
Distributions attributable to the period
Distributions declared and paid during the period– SGD0.0291 per unit on 100 units in April 2018 2– SGD0.0290 per unit on 100 units in May 2018 2– SGD0.0292 per unit on 100 units in June 2018 2– SGD0.0328 per unit on 100 units in July 2018 2– SGD0.0333 per unit on 100 units in August 2018 2– SGD0.0346 per unit on 100 units in September 2018 3– SGD0.0328 per unit on 100 units in October 2018 2– SGD0.0313 per unit on 100 units in November 2018 2– SGD0.0324 per unit on 100 units in December 2018 2– SGD0.0362 per unit on 100 units in January 2019 3– SGD0.0381 per unit on 100 units in February 2019 3
25
Distribution declared during the year– SGD0.0388 per unit on 100 units in March 2019 3
Periodfrom27February2017(commencement
ofoperations)to31March2018
USD
ClassAM3O–SGD
Distributions attributable to the period
Distributions declared and paid during the period– SGD0.0344 per unit on 100 units in November 2017 3– SGD0.0335 per unit on 100 units in December 2017 3– SGD0.0326 per unit on 100 units in January 2018 2– SGD0.0304 per unit on 100 units in February 2018 2
10
Distribution declared during the period– SGD0.0307 per unit on 100 units in March 2018 2
During the year/period ended 31 March 2019 and 31 March 2018, no distributions were made to the unitholders of Class AC – USD, Class AC – RMB, Class AC – HKD, Class ZC – RMB and Class ZC – USD.
14 Softdollarcommission
As regards to HSBC China Multi-Asset Income Fund and HSBC Asia Pacific ex Japan Equity Volatility Focused Fund, the Manager has entered into soft dollar commission arrangements with brokers under which certain goods and services used to support investment decision making. The Manager did not make direct payment for these services but transacted an agreed amount of business with the brokers on behalf of the relevant funds. Commission was paid from the relevant funds of these transactions.
As regards to HSBC All China Bond Fund (formerly known as HSBC RQFII Chinese Fixed Income Fund), HSBC Euro Multi-Asset Income Fund and HSBC Asia High Income Bond Fund, the Manager has not entered into any soft dollar commission arrangement with brokers during the year/period.
104
Notes to the Financial Statements
15 Possibleimpactofamendments,newstandardsandinterpretationsissuedbutnotyeteffectivefortheyearended31March2019
Up to the date of issue of these financial statements, the HKICPA has issued a number of amendments, new standards and interpretations which are not yet effective for the year ended 31 March 2019 and which have not been adopted in these financial statements.
Of these developments, the following may be relevant to the sub-funds’ operations and financial statements:
Effectiveforaccounting
yearsbeginningonorafter
Annual Improvements to HKFRSs 2015-2017 Cycle
1 January 2019
HK(IFRIC) 23, Uncertainty over income tax treatments
1 January 2019
The sub-funds are in the process of making an assessment of what the impact of these amendments and interpretations is expected to be in the period of initial application. So far it has concluded that the adoption of them is unlikely to have a significant impact on the sub-funds’ results of operations and financial position.

105
Portfolio Statement (Unaudited)
HSBCChinaMulti-AssetIncomeFundas at 31 March 2019
HoldingsMarket
value
%ofnet
assetsvalue
HKD
EquitiesListed investments
ChinaCHINA INTERNATIONAL TRAVEL 92,085 7,537,693 0.17CHINA MERCHANTS SHEKOU
INDUSTRIAL ZONE HOLDINGS CO LTD 1,382,617 37,208,302 0.84
GREE ELECTRIC APPLIANCES INC 364,698 20,110,500 0.46KWEICHOW MOUTAI CO LTD 16,788 16,745,851 0.38LUXSHARE PRECISION INDUSTRY CO
LTD 1,139,403 33,005,364 0.75MIDEA GROUP CO LTD 230,345 13,110,845 0.30OFILM GROUP CO LTD 993,782 16,482,951 0.37PING AN INSURANCE GROUP CO LTD 108,862 9,803,613 0.22POLY DEVELOPMENTS AND
HOLDINGS GROUP CO LTD 1,574,800 26,193,340 0.59QINGDAO HAIER CO LTD 599,942 11,989,878 0.27WULIANGYE YIBIN CO LTD 141,472 15,698,190 0.36
207,886,527 4.71
HongKong3SBIO INC 480,500 7,418,920 0.17AGRICULTURAL BANK OF CHINA LTD 5,435,000 19,674,700 0.44AIR CHINA LTD 812,000 7,843,920 0.18ANTON OILFIELD SERVICES GROUP 11,292,000 14,002,080 0.32BANK OF CHINA LTD 9,981,000 35,532,360 0.80BANK OF COMMUNICATIONS CO LTD 1,718,000 11,046,740 0.25CHINA COMMUNICATIONS
CONSTRUCTION CO LTD 1,979,000 16,069,480 0.36CHINA CONSTRUCTION BANK CORP 16,047,000 107,996,310 2.44CHINA EASTERN AIRLINES
CORPORATION LTD 766,000 4,266,620 0.10CHINA GALAXY SECURITIES CO LTD 1,110,500 5,730,180 0.13CHINA JINMAO HOLDINGS GROUP
LTD 4,196,000 21,483,520 0.49CHINA LONGYUAN POWER GROUP
CORP LTD 565,000 3,084,900 0.07CHINA MENGNIU DAIRY CO LTD 377,000 11,008,400 0.25CHINA MERCHANTS BANK CO LTD 615,000 23,462,250 0.53CHINA MOBILE LTD 725,000 58,000,000 1.31CHINA OVERSEAS LAND &
INVESTMENT LTD 726,000 21,634,800 0.49
HoldingsMarket
value
%ofnet
assetsvalue
HKD
CHINA OVERSEAS PROPERTY HOLDINGS LTD 5,875,000 22,148,750 0.50
CHINA PACIFIC INSURANCE GROUP CO LTD 1,036,800 31,933,440 0.72
CHINA PETROLEUM AND CHEMICAL CORP 2,238,000 13,853,220 0.31
CHINA POWER INTERNATIONAL DEVELOPMENT LTD 10,653,000 21,412,530 0.48
CHINA RAILWAY CONSTRUCTION CORP 505,500 5,196,540 0.12
CHINA RAILWAY GROUP LTD 1,035,000 7,410,600 0.17CHINA RESOURCES CEMENT
HOLDINGS LTD 1,144,000 9,266,400 0.21CHINA RESOURCES LAND LTD 384,000 13,516,800 0.31CHINA RESOURCES POWER
HOLDINGS CO LTD 1,832,000 21,617,600 0.49CHINA SOUTHERN AIRLINES CO LTD 1,604,000 11,260,080 0.25CHINA TAIPING INSURANCE
HOLDINGS CO LTD 317,200 7,422,480 0.17CHINA TELECOM CORPORATION LTD 2,378,000 10,368,080 0.23CHINA TOWER CORP LTD 27,360,000 49,795,200 1.13CHINA UNICOM HONG KONG LTD 5,902,000 58,724,900 1.33CIMC ENRIC HOLDINGS LTD 1,518,000 12,219,900 0.28CNOOC LTD 3,923,000 57,668,100 1.30COFCO MEAT HOLDINGS LTD 5,898,000 16,809,300 0.38CRRC CORPORATION LTD 2,157,000 15,961,800 0.36GF SECURITIES CO LTD 270,400 3,050,112 0.07GUANGDONG INVESTMENT LTD 820,000 12,431,200 0.28GUANGSHEN RAILWAY CO LTD 5,914,000 18,096,840 0.41GUANGZHOU AUTOMOBILE GROUP
CO LTD 1,893,200 17,549,964 0.40HUADIAN FUXIN ENERGY CORP LTD 10,666,000 18,558,840 0.42HUATAI SECURITIES CO LTD 370,800 5,821,560 0.13INDUSTRIAL AND COMMERCIAL BANK
OF CHINA LTD 10,733,000 61,714,750 1.40LONGFOR GROUP HOLDINGS LTD 433,000 11,972,450 0.27NEW CHINA LIFE INSURANCE CO LTD 925,400 37,016,000 0.84PACIFIC TEXTILES HLDGS LTD 2,005,000 14,155,300 0.32PETROCHINA CO LTD 4,018,000 20,451,620 0.46PICC PROPERTY AND CASUALTY CO
LTD 2,520,000 22,478,400 0.51PING AN INSURANCE (GROUP) CO OF
CHINA LTD 1,106,500 97,261,350 2.20
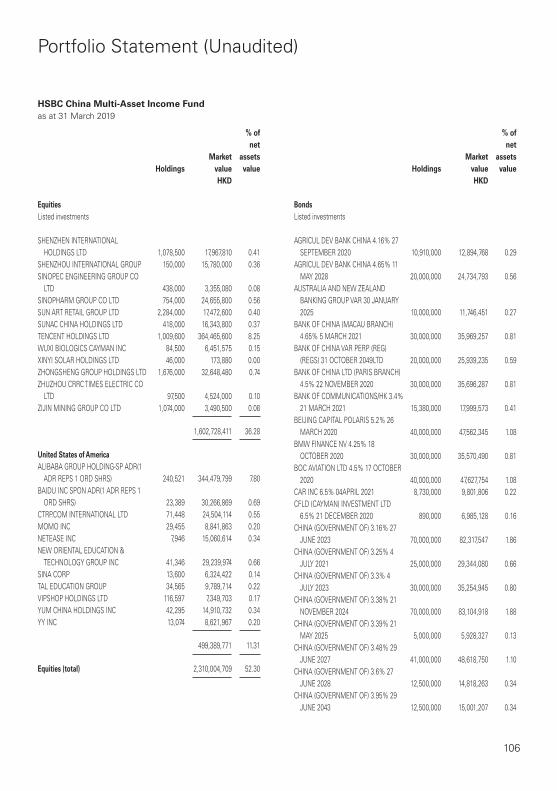
106
Portfolio Statement (Unaudited)
HSBCChinaMulti-AssetIncomeFundas at 31 March 2019
HoldingsMarket
value
%ofnet
assetsvalue
HKD
EquitiesListed investments
SHENZHEN INTERNATIONAL HOLDINGS LTD 1,078,500 17,967,810 0.41
SHENZHOU INTERNATIONAL GROUP 150,000 15,780,000 0.36SINOPEC ENGINEERING GROUP CO
LTD 438,000 3,355,080 0.08SINOPHARM GROUP CO LTD 754,000 24,655,800 0.56SUN ART RETAIL GROUP LTD 2,284,000 17,472,600 0.40SUNAC CHINA HOLDINGS LTD 418,000 16,343,800 0.37TENCENT HOLDINGS LTD 1,009,600 364,465,600 8.25WUXI BIOLOGICS CAYMAN INC 84,500 6,451,575 0.15XINYI SOLAR HOLDINGS LTD 46,000 173,880 0.00ZHONGSHENG GROUP HOLDINGS LTD 1,676,000 32,648,480 0.74ZHUZHOU CRRC TIMES ELECTRIC CO
LTD 97,500 4,524,000 0.10ZIJIN MINING GROUP CO LTD 1,074,000 3,490,500 0.08
1,602,728,411 36.28
UnitedStatesofAmericaALIBABA GROUP HOLDING-SP ADR(1
ADR REPS 1 ORD SHRS) 240,521 344,479,799 7.80BAIDU INC SPON ADR(1 ADR REPS 1
ORD SHRS) 23,389 30,266,869 0.69CTRP.COM INTERNATIONAL LTD 71,448 24,504,114 0.55MOMO INC 29,455 8,841,863 0.20NETEASE INC 7,946 15,060,614 0.34NEW ORIENTAL EDUCATION &
TECHNOLOGY GROUP INC 41,346 29,239,974 0.66SINA CORP 13,600 6,324,422 0.14TAL EDUCATION GROUP 34,565 9,789,714 0.22VIPSHOP HOLDINGS LTD 116,597 7,349,703 0.17YUM CHINA HOLDINGS INC 42,295 14,910,732 0.34YY INC 13,074 8,621,967 0.20
499,389,771 11.31
Equities(total) 2,310,004,709 52.30
HoldingsMarket
value
%ofnet
assetsvalue
HKD
BondsListed investments
AGRICUL DEV BANK CHINA 4.16% 27 SEPTEMBER 2020 10,910,000 12,894,768 0.29
AGRICUL DEV BANK CHINA 4.65% 11 MAY 2028 20,000,000 24,734,793 0.56
AUSTRALIA AND NEW ZEALAND BANKING GROUP VAR 30 JANUARY 2025 10,000,000 11,746,451 0.27
BANK OF CHINA (MACAU BRANCH) 4.65% 5 MARCH 2021 30,000,000 35,969,257 0.81
BANK OF CHINA VAR PERP (REG) (REGS) 31 OCTOBER 2049LTD 20,000,000 25,939,235 0.59
BANK OF CHINA LTD (PARIS BRANCH) 4.5% 22 NOVEMBER 2020 30,000,000 35,696,287 0.81
BANK OF COMMUNICATIONS/HK 3.4% 21 MARCH 2021 15,380,000 17,999,573 0.41
BEIJING CAPITAL POLARIS 5.2% 26 MARCH 2020 40,000,000 47,562,345 1.08
BMW FINANCE NV 4.25% 18 OCTOBER 2020 30,000,000 35,570,490 0.81
BOC AVIATION LTD 4.5% 17 OCTOBER 2020 40,000,000 47,627,754 1.08
CAR INC 6.5% 04APRIL 2021 8,730,000 9,801,806 0.22CFLD (CAYMAN) INVESTMENT LTD
6.5% 21 DECEMBER 2020 890,000 6,985,128 0.16CHINA (GOVERNMENT OF) 3.16% 27
JUNE 2023 70,000,000 82,317,547 1.86CHINA (GOVERNMENT OF) 3.25% 4
JULY 2021 25,000,000 29,344,080 0.66CHINA (GOVERNMENT OF) 3.3% 4
JULY 2023 30,000,000 35,254,945 0.80CHINA (GOVERNMENT OF) 3.38% 21
NOVEMBER 2024 70,000,000 83,104,918 1.88CHINA (GOVERNMENT OF) 3.39% 21
MAY 2025 5,000,000 5,928,327 0.13CHINA (GOVERNMENT OF) 3.48% 29
JUNE 2027 41,000,000 48,618,750 1.10CHINA (GOVERNMENT OF) 3.6% 27
JUNE 2028 12,500,000 14,818,263 0.34CHINA (GOVERNMENT OF) 3.95% 29
JUNE 2043 12,500,000 15,001,207 0.34

107
Portfolio Statement (Unaudited)
HSBCChinaMulti-AssetIncomeFundas at 31 March 2019
HoldingsMarket
value
%ofnet
assetsvalue
HKD
BondsListed investments
CHINA (GOVERNMENT OF) 4% 22 MAY 2024 14,500,000 17,669,335 0.40
CHINA (GOVERNMENT OF) 4% 30 NOVEMBER 2035 20,000,000 24,166,857 0.55
CHINA CONSTRUCTION BANK CORP 4.9% 12 NOVEMBER 2024 30,000,000 35,324,151 0.80
CHINA DEVELOPMENT BANK 3.8% 25 JANUARY 2036 20,000,000 22,329,298 0.50
CHINA DEVELOPMENT BANK 4.3% 2 AUGUST 2032 2,000,000 2,456,235 0.06
CHINA DEVELOPMENT BANK 4.88% 09 FEBRUARY 2028 90,000,000 113,482,762 2.57
CHINA EVERGRANDE GROUP 8.25% 23 MARCH 2022 1,500,000 11,573,809 0.26
CHINA GOVERNMENT BOND 3.25% 22 NOVEMBER 2028 10,000,000 11,860,038 0.27
CHINA GOVERNMENT BOND 3.29% 18 OCTOBER 2023 10,000,000 11,871,275 0.27
CHINA GOVERNMENT BOND 3.3% 12 JULY 2023 10,000,000 11,847,808 0.27
CHINA GOVERNMENT BOND 3.38% 04 JULY 2026 35,000,000 41,382,393 0.94
CHINA GOVERNMENT BOND 3.65% 09 JULY 2020 12,000,000 14,174,303 0.32
CHINA GOVERNMENT BOND 3.8% 09 JULY 2023 12,000,000 14,430,733 0.33
CHINA GOVERNMENT BOND 4.15% 04 DECEMBER 2027 36,000,000 44,244,824 1.00
CHINA GOVERNMENT BOND 4.29% 22 MAY 2029 22,500,000 28,022,917 0.63
CHINA GOVERNMENT BOND 4.5% 22 MAY 2034 10,000,000 12,881,079 0.29
CHINA SCE GROUP HOLDINGS LTD 10% 02 JULY 2020 1,800,000 14,671,368 0.33
CHINA SCE GROUP HOLDINGS LTD 8.75% 15 JANUARY 2021 720,000 5,896,016 0.13
CHINA, PEOPLE’S REPUBLIC OF (GOVERNMENT) 2.48% 1 DECEMBER 2020 5,000,000 5,809,334 0.13
CHINA, PEOPLE’S REPUBLIC OF (GOVERNMENT) 3.1% 29 JUNE 2022 40,000,000 46,871,336 1.06
HoldingsMarket
value
%ofnet
assetsvalue
HKD
CHINA, PEOPLE’S REPUBLIC OF (GOVERNMENT) 3.4% 30 NOVEMBER 2020 10,000,000 11,765,899 0.27
CHINA, PEOPLE’S REPUBLIC OF (GOVERNMENT) 3.8% 22 MAY 2021 15,000,000 17,874,424 0.40
CHINA, PEOPLE’S REPUBLIC OF (GOVERNMENT) 4.4% 12 DECEMBER 2046 8,000,000 10,194,227 0.23
CHN AOYUAN PROPERTY GROUP 7.95% 07 SEPTEMBER 2021 773,000 6,268,923 0.14
CIFI HOLDINGS GROUP 7.75% 20 SEP 2020 10,000,000 12,107,840 0.27
CNI CAPITAL LTD 4.3% 11 NOVEMBER 2019 15,000,000 17,507,808 0.40
COMMONWEALTH BANK AUSTRALIA VAR 11 MARCH 2025 30,000,000 35,384,422 0.80
COMMONWEALTH BANK OF AUSTRALIA 4.2% 26 OCTOBER 2020 10,000,000 11,859,166 0.27
COOPERATIEVE RABOBANK UA 4.3% 8 FEBRUARY 2021 10,000,000 11,908,223 0.27
COUNTRY GARDEN HOLDINGS CO LTD 5.8% 12 MARCH 2021 15,000,000 17,828,871 0.40
COUNTRY GARDEN HOLDINGS 8% 27 JANUARY 2024 2,000,000 16,653,826 0.38
DAIMLER INTL FINANCE BV 4.5% 21 SEPTEMBER 2021 19,000,000 22,791,182 0.52
DAIMLER INTL FINANCE BV 4.8% 09 APRIL 2021 33,000,000 39,612,051 0.90
EXPORT-IMPORT BANK KOREA 4.68% 16 MARCH 2021 25,000,000 29,962,408 0.68
FANTASIA HOLDINGS GROUP 11.875% 11 SEPTEMBER 2020 15,000,000 17,451,830 0.39
FAR EAST HORIZON LTD 4.9% 27 FEBRUARY 2021 44,680,000 52,545,245 1.19
FONTERRA COOPERATIVE GROUP 4% 22 JUNE 2020 17,500,000 20,629,671 0.47
FORTUNE STAR (BVI) LTD 5.25% 23 MARCH 2022 1,500,000 11,467,953 0.26
FRANSHION BRILLIANT LTD 5.2% 8 MARCH 2021 45,000,000 53,637,990 1.21
GOLDEN EAGLE RETAIL GROUP LTD 4.625% 21 MAY 2023 1,000,000 7,295,822 0.16
HITACHI CAPITAL (UK) PLC 4.5% 9 OCTOBER 2020 35,000,000 41,404,265 0.94

108
Portfolio Statement (Unaudited)
HSBCChinaMulti-AssetIncomeFundas at 31 March 2019
HoldingsMarket
value
%ofnet
assetsvalue
HKD
BondsListed investments
HONG KONG MORTGAGE CORP LTD 4.05% 6 NOVEMBER 2020 10,000,000 11,843,514 0.27
INDUSTRIAL AND COMMERCIAL BANK OF CHINA LTD 6% 29 DECEMBER 2049 35,412,500 41,332,547 0.94
KOREA DEVELOPMENT BANK 4.585% 13 FEBRUARY 2021 20,000,000 23,911,525 0.54
KOREA DEVELOPMENT BANK 4.6% 03 JULY 2021 36,000,000 43,202,214 0.98
MALAYAN BANKING BHD 4.5% 2 NOVEMBER 2020 35,000,000 41,409,784 0.94
NATIONAL BANK OF CANADA 4.3% 11 OCTOBER 2020 20,000,000 23,761,199 0.54
ROYAL BANK OF CANADA 4.25% 29 SEPTEMBER 2020 20,000,000 23,727,910 0.54
SHIMAO PROPERTY HOLDINGS 5.75% 15 MARCH 2021 30,000,000 35,901,627 0.81
SHUI ON DEVELOPMENT (HOLDING) LTD 6.875% 2 MARCH 2021 30,000,000 36,194,921 0.82
SINOCHEM OFFSHORE CAPITAL CO LTD 4.4% 14 FEBRUARY 2021 40,000,000 47,434,795 1.07
SINOPEC CENTURY BRIGHT 4.5% 31 OCTOBER 2021 16,900,000 20,089,267 0.46
SUNAC CHINA HOLDINGS LTD 7.875% 15 FEBRUARY 2022 3,221,000 25,702,139 0.58
TIMES CHINA HOLDINGS LTD 10.95% 27 NOVEMBER 2020 787,000 6,642,119 0.15
TIMES CHINA HOLDINGS LTD 7.85% 04 JUNE 2021 1,500,000 12,116,633 0.27
VERTEX CAPITAL INVESTMENT LTD 4.75% 03 APRIL 2024 200,000 1,569,990 0.04
WESTPAC BANKING CORP 4.35% 19 JANUARY 2021 20,000,000 23,825,324 0.54
ZHENRO PROPERTIES GROUP 8.65% 21 JANUARY 2023 679,000 5,303,572 0.12
2,008,002,921 45.47
HoldingsMarket
value
%ofnet
assetsvalue
HKD
Unlisted but quoted investments
HKCG FINANCE LTD 4.45% 26 NOVEMBER 2021 25,000,000 29,835,531 0.68
KEB HANA BANK 4.5% 30 JULY 2021 8,000,000 9,503,171 0.21
39,338,702 0.89
Bonds(total) 2,047,341,623 46.36
Equity-linkedinstrumentsUnlisted but quoted investments
CICC FINANCIAL TRADING (KWEICHOW MOUTAI CO LTD) 04 JANUARY 2021 39,888 39,787,867 0.90
Equity-linkedinstruments(total) 39,787,867 0.90
Foreigncurrencyforwardcontracts (14,033,682) (0.32)
Totalinvestments(Totalcostofinvestments$4,134,274,720) 4,383,100,517 99.24
Othernetassets 33,724,457 0.76
Totalnetassetsasat31March2019 4,416,824,974 100.00

109
Portfolio Statement (Unaudited)
HSBCAllChinaBondFund(1)
as at 31 March 2019
HoldingsMarket
value
%ofnet
assetsvalue
RMB
BondsListed investments
AGILE GROUP HOLDINGS LTD 8.5% 18 JULY 2021 200,000 1,427,157 1.14
AGRICUL DEVELOPMENT BANK CHINA 3.37% 26 FEBRUARY 2026 (INTERBANK) 10,000,000 9,711,780 7.76
BANK OF CHINA/MACAU 4.65% 05 MARCH 2021 2,000,000 2,052,980 1.64
BAOXIN AUTO FINANCE I LTD 7.9% 09 FEBRUARY 2020 200,000 1,354,009 1.08
BMW FINANCE NV 4.25% 18 OCTOBER 2020 2,000,000 2,030,220 1.62
CHAMPION SINCERITY HL VAR PERPETUAL 29 DECEMBER 2049 200,000 1,398,285 1.12
CHENGDU METRO CORPORATION 5.18% 23 JUNE 2020 (INTERBANK) 10,000,000 10,213,320 8.16
CHINA (GOVERNMENT OF) 3.38% 21 NOVEMBER 2024 3,000,000 3,049,260 2.44
CHINA (GOVERNMENT OF) 3.6% 21 MAY 2030 2,000,000 2,007,590 1.60
CHINA DEVELOPMENT BANK 4.2% 19 JANUARY 2027 4,000,000 4,151,920 3.32
CHINA EVERGRANDE GROUP 8.25% 23 MARCH 2022 200,000 1,321,172 1.05
CHINA MATERIALS GROUP 5.35% 19 NOVEMBER 2021 (INTERBANK) 10,000,000 10,362,650 8.28
CHINA RAILWAY CORP 4.28% 18 MAY 2025 (INTERBANK) 10,000,000 10,230,270 8.17
CHINA SCE GRP HOLDINGS LTD 8.75% 15 JANUARY 2021 200,000 1,402,170 1.12
CHN AOYUAN PROPERTY GROUP 7.5% 10 MAY 2021 300,000 2,067,245 1.65
CIFI HOLDINGS GROUP 7.625% 02 MARCH 2021 200,000 1,390,624 1.11
CIFI HOLDINGS GROUP 7.75% 20 SEPTEMBER 2020 1,000,000 1,036,600 0.83
DAIMLER INTL FINANCE BV 4.5% 21 SEPTEMBER 2021 2,000,000 2,053,940 1.64
EXPORT-IMPORT BANK CHINA 4.4% 14 MAY 2024 4,000,000 4,093,360 3.27
FAR EAST HORIZON LTD 4.9% 27 FEBRUARY 2021 3,000,000 3,020,550 2.41
HoldingsMarket
value
%ofnet
assetsvalue
RMB
FRANSHION BRILLIANT LTD 5.2% 08 MARCH 2021 3,000,000 3,061,440 2.44
HUARONG FINANCE II 5% 19 NOVEMBER 2025 200,000 1,405,664 1.12
JIANGXI PROVINCIAL EXPRESSWAY INVESTMENT GROUP CO LTD 3.9% 15 JUNE 2023 (INTERBANK) 10,000,000 9,869,680 7.88
NANJING STATE OWNED ASSET 5.4% 6 MARCH 2020 (INTERBANK) 10,000,000 2,038,900 1.63
ROYAL BANK OF CANADA 4.25% 29 SEPTEMBER 2020 2,000,000 2,031,440 1.62
SHIMAO PROPERTY HOLDINGS 5.75% 15 MARCH 2021 3,000,000 3,073,680 2.45
SINO OCEAN LAND IV 5.25% 30 APRIL 2022 200,000 1,379,266 1.10
SINOCHEM OFFSHORE CAPITAL 4.4% 14 FEBRUARY 2021 3,000,000 3,045,810 2.43
SINOPEC CENTURY BRIGHT 4.5% 31 OCTOBER 2021 2,200,000 2,238,951 1.79
SUNAC CHINA HOLDINGS LTD 7.875% 15 FEBRUARY 2022 300,000 2,049,482 1.64
TIANJIN PORT GROUP CO 4.94% 7 NOVEMBER 2021 (INTERBANK) 10,000,000 10,281,280 8.21
WEICHAI HOLDINGS GROUP 3.78% 14 MARCH 2021 (INTERBANK) 10,000,000 10,028,290 8.01
WEST CHINA CEMENT LTD 6.5% 11 SEPTEMBER 2019 300,000 1,620,956 1.29
YUZHOU PROPERTIES CO LTD 8.5% 04 FEBRUARY 2023 200,000 1,396,403 1.12
Bonds(total) 127,896,344 102.14
Totalinvestments(Totalcostofinvestments¥127,061,573) 127,896,344 102.14
Othernetliabilities (2,681,801) (2.14)
Totalnetassetsasat31March2019 125,214,543 100.00
(1) The HSBC All China Bond Fund is formerly known as “HSBC RQFII Chinese Fixed Income Fund”.
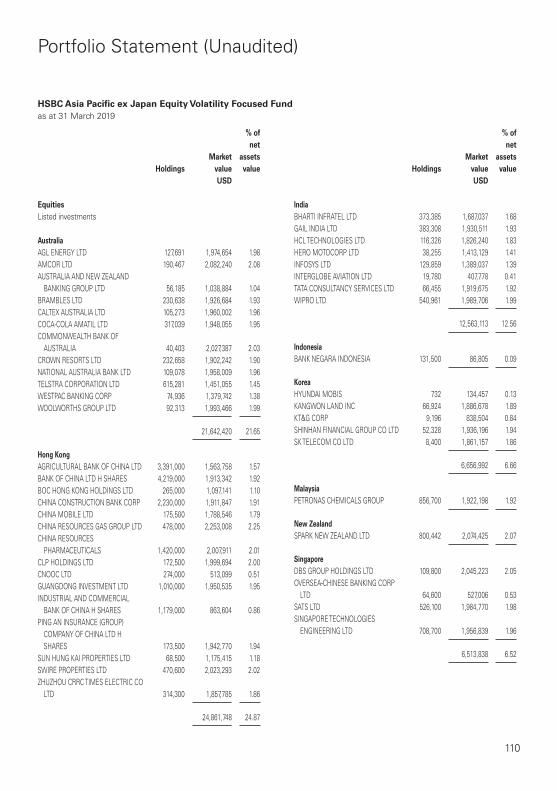
110
Portfolio Statement (Unaudited)
HSBCAsiaPacificexJapanEquityVolatilityFocusedFundas at 31 March 2019
HoldingsMarket
value
%ofnet
assetsvalue
USD
EquitiesListed investments
AustraliaAGL ENERGY LTD 127,691 1,974,654 1.98AMCOR LTD 190,467 2,082,240 2.08AUSTRALIA AND NEW ZEALAND
BANKING GROUP LTD 56,185 1,038,884 1.04BRAMBLES LTD 230,638 1,926,684 1.93CALTEX AUSTRALIA LTD 105,273 1,960,002 1.96COCA-COLA AMATIL LTD 317,039 1,948,055 1.95COMMONWEALTH BANK OF
AUSTRALIA 40,403 2,027,387 2.03CROWN RESORTS LTD 232,658 1,902,242 1.90NATIONAL AUSTRALIA BANK LTD 109,078 1,958,009 1.96TELSTRA CORPORATION LTD 615,281 1,451,055 1.45WESTPAC BANKING CORP 74,936 1,379,742 1.38WOOLWORTHS GROUP LTD 92,313 1,993,466 1.99
21,642,420 21.65
HongKongAGRICULTURAL BANK OF CHINA LTD 3,391,000 1,563,758 1.57BANK OF CHINA LTD H SHARES 4,219,000 1,913,342 1.92BOC HONG KONG HOLDINGS LTD 265,000 1,097,141 1.10CHINA CONSTRUCTION BANK CORP 2,230,000 1,911,847 1.91CHINA MOBILE LTD 175,500 1,788,546 1.79CHINA RESOURCES GAS GROUP LTD 478,000 2,253,008 2.25CHINA RESOURCES
PHARMACEUTICALS 1,420,000 2,007,911 2.01CLP HOLDINGS LTD 172,500 1,999,694 2.00CNOOC LTD 274,000 513,099 0.51GUANGDONG INVESTMENT LTD 1,010,000 1,950,535 1.95INDUSTRIAL AND COMMERCIAL
BANK OF CHINA H SHARES 1,179,000 863,604 0.86PING AN INSURANCE (GROUP)
COMPANY OF CHINA LTD H SHARES 173,500 1,942,770 1.94
SUN HUNG KAI PROPERTIES LTD 68,500 1,175,415 1.18SWIRE PROPERTIES LTD 470,600 2,023,293 2.02ZHUZHOU CRRC TIMES ELECTRIC CO
LTD 314,300 1,857,785 1.86
24,861,748 24.87
HoldingsMarket
value
%ofnet
assetsvalue
USD
IndiaBHARTI INFRATEL LTD 373,385 1,687,037 1.68GAIL INDIA LTD 383,308 1,930,511 1.93HCL TECHNOLOGIES LTD 116,326 1,826,240 1.83HERO MOTOCORP LTD 38,255 1,413,129 1.41INFOSYS LTD 129,859 1,389,037 1.39INTERGLOBE AVIATION LTD 19,780 407,778 0.41TATA CONSULTANCY SERVICES LTD 66,455 1,919,675 1.92WIPRO LTD 540,961 1,989,706 1.99
12,563,113 12.56
IndonesiaBANK NEGARA INDONESIA 131,500 86,805 0.09
KoreaHYUNDAI MOBIS 732 134,457 0.13KANGWON LAND INC 66,924 1,886,678 1.89KT&G CORP 9,196 838,504 0.84SHINHAN FINANCIAL GROUP CO LTD 52,328 1,936,196 1.94SK TELECOM CO LTD 8,400 1,861,157 1.86
6,656,992 6.66
MalaysiaPETRONAS CHEMICALS GROUP 856,700 1,922,198 1.92
NewZealandSPARK NEW ZEALAND LTD 800,442 2,074,425 2.07
SingaporeDBS GROUP HOLDINGS LTD 109,800 2,045,223 2.05OVERSEA-CHINESE BANKING CORP
LTD 64,600 527,006 0.53SATS LTD 526,100 1,984,770 1.98SINGAPORE TECHNOLOGIES
ENGINEERING LTD 708,700 1,956,839 1.96
6,513,838 6.52

111
Portfolio Statement (Unaudited)
HSBCAsiaPacificexJapanEquityVolatilityFocusedFundas at 31 March 2019
HoldingsMarket
value
%ofnet
assetsvalue
USD
EquitiesListed investments
TaiwanASUSTEK COMPUTER INC 276,000 1,996,982 2.00FORMOSA PLASTICS CORP 567,000 2,014,455 2.01INDUSTRIAL BANK OF KOREA 123,251 1,525,572 1.53TAIWAN SEMICONDUCTOR
MANUFACTURING CO LTD 168,000 1,338,200 1.34
6,875,209 6.88
ThailandADVANCED INFORMATION SERVICE
PCL 296,700 1,701,573 1.70BANGKOK BANK PCL 289,200 1,968,401 1.97SIAM CEMENT PCL 130,400 1,964,115 1.97SIAM COMMERCIAL BANK PCL 364,000 1,514,038 1.51
7,148,127 7.15
UnitedStatesofAmericaALIBABA GROUP HOLDING-SP ADR 11,166 2,037,237 2.04BAIDU INC SPON ADR 11,200 1,846,320 1.85INFOSYS LTD ADR 59,573 651,133 0.65NETEASE INC 4,331 1,045,720 1.04YUM CHINA HOLDINGS INC 47,234 2,121,279 2.12
7,701,689 7.70
Equities(total) 98,046,564 98.07
UnittrustsListed investments
LINK REIT 65,500 765,979 0.76
Unittrusts(total) 765,979 0.76
Totalinvestments(Totalcostofinvestments$97,096,023) 98,812,543 98.83
Othernetassets 1,165,188 1.17
Totalnetassetsasat31March2019 99,977,731 100.00
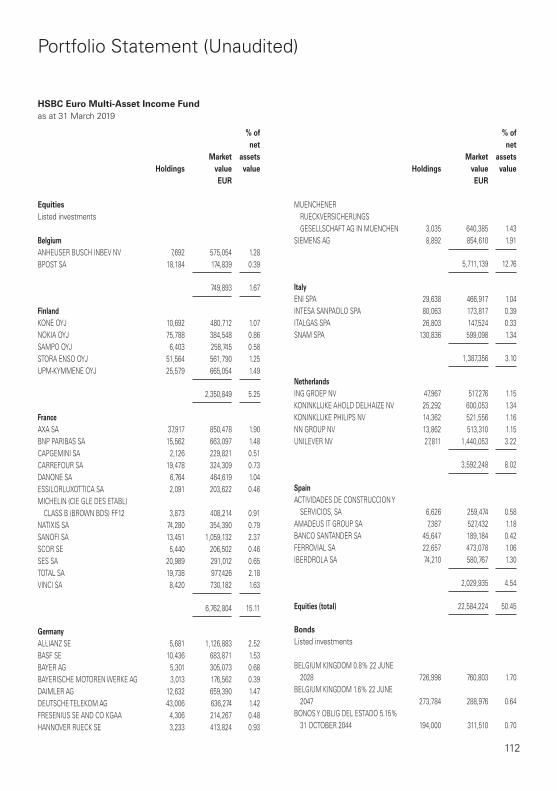
112
Portfolio Statement (Unaudited)
HSBCEuroMulti-AssetIncomeFundas at 31 March 2019
HoldingsMarket
value
%ofnet
assetsvalue
EUR
EquitiesListed investments
BelgiumANHEUSER BUSCH INBEV NV 7,692 575,054 1.28BPOST SA 18,184 174,839 0.39
749,893 1.67
FinlandKONE OYJ 10,692 480,712 1.07NOKIA OYJ 75,788 384,548 0.86SAMPO OYJ 6,403 258,745 0.58STORA ENSO OYJ 51,564 561,790 1.25UPM-KYMMENE OYJ 25,579 665,054 1.49
2,350,849 5.25
FranceAXA SA 37,917 850,478 1.90BNP PARIBAS SA 15,562 663,097 1.48CAPGEMINI SA 2,126 229,821 0.51CARREFOUR SA 19,478 324,309 0.73DANONE SA 6,764 464,619 1.04ESSILORLUXOTTICA SA 2,091 203,622 0.46MICHELIN (CIE GLE DES ETABL)
CLASS B (BROWN BDS) FF12 3,873 408,214 0.91NATIXIS SA 74,280 354,390 0.79SANOFI SA 13,451 1,059,132 2.37SCOR SE 5,440 206,502 0.46SES SA 20,989 291,012 0.65TOTAL SA 19,738 977,426 2.18VINCI SA 8,420 730,182 1.63
6,762,804 15.11
GermanyALLIANZ SE 5,681 1,126,883 2.52BASF SE 10,436 683,871 1.53BAYER AG 5,301 305,073 0.68BAYERISCHE MOTOREN WERKE AG 3,013 176,562 0.39DAIMLER AG 12,632 659,390 1.47DEUTSCHE TELEKOM AG 43,006 636,274 1.42FRESENIUS SE AND CO KGAA 4,306 214,267 0.48HANNOVER RUECK SE 3,233 413,824 0.93
HoldingsMarket
value
%ofnet
assetsvalue
EUR
MUENCHENER RUECKVERSICHERUNGS GESELLSCHAFT AG IN MUENCHEN 3,035 640,385 1.43
SIEMENS AG 8,892 854,610 1.91
5,711,139 12.76
ItalyENI SPA 29,638 466,917 1.04INTESA SANPAOLO SPA 80,063 173,817 0.39ITALGAS SPA 26,803 147,524 0.33SNAM SPA 130,836 599,098 1.34
1,387,356 3.10
NetherlandsING GROEP NV 47,967 517,276 1.15KONINKLIJKE AHOLD DELHAIZE NV 25,292 600,053 1.34KONINKLIJKE PHILIPS NV 14,362 521,556 1.16NN GROUP NV 13,862 513,310 1.15UNILEVER NV 27,811 1,440,053 3.22
3,592,248 8.02
SpainACTIVIDADES DE CONSTRUCCION Y
SERVICIOS, SA 6,626 259,474 0.58AMADEUS IT GROUP SA 7,387 527,432 1.18BANCO SANTANDER SA 45,647 189,184 0.42FERROVIAL SA 22,657 473,078 1.06IBERDROLA SA 74,210 580,767 1.30
2,029,935 4.54
Equities(total) 22,584,224 50.45
BondsListed investments
BELGIUM KINGDOM 0.8% 22 JUNE 2028 726,998 760,803 1.70
BELGIUM KINGDOM 1.6% 22 JUNE 2047 273,784 288,976 0.64
BONOS Y OBLIG DEL ESTADO 5.15% 31 OCTOBER 2044 194,000 311,510 0.70
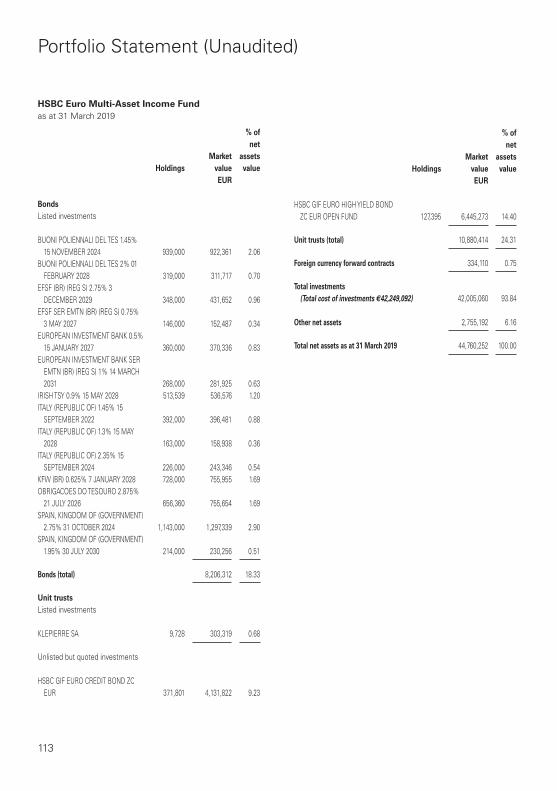
113
Portfolio Statement (Unaudited)
HSBCEuroMulti-AssetIncomeFundas at 31 March 2019
HoldingsMarket
value
%ofnet
assetsvalue
EUR
BondsListed investments
BUONI POLIENNALI DEL TES 1.45% 15 NOVEMBER 2024 939,000 922,361 2.06
BUONI POLIENNALI DEL TES 2% 01 FEBRUARY 2028 319,000 311,717 0.70
EFSF (BR) (REG S) 2.75% 3 DECEMBER 2029 348,000 431,652 0.96
EFSF SER EMTN (BR) (REG S) 0.75% 3 MAY 2027 146,000 152,487 0.34
EUROPEAN INVESTMENT BANK 0.5% 15 JANUARY 2027 360,000 370,336 0.83
EUROPEAN INVESTMENT BANK SER EMTN (BR) (REG S) 1% 14 MARCH 2031 268,000 281,925 0.63
IRISH TSY 0.9% 15 MAY 2028 513,539 536,576 1.20ITALY (REPUBLIC OF) 1.45% 15
SEPTEMBER 2022 392,000 396,481 0.88ITALY (REPUBLIC OF) 1.3% 15 MAY
2028 163,000 158,938 0.36ITALY (REPUBLIC OF) 2.35% 15
SEPTEMBER 2024 226,000 243,346 0.54KFW (BR) 0.625% 7 JANUARY 2028 728,000 755,955 1.69OBRIGACOES DO TESOURO 2.875%
21 JULY 2026 656,360 755,654 1.69SPAIN, KINGDOM OF (GOVERNMENT)
2.75% 31 OCTOBER 2024 1,143,000 1,297,339 2.90SPAIN, KINGDOM OF (GOVERNMENT)
1.95% 30 JULY 2030 214,000 230,256 0.51
Bonds(total) 8,206,312 18.33
UnittrustsListed investments
KLEPIERRE SA 9,728 303,319 0.68
Unlisted but quoted investments
HSBC GIF EURO CREDIT BOND ZC EUR 371,801 4,131,822 9.23
HoldingsMarket
value
%ofnet
assetsvalue
EUR
HSBC GIF EURO HIGH YIELD BOND ZC EUR OPEN FUND 127,395 6,445,273 14.40
Unittrusts(total) 10,880,414 24.31
Foreigncurrencyforwardcontracts 334,110 0.75
Totalinvestments(Totalcostofinvestments`42,249,092) 42,005,060 93.84
Othernetassets 2,755,192 6.16
Totalnetassetsasat31March2019 44,760,252 100.00

114
Portfolio Statement (Unaudited)
HSBCAsiaHighIncomeBondFundas at 31 March 2019
HoldingsMarket
value
%ofnet
assetsvalue
USD
BondsListed investments
ABJA INVESTMENT CO 4.45% 24 JULY 2023 1,123,000 1,100,899 0.13
ABJA INVESTMENT CO 5.45% 24 JANUARY 2028 4,102,000 3,877,539 0.47
ABJA INVESTMENT CO 5.95% 31 JULY 2024 6,000,000 6,149,100 0.74
ADANI PORTS AND SPECIAL 3.95% 19 JANUARY 2022 7,095,000 7,110,325 0.86
AGILE GROUP HOLDINGS LTD 9.5% 23 NOVEMBER 2020 4,434,000 4,702,168 0.57
AGILE GROUP HOLDINGS LTD VAR 29 DECEMBER 2049 1,543,000 1,583,905 0.19
AGILE GROUP HOLDINGS LTD VAR PERPETUAL 18 JANUARY 2049 4,000,000 4,073,560 0.49
ALAM SYNERGY PTE LTD (REG S) 11.5% 22 APRIL 2021 1,905,000 2,034,311 0.24
ALIBABA GROUP HOLDING 4.2% 6 DECEMBER 2047 5,000,000 4,925,000 0.59
ANTON OILFIELD SERVICES GROUP 9.75% 5 DECEMBER 2020 1,352,000 1,388,382 0.17
AZURE NOVA INTERNATIONAL 2.625% 1 NOVEMBER 2021 5,000,000 4,889,900 0.59
AZURE POWER ENERGY LTD 5.5% 3 NOVEMBER 2022 6,000,000 5,913,660 0.71
BANGKOK BANK PCL 4.45%19 SEPTEMBER 2028 1,571,000 1,646,235 0.20
BANGKOK BANK PLC 9.025% 15 MARCH 2029 4,718,000 6,436,720 0.78
BANGKOK BANK PUBLIC CO LTD 5% 3 OCTOBER 2023 5,000,000 5,348,150 0.64
BANK OF COMMUNICATIONS 3.4% 21 MARCH 2021 12,310,000 1,835,258 0.22
BANK OF EAST ASIA LTD VAR 20 NOVEMBER 2024 3,000,000 3,007,740 0.36
BANK OF EAST VAR PERPETUAL 29 DECEMBER 2049 8,000,000 8,024,800 0.97
BANK OF PHILIPPINE ISLAN 4.25% 04 SEPTEMBER 2023 4,027,000 4,156,307 0.50
BANK RAKYAT INDONESIA 3.95% 28 MARCH 2024 445,000 447,612 0.05
HoldingsMarket
value
%ofnet
assetsvalue
USD
BAOXIN AUTO FINANCE I LTD 7.9% 09 FEBRUARY 2020 1,419,000 1,429,430 0.17
BAOXIN AUTO FINANCE I LTD VAR PERPETUAL 29 DECEMBER 2049 2,587,000 2,608,058 0.31
BHARTI AIRTEL INTERNATIONAL 5.35% 20 MAY 2024 2,000,000 2,070,800 0.25
BUKIT MAKMUR MANDIRI UTA 7.75% 13 FEBRUARY 2022 6,000,000 6,277,800 0.76
CCB LIFE INSURANCE FRN 21 APRIL 2077 3,097,000 2,912,078 0.35
CDBL FUNDING 1 3.5% 24 OCTOBER 2027 5,000,000 4,783,900 0.58
CELESTIAL MILES VAR PERPETUAL 29 DECEMBER 2049 5,110,000 5,283,740 0.64
CFLD CAYMAN INVESTMENT 6.5% 21 DECEMBER 2020 1,100,000 1,099,791 0.13
CFLD CAYMAN INVESTMENT 8.625% 28 FEBRUARY 2021 1,933,000 1,992,923 0.24
CHAMPION SINCERITY HL VAR PERPETUAL 29 DECEMBER 2049 1,791,000 1,863,159 0.22
CHANDRA ASRI PETROCHEMICAL 4.95% 8 NOVEMBER 2024 3,000,000 2,855,070 0.34
CHINA (GOVERNMENT OF) 3.99% 26 JUNE 2020 40,000,000 6,034,000 0.73
CHINA (GOVERNMENT OF) 4.1% 26 JUNE 2022 18,000,000 2,767,795 0.33
CHINA CINDA FINANCE 2017 4.75% 21 FEBRUARY 2029 1,125,000 1,172,284 0.14
CHINA CINDA FINANCE 2017 4.75% 8 FEBRUARY 2028 3,000,000 3,120,840 0.38
CHINA CITIC BANK INTERNATIONAL VAR PERPETUAL 29 DECEMBER 2049 2,000,000 2,086,380 0.25
CHINA CONSTRUCTION BANK ASIA VAR 20 AUGUST 2024 2,000,000 2,004,540 0.24
CHINA CONSTRUCTION BANK VAR 27 FEBRUARY 2029 6,063,000 6,133,513 0.74
CHINA DEV BNK 4.88% 09 FEBRUARY 2028 20,000,000 3,212,553 0.39
CHINA DEVELOPMENT BANK 4.14% 11 SEPTEMBER 2020(INTERBANK) 20,000,000 3,030,267 0.36
CHINA EVERGRANDE GROUP 7.5% 28 JUNE 2023 2,000,000 1,889,820 0.23

115
Portfolio Statement (Unaudited)
HSBCAsiaHighIncomeBondFundas at 31 March 2019
HoldingsMarket
value
%ofnet
assetsvalue
USD
BondsListed investments
CHINA EVERGRANDE GROUP 8.25% 23 MARCH 2022 2,000,000 1,965,840 0.24
CHINA HONGQIAO GROUP LTD 6.85% 22 APRIL 2019 3,686,000 3,683,825 0.44
CHINA LIFE INSURANCE CO LTD VAR 3 JULY 2075 3,000,000 2,967,210 0.36
CHINA OIL AND GAS GROUP 5% 07 MAY 2020 200,000 200,340 0.02
CHINA SCE GRP HOLDINGS LTD 10% 02 JULY 2020 3,000,000 3,114,960 0.38
CIFI HOLDINGS GROUP 5.5% 23 JANUARY 2023 2,500,000 2,436,275 0.29
CIFI HOLDINGS GROUP 7.625% 02 MARCH 2021 2,000,000 2,069,180 0.25
CNAC HK FINBRIDGE CO LTD 4.125% 14 MARCH 2021 5,176,000 5,243,495 0.63
CNAC HK FINBRIDGE CO LTD 4.125% 19 JULY 2027 3,000,000 3,026,940 0.36
CNAC HK FINBRIDGE CO LTD 4.625% 14 MARCH 2023 2,000,000 2,072,320 0.25
CNAC HK FINBRIDGE CO LTD 5.125% 14 MARCH 2028 3,000,000 3,234,540 0.39
COSL SINGAPORE CAPITAL 4.5% 30 JULY 2025 11,200,000 11,533,760 1.39
COUNTRY GARDEN HOLDINGS 7.25% 08 APRIL 2026 4,000,000 4,000,000 0.48
COUNTRY GARDEN HOLDINGS 8% 27 JANUARY 2024 3,000,000 3,182,280 0.38
DAH SING BANK LTD VAR 15 JANUARY 2029 1,688,000 1,745,460 0.21
DBS GROUP HOLDINGS LTD VAR 11 DECEMBER 2028 2,874,000 2,979,505 0.36
DELTA MERLIN DUNIA TEXTILE 8.625% 12 MARCH 2024 1,942,000 2,003,231 0.24
DEVELOPMENT BANK OF MONGOLIA 7.25% 23 OCTOBER 2023 1,723,000 1,793,178 0.22
EASY TACTIC LTD 7% 25 APRIL 2021 2,000,000 2,022,460 0.24EASY TACTIC LTD 8.625% 27
FEBRUARY 2024 1,467,000 1,501,005 0.18
HoldingsMarket
value
%ofnet
assetsvalue
USD
FAR EAST HORIZON LTD 4.9% 27 FEBRUARY 2021 11,710,000 1,754,326 0.21
FORTUNE STAR BVI LTD 5.25% 23 MARCH 2022 4,278,000 4,166,473 0.50
FORTUNE STAR BVI LTD 5.95% 29 JANUARY 2023 400,000 392,300 0.05
FORTUNE STAR BVI LTD 6.875% 31 JANUARY 2021 1,400,000 1,426,740 0.17
FRANSHION BRILLIANT LTD 5.2% 8 MARCH 2021 10,000,000 1,518,425 0.18
GEMDALE EVER PROSPERITY 6% 06 SEPTEMBER 2021 1,647,000 1,672,413 0.20
GOHL CAPITAL LTD 4.25% 24 JANUARY 2027 4,000,000 3,990,280 0.48
GOLDEN EAGLE RETAIL GROUP 4.625% 21 MAY 2023 5,058,000 4,700,956 0.57
GOLDEN WHEEL TIANDI 7% 18 JANUARY 2021 2,650,000 2,503,561 0.30
GREENKO DUTCH BV 4.875% 24 JULY 2022 6,500,000 6,417,645 0.77
GREENKO DUTCH BV 5.25% 24 JULY 2024 3,000,000 2,896,980 0.35
GREENKO INVESTMENT CO 4.875% 16 AUGUST 2023 4,000,000 3,822,240 0.46
HILONG HOLDING LTD 7.25% 22 JUNE 2020 1,600,000 1,595,264 0.19
HKT CAPITAL NO 4 LTD 3% 14 JULY 2026 10,000,000 9,529,300 1.15
HONG KONG AIRPORT AUTHORITY 3.45% 21 FEBRUARY 2029 3,288,000 3,392,098 0.41
HPHT FINANCE 17 LTD 2.75% 11 SEPTEMBER 2022 7,000,000 6,867,210 0.83
HT GLOBAL IT SOLUTIONS HOLDINGS LTD 7% 14 JULY 2021 8,000,000 8,245,680 0.99
HUARONG FINANCE II 5.5% 16 JANUARY 2025 3,000,000 3,200,190 0.39
HUARONG FINANCE II VAR PERPETUAL 29 DECEMBER 2049 4,000,000 3,834,640 0.46
ICBCIL FINANCE CO LTD 2.5% 29 SEPTEMBER 2021 3,500,000 3,422,055 0.41
ICICI BANK LTD/DUBAI 4% 18 MARCH 2026 4,000,000 3,989,560 0.48
INDIKA ENERGY III PTE LTD 5.875% 9 NOVEMBER 2024 2,000,000 1,909,680 0.23

116
Portfolio Statement (Unaudited)
HSBCAsiaHighIncomeBondFundas at 31 March 2019
HoldingsMarket
value
%ofnet
assetsvalue
USD
BondsListed investments
INDO ENERGY FINANCE II 6.375% 24 JANUARY 2023 3,000,000 3,002,340 0.36
INDONESIA (REPUBLIC OF) 4.35% 11 JANUARY 2048 4,000,000 3,945,320 0.47
INDONESIA (REPUBLIC OF) 4.75% 18 JULY 2047 2,000,000 2,045,220 0.25
INDONESIA (REPUBLIC OF) 5.25% 17 JANUARY 2042 1,250,000 1,345,225 0.16
INDONESIA (REPUBLIC OF) 5.25% 8 JANUARY 2047 4,000,000 4,335,160 0.52
INDONESIA (REPUBLIC OF) 6.75% 15 JANUARY 2044 3,000,000 3,850,860 0.46
INDONESIA (REPUBLIC OF) 7% 15 MAY 2022 33,000,000,000 2,318,111 0.28
INDONESIA (REPUBLIC OF) 7.75% 17 JANUARY 2038 1,500,000 2,044,275 0.25
INDONESIA (REPUBLIC OF) 8.375% 15 SEPTEMBER 2026 33,000,000,000 2,427,354 0.29
INDONESIA (REPUBLIC OF) 8.5% 12 OCTOBER 2035 1,500,000 2,139,705 0.26
INDONESIA (REPUBLIC OF) 11% 15 NOVEMBER 2020 33,000,000,000 2,469,994 0.30
INDONESIA ASAHAN ALUMINI 6.53% 15 NOVEMBER 2028 6,000,000 6,859,800 0.83
INDONESIA ASAHANALUMINI 6.757% 15 NOVEMBER 2048 3,000,000 3,463,920 0.42
INDUSTRIAL AND COMMERCIAL BANK OF CHINA VAR PERPETUAL 29 DECEMBER 2049 11,670,000 1,762,156 0.21
ISLAMIC REP OF PAKISTAN 6.875% 05 DECEMBER 2027 3,000,000 2,964,960 0.36
JABABEKA INTERNATIONAL 6.5% 5 OCTOBER 2023 6,979,000 6,652,383 0.80
JASA MARGA (PERSERO) 7.5% 11 DECEMBER 2020 40,380,000,000 2,727,833 0.33
JGC VENTURES PTE LTD 10.75% 30 AUGUST 2021 3,918,000 4,226,856 0.51
JIANGXI RAILWAY INVESTMENT 4.85% 21 FEBRUARY 2022 1,569,000 1,599,078 0.19
JOY TRSR ASSETS HOLDINGS 4.5% 20 MARCH 2029 462,000 469,475 0.06
HoldingsMarket
value
%ofnet
assetsvalue
USD
JSW STEEL LTD 4.75% 12 NOVEMBER 2019 8,000,000 8,014,160 0.96
JSW STEEL LTD 5.25% 13 APRIL 2022 6,929,000 6,966,971 0.84JUBILANT PHARMA LTD 4.875% 6
OCTOBER 2021 5,000,000 4,996,550 0.60JUBILANT PHARMA LTD 6% 05
MARCH 2024 3,000,000 3,019,050 0.36KAISA GROUP HOLDINGS LTD 11.75%
26 FEBRUARY 2021 1,532,000 1,561,108 0.19KAISA GROUP HOLDINGS LTD 7.25%
30 JUNE 2020 2,000,000 1,967,540 0.24KAISA GROUP HOLDINGS LTD 8.5%
30 JUNE 2022 2,277,000 2,112,259 0.25KAISA GROUP HOLDINGS LTD
9.375% 30 JUNE 2024 2,000,000 1,797,100 0.22KOOKMIN BANK 2.875% 25 MARCH
2023 5,000,000 4,961,900 0.60KOREA EAST-WEST POWER CO LTD
2.625% 19 JUNE 2022 5,000,000 4,948,700 0.60KOREA HOUSING FINANCE CO LTD
3% 31 OCTOBER 2022 7,895,000 7,885,052 0.95KOREA WATER RESOURCES 2.75%
23 MAY 2022 4,250,000 4,225,945 0.51KOREA WESTERN POWER CO 3.75%
07 JUNE 2023 1,782,000 1,829,882 0.22KWG GROUP HOLDINGS 7.875% 01
SEPTEMBER 2023 4,500,000 4,590,810 0.55LG DISPLAY CO LTD 3.875% 15
NOVEMBER 2021 2,609,000 2,669,764 0.32LISTRINDO CAPITAL BV 4.95% 14
SEPTEMBER 2026 3,000,000 2,904,990 0.35LLPL CAPITAL PTE LTD 6.875% 04
FEBRUARY 2039 6,000,000 6,499,260 0.78LOGAN PROPERTY HOLDINGS 7.5%
25 AUGUST 2022 2,387,000 2,465,365 0.30LOGAN PROPERTY HOLDINGS 8.75%
12 DECEMBER 2020 1,262,000 1,319,169 0.16MALAYSIAN GOVERNMENT 3.733%
15 JUNE 2028 25,000,000 6,092,590 0.73MARBLE II PTE LTD 5.3% 20 JUNE
2022 5,000,000 4,968,300 0.60MEDCO PLATINUM ROAD PTE LTD
6.75% 30 JANUARY 2025 2,500,000 2,433,475 0.29

117
Portfolio Statement (Unaudited)
HSBCAsiaHighIncomeBondFundas at 31 March 2019
HoldingsMarket
value
%ofnet
assetsvalue
USD
BondsListed investments
MEDCO STRAITS SERVICES PTE LTD 8.5% 17 AUGUST 2022 542,000 576,563 0.07
MINEJESA CAPITAL BV 4.625% 10 AUGUST 2030 4,500,000 4,374,360 0.53
MINEJESA CAPITAL BV 5.625% 10 AUGUST 2037 2,000,000 1,990,680 0.24
MINOR INTERNATIONAL PCL VAR PERPETUAL 29 DECEMBER 2049 3,885,000 3,954,308 0.48
MITSUBISHI UFJ FIN GROUP 3.741% 07 MARCH 2029 6,250,000 6,416,938 0.77
MODERNLAND OVERSEAS PTE LTD 6.95% 13 APRIL 2024 3,194,000 3,102,779 0.37
NEERG ENERGY LTD 6% 13 FEBRUARY 2022 7,000,000 6,944,210 0.84
NEXEN ENERGY ULC 7.875% 15 MARCH 2032 2,000,000 2,809,700 0.34
NTPC LTD 3.75% 03 APRIL 2024 1,382,000 1,377,840 0.17NTPC LTD 4.5% 19 MARCH 2028 4,500,000 4,583,610 0.55NWD FINANCE (BVI) 5.75%
PERPETUAL 29 DECEMBER 2049 3,000,000 2,915,790 0.35NWD FINANCE (BVI) LTD 6.25%
PERPETUAL 31 DECEMBER 2049 1,500,000 1,506,210 0.18OIL INDIA LTD 5.125% 04 FEBRUARY
2029 4,433,000 4,636,386 0.56ONGC VIDESH VANKORNEFT 2.875%
27 JANUARY 2022 5,000,000 4,911,750 0.59ONGC VIDESH VANKORNEFT 3.75%
27 JULY 2026 5,000,000 4,887,400 0.59PAKISTAN (REP OF) 8.25% 15 APRIL
2024 3,000,000 3,207,120 0.39PAKISTAN (REP OF) 8.25% 30
SEPTEMBER 2025 8,000,000 8,578,080 1.03PAKUWON PRIMA 5% 14 FEBRUARY
2024 5,000,000 4,964,100 0.60PB INTERNATIONAL BV 7.625% 26
JANUARY 2022 1,812,000 1,862,229 0.22PERTAMINA PERSERO 4.3% 20 MAY
2023 1,000,000 1,030,320 0.12PERTAMINA PERSERO 5.625% 20
MAY 2043 2,000,000 2,077,980 0.25
HoldingsMarket
value
%ofnet
assetsvalue
USD
PERTAMINA PERSERO PT 6.5% 07 NOVEMBER 2048 3,893,000 4,499,413 0.54
PERUSAHAAN LISTRIK NEGAR 5.25% 15 MAY 2047 2,500,000 2,482,300 0.30
PERUSAHAAN LISTRIK NEGAR 5.375% 25 JANUARY 2029 3,000,000 3,198,120 0.39
PERUSAHAAN LISTRIK NEGAR 5.45% 21 MAY 2028 3,000,000 3,210,690 0.39
PERUSAHAAN LISTRIK NEGAR 6.25% 25 JANUARY 2049 2,000,000 2,235,640 0.27
PHILIPPINES (REP OF) 5% 13 JANUARY 2037 2,000,000 2,361,620 0.28
POWER FINANCE CORP LTD 5.25% 10 AUGUST 2028 5,000,000 5,201,800 0.63
POWER FINANCE CORP LTD 6.15% 06 DECEMBER 2028 3,610,000 4,006,234 0.48
POWERLONG REAL ESTATE 5.95% 19 JULY 2020 2,000,000 1,991,880 0.24
PROVEN HONOUR CAPITAL LTD 4.125% 19 MAY 2025 2,000,000 1,967,120 0.24
PT PELABUHAN INDONESIA II 4.25% 5 MAY 2025 2,176,000 2,202,765 0.27
PTTEP CANADA INTERNATIONAL 6.35% 12 JUNE 2042 4,500,000 5,618,610 0.68
RADIANT ACCESS 4.6% PERPETUAL 29 DECEMBER 2049 6,000,000 5,552,640 0.67
REC LTD 3.875% 07 JULY 2027 2,201,000 2,076,137 0.25REDCO PROPERTIES GROUP 13.5%
21 JANUARY 2020 1,000,000 1,025,620 0.12RELIANCE HOLDINGS USA INC 5.4%
14FEB2022 6,000,000 6,290,580 0.76RELIANCE INDUSTRIES LTD 4.875%
10 FEBRUARY 2045 5,000,000 5,204,000 0.63RENEW POWER SYNTHETIC 6.67%
12 MARCH 2024 2,250,000 2,264,355 0.27REPUBLIC OF INDONESIA 4.1% 24
APRIL 2028 13,000,000 13,228,670 1.59REPUBLIC OF INDONESIA 4.75% 11
FEBRUARY 2029 7,500,000 8,039,475 0.97REPUBLIC OF PHILIPPINES 3.75% 14
JANUARY 2029 5,816,000 6,086,328 0.73REPUBLIC OF SRI LANKA 5.75% 18
APRIL 2023 6,000,000 5,933,880 0.71

118
Portfolio Statement (Unaudited)
HSBCAsiaHighIncomeBondFundas at 31 March 2019
HoldingsMarket
value
%ofnet
assetsvalue
USD
BondsListed investments
REPUBLIC OF SRI LANKA 5.75% 18 JANUARY 2022 4,000,000 4,002,960 0.48
REPUBLIC OF SRI LANKA 5.875% 25 JULY 2022 4,500,000 4,503,735 0.54
REPUBLIC OF SRI LANKA 6.125% 03 JUNE 2025 3,000,000 2,933,010 0.35
REPUBLIC OF SRI LANKA 6.2% 11 MAY 2027 5,500,000 5,291,000 0.64
REPUBLIC OF SRI LANKA 6.25% 27 JULY 2021 2,500,000 2,542,300 0.31
REPUBLIC OF SRI LANKA 6.75% 18 APRIL 2028 4,000,000 3,950,600 0.48
REPUBLIC OF SRI LANKA 6.85% 03 NOVEMBER 2025 2,000,000 2,021,360 0.24
REPUBLIC OF SRI LANKA 7.85% 14 MARCH 2029 2,386,000 2,500,289 0.30
RHB BANK 3.766% 19 FEBRUARY 2024 2,209,000 2,237,982 0.27
RKPF OVERSEAS 2019 7.75% 18 APRIL 2021 1,183,000 1,240,991 0.15
RONSHINE CHINA 11.25% 22 AUGUST 2021 1,421,000 1,508,832 0.18
SAKA ENERGI INDONESIA PT 4.45% 05 MAY 2024 1,500,000 1,481,790 0.18
SANDS CHINA LTD 5.125% 08 AUGUST 2025 4,000,000 4,197,760 0.51
SANDS CHINA LTD 5.4% 08 AUGUST 2028 3,000,000 3,144,840 0.38
SANTOS FINANCE LTD 4.125% 14 SEPTEMBER 2027 3,000,000 2,837,640 0.34
SANTOS FINANCE LTD 5.25% 13 MARCH 2029 4,615,000 4,652,935 0.56
SCENERY JOURNEY LTD 11% 06 NOVEMBER 2020 3,000,000 3,159,810 0.38
SHANGHAI COMMERCIAL BANK VAR 29 NOVEMBER 2027 3,439,000 3,385,730 0.41
SHIMAO PROPERTY HOLDINGS 5.75% 15 MARCH 2021 10,000,000 1,524,495 0.18
SHINHAN BANK 3.75% 20 SEPTEMBER 2027 6,581,000 6,507,095 0.78
HoldingsMarket
value
%ofnet
assetsvalue
USD
SHINHAN BANK 4.5% 26 MARCH 2028 4,818,000 5,007,974 0.60
SHINHAN FINANCIAL GROUP VAR PERPETUAL 29 DECEMBER 2049 1,800,000 1,857,150 0.22
SHINSEGAE CO LTD VAR 8 MAY 2045 1,500,000 1,483,260 0.18SIAM COMMERCIAL BANK CAY 3.9%
11 FEBRUARY 2024 1,440,000 1,465,157 0.18SIHC INTERNATIONAL CAPITAL
3.95% 26 SEPTEMBER 2021 3,683,000 3,712,390 0.45SIHC INTERNATIONAL CAPITAL
4.35% 26 SEPTEMBER 2023 3,887,000 3,979,977 0.48SINOPEC CAPITAL 2013 LTD 3.125%
24 APRIL 2023 2,000,000 1,987,080 0.24SK BROADBAND CO LTD 3.875% 13
AUGUST 2023 2,725,000 2,795,986 0.34SK INNOVATION CO LTD 4.125% 13
JULY 2023 5,000,000 5,180,700 0.62SP GROUP TREASURY PTE 3.375% 27
FEBRUARY 2029 2,127,000 2,149,887 0.26SPIC LUX LATAM RE ENER 4.65% 30
OCTOBER 2023 2,483,000 2,576,559 0.31STAR ENERGY GEOTHERMAL 6.75%
24 APRIL 2033 1,333,000 1,314,873 0.16STATE BANK INDIA/LONDON 4% 24
JANUARY 2022 4,854,000 4,930,159 0.59STATE BANK INDIA/LONDON 4.375%
24 JANUARY 2024 4,000,000 4,103,480 0.49STATE BANK INDIA/LONDON 4.5% 28
SEPTEMBER 2023 4,969,000 5,133,176 0.62SUN HUNG KAI PROP (CAP) 3.75% 25
FEBRUARY 2029 3,248,000 3,300,748 0.40SUNAC CHINA HOLDINGS LTD
7.875% 15 FEBRUARY 2022 5,000,000 5,082,550 0.61TENCENT HOLDINGS LTD 3.925% 19
JANUARY 2038 2,500,000 2,391,325 0.29THAIOIL TRSRY CENTER 5.375% 20
NOVEMBER 2048 500,000 563,630 0.07THETA CAPITAL PTE LTD 6.75% 31
OCTOBER 2026 4,000,000 3,697,840 0.45THETA CAPITAL PTE LTD 7% 11 APRIL
2022 5,000,000 4,954,450 0.60TIMES CHINA HOLDINGS LTD 10.95%
27 NOVEMBER 2020 1,180,000 1,268,665 0.15

119
Portfolio Statement (Unaudited)
HSBCAsiaHighIncomeBondFundas at 31 March 2019
HoldingsMarket
value
%ofnet
assetsvalue
USD
BondsListed investments
TOWNGAS FINANCE LTD VAR PERPETUAL 31 DECEMBER 2049 2,440,000 2,497,438 0.30
TSINGHUA UNIC LTD 4.75% 31 JANUARY 2021 1,000,000 983,160 0.12
UNION BANK OF PHILIPPINES 3.369% 29 NOVEMBER 2022 1,440,000 1,437,048 0.17
UNITED OVERSEAS BANK LTD VAR 8 MARCH 2027 6,000,000 5,883,720 0.71
UNITED OVERSEAS BANK LTD VAR PERPETUAL 29 DECEMBER 2049 2,091,000 2,009,493 0.24
US TREASURY N/B 3% 15 AUGUST 2048 4,000,000 4,146,250 0.50
US TREASURY N/B 3% 15 FEBRUARY 2049 4,000,000 4,148,750 0.50
VEDANTA RESOURCES PLC 6.125% 9 AUGUST 2024 1,000,000 914,740 0.11
VEDANTA RESOURCES PLC 7.125% 31 MAY 2023 1,000,000 980,870 0.12
VEDANTA RESOURCES PLC 8.25% 7 JUNE 2021 5,444,000 5,639,440 0.68
VERTEX CAPITAL INV LTD 4.75% 03 APRIL 2024 1,100,000 1,100,000 0.13
VIRGIN AUSTRALIA HOLDING 8.5% 15 NOVEMBER 2019 3,000,000 3,064,110 0.37
VLL INTERNATIONAL INC 5.75% 28 NOVEMBER 2024 3,917,000 3,891,775 0.47
WANDA PROPERTIES GLOBAL 6.25% 27 FEBRUARY 2020 3,336,000 3,363,589 0.40
WEALTH DRIVEN LTD 5.5% 17 AUGUST 2023 267,000 263,011 0.03
WEST CHINA CEMENT LTD 6.5% 11 SEPTEMBER 2019 2,000,000 1,607,936 0.19
WTT INVESTMENT LTD 5.5% 21 NOVEMBER 2022 8,615,000 8,623,098 1.04
YINGDE GASES INVESTMENT LTD 6.25% 19 JANUARY 2023 6,000,000 6,050,700 0.73
YUZHOU PROPERTIES CO LTD 7.9% 11 MAY 2021 5,000,000 5,160,950 0.62
YUZHOU PROPERTIES CO LTD VAR PERPETUAL 29 DECEMBER 2049 200,000 186,724 0.02
HoldingsMarket
value
%ofnet
assetsvalue
USD
ZHENRO PROPERTIES GROUP 8.65% 21 JANUARY 2023 2,263,000 2,251,730 0.27
ZHENRO PROPERTIES GROUP 9.15% 08 MARCH 2022 833,000 845,936 0.10
ZHENRO PROPERTIES GROUP 9.8% 20 AUGUST 2021 2,105,000 2,163,182 0.26
Bonds(total) 805,346,147 96.97
UnittrustsListed investments
HSBC INVESTMENT FUNDS LUXEMBOURG SA 372,405 3,982,870 0.48
Unlisted investments
HSBC ALL CHINA BOND 150,000 1,578,900 0.19
Unittrusts(total) 5,561,770 0.67
Foreigncurrencyforwardcontracts (217,550) (0.03)
Totalinvestments(Totalcostofinvestments$795,144,799) 810,690,367 97.61
Othernetassets 19,836,169 2.39
Totalnetassetsasat31March2019 830,526,536 100.00

120
Statement of Movements in Portfolio Holdings (Unaudited)
HSBCChinaMulti-AssetIncomeFundfor the year ended 31 March 2019
%ofnetasset
value2019
%ofnetasset
value2018
Financialassets
EquitiesChina 4.71 0.16Hong Kong 36.28 38.95United States of America 11.31 10.41
52.30 49.52
DebtsecuritiesListed bonds 45.47 46.63Unlisted but quoted bonds 0.89 1.83
46.36 48.46
Equity-linkedinstruments 0.90 0.12
Foreigncurrencyforwardcontracts (0.32) (0.00)
Totalinvestments 99.24 98.10
Othernetassets 0.76 1.90
Totalnetassets 100.00 100.00
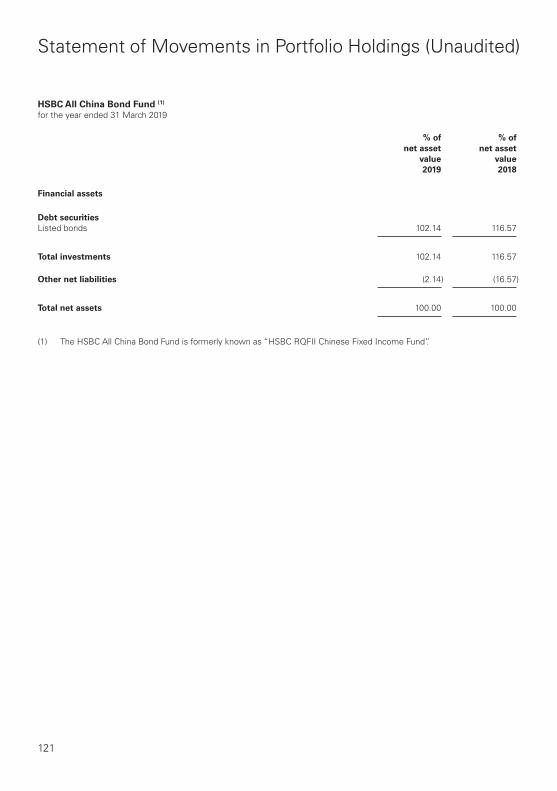
121
Statement of Movements in Portfolio Holdings (Unaudited)
HSBCAllChinaBondFund(1)
for the year ended 31 March 2019
%ofnetasset
value2019
%ofnetasset
value2018
Financialassets
DebtsecuritiesListed bonds 102.14 116.57
Totalinvestments 102.14 116.57
Othernetliabilities (2.14) (16.57)
Totalnetassets 100.00 100.00
(1) The HSBC All China Bond Fund is formerly known as “HSBC RQFII Chinese Fixed Income Fund”.

122
Statement of Movements in Portfolio Holdings (Unaudited)
HSBCAsiaPacificexJapanEquityVolatilityFocusedFundfor the year ended 31 March 2019
%ofnetasset
value2019
%ofnetasset
value2018
Financialassets
EquitiesAustralia 21.65 13.77China – 9.93Hong Kong 24.87 21.90India 12.56 11.07Indonesia 0.09 1.22Korea 6.66 11.32Malaysia 1.92 2.54New Zealand 2.07 0.70Singapore 6.52 7.52Taiwan 6.88 8.46Thailand 7.15 4.72The Philippines – 1.66United States of America 7.70 3.27
98.07 98.08
Unittrusts 0.76 0.00
Totalinvestments 98.83 98.08
Othernetassets 1.17 1.92
Totalnetassets 100.00 100.00

123
Statement of Movements in Portfolio Holdings (Unaudited)
HSBCEuroMulti-AssetIncomeFundfor the year ended 31 March 2019
%ofnetasset
value2019
%ofnetasset
value2018
Financialassets
EquitiesBelgium 1.67 3.10Finland 5.25 6.89France 15.11 15.70Germany 12.76 16.79Italy 3.10 2.49Netherlands 8.02 9.04Spain 4.54 1.97
50.45 55.98
DebtsecuritiesListed bonds 18.33 18.29
Unittrusts 24.31 23.17
Foreigncurrencyforwardcontracts 0.75 0.30
Totalinvestments 93.84 97.74
Othernetassets 6.16 2.26
Totalnetassets 100.00 100.00
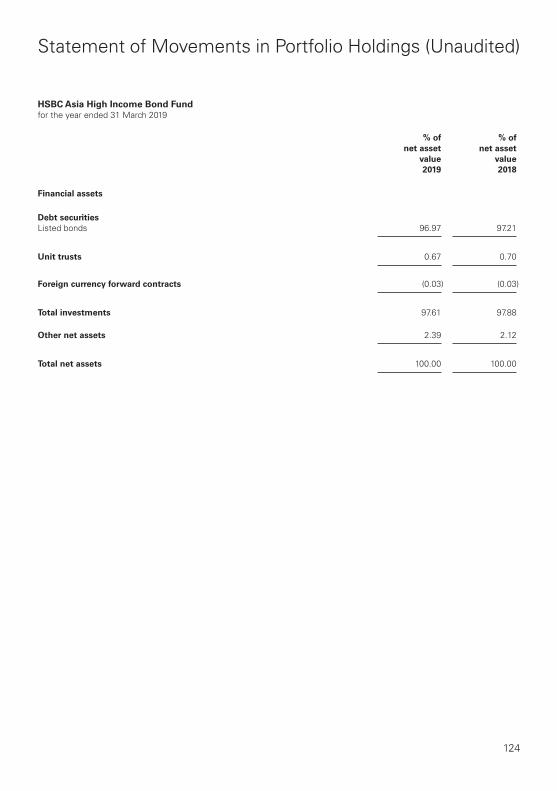
124
Statement of Movements in Portfolio Holdings (Unaudited)
HSBCAsiaHighIncomeBondFundfor the year ended 31 March 2019
%ofnetasset
value2019
%ofnetasset
value2018
Financialassets
DebtsecuritiesListed bonds 96.97 97.21
Unittrusts 0.67 0.70
Foreigncurrencyforwardcontracts (0.03) (0.03)
Totalinvestments 97.61 97.88
Othernetassets 2.39 2.12
Totalnetassets 100.00 100.00

125
Performance Record (Unaudited)
HSBCChinaMulti-AssetIncomeFund
(a) Totalnetassetvalue(calculatedinaccordancewithHKFRS)
2019 2018 2017 2016HKD HKD HKD HKD
Total net asset value 4,416,824,974 6,521,423,305 3,083,696,483 5,265,440,403
(b) Netassetvalueperunit(calculatedinaccordancewithHKFRS)
Denominationcurrency 2019 2018 2017 2016
Netassetvalueperunit
– Class AM2 – USD USD 11.710 12.615 10.438 9.819– Class AM2 – RMB RMB 12.841 12.924 11.725 10.387– Class AM2 – HKD HKD 11.852 12.763 10.447 9.819– Class AM3O – AUD AUD 8.948 9.686 – –– Class AM3O – SGD SGD 10.099 – – –
(c) Pricerecord(Dealingnetassetvalueperunit)
ClassAM2–USD Bid Offer
Lowest Highest Lowest HighestUSD USD USD USD
Year ended 2019 10.279 12.952 10.451 13.670Year ended 2018 9.911 13.432 10.461 14.176Year ended 2017 9.534 10.834 10.062 11.434Year ended 2016 9.127 12.111 9.633 12.782Period from date of commencement to 31 March 2015 9.968 10.796 10.521 11.395
ClassAM2–RMB Bid Offer
Lowest Highest Lowest HighestRMB RMB RMB RMB
Year ended 2019 11.691 13.440 11.741 14.185Year ended 2018 11.244 13.865 11.867 14.633Year ended 2017 10.189 11.874 10.754 12.532Year ended 2016 9.755 12.271 10.296 12.952Period from date of commencement to 31 March 2015 10.000 10.954 10.554 11.561
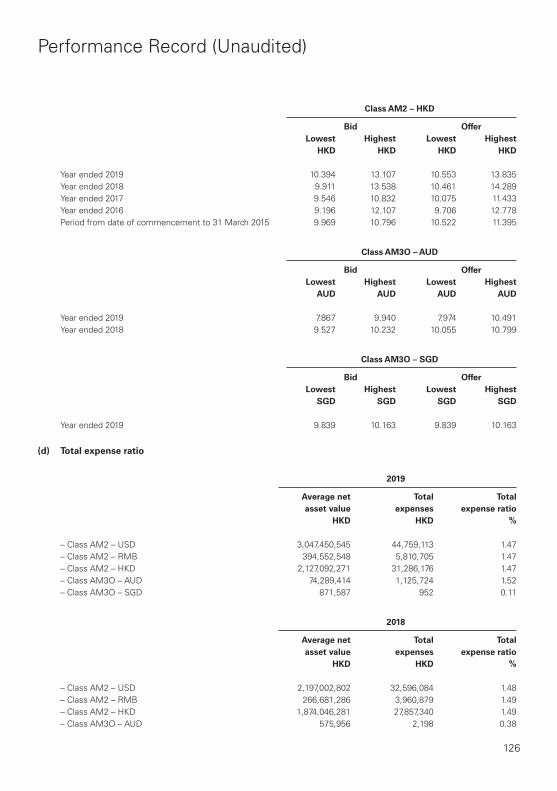
126
Performance Record (Unaudited)
ClassAM2–HKD Bid Offer
Lowest Highest Lowest HighestHKD HKD HKD HKD
Year ended 2019 10.394 13.107 10.553 13.835Year ended 2018 9.911 13.538 10.461 14.289Year ended 2017 9.546 10.832 10.075 11.433Year ended 2016 9.196 12.107 9.706 12.778Period from date of commencement to 31 March 2015 9.969 10.796 10.522 11.395
ClassAM3O–AUD Bid Offer
Lowest Highest Lowest HighestAUD AUD AUD AUD
Year ended 2019 7.867 9.940 7.974 10.491Year ended 2018 9.527 10.232 10.055 10.799
ClassAM3O–SGD Bid Offer
Lowest Highest Lowest HighestSGD SGD SGD SGD
Year ended 2019 9.839 10.163 9.839 10.163
(d) Totalexpenseratio
2019
Averagenetassetvalue
Totalexpenses
Totalexpenseratio
HKD HKD %
– Class AM2 – USD 3,047,450,545 44,759,113 1.47– Class AM2 – RMB 394,552,548 5,810,705 1.47– Class AM2 – HKD 2,127,092,271 31,286,176 1.47– Class AM3O – AUD 74,289,414 1,125,724 1.52– Class AM3O – SGD 871,587 952 0.11
2018
Averagenetassetvalue
Totalexpenses
Totalexpenseratio
HKD HKD %
– Class AM2 – USD 2,197,002,802 32,596,084 1.48– Class AM2 – RMB 266,681,286 3,960,879 1.49– Class AM2 – HKD 1,874,046,281 27,857,340 1.49– Class AM3O – AUD 575,956 2,198 0.38

127
Performance Record (Unaudited)
HSBCAllChinaBondFund(formerlyknownasHSBCRQFIIChineseFixedIncomeFund)
(a) Totalassetvalue(calculatedinaccordancewithHKFRS)
2019 2018 2017 2016RMB RMB RMB RMB
Total net asset value 125,214,543 125,018,035 159,800,438 399,868,231
(b) Netassetvalueperunit(calculatedinaccordancewithHKFRS)
Denominationcurrency 2019 2018 2017 2016
Netassetvalueperunit
– Class AC – USD USD 10.714 10.655 9.761 10.649– Class AM2 – USD USD 8.684 9.106 8.780 9.939– Class AC – RMB RMB 11.506 10.778 10.813 11.094– Class AM2 – RMB RMB 9.432 9.240 9.780 10.393– Class AC – HKD HKD – – – 10.640– Class AM2 – HKD HKD – 9.204 8.789 9.931– Class ZC – RMB RMB – – – –– Class ZC – USD USD 10.567 – – –
(c) Pricerecord(Dealingnetassetvalueperunit)
ClassAC–USD Bid Offer
Lowest Highest Lowest HighestUSD USD USD USD
Year ended 2019 9.973 10.866 10.024 11.202Year ended 2018 9.552 10.675 9.847 11.006Year ended 2017 9.615 10.691 9.912 11.021Year ended 2016 10.132 10.694 10.445 11.024Period from date of commencement to 31 March 2015 9.993 10.392 9.993 10.392
ClassAM2–USD Bid Offer
Lowest Highest Lowest HighestUSD USD USD USD
Year ended 2019 8.290 9.286 8.330 9.574Year ended 2018 8.553 9.160 8.818 9.443Year ended 2017 8.737 9.978 9.008 10.287Year ended 2016 9.621 10.179 9.919 10.494Period from date of commencement to 31 March 2015 9.858 10.258 9.858 10.258

128
Performance Record (Unaudited)
ClassAC–RMB Bid Offer
Lowest Highest Lowest HighestRMB RMB RMB RMB
Year ended 2019 10.769 11.501 11.103 11.550Year ended 2018 10.578 10.955 10.906 11.294Year ended 2017 10.730 11.317 11.062 11.668Year ended 2016 10.217 11.125 10.533 11.470Period from date of commencement to 31 March 2015 9.972 10.323 9.972 10.323
ClassAM2–RMB Bid Offer
Lowest Highest Lowest HighestRMB RMB RMB RMB
Year ended 2019 9.251 9.479 9.350 9.727Year ended 2018 9.181 10.023 9.466 10.333Year ended 2017 9.744 10.477 10.046 10.802Year ended 2016 9.911 10.483 10.218 10.808Period from date of commencement to 31 March 2015 9.908 10.126 9.908 10.126
ClassZC–RMB Bid Offer
Lowest Highest Lowest HighestRMB RMB RMB RMB
Year ended 2019 – – – –Year ended 2018 – – – –Year ended 2017 – – – –Year ended 2016 – – – –Period from date of commencement to 31 March 2015 9.984 10.354 9.984 10.354
ClassAC–HKD Bid Offer
Lowest Highest Lowest HighestHKD HKD HKD HKD
Year ended 2019 – – – –Year ended 2018 9.717 9.951 10.018 10.259Year ended 2017 9.621 10.683 9.919 11.014Year ended 2016 10.118 10.686 10.432 11.017Period from date of commencement to 31 March 2015 9.993 10.397 9.993 10.397

129
Performance Record (Unaudited)
ClassAM2–HKD Bid Offer
Lowest Highest Lowest HighestHKD HKD HKD HKD
Year ended 2019 8.364 9.388 8.386 9.680Year ended 2018 8.578 9.256 8.844 9.543Year ended 2017 8.740 9.971 9.010 10.281Year ended 2016 9.610 10.178 9.908 10.494Period from date of commencement to 31 March 2015 9.859 10.263 9.859 10.263
ClassZC–USD Bid Offer
Lowest Highest Lowest HighestUSD USD USD USD
Year ended 2019 9.831 10.575 9.831 10.575
(d) Totalexpenseratio
2019
Averagenetassetvalue
Totalexpenses
Totalexpenseratio
RMB RMB %
– Class AC – USD 8,308,516 182,266 2.19– Class AM2 – USD 28,025,623 614,541 2.19– Class AC – RMB 26,818,264 588,786 2.20– Class AM2 – RMB 38,538,284 844,952 2.19– Class AM2 – HKD 6,181,829 135,623 2.19– Class ZC – USD 31,185,030 283,932 0.91
2018
Averagenetassetvalue
Totalexpenses
Totalexpenseratio
RMB RMB %
– Class AC – USD 10,642,761 211,604 1.99– Class AM2 – USD 42,696,705 850,803 1.99– Class AC – RMB 46,514,649 921,776 1.98– Class AM2 – RMB 46,119,116 917,536 1.99– Class AM2 – HKD 12,333,553 246,463 2.00

130
Performance Record (Unaudited)
HSBCAsiaPacificexJapanEquityVolatilityFocusedFund
(a) Totalnetassetvalue(calculatedinaccordancewithHKFRS)
2019 2018 2017 2016USD USD USD USD
Total net asset value 99,977,731 128,500,588 83,760,093 70,766,354
(b) Netassetvalueperunit(calculatedinaccordancewithHKFRS)
Denominationcurrency 2019 2018 2017 2016
Netassetvalueperunit
– Class AM2 – USD USD 9.933 10.449 9.728 8.891– Class AM2 – HKD HKD 10.024 10.563 9.730 8.871– Class BC – USD USD 10.188 – – –– Class BC – HKD HKD 10.189 – – –– Class BC – RMB RMB 10.108 – – –– Class BM2 – USD USD 10.154 – – –– Class BM2 – HKD HKD 10.158 – – –– Class BM2 – RMB RMB 10.094 – – –
(c) Pricerecord(Dealingnetassetvalueperunit)
ClassAM2–USD Bid Offer
Lowest Highest Lowest HighestUSD USD USD USD
Year ended 2019 9.129 10.690 9.129 11.283Year ended 2018 8.872 11.269 9.364 11.895Year ended 2017 8.557 9.807 9.032 10.351Period from date of commencement to 31 March 2016 7.769 10.632 8.200 11.222
ClassAM2–HKD Bid Offer
Lowest Highest Lowest HighestHKD HKD HKD HKD
Year ended 2019 9.186 10.785 9.186 11.397Year ended 2018 8.850 11.328 9.346 11.961Year ended 2017 8.551 9.797 9.033 10.341Period from date of commencement to 31 March 2016 7.829 10.618 8.266 11.207

131
Performance Record (Unaudited)
ClassBM2–USD Bid Offer
Lowest Highest Lowest HighestUSD USD USD USD
Year ended 2019 10.000 10.254 10.000 10.254
ClassBM2–HKD Bid Offer
Lowest Highest Lowest HighestHKD HKD HKD HKD
Year ended 2019 10.000 10.255 10.000 10.255
ClassBM2–RMB Bid Offer
Lowest Highest Lowest HighestRMB RMB RMB RMB
Year ended 2019 9.889 10.191 9.889 10.191
ClassBC–HKD Bid Offer
Lowest Highest Lowest HighestHKD HKD HKD HKD
Year ended 2019 10.000 10.256 10.000 10.256
ClassBC–RMB Bid Offer
Lowest Highest Lowest HighestRMB RMB RMB RMB
Year ended 2019 9.889 10.184 9.889 10.184
ClassBC–USD Bid Offer
Lowest Highest Lowest HighestUSD USD USD USD
Year ended 2019 10.000 10.254 10.000 10.254

132
Performance Record (Unaudited)
(d) Totalexpenseratio
2019
Averagenetassetvalue
Totalexpenses
Totalexpenseratio
USD USD %
– Class AM2 – USD 80,679,904 1,651,415 2.05– Class AM2 – HKD 36,427,730 744,402 2.04– Class BC – HKD 21,015 57 0.27– Class BC – RMB 267,650 700 0.26– Class BC – USD 398,901 1,063 0.27– Class BM2 – HKD 57,685 146 0.25– Class BM2 – RMB 482,259 1,305 0.27– Class BM2 – USD 239,972 630 0.26
2018
Averagenetassetvalue
Totalexpenses
Totalexpenseratio
USD USD %
– Class AM2 – USD 56,172,828 1,236,774 2.20– Class AM2 – HKD 31,083,840 616,677 1.98
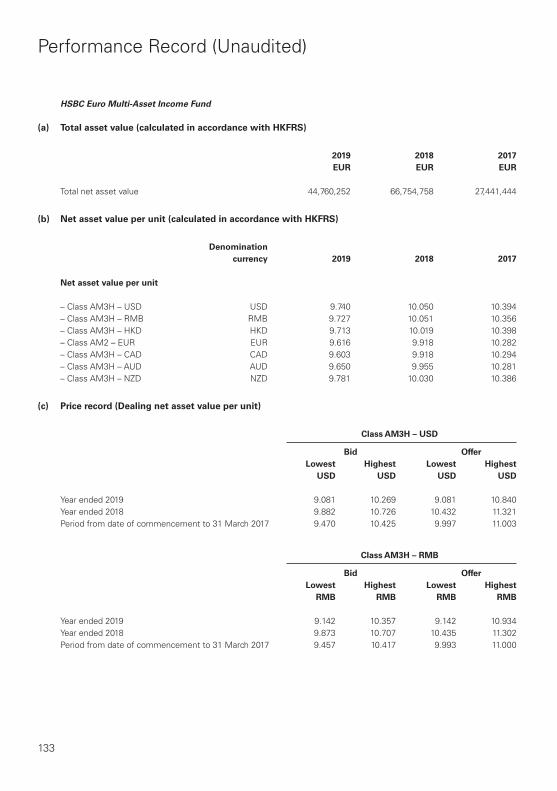
133
Performance Record (Unaudited)
HSBCEuroMulti-AssetIncomeFund
(a) Totalassetvalue(calculatedinaccordancewithHKFRS)
2019 2018 2017EUR EUR EUR
Total net asset value 44,760,252 66,754,758 27,441,444
(b) Netassetvalueperunit(calculatedinaccordancewithHKFRS)
Denominationcurrency 2019 2018 2017
Netassetvalueperunit
– Class AM3H – USD USD 9.740 10.050 10.394– Class AM3H – RMB RMB 9.727 10.051 10.356– Class AM3H – HKD HKD 9.713 10.019 10.398– Class AM2 – EUR EUR 9.616 9.918 10.282– Class AM3H – CAD CAD 9.603 9.918 10.294– Class AM3H – AUD AUD 9.650 9.955 10.281– Class AM3H – NZD NZD 9.781 10.030 10.386
(c) Pricerecord(Dealingnetassetvalueperunit)
ClassAM3H–USD Bid Offer
Lowest Highest Lowest HighestUSD USD USD USD
Year ended 2019 9.081 10.269 9.081 10.840Year ended 2018 9.882 10.726 10.432 11.321Period from date of commencement to 31 March 2017 9.470 10.425 9.997 11.003
ClassAM3H–RMB Bid Offer
Lowest Highest Lowest HighestRMB RMB RMB RMB
Year ended 2019 9.142 10.357 9.142 10.934Year ended 2018 9.873 10.707 10.435 11.302Period from date of commencement to 31 March 2017 9.457 10.417 9.993 11.000

134
Performance Record (Unaudited)
ClassAM3H–HKD Bid Offer
Lowest Highest Lowest HighestHKD HKD HKD HKD
Year ended 2019 9.127 10.332 9.127 10.923Year ended 2018 9.853 10.722 10.406 11.320Period from date of commencement to 31 March 2017 9.456 10.423 9.984 11.005
ClassAM2–EUR Bid Offer
Lowest Highest Lowest HighestEUR EUR EUR EUR
Year ended 2019 9.033 10.219 9.033 10.787Year ended 2018 9.741 10.597 10.281 11.185Period from date of commencement to 31 March 2017 9.414 10.309 9.936 10.882
ClassAM3H–CAD Bid Offer
Lowest Highest Lowest HighestCAD CAD CAD CAD
Year ended 2019 9.033 10.224 9.033 10.790Year ended 2018 9.752 10.619 10.294 11.211Period from date of commencement to 31 March 2017 9.446 10.325 9.971 10.897
ClassAM3H–AUD Bid Offer
Lowest Highest Lowest HighestAUD AUD AUD AUD
Year ended 2019 9.081 10.269 9.081 10.840Year ended 2018 9.787 10.613 10.331 11.202Period from date of commencement to 31 March 2017 9.354 10.317 9.873 10.889
ClassAM3H–NZD Bid Offer
Lowest Highest Lowest HighestNZD NZD NZD NZD
Year ended 2019 9.147 10.357 9.147 10.931Year ended 2018 9.866 10.716 10.415 11.311Period from date of commencement to 31 March 2017 9.459 10.425 9.983 11.004

135
Performance Record (Unaudited)
(d) Totalexpenseratio
2019
Averagenetassetvalue
Totalexpenses
Totalexpenseratio
EUR EUR %
– Class AM3H – USD 22,539,326 417,289 1.85– Class AM3H – RMB 3,137,623 57,141 1.82– Class AM3H – HKD 14,504,068 268,066 1.85– Class AM2 – EUR 6,194,107 109,887 1.77– Class AM3H – AUD 4,342,461 79,284 1.83– Class AM3H – CAD 1,706,430 31,258 1.83– Class AM3H – NZD 3,489,718 63,333 1.81
2018
Averagenetassetvalue
Totalexpenses
Totalexpenseratio
EUR EUR %
– Class AM3H – USD 39,231,292 715,317 1.82– Class AM3H – RMB 1,873,503 34,073 1.82– Class AM3H – HKD 30,915,531 564,295 1.83– Class AM2 – EUR 4,536,334 78,104 1.72– Class AM3H – CAD 3,860,645 70,827 1.83– Class AM3H – AUD 3,533,332 64,613 1.83– Class AM3H – NZD 2,244,786 40,567 1.81
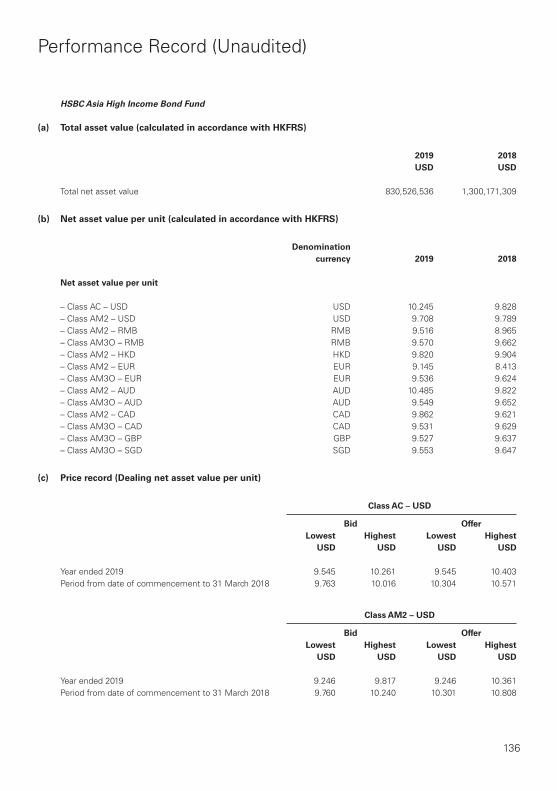
136
Performance Record (Unaudited)
HSBCAsiaHighIncomeBondFund
(a) Totalassetvalue(calculatedinaccordancewithHKFRS)
2019 2018USD USD
Total net asset value 830,526,536 1,300,171,309
(b) Netassetvalueperunit(calculatedinaccordancewithHKFRS)
Denominationcurrency 2019 2018
Netassetvalueperunit
– Class AC – USD USD 10.245 9.828– Class AM2 – USD USD 9.708 9.789– Class AM2 – RMB RMB 9.516 8.965– Class AM3O – RMB RMB 9.570 9.662– Class AM2 – HKD HKD 9.820 9.904– Class AM2 – EUR EUR 9.145 8.413– Class AM3O – EUR EUR 9.536 9.624– Class AM2 – AUD AUD 10.485 9.822– Class AM3O – AUD AUD 9.549 9.652– Class AM2 – CAD CAD 9.862 9.621– Class AM3O – CAD CAD 9.531 9.629– Class AM3O – GBP GBP 9.527 9.637– Class AM3O – SGD SGD 9.553 9.647
(c) Pricerecord(Dealingnetassetvalueperunit)
ClassAC–USD Bid Offer
Lowest Highest Lowest HighestUSD USD USD USD
Year ended 2019 9.545 10.261 9.545 10.403Period from date of commencement to 31 March 2018 9.763 10.016 10.304 10.571
ClassAM2–USD Bid Offer
Lowest Highest Lowest HighestUSD USD USD USD
Year ended 2019 9.246 9.817 9.246 10.361Period from date of commencement to 31 March 2018 9.760 10.240 10.301 10.808
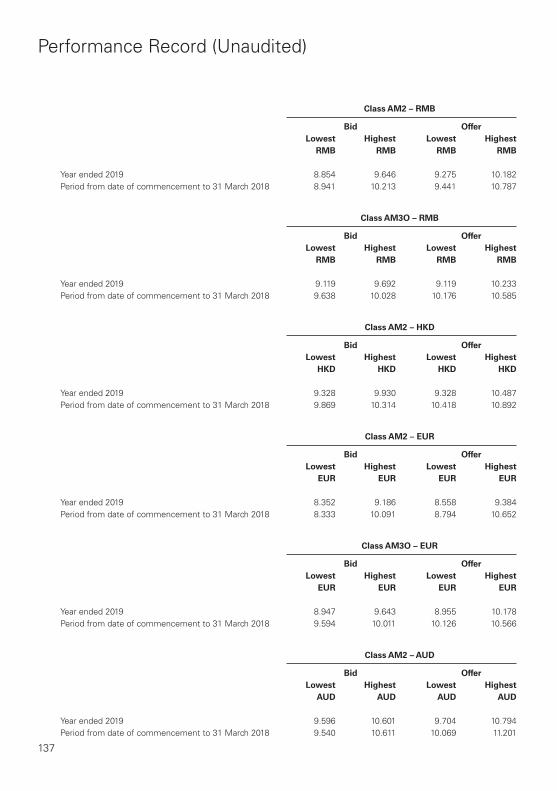
137
Performance Record (Unaudited)
ClassAM2–RMB Bid Offer
Lowest Highest Lowest HighestRMB RMB RMB RMB
Year ended 2019 8.854 9.646 9.275 10.182Period from date of commencement to 31 March 2018 8.941 10.213 9.441 10.787
ClassAM3O–RMB Bid Offer
Lowest Highest Lowest HighestRMB RMB RMB RMB
Year ended 2019 9.119 9.692 9.119 10.233Period from date of commencement to 31 March 2018 9.638 10.028 10.176 10.585
ClassAM2–HKD Bid Offer
Lowest Highest Lowest HighestHKD HKD HKD HKD
Year ended 2019 9.328 9.930 9.328 10.487Period from date of commencement to 31 March 2018 9.869 10.314 10.418 10.892
ClassAM2–EUR Bid Offer
Lowest Highest Lowest HighestEUR EUR EUR EUR
Year ended 2019 8.352 9.186 8.558 9.384Period from date of commencement to 31 March 2018 8.333 10.091 8.794 10.652
ClassAM3O–EUR Bid Offer
Lowest Highest Lowest HighestEUR EUR EUR EUR
Year ended 2019 8.947 9.643 8.955 10.178Period from date of commencement to 31 March 2018 9.594 10.011 10.126 10.566
ClassAM2–AUD Bid Offer
Lowest Highest Lowest HighestAUD AUD AUD AUD
Year ended 2019 9.596 10.601 9.704 10.794Period from date of commencement to 31 March 2018 9.540 10.611 10.069 11.201

138
Performance Record (Unaudited)
ClassAM3O–AUD Bid Offer
Lowest Highest Lowest HighestAUD AUD AUD AUD
Year ended 2019 9.108 9.679 9.111 10.216Period from date of commencement to 31 March 2018 9.623 10.018 10.157 10.574
ClassAM2–CAD Bid Offer
Lowest Highest Lowest HighestCAD CAD CAD CAD
Year ended 2019 9.204 9.979 9.271 10.228Period from date of commencement to 31 March 2018 9.328 10.618 9.846 11.207
ClassAM3O–CAD Bid Offer
Lowest Highest Lowest HighestCAD CAD CAD CAD
Year ended 2019 9.061 9.656 9.061 10.192Period from date of commencement to 31 March 2018 9.602 10.017 10.136 10.572
ClassAM3O–GBP Bid Offer
Lowest Highest Lowest HighestGBP GBP GBP GBP
Year ended 2019 9.090 9.659 9.090 10.194Period from date of commencement to 31 March 2018 9.605 10.019 10.137 10.575
ClassAM3O–SGD Bid Offer
Lowest Highest Lowest HighestSGD SGD SGD SGD
Year ended 2019 9.095 9.668 9.095 10.205Period from date of commencement to 31 March 2018 9.613 10.020 10.147 10.576

139
Performance Record (Unaudited)
(d) Totalexpenseratio
2019
Averagenetassetvalue
Totalexpenses
Totalexpenseratio
USD USD %
– Class AC – USD 1,078,609 13,518 1.25– Class AM2 – USD 462,297,089 5,918,510 1.28– Class AM2 – RMB 1,017,670 12,937 1.27– Class AM3O – RMB 11,273,513 149,430 1.33– Class AM2 – HKD 348,142,873 4,458,152 1.28– Class AM2 – EUR 625,394 7,962 1.27– Class AM3O – EUR 1,226,909 16,236 1.32– Class AM2 – AUD 3,865,507 48,980 1.27– Class AM3O – AUD 21,612,273 288,064 1.33– Class AM2 – CAD 887,599 11,199 1.26– Class AM3O – CAD 7,856,254 104,405 1.33– Class AM3O – GBP 6,523,961 87,087 1.33– Class AM3O – SGD 688 9 1.25
2018
Averagenetassetvalue
Totalexpenses
Totalexpenseratio
USD USD %
– Class AC – USD 490,245 1,945 0.40– Class AM2 – USD 826,274,013 11,421,438 1.38– Class AM2 – RMB 1,209,118 16,597 1.37– Class AM3O – RMB 5,159,376 35,580 0.69– Class AM2 – HKD 661,015,874 9,134,236 1.38– Class AM2 – EUR 294,234 4,085 1.39– Class AM3O – EUR 351,381 2,396 0.68– Class AM2 – AUD 1,807,532 25,057 1.39– Class AM3O – AUD 20,185,233 138,889 0.69– Class AM2 – CAD 492,749 6,755 1.37– Class AM3O – CAD 4,718,095 32,353 0.69– Class AM3O – GBP 4,633,028 31,495 0.68– Class AM3O – SGD 740 6 0.81

140
Administration
ManagerHSBC Investment Funds (Hong Kong) LimitedHSBC Main Building1 Queen’s Road CentralHong Kong
DirectorsoftheManagerBERRY, Stuart GlennBOTELHO BASTOS, Pedro AugustoLAU, Ka Yin JoanneMALDONADO-CODINA, Guillermo EduardoTAM, Chun Pong, Stephen
TrusteeandRegistrarHSBC Institutional Trust Services (Asia) LimitedHSBC Main Building1 Queen’s Road CentralHong Kong
InvestmentAdviserHSBC Global Asset Management (Hong Kong) LimitedHSBC Main Building1 Queen’s Road CentralHong Kong
Sub-InvestmentAdvisorFor HSBC Euro Multi-Asset Income FundHSBC Global Asset Management (France)Immeuble Coeur Defence – Tour A110 Esplanade du General de GaulleLa Defence 492400 CournevoieFrance
RQFIICustodianFor HSBC All China Bond Fund (formerly known as HSBC RQFII Chinese Fixed Income Fund)Bank of Communications Co., Ltd.188, Yin Cheng Zhong Road Shanghai 200120The People’s Republic of China
AuditorKPMG8th Floor, Prince’s Building10 Chater RoadCentralHong Kong
LegalAdvisersDeacons5/F, Alexandra House18 Chater RoadCentralHong Kong

[This page is intentionally left blank]

HC
IT03
19A
Prin
ted
in th
e H
ong
Kong
SA
R
Issued by HSBC Global Asset Management (Hong Kong) Limited