hsbc greater china financials day
TRANSCRIPT

1 TWSE Code 5871
HSBC Greater China Financials Day
May 27, 2014

Disclaimer
This presentation contains forward-looking statements concerning the financial condition, results
of operations and businesses of Chailease Holding Company Limited (the "Company"). All
statements other than statements of historical fact are, or may be deemed to be, forward-looking
statements. Forward-looking statements are statements of future expectations that are based on
management’s current expectations and assumptions and involve known and unknown risks and
uncertainties that could cause actual results, performance or events to differ materially from those
expressed or implied in these statements. Forward-looking statements include, among other
things, statements concerning the potential exposure of the Company to market risks and
statements expressing management’s expectations, beliefs, estimates, forecasts, projections and
assumptions. These forward-looking statements are identified by their use of terms and phrases
such as ‘‘anticipate’’, ‘‘believe’’, ‘‘could’’, ‘‘estimate’’, ‘‘expect’’, ‘‘intend’’, ‘‘may’’, ‘‘plan’’,
‘‘objectives’’, ‘‘outlook’’, ‘‘probably’’, ‘‘project’’, ‘‘will’’, ‘‘seek’’, ‘‘target’’, ‘‘risks’’, ‘‘goals’’,
‘‘should’’ and similar terms and phrases. There are a number of factors that could affect the
future operations of the Company and could cause those results to differ materially from those
expressed in the forward-looking statements included in this document. All forward-looking
statements contained in this document are expressly qualified in their entirety by the cautionary
statements contained or referred to herein. Readers should not place undue reliance on forward-
looking statements. Each forward-looking statement speaks only as of the date of this
presentation. Neither the Company nor any of its subsidiaries undertake any obligation to publicly
update or revise any forward-looking statement as a result of new information, future events or
other information. In light of these risks, results could differ materially from those stated, implied
or inferred from the forward-looking statements contained in this presentation.
2

Agenda
Business Review
1Q2014 Performance Review
Segment Review
Q&A
Appendix
Company Overview
3

Leading Taiwan-based SME Finance Company with Focus on Greater China and Emerging Asia
Commenced operations in 2005 with national
leasing license
Focus on capital leasing and expanding into
factoring and trade financing
~8,000 clients (90% are local enterprises)
25 offices nationwide and 500 sales personnel
PRC
Taiwan
37 years of operating track record since 1977
Leading market position in leasing and
installment sales
Full SME financing platform
Diversified SME-focused customer base with
over 18,000 corporate clients
12 offices and over 900 sales personnel
Thailand
Commenced operations in 1989
Focus on automobile installment
sales, equipment leasing and
factoring
7 offices in key commercial hubs
Vietnam
Commenced operations in 2007
Focus on capital leasing
3 offices in Hanoi, HCMC and Cantho
Notes
Unless otherwise indicated, all figures are as of Dec. 31, 2012
1. Others include assets from our U.S. and Vietnam operations as well as those of the holding companies; the Company is engaged in commercial real estate financing in the U.S. (Los Angeles) and focuses mainly on asset
management and risk control since the subprime crisis
4

Agenda
Business Review
1Q2014 Performance Review
Segment Review
Q&A
Appendix
Company Overview
5

Customized SME Financing Solutions and
New and Innovative Products
■Chailease has presence
in 12 locations in Taiwan
– Covers all the major
commercial centers
■More than 900 sales
personnel as at June 30,
2013
■ 45% of total contract
value of new leasing and
installment sales
contracts among TLA
members in 2013 in
Taiwan
Hsinchu
Kaohsiung
Tainan
Changhwa
Ilan
Taichung
Taipei Taoyuan
New Taipei
Hsinchung
Chungli
Chiayi
1977
1980
1986
1989
1995
2011
2012
Leasing Installment sales
International factoring
Automobile installment sales
Domestic factoring
Direct financing
Automobile leasing
Car rental
ESCO financing
Insurance brokerage
2006
Extensive Distribution Network
Market Leader in the Taiwan Leasing Industry
2003
Aircraft financing
2013
6

Well Positioned to Capture the Significant Growth Potential in the PRC
Extensive Footprint across Major
Industrial & Commercial Hubs in PRC(2)
Source Company
PRC Strategy
1 Expand presence gradually from coastal regions to inland cities
2 Broaden industry exposure
3 Expand product offerings and enter niche financing businesses
4 Further strengthen risk and human resources management
Note : 2013 Loan portfolio % by region
Eastern China 25%, Southeast China 18%, Southern China 19%, Central and
Southeast China 11% and Northern China 28%
7

Strategic Alliances with major banks to
ensure sufficient funding to support growth
Offshore Funding
Dim Sum Bond
Continue to diversify sources of funding
and lower funding cost
• Bank Loans
• Commercial Papers
• Corp Bonds
• TWSE Listing
• Securitization
Taiwan PRC
Adequate and Diverse Funding to Support Business Growth
8

Effective Credit Risk Management System and Risk Pricing Mechanism
Credit Policy
■ Enforcement of the credit grading and scoring system
■ Performance review tied to asset quality
Effective Credit Review and Approval Process to Ensure Adequate Return Risk Exposure
1
Review Application Documents
• Whether the application has any element falling into the blacklist
• Whether all the required documents are in order
• Any need to request other documents
Credit Rating and Approval
• Proceed within the scope of authorisation
3 Confirmation and Approval
Initial Application 2
Discussion Between Business Department and Credit Department
Case Assignment
• The management of credit department assigns the application to a credit officer
• Discuss and clarify the structure of the application and identify issues
On-Site Visit
Analyse credit data
Decide the credit amount and financing terms
Appraisal
Prepare credit analysis reports
Credit rating and scoring, and applying the risk model
• On-site credit investigation to reduce the possibility of misjudgment
• Face-to-face credit investigation to verify the accuracy of information provided or to supplement information
Information Gathering and Analysis
Credit Approval Process
Credit Review and Decision Process
■ Standardized operating procedure of credit evaluation
■ Segregation of sales and credit appraisal functions
■ Streamlined credit approval process
9

■ Develop various credit risk
management models based on the
use of credit rating system
■ Integrate qualitative and
quantitative client information to
quantify a client’s creditworthiness
and provide an early earning
mechanism with regard to its
overall risk exposure
■ The IRB approach consists of:
Comprehensive Credit Risk Model Increases the Accuracy of Assessment
Internal Rating Based (“IRB”) Approach Model Structure Model Application
Credit Risk
Management Model
(Quantification)
Credit Rating System
(Expertise/
Quantification)
■ Built according to actual SME
samples
■ Financial and non-financial factors
included
■ Constructed using diversified statistical
methods
■ Suitable for SME risk assessment
■ Periodical review to ensure adequacy
of the model
■ Estimate and quantify the risk
(EAD*PD)
■ Provide the basis for underwriting and
financing terms structuring (e.g. adjust
financing terms or make credit
enhancement)
■ Calculate the expected loss and
provide allowance for impairment
losses
Expected
Loss
Exposure
At
Default
Probabi-
lity of
Default
Loss
Given
Default = x x
The Company Calculates
Probability of Default for Each
Rating Level Based on the
Risk Assessment Model
Input Output
Scoring
Materials
■ Default assessment
■ Default point
■ Probability of
default
1 Enhance risk management capability with a standardized and tested methodology
2 Enhance accuracy of risk assessment and credit exposure
3 Reduce potential loss
Effective Credit Risk Management System and Risk Pricing Mechanism (Cont’d)
10
Agenda
Business Review
1Q2014 Performance Review
Segment Review
Q&A
Appendix
Company Overview
11

Management Highlight
Consolidated portfolio growth in line with plan
Employee turnover improved and stabilized in
China
YOY YTD
Consolidated 20% 5%
Taiwan 31% 7%
China 10% 0.4%
Thailand 9% 6%
12

Total Portfolio Consolidated
Source: unaudited financial statements
Unit: NT$ million
13

Revenue Consolidated
Source: unaudited financial statements
14

Source: unaudited financial statements
58% 51%
19%
22% 11%
11%
10%
5%
11%
2%
Unit: NT$ million
Revenue Mix Consolidated
15

Source: unaudited financial statements Note: 2013 EPS has been retroactively adjusted.
Net Profit & EPS Consolidated
16
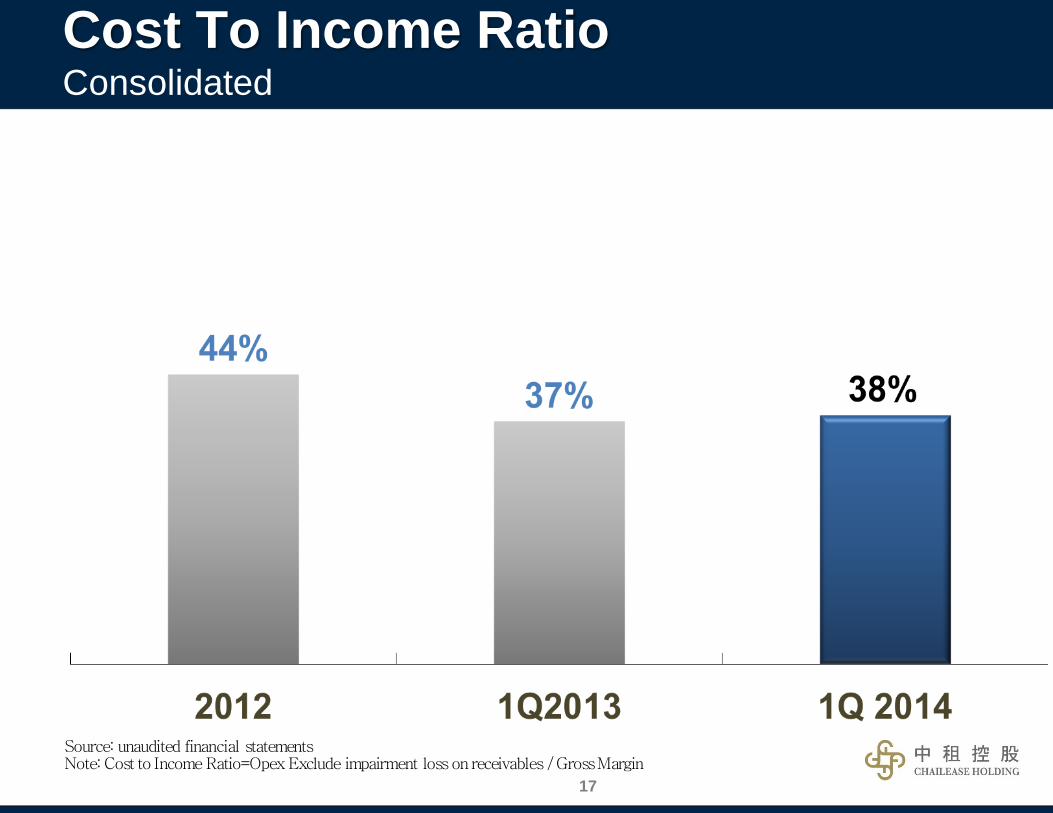
Note: Cost to Income Ratio=Opex Exclude impairment loss on receivables / Gross Margin Source: unaudited financial statements
Cost To Income Ratio Consolidated
17

ROA ROE
Source: unaudited financial statements
ROA & ROE Consolidated
18

Delinquency Allowance
Notes:
Definitions of delinquencies:
• Check payments: overdue by 7 days or more
• Equipment leasing with non-check payments: overdue by 30 days or more
• Automobile installment sales in Thailand: overdue by 90 days or more
Excludes US securitization asset
Source: unaudited financial statements
Asset Quality Consolidated
19

Agenda
Business Review
1Q2014 Performance Review
Segment Review
Q&A
Appendix
Company Overview
20

Unit: NT$ million
Source: unaudited financial statements
Total Loans & Receivables Taiwan
21

Unit: NT$ million
Source: unaudited financial statements
Revenue Taiwan
22

Unit: NT$ million
Source: unaudited financial statements
Net Profit Taiwan
23

Delinquency Allowance
Note: Definitions of delinquencies • Check payments: overdue by 7 days or more
• Equipment leasing with non-check payments: overdue by 30 days or more
Source: unaudited financial statements
Asset Quality Taiwan
24

Unit: NT$ million
Source: unaudited financial statements
Total Loans & Receivables China
25

Unit: NT$ million
Source: unaudited financial statements
Revenue China
26

Unit: NT$ million
Source: unaudited financial statements
Net Profit China
27

Delinquency Allowance
Definitions of delinquencies • Check payments: overdue by 7 days or more
• Equipment leasing with non-check payments: overdue by 30 days or more
Source: unaudited financial statements
Asset Quality China
28

Unit: NT$ million
Source: unaudited financial statements
Total Loans & Receivables Thailand
29

Unit: NT$ million
Source: unaudited financial statements
Revenue Thailand
30

Source: unaudited financial statements
Unit: NT$ million
YOY -3%
Net Profit Thailand
31

Asset Quality Thailand
Delinquency Allowance
Notes: Definitions of delinquencies: • Equipment leasing with non-check payments: overdue by 30 days or more • Automobile installment sales in Thailand: overdue by 90 days or more
Source: unaudited financial statements 32

Agenda
Business Review
1Q2014 Performance Review
Segment Review
Q&A
Appendix
Company Overview
33


Agenda
Management Highlight
1Q2014 Performance Review
Segment Review
Q&A
Appendix
Company Overview
35

36
Source: unaudited financial statements
NTD'000 2014.03.31 2013.03.31 YOY(%) 2013.12.31 QOQ(%)
Cash and cash equivalents 7,454,389 10,649,208 (30) 7,586,221 (2)
Total fund and investments 11,444,613 6,906,167 66 9,046,339 27
Notes and trade receivables 18,790 20,045 (6) 13,538 39
Loan and receivables 169,046,406 140,995,072 20 161,724,215 5
Other receivables 5,016,375 6,047,756 (17) 5,000,217 0
Property, plant and equipment 7,170,797 6,297,413 14 7,186,367 (0)
Other assets 5,030,410 4,942,072 2 5,219,053 (4)
Total assets 205,181,780 175,857,733 17 195,775,950 5
Interest bearing loans and borrowings 132,984,864 113,091,517 18 123,923,289 7
Corporate bond payable 14,074,125 12,233,796 15 14,098,319 (0)
Bank overdraft 167,753 157,145 7 84,084 100
Other liabilities 25,845,584 23,217,578 11 27,229,065 (5)
Total liabilities 173,072,325 148,700,036 16 165,334,757 5
Common stock 9,958,304 9,053,004 10 9,958,304 0
Total equity attributable to equity holders 30,155,725 25,206,106 20 28,624,443 5
Minority interests 1,953,730 1,951,591 0 1,816,750 8
Total equity 32,109,455 27,157,697 18 30,441,193 5
Consolidated Balance Sheet Summary

Source: unaudited financial statements
NTD’000 1Q2014 1Q2013 YOY(%) 4Q13 QOQ(%) Interest revenue - capital leases 1,802,786 1,787,983 1 1,775,463 2
Rent revenue - operating leases 451,367 664,879 (32) 467,651 (3)
Interest revenue - installment sales 1,553,473 1,470,666 6 1,415,964 10
Sales revenue 1,861,528 1,238,285 50 2,817,830 (34)
Other reveune 2,777,769 1,327,017 109 3,014,606 (8)
Fee Income/Service Fee 918,562 697,642 32 968,081 (5)
Other Interest Income 855,539 500,820 71 909,156 (6)
Others 1,003,668 128,556 681 1,137,368 (12)
Total revenue 8,446,924 6,488,830 30 9,491,512 (11)
Interest expense (1,015,436) (1,002,369) 1 (996,662) 2
Cost of operating leases (347,904) (498,227) (30) (403,013) (14)
Depreciation of PPE-OL (298,747) (366,334) (18) (314,752) (5)
Impairment loss of PPE-OL (49,157) (131,893) (63) (88,261) (44)
Other cost (2,353,157) (1,263,934) 86 (3,187,876) (26)
COGS (1,645,761) (1,102,242) 49 (2,528,905) (35)
Other cost (707,396) (161,692) 337 (658,971) 7
Total cost (3,716,497) (2,764,530) 34 (4,587,550) (19)
Gross profit 4,730,426 3,724,300 27 4,903,962 (4)
Operating expense (2,572,925) (1,882,861) 37 (2,877,583) (11)
Employee compensation and benefits (1,033,743) (863,855) 20 (1,006,773) 3
Impairment loss (778,172) (505,811) 54 (1,039,369) (25)
Other expense (761,010) (513,195) 48 (831,440) (8)
Other operating gain and loss 35,467 36,724 (3) 45,696 (22)
Operating profit 2,192,968 1,878,163 17 2,072,075 6
Non-operating gains/loss 15,816 156,355 (90) 220,474 (93)
Profit before income tax 2,208,785 2,034,518 9 2,292,549 (4)
Income tax expense (570,981) (569,643) 0 (606,751) (6)
Profit after income tax 1,637,803 1,464,875 12 1,685,798 (3)
Attributable to equity holders 1,561,821 1,386,267 13 1,605,816 (3)
Attributable to minority interests 75,983 78,608 (3) 79,982 (5)
EPS 1.57 1.53 3 1.61 (2)
Consolidated Income Statement Summary
37