hsbc latam smid cap conference
DESCRIPTION
HSBC LatAm SMid Cap ConferenceTRANSCRIPT

July 2014
Corporate Presentation
Executive Summary
He
avy C
on
str
uctio
n
•
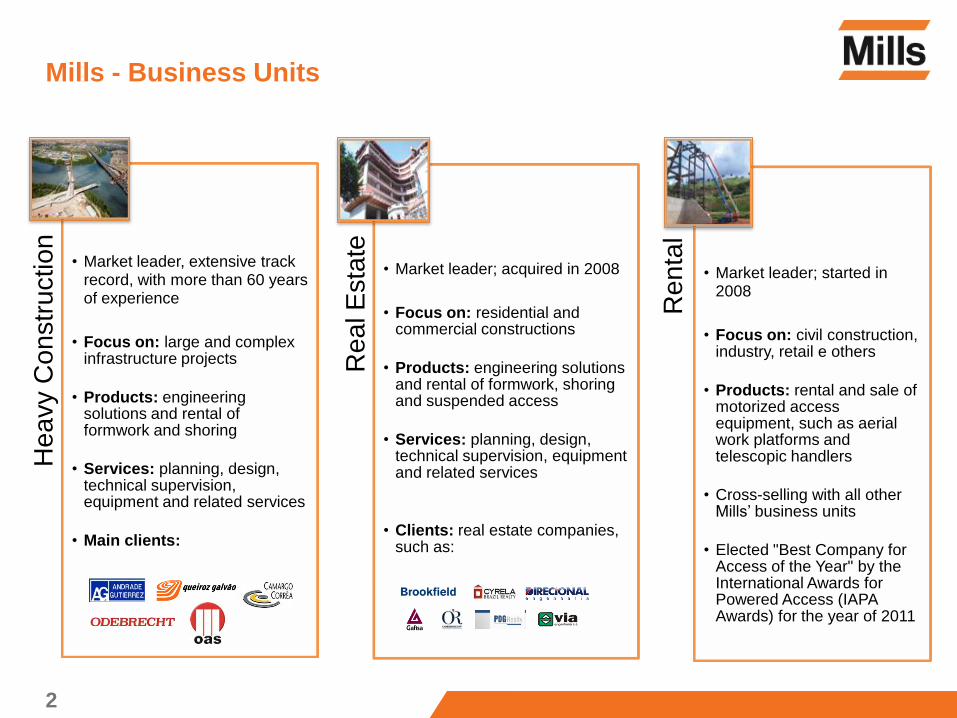
• Market leader, extensive track record, with more than 60 years of experience
• Focus on: large and complex infrastructure projects
• Products: engineering solutions and rental of formwork and shoring
• Services: planning, design, technical supervision, equipment and related services
• Main clients:
Re
al E
sta
te
•
• Market leader; acquired in 2008
• Focus on: residential and commercial constructions
• Products: engineering solutions and rental of formwork, shoring and suspended access
• Services: planning, design, technical supervision, equipment and related services
• Clients: real estate companies, such as:
Re
nta
l
• Market leader; started in 2008
• Focus on: civil construction, industry, retail e others
• Products: rental and sale of motorized access equipment, such as aerial work platforms and telescopic handlers
• Cross-selling with all other Mills’ business units
• Elected "Best Company for Access of the Year" by the International Awards for Powered Access (IAPA Awards) for the year of 2011
Mills - Business Units
2
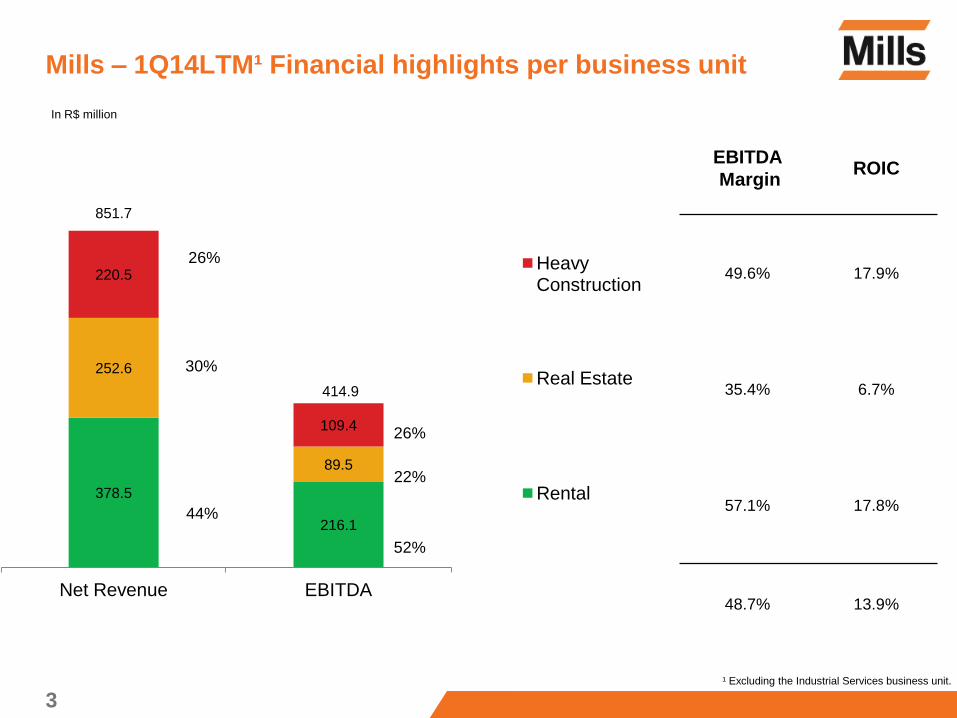
378.5
216.1
252.6
89.5
220.5
109.4
851.7
414.9
Net Revenue EBITDA
Heavy Construction
Real Estate
Rental
3
Mills – 1Q14LTM¹ Financial highlights per business unit
EBITDA
Margin ROIC
49.6% 17.9%
35.4% 6.7%
57.1% 17.8%
48.7% 13.9%
26%
22%
52%
26%
30%
44%
¹ Excluding the Industrial Services business unit.
In R$ million
4
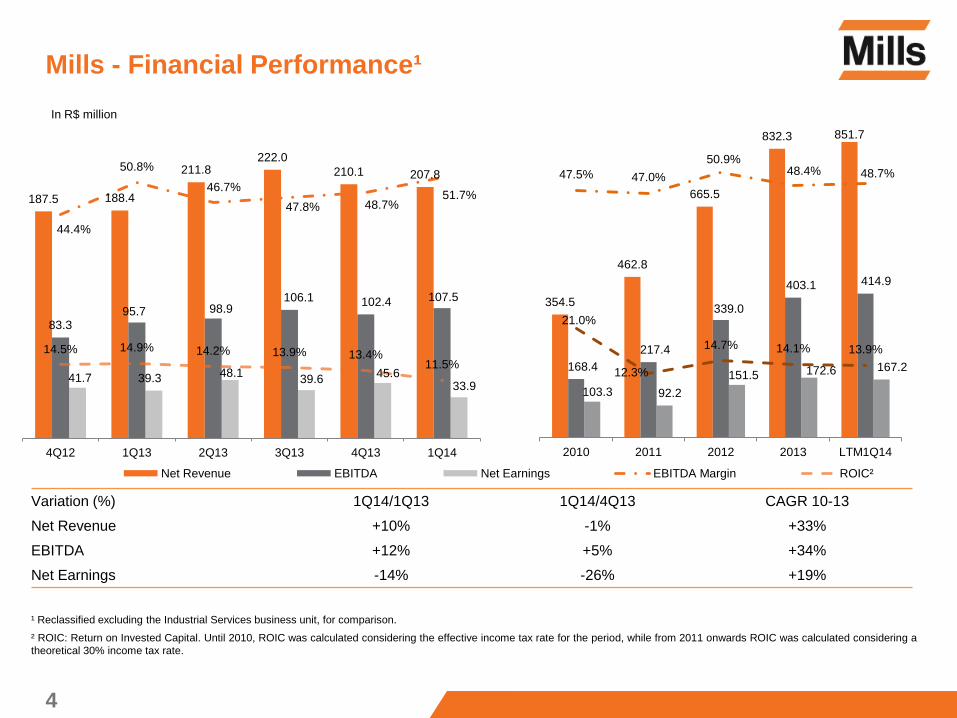
Mills - Financial Performance¹
¹ Reclassified excluding the Industrial Services business unit, for comparison.
² ROIC: Return on Invested Capital. Until 2010, ROIC was calculated considering the effective income tax rate for the period, while from 2011 onwards ROIC was calculated considering a
theoretical 30% income tax rate.
Variation (%) 1Q14/1Q13 1Q14/4Q13 CAGR 10-13
Net Revenue +10% -1% +33%
EBITDA +12% +5% +34%
Net Earnings -14% -26% +19%
In R$ million
187.5 188.4
211.8 222.0
210.1 207.8
83.3 95.7 98.9
106.1 102.4 107.5
41.7 39.3 48.1 39.6
45.6 33.9
44.4%
50.8%
46.7%
47.8% 48.7% 51.7%
14.5% 14.9% 14.2% 13.9% 13.4% 11.5%
4Q12 1Q13 2Q13 3Q13 4Q13 1Q14
Net Revenue EBITDA Net Earnings EBITDA Margin ROIC²
354.5
462.8
665.5
832.3 851.7
168.4
217.4
339.0
403.1 414.9
103.3 92.2
151.5 172.6 167.2
47.5% 47.0%
50.9% 48.4% 48.7%
21.0%
12.3%
14.7% 14.1% 13.9%
2010 2011 2012 2013 LTM1Q14
Estamos presentes em 16 estados no Brasil com 56 unidades
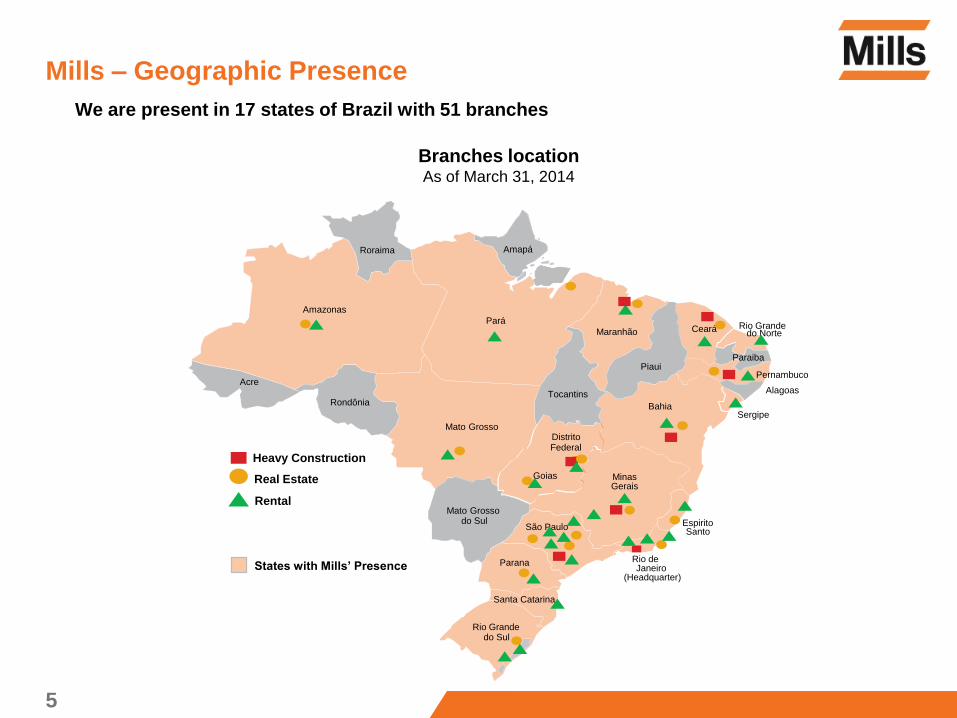
Mills – Geographic Presence
5
Branches location As of March 31, 2014
Minas Gerais
Rio Grande do Sul
Santa Catarina
São Paulo
Mato Grosso do Sul
Rio de Janeiro
(Headquarter)
Espirito Santo
Bahia
Distrito Federal
Goias
Sergipe
Paraiba
Rio Grande Ceará
Piaui
Maranhão
Tocantins
Pará
Rondônia
Acre
Roraima Amapá
Amazonas
Mato Grosso
Parana
Alagoas
States with Mills’ Presence
Rental
Heavy Construction
Real Estate
Pernambuco
do Norte
We are present in 17 states of Brazil with 51 branches
Castelão stadium – Fortaleza, CE
Rental
7
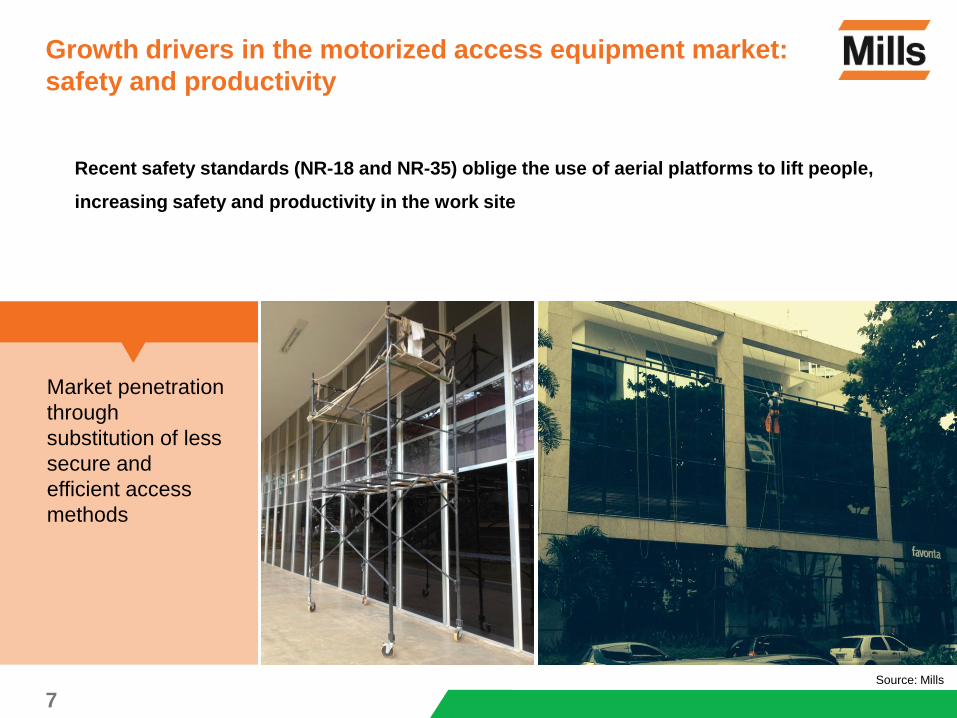
Growth drivers in the motorized access equipment market:
safety and productivity
Source: Mills
Market penetration
through
substitution of less
secure and
efficient access
methods
Recent safety standards (NR-18 and NR-35) oblige the use of aerial platforms to lift people,
increasing safety and productivity in the work site
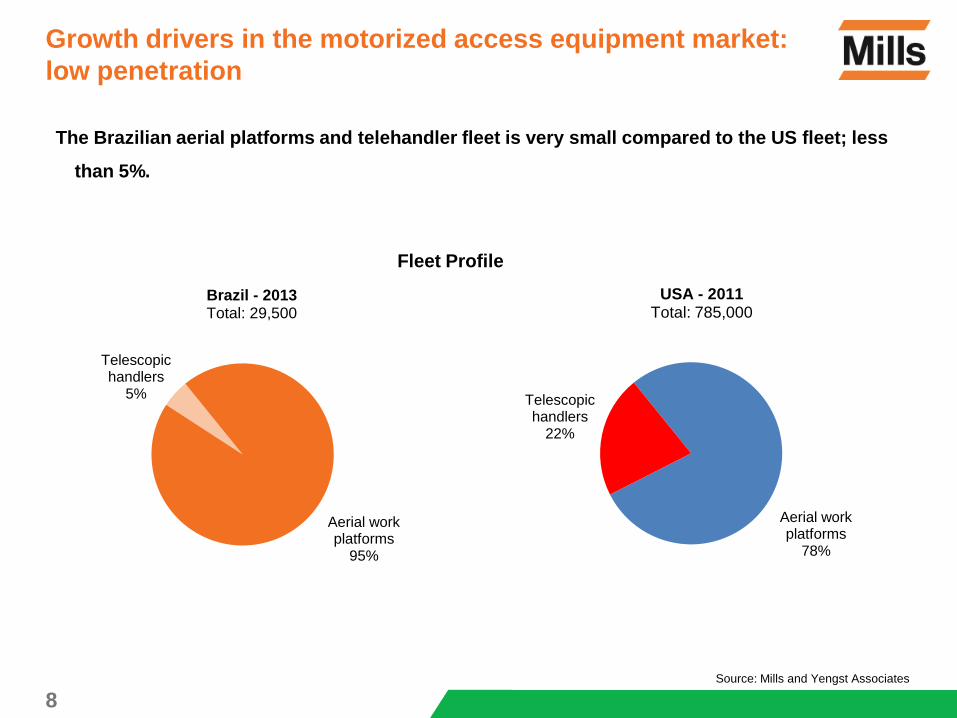
Aerial work platforms
95%
Telescopic handlers
5%
Brazil - 2013 Total: 29,500
Growth drivers in the motorized access equipment market:
low penetration
8 Source: Mills and Yengst Associates
Aerial work platforms
78%
Telescopic handlers
22%
USA - 2011
Total: 785,000
Fleet Profile
The Brazilian aerial platforms and telehandler fleet is very small compared to the US fleet; less
than 5%.
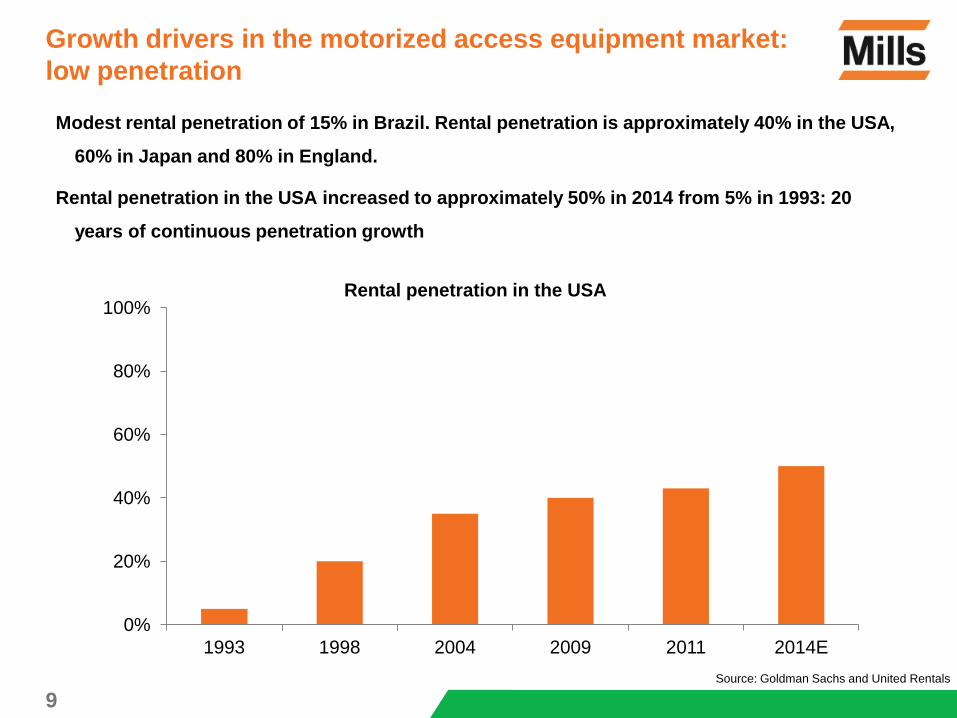
Modest rental penetration of 15% in Brazil. Rental penetration is approximately 40% in the USA,
60% in Japan and 80% in England.
Rental penetration in the USA increased to approximately 50% in 2014 from 5% in 1993: 20
years of continuous penetration growth
Growth drivers in the motorized access equipment market:
low penetration
9 Source: Goldman Sachs and United Rentals
20%
35% 40%
43%
50%
0%
20%
40%
60%
80%
100%
1993 1998 2004 2009 2011 2014E
Rental penetration in the USA
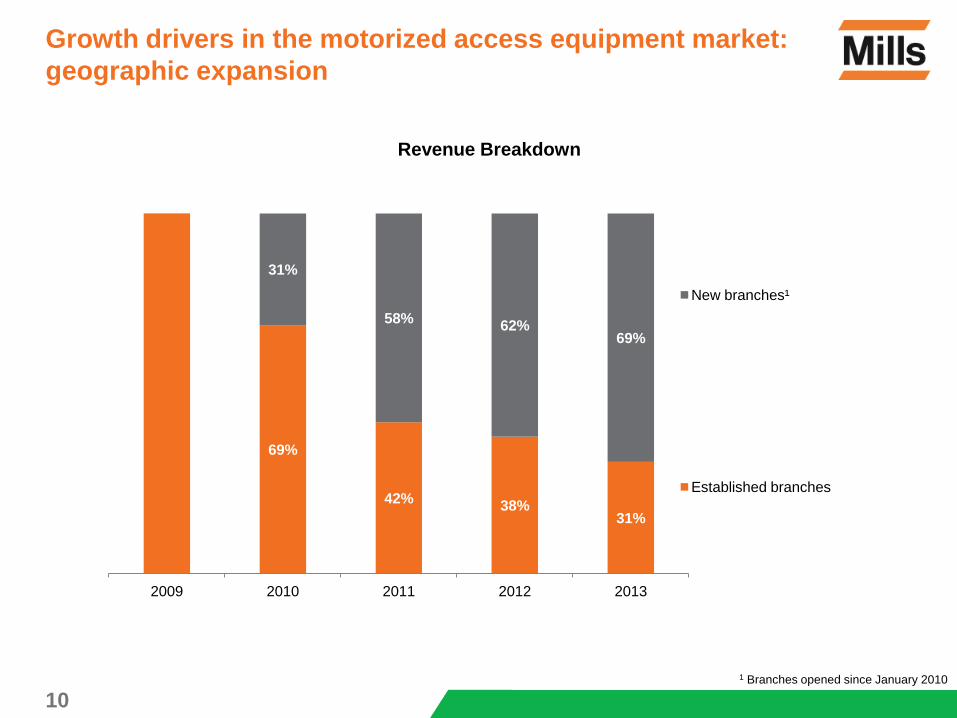
Revenue Breakdown
69%
42% 38%
31%
31%
58% 62%
69%
2009 2010 2011 2012 2013
New branches¹
Established branches
Growth drivers in the motorized access equipment market:
geographic expansion
10
1 Branches opened since January 2010
11
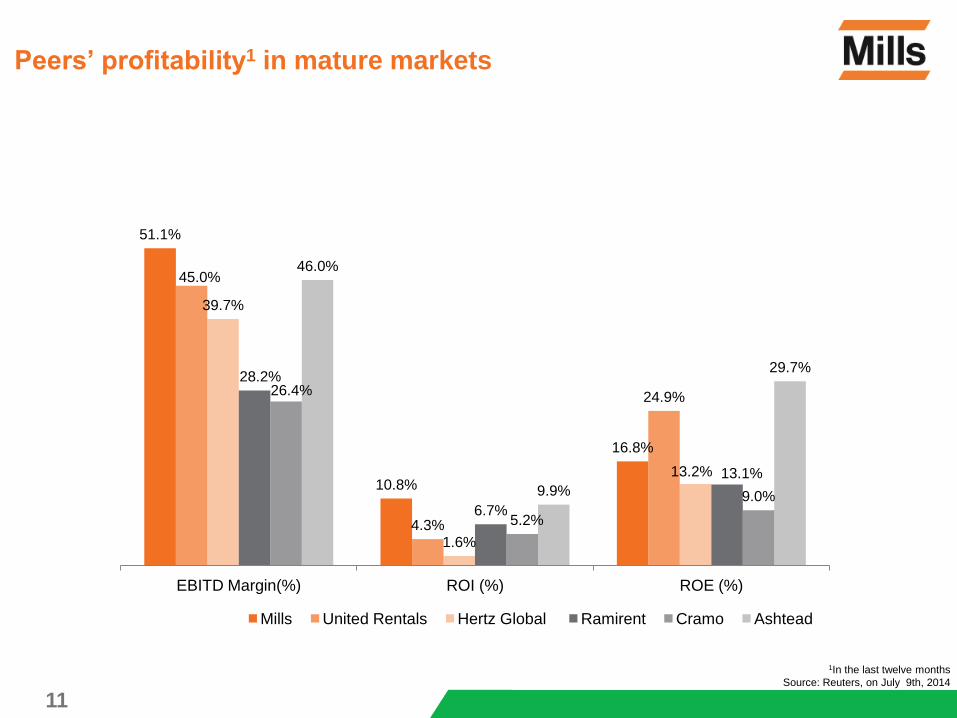
Peers’ profitability1 in mature markets
51.1%
10.8%
16.8%
45.0%
4.3%
24.9%
39.7%
1.6%
13.2%
28.2%
6.7%
13.1%
26.4%
5.2%
9.0%
46.0%
9.9%
29.7%
EBITD Margin(%) ROI (%) ROE (%)
Mills United Rentals Hertz Global Ramirent Cramo Ashtead
1In the last twelve months
Source: Reuters, on July 9th, 2014
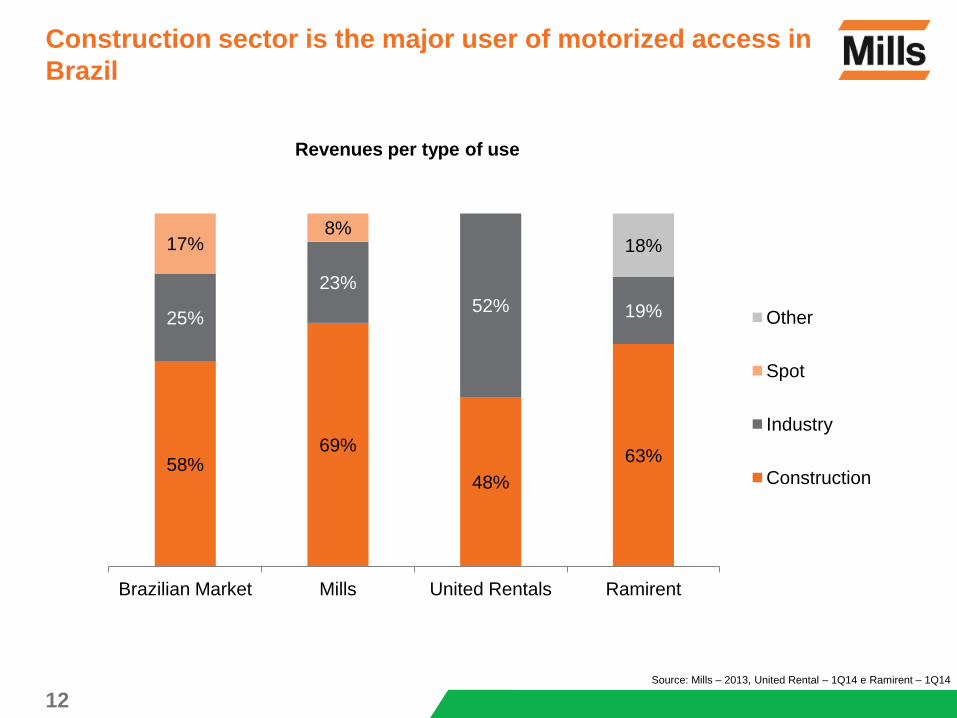
Revenues per type of use
58% 69%
48%
63%
25%
23%
52% 19%
17% 8%
18%
Brazilian Market Mills United Rentals Ramirent
Other
Spot
Industry
Construction
Construction sector is the major user of motorized access in
Brazil
12 Source: Mills – 2013, United Rental – 1Q14 e Ramirent – 1Q14
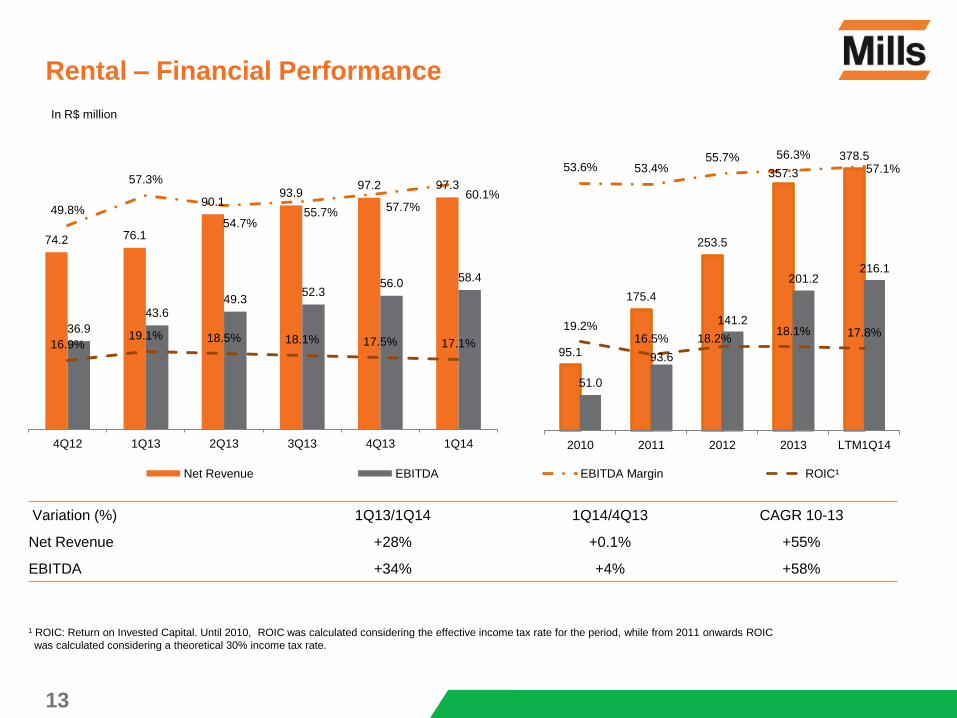
Variation (%) 1Q13/1Q14 1Q14/4Q13 CAGR 10-13
Net Revenue +28% +0.1% +55%
EBITDA +34% +4% +58%
Rental – Financial Performance
13
1 ROIC: Return on Invested Capital. Until 2010, ROIC was calculated considering the effective income tax rate for the period, while from 2011 onwards ROIC
was calculated considering a theoretical 30% income tax rate.
In R$ million
74.2 76.1
90.1 93.9
97.2 97.3
36.9
43.6 49.3
52.3 56.0
58.4
49.8%
57.3%
54.7% 55.7% 57.7%
60.1%
16.9% 19.1% 18.5% 18.1% 17.5% 17.1%
4Q12 1Q13 2Q13 3Q13 4Q13 1Q14
Net Revenue EBITDA EBITDA Margin ROIC¹
95.1
175.4
253.5
357.3
378.5
51.0
93.6
141.2
201.2 216.1
53.6% 53.4% 55.7% 56.3%
57.1%
19.2% 16.5% 18.2%
18.1% 17.8%
2010 2011 2012 2013 LTM1Q14
Heavy Construction
Cinta costeira - Panamá
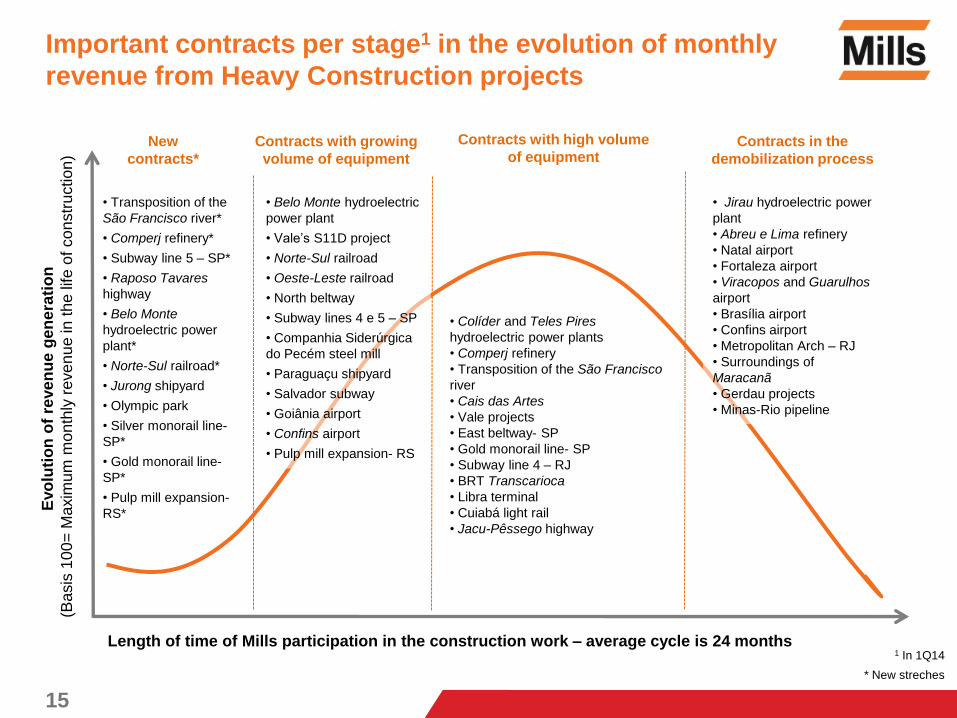
• Transposition of the
São Francisco river*
• Comperj refinery*
• Subway line 5 – SP*
• Raposo Tavares
highway
• Belo Monte
hydroelectric power
plant*
• Norte-Sul railroad*
• Jurong shipyard
• Olympic park
• Silver monorail line-
SP*
• Gold monorail line-
SP*
• Pulp mill expansion-
RS*
Evo
luti
on
of
reve
nu
e g
en
era
tio
n
(B
asis
10
0=
Ma
xim
um
mo
nth
ly r
eve
nu
e in t
he
life
of co
nstr
uctio
n)
Length of time of Mills participation in the construction work – average cycle is 24 months
• Belo Monte hydroelectric
power plant
• Vale’s S11D project
• Norte-Sul railroad
• Oeste-Leste railroad
• North beltway
• Subway lines 4 e 5 – SP
• Companhia Siderúrgica
do Pecém steel mill
• Paraguaçu shipyard
• Salvador subway
• Goiânia airport
• Confins airport
• Pulp mill expansion- RS
• Colíder and Teles Pires
hydroelectric power plants
• Comperj refinery
• Transposition of the São Francisco
river
• Cais das Artes
• Vale projects
• East beltway- SP
• Gold monorail line- SP
• Subway line 4 – RJ
• BRT Transcarioca
• Libra terminal
• Cuiabá light rail
• Jacu-Pêssego highway
• Jirau hydroelectric power
plant
• Abreu e Lima refinery
• Natal airport
• Fortaleza airport
• Viracopos and Guarulhos
airport
• Brasília airport
• Confins airport
• Metropolitan Arch – RJ
• Surroundings of
Maracanã
• Gerdau projects
• Minas-Rio pipeline
New
contracts*
Contracts with growing
volume of equipment
Contracts with high volume
of equipment Contracts in the
demobilization process
* New streches
Important contracts per stage1 in the evolution of monthly
revenue from Heavy Construction projects
15
1 In 1Q14
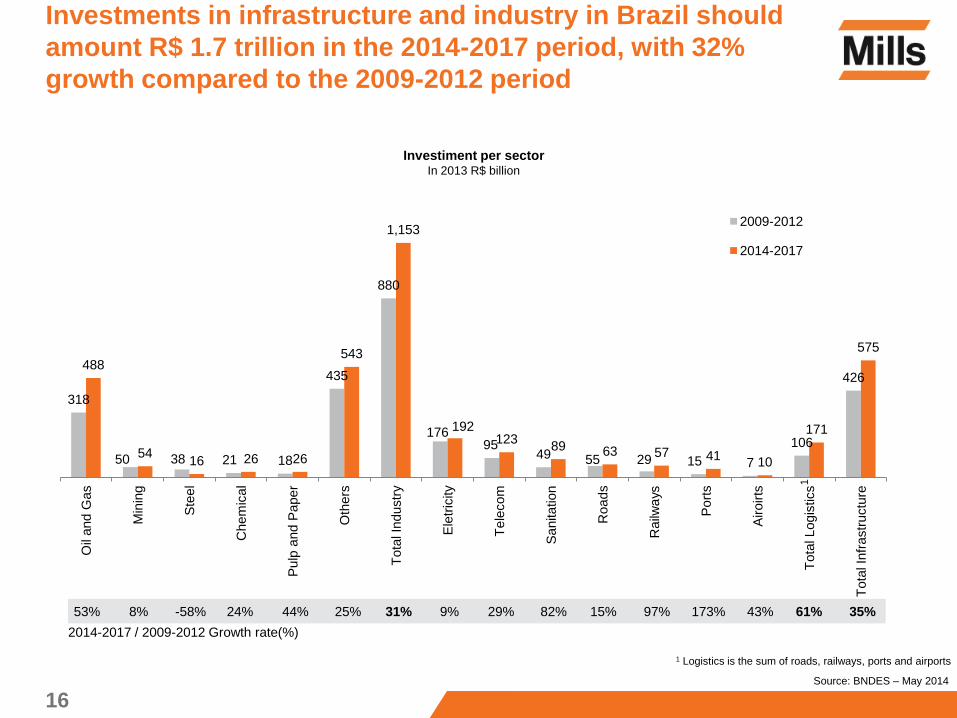
Investments in infrastructure and industry in Brazil should
amount R$ 1.7 trillion in the 2014-2017 period, with 32%
growth compared to the 2009-2012 period
16
318
50 38 21 18
435
880
176 95
49 55 29 15 7
106
426 488
54 16 26 26
543
1,153
192 123
89 63 57 41 10
171
575
Oil
and G
as
Min
ing
Ste
el
Chem
ical
Pulp
and P
aper
Oth
ers
Tota
l In
dustr
y
Ele
tric
ity
Tele
com
Sanitation
Roads
Railw
ays
Port
s
Airoirts
Tota
l Logis
tics
Tota
l In
frastr
uctu
re
2009-2012
2014-2017
Investiment per sector In 2013 R$ billion
2014-2017 / 2009-2012 Growth rate(%)
53% 8% -58% 24% 44% 25% 31% 9% 29% 82% 15% 97% 173% 43% 61% 35%
Source: BNDES – May 2014
1
1 Logistics is the sum of roads, railways, ports and airports
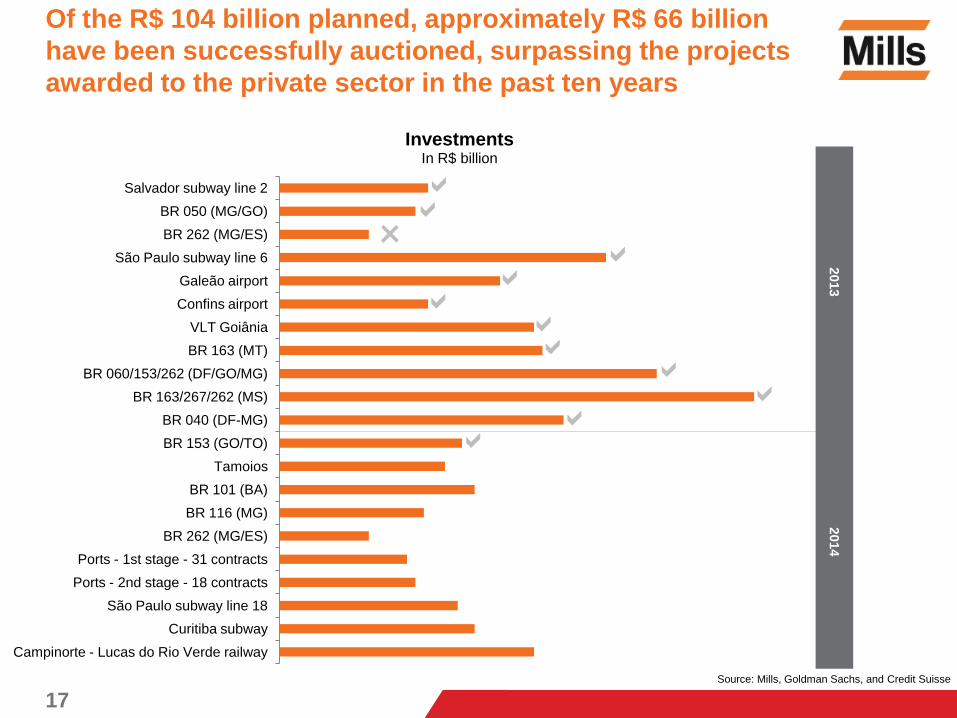
Of the R$ 104 billion planned, approximately R$ 66 billion
have been successfully auctioned, surpassing the projects
awarded to the private sector in the past ten years
17
Campinorte - Lucas do Rio Verde railway
Curitiba subway
São Paulo subway line 18
Ports - 2nd stage - 18 contracts
Ports - 1st stage - 31 contracts
BR 262 (MG/ES)
BR 116 (MG)
BR 101 (BA)
Tamoios
BR 153 (GO/TO)
BR 040 (DF-MG)
BR 163/267/262 (MS)
BR 060/153/262 (DF/GO/MG)
BR 163 (MT)
VLT Goiânia
Confins airport
Galeão airport
São Paulo subway line 6
BR 262 (MG/ES)
BR 050 (MG/GO)
Salvador subway line 2
Investments In R$ billion
2013
×
2014
Source: Mills, Goldman Sachs, and Credit Suisse
Source: Valor newspaper, June 24,2014, using data from BNDES, ministries and public agencies. Do not
include railways that are part of the Programa de Investimentos em Logística (Logistic Investment Program).
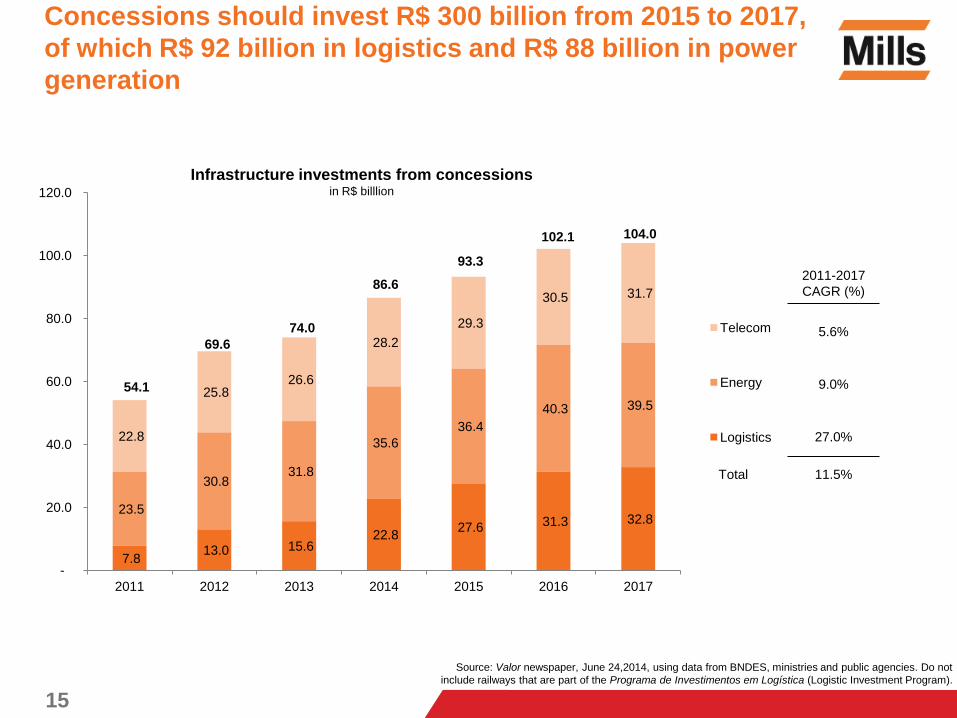
Concessions should invest R$ 300 billion from 2015 to 2017,
of which R$ 92 billion in logistics and R$ 88 billion in power
generation
15
2011-2017
CAGR (%)
Total
27.0%
9.0%
5.6%
11.5%
7.8 13.0 15.6
22.8 27.6 31.3 32.8
23.5
30.8 31.8
35.6
36.4
40.3 39.5
22.8
25.8 26.6
28.2
29.3
30.5 31.7
54.1
69.6
74.0
86.6
93.3
102.1 104.0
-
20.0
40.0
60.0
80.0
100.0
120.0
2011 2012 2013 2014 2015 2016 2017
Telecom
Energy
Logistics
Infrastructure investments from concessions in R$ billlion
In R$ million
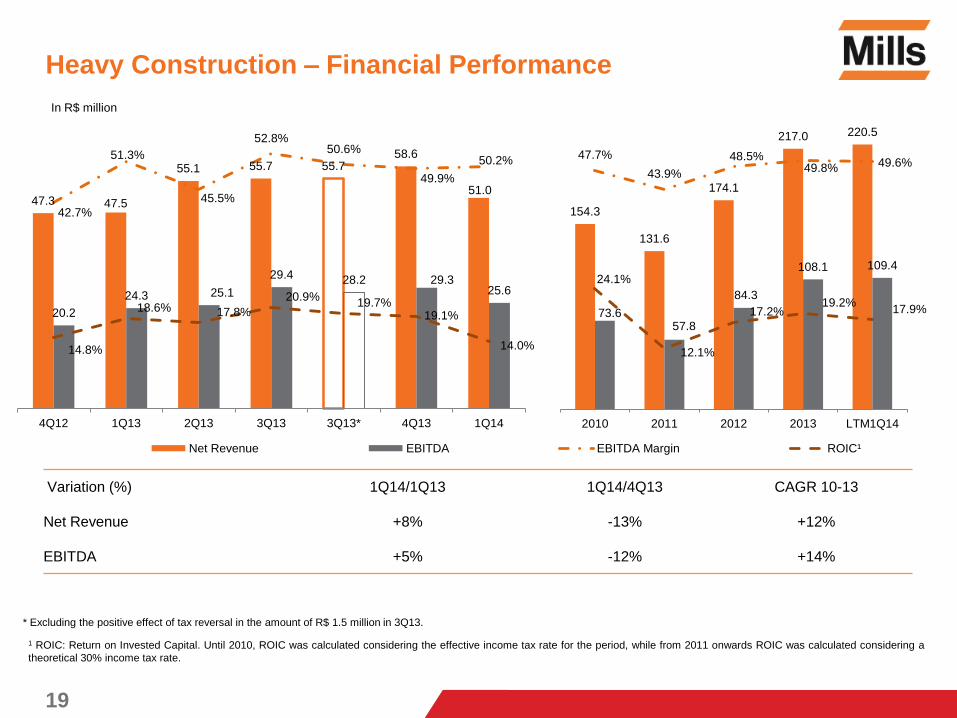
Variation (%) 1Q14/1Q13 1Q14/4Q13 CAGR 10-13
Net Revenue +8% -13% +12%
EBITDA +5% -12% +14%
Heavy Construction – Financial Performance
19
* Excluding the positive effect of tax reversal in the amount of R$ 1.5 million in 3Q13.
1 ROIC: Return on Invested Capital. Until 2010, ROIC was calculated considering the effective income tax rate for the period, while from 2011 onwards ROIC was calculated considering a
theoretical 30% income tax rate.
47.3 47.5
55.1 55.7 55.7 58.6
51.0
20.2
24.3 25.1
29.4 28.2 29.3 25.6
42.7%
51.3%
45.5%
52.8% 50.6%
49.9%
50.2%
14.8%
18.6% 17.8%
20.9% 19.7%
19.1%
14.0%
4Q12 1Q13 2Q13 3Q13 3Q13* 4Q13 1Q14
Net Revenue EBITDA EBITDA Margin ROIC¹
154.3
131.6
174.1
217.0 220.5
73.6 57.8
84.3
108.1 109.4
47.7%
43.9%
48.5% 49.8% 49.6%
24.1%
12.1%
17.2% 19.2%
17.9%
2010 2011 2012 2013 LTM1Q14
Real Estate
Mast climbing platform
21
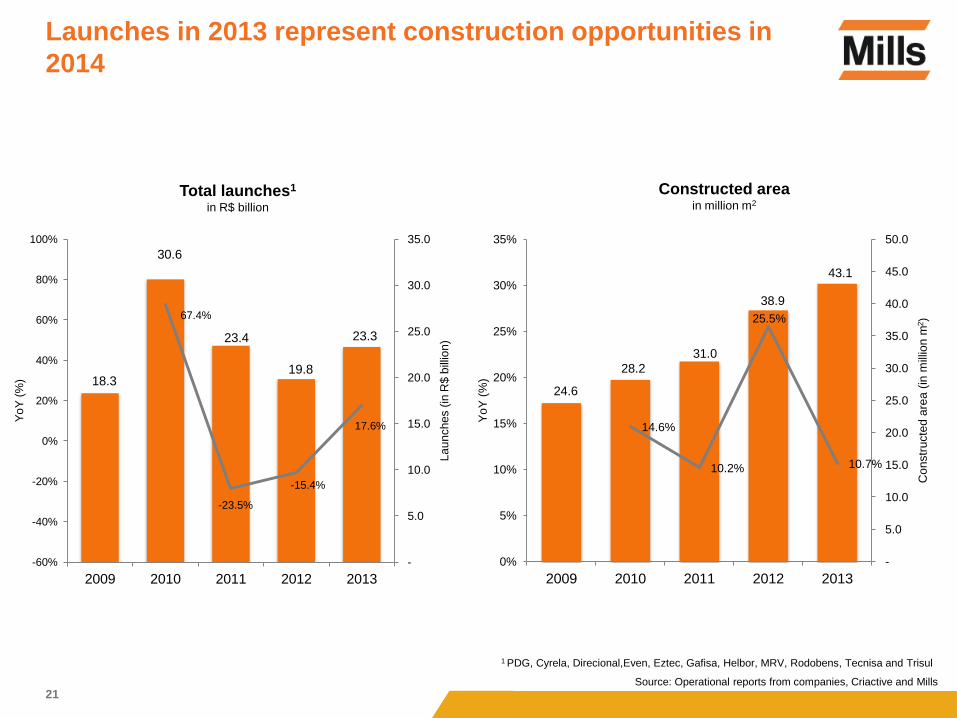
18.3
30.6
23.4
19.8
23.3
67.4%
-23.5%
-15.4%
17.6%
-60%
-40%
-20%
0%
20%
40%
60%
80%
100%
-
5.0
10.0
15.0
20.0
25.0
30.0
35.0
2009 2010 2011 2012 2013
Yo
Y (
%)
La
un
ches (
in R
$ b
illio
n)
1 PDG, Cyrela, Direcional,Even, Eztec, Gafisa, Helbor, MRV, Rodobens, Tecnisa and Trisul
Source: Operational reports from companies, Criactive and Mills
Total launches1
in R$ billion
24.6
28.2
31.0
38.9
43.1
14.6%
10.2%
25.5%
10.7%
0%
5%
10%
15%
20%
25%
30%
35%
-
5.0
10.0
15.0
20.0
25.0
30.0
35.0
40.0
45.0
50.0
2009 2010 2011 2012 2013
Yo
Y (
%)
Co
nstr
ucte
d a
rea
(in
mill
ion
m2)
Constructed area
in million m2
Launches in 2013 represent construction opportunities in
2014
22
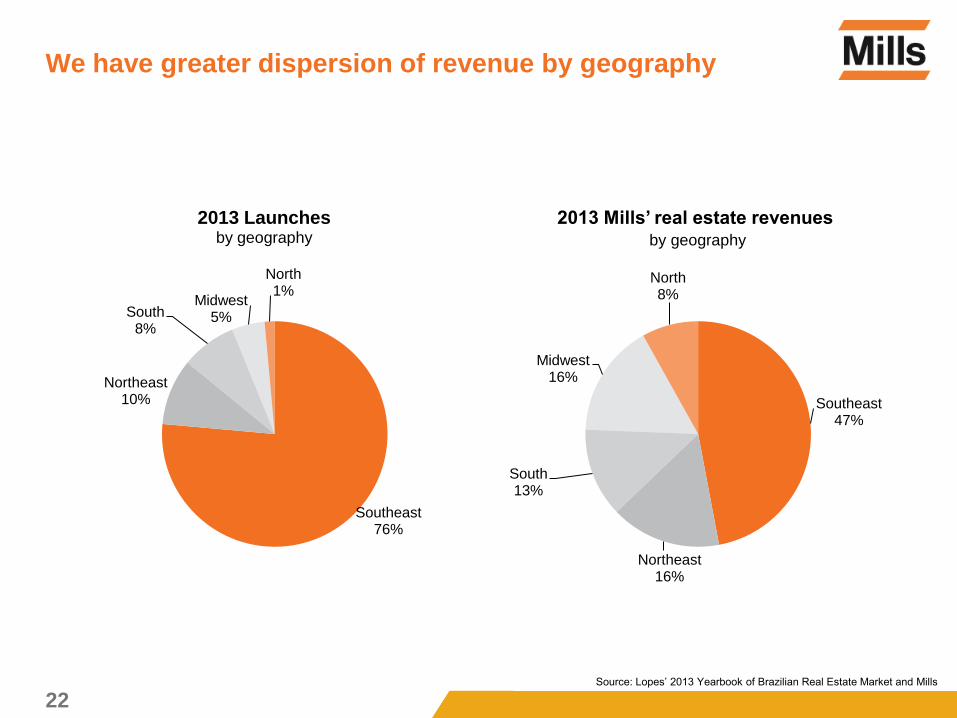
Southeast 76%
Northeast 10%
South 8%
Midwest 5%
North 1%
2013 Launches by geography
Southeast 47%
Northeast 16%
South 13%
Midwest 16%
North 8%
2013 Mills’ real estate revenues by geography
Source: Lopes’ 2013 Yearbook of Brazilian Real Estate Market and Mills
We have greater dispersion of revenue by geography
23
Growth drivers of the residential market
High housing deficit
Growing housing financing
Higher purchasing power
Lack of labor and higher labor cost
Industrialization of the construction process
Geographic expansion
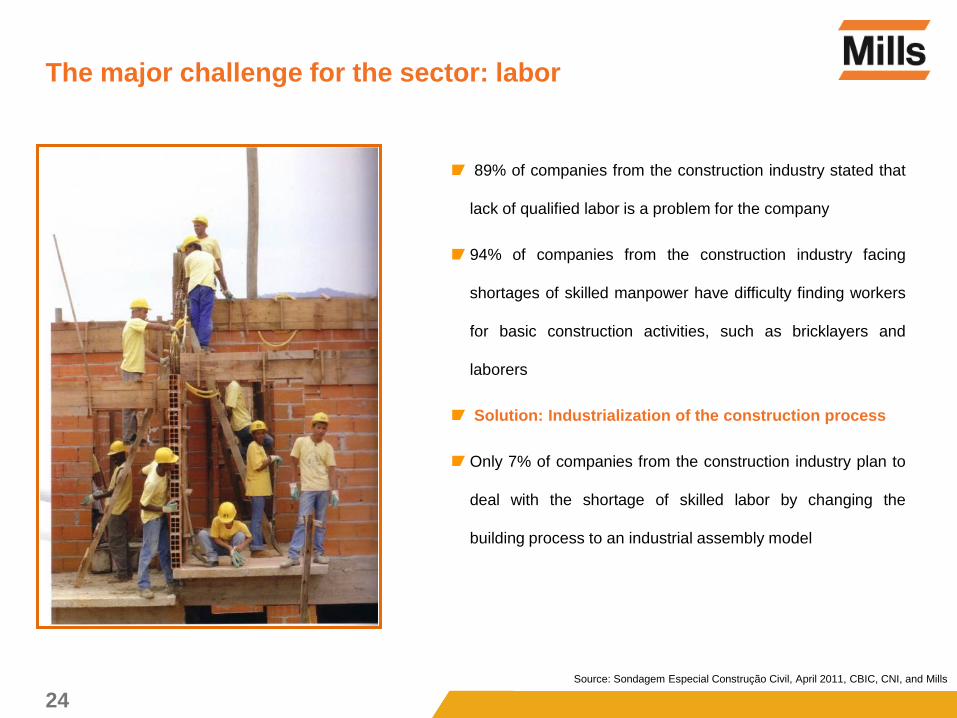
The major challenge for the sector: labor
24 Source: Sondagem Especial Construção Civil, April 2011, CBIC, CNI, and Mills
89% of companies from the construction industry stated that
lack of qualified labor is a problem for the company
94% of companies from the construction industry facing
shortages of skilled manpower have difficulty finding workers
for basic construction activities, such as bricklayers and
laborers
Solution: Industrialization of the construction process
Only 7% of companies from the construction industry plan to
deal with the shortage of skilled labor by changing the
building process to an industrial assembly model
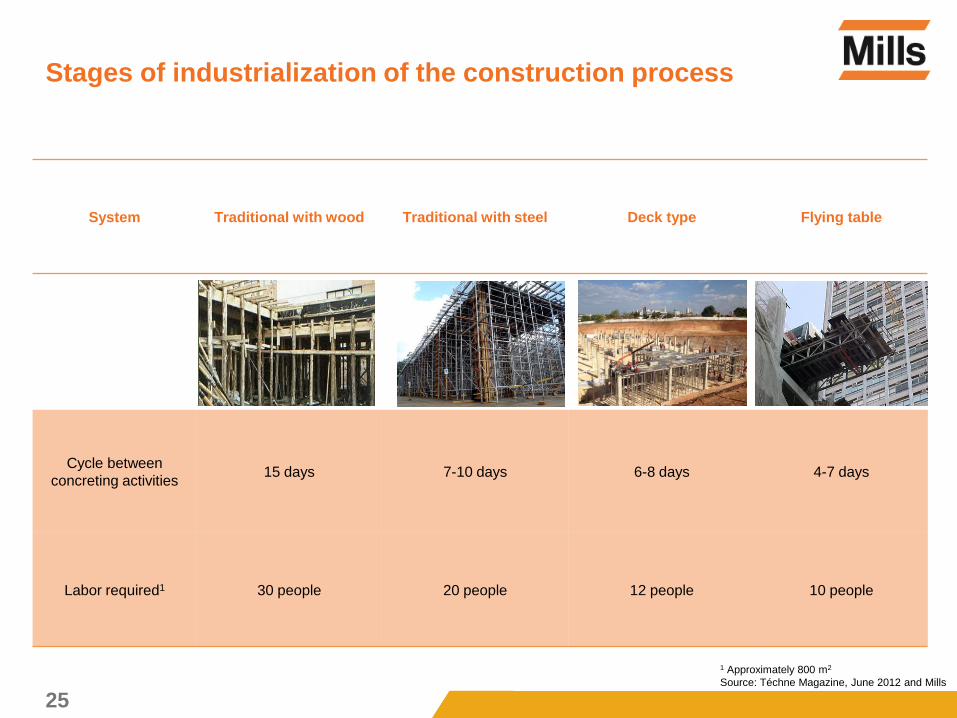
Stages of industrialization of the construction process
25
1 Approximately 800 m2
Source: Téchne Magazine, June 2012 and Mills
System Traditional with wood Traditional with steel Deck type Flying table
Cycle between
concreting activities 15 days 7-10 days 6-8 days 4-7 days
Labor required1 30 people 20 people 12 people 10 people
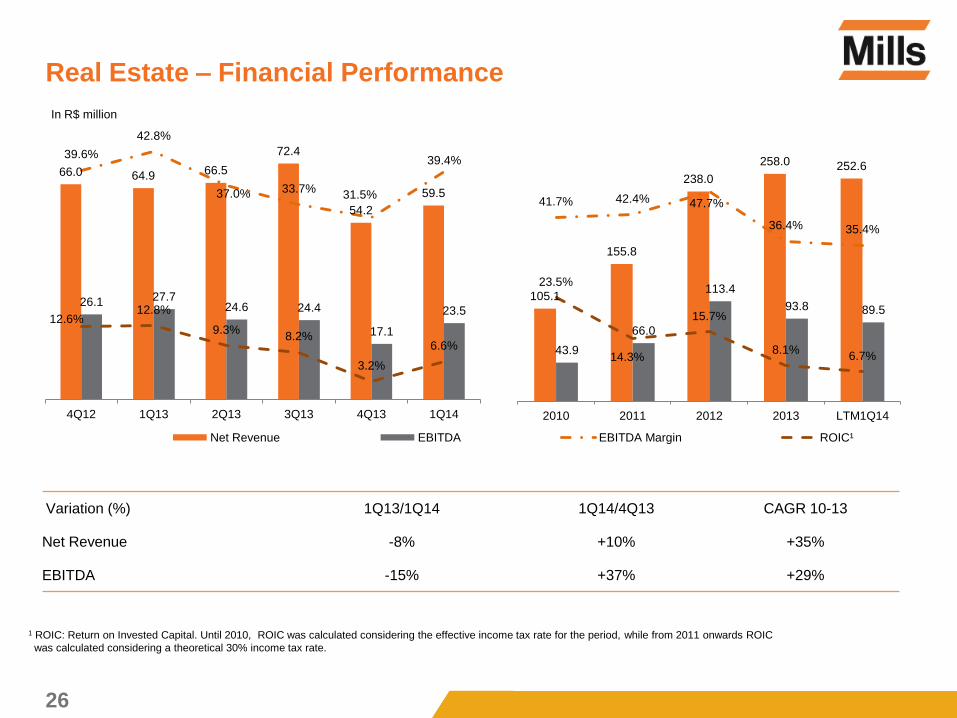
Variation (%) 1Q13/1Q14 1Q14/4Q13 CAGR 10-13
Net Revenue -8% +10% +35%
EBITDA -15% +37% +29%
Real Estate – Financial Performance
26
1 ROIC: Return on Invested Capital. Until 2010, ROIC was calculated considering the effective income tax rate for the period, while from 2011 onwards ROIC
was calculated considering a theoretical 30% income tax rate.
In R$ million
66.0 64.9 66.5
72.4
54.2
59.5
26.1 27.7 24.6 24.4
17.1
23.5
39.6%
42.8%
37.0% 33.7% 31.5%
39.4%
12.6% 12.8%
9.3% 8.2%
3.2%
6.6%
4Q12 1Q13 2Q13 3Q13 4Q13 1Q14
Net Revenue EBITDA EBITDA Margin ROIC¹
105.1
155.8
238.0
258.0 252.6
43.9
66.0
113.4
93.8 89.5
41.7% 42.4% 47.7%
36.4% 35.4%
23.5%
14.3%
15.7%
8.1% 6.7%
2010 2011 2012 2013 LTM1Q14

Growth Plan
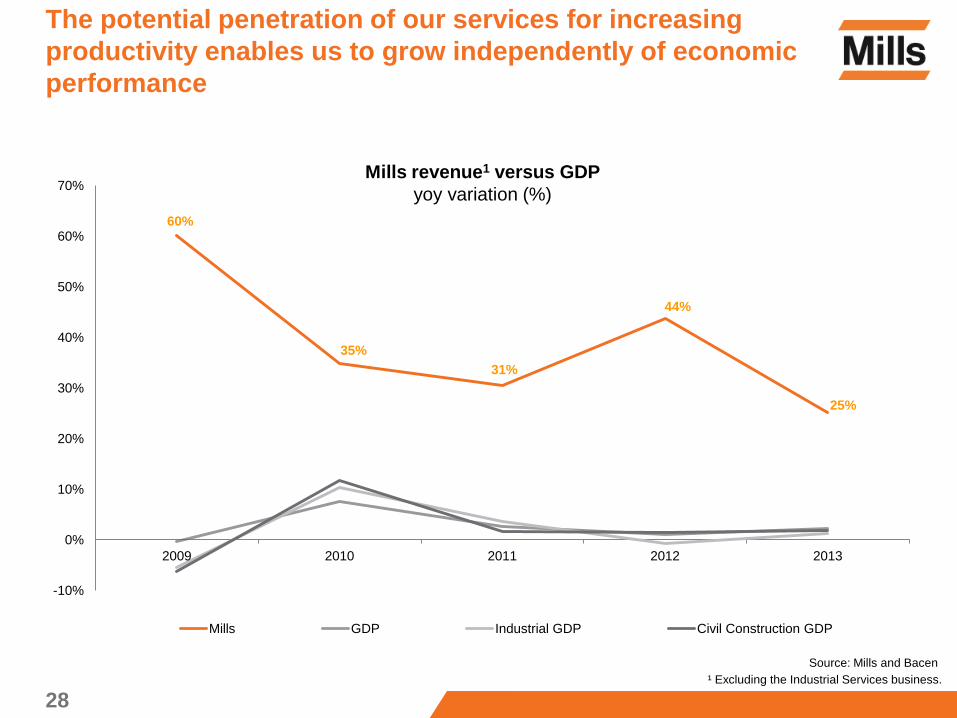
The potential penetration of our services for increasing
productivity enables us to grow independently of economic
performance
60%
35%
31%
44%
25%
-10%
0%
10%
20%
30%
40%
50%
60%
70%
2009 2010 2011 2012 2013
Mills GDP Industrial GDP Civil Construction GDP
Source: Mills and Bacen
Mills revenue1 versus GDP
yoy variation (%)
28 ¹ Excluding the Industrial Services business.
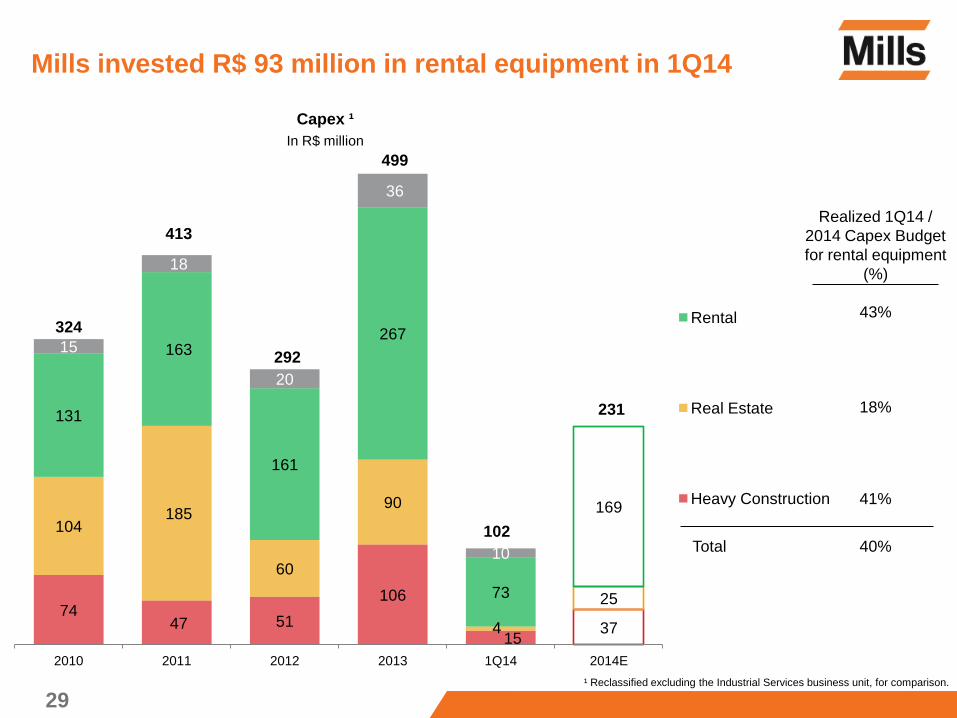
74 47 51
106
15 37
104 185
60
90
4
25
131
163
161
267
73
169
15
18
20
36
10
324
413
292
499
102
231
2010 2011 2012 2013 1Q14 2014E
Rental
Real Estate
Heavy Construction
In R$ million
Capex ¹
Realized 1Q14 /
2014 Capex Budget
for rental equipment
(%)
41%
18%
43%
Mills invested R$ 93 million in rental equipment in 1Q14
29 ¹ Reclassified excluding the Industrial Services business unit, for comparison.
Total 40%
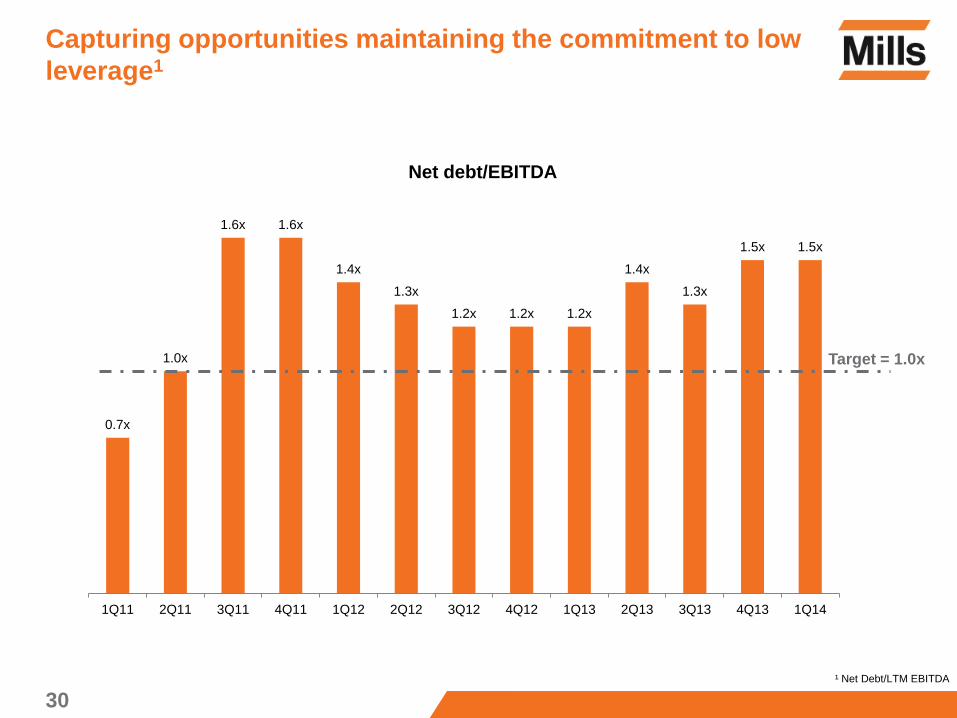
Capturing opportunities maintaining the commitment to low
leverage1
30
Net debt/EBITDA
¹ Net Debt/LTM EBITDA
0.7x
1.0x
1.6x 1.6x
1.4x
1.3x
1.2x 1.2x 1.2x
1.4x
1.3x
1.5x 1.5x
1Q11 2Q11 3Q11 4Q11 1Q12 2Q12 3Q12 4Q12 1Q13 2Q13 3Q13 4Q13 1Q14
Target = 1.0x