hsbc multi-asset style factors · hsbc multi-asset style factors aims to provide long term total...
TRANSCRIPT

HSBC Multi-Asset Style Factors Getting to the roots of diversification
Non-contractual document. This publication is intended for Professional Clients only. Retail Clients should not rely upon its content and may want to consider seeking professional advice before purchase. The information contained in this publication is not intended as investment advice or recommendation.
Non contractual document2
Content
3Executive summary
4Challenges faced by clients
8Style factor investing
12HSBC Multi-Asset Style Factors strategy
28HSBC Multi-Asset Style Factors aims to provide diversification
44Interviews
50Our Multi-Asset capabilities
61Glossary

3Non contractual document
Executive summary
HSBC Multi-Asset Style Factors aims to provide long term total returns with a low correlation to traditional asset classes and a volatility between 6% and 8%*.
The strategy aims to capture different risk premia than those usually captured by traditional balanced strategies. In practice, the strategy is exposed to 3 style factors: carry, momentum and value; each invested across equity, bond and currency markets.
The selected factors have to be widely recognised by academic research, persistent over time and across asset classes, weakly correlated to traditional assets and investable using liquid instruments only.
The 3 style factors are invested in their “purest” form by taking long and short positions, hence the strategy has no structural exposure to any asset class.
The investment process is systematic and transparent: the style portfolios are built using simple and intuitive metrics and are then combined to maximise diversification across styles and asset classes.
The strategy is implemented using highly liquid derivatives only: index futures, interest rate swaps, currency forwards. This makes the portfolio easy to look through in a Solvency II context.
*The above mentioned target/limits/objectives are to be considered on the recommended minimum investment period and do not constitute a commitment from HSBC Global Asset Management; there can be no assurance that the strategy will achieve this objective. Source: HSBC Global Asset Management as December 2017.

Non contractual document4
Challenges faced by clients
Clients are primarily interested in solutions that solve their most pressing problems so any new product launch needs to understand and to address as many of these issues as possible. So what are the most common problems across the different investor types today?
Lack of income from traditional sources. As is self-evident, central banks have reduced interest rates to historically low or even negative levels. Therefore, as neither bank deposits nor bonds meet investor needs and the policy is unlikely to be changed soon (except in the US), investors will continue to look for new sources of income.
Changes in 2-year and 5-year yields
Current* 1 year ago 2 years ago 5 years ago
2Y yield US 0.683 0.732 0.462 0.255
2Y yield German -0.594 -0.249 0.025 0.765
2Y yield UK 0.195 0.574 0.790 0.551
2Y yield Japanese -0.172 0.005 0.071 0.014
5Y yield US 1.081 1.604 1.648 1.250
5Y yield German -0.479 0.029 0.296 1.448
5Y yield UK 0.359 1.422 1.968 1.423
5Y yield Japanese -0.168 0.080 0.153 0.338
Source: HSBC Global Asset Management. * Data as of 3 August 2016. For illustrative purposes only. Any forecast, projection or target where provided is indicative only and is not guaranteed in any way. HSBC Global Asset Management accepts no liability for any failure to meet such forecast, projection or target.

5Non contractual document
Traditional valuation techniques of asset classes have been challenged by this low interest environment and the other components of monetary policy, such as Quantitative Easing. For example, government bonds have appeared expensive for many years, when compared to their own history or to other asset classes, but they have consistently performed strongly over the same period.
Asset class returns2008 2009 2010 2011 2012 2013 2014 201514%
9%
3%
-5%
-5%
-10%
-27%
-40%
-48%
-53%
79%
61%
38%
31%
27%
22%
16%
1%
1%
-4%
20%
19%
16%
15%
12%
12%
7%
6%
3%
0%
10%
8%
5%
5%
3%
0%
-2%
-5%
-6%
-18%
29%
19%
19%
18%
17%
17%
11%
5%
2%
0%
27%
7%
4%
0%
0%
0%
-2%
-3%
-6%
-9%
16%
8%
8%
7%
6%
6%
3%
0%
-2%
-6%
1%
1%
1%
0%
0%
0%
0%
-2%
-15%
-15%
Global Government Bonds
US Government Bonds
Hard Currency EMD
Cash
Property
Global Investment Grade Credit
Developed Market Equities
Global High Yield Credit
Emerging Market Equities
Local Currency EMD
Bes
tpe
rfor
min
gas
set c
lass
in y
ear %
Wor
stpe
rfor
min
gas
set c
lass
in y
ear %
3-mth USD LIBOR (Cash), BofA Merrill Lynch Global Corporate Index Hedged USD (Global Investment Grade Credit), MSCI World USD (Developed Market Equities), MSCI EM USD (Emerging Market Equities), Citigroup WGBI All Mat Hedged USD (Global Government Bonds), Bloomberg/EFFAS US Government All>1 Year (US Government Bonds), FTSE EPRA NAREIT Dev USD (Property), BofA Merrill Lynch Global High Yield Index Hedged USD (Global High Yield Credit), BofA Merrill Lynch US Dollar Emerging Markets Sovereign Plus Index Hedged USD (Hard Currency EMD), JPM GBI-EM Global Diversified Composite USD (Local Currency EMD).Source: HSBC Global Asset Management. Data as of 31/12/2015. For illustrative purposes only. The performance figures displayed in the document relate to the past and past performance should not be seen as an indication of future returns.

Non contractual document6
Increased and unpredictable correlation of traditional asset classes, which is partly connected to the previous valuation point. A recent example was the Brexit news.
Current risk premia mean lower future returns from traditional asset classes. Government bond yields have been driven to historically tight levels by falling inflation and monetary policy. This has resulted in other risk premia falling as well, at levels lower than many investors have enjoyed over the last few years.
Liquidity remains a concern for all investors. Although memories of 2008 are fading, the more recent periods of volatility in 2011 and 2013 serve as reminder of this key consideration.
Financial markets are home to many different investors so how are the different investors impacted by these problems?
Income is a major issue for most investors but especially retail and DC pension plans, who rely on this for ‘day to day’ living needs, as well as charities and mature DB plans, who need it to cover cash flow requirements.
The commentary and analysis presented in this document reflect the opinion of HSBC Global Asset Management on the markets, according to the information available to date. They do not constitute any kind of commitment from HSBC Global Asset Management. Consequently, HSBC Global Asset Management will not be held responsible for any investment or disinvestment decision taken on the basis of the commentary and/or analysis in this document. DC: Defined contribution - DB: Defined benefit.
7Non contractual document
Traditional valuation techniques challenges affect all investors, especially asset allocation providers. However, retail investors tend to outsource this decision so this is not a concern.
Correlation and the related issue of volatility is a focus for all investors, as a broadly diversified portfolio that smoothes out periods of volatility is a key portfolio characteristic.
Investors are looking to diversify away from traditional investments, to include new techniques such as factor investing. This approach combines the avoidance of conventional markets, while meeting return expectations.
While liquidity is crucial for many investors (retail, DC plans and unit linked insurance products), those with longer liability streams (DB plans and sovereign wealth funds) are happy to take some illiquidity to earn the extra premium.
The HSBC MASF strategy can form part of a portfolio for all investors as it seeks to avoid most of the problems.
The commentary and analysis presented in this document reflect the opinion of HSBC Global Asset Management on the markets, according to the information available to date. They do not constitute any kind of commitment from HSBC Global Asset Management. Consequently, HSBC Global Asset Management will not be held responsible for any investment or disinvestment decision taken on the basis of the commentary and/or analysis in this document.

Non contractual document8
Style factor investing
When it comes to portfolio construction, asset allocation does not really matter, what really matters is the exposure to a limited number of common sources of risk: the so-called “factors”.
There are 2 types of factors:
- First, the most well-known, the Macro factors, explain the absolute returns of the asset classes i.e. the performance of equities as an asset class, of bonds, etc… Macro factors are fundamental sources of risk which are related to the global economic environment. Growth, which is the risk of an economic slowdown, is a macro factor that explains the returns of equities and credit. Real rates and inflation are other macro factors that tend to explain the returns of bonds and commodities. In terms of implementation, macro factors can be invested by taking long exposures to the traditional asset classes.
- The second type of factors are the Style factors. Unlike macro factors, they explain the assets relative returns, in excess of the return of the asset class. Style factors will explain why US equities outperformed UK equities for instance, why Australian bonds underperformed German bonds, etc… Since style factors explain relative returns, they are implemented by taking long and short positions.
Introduction to factors: Macro vs Style

9Non contractual document
Ab
solu
te R
etu
rn -
Dir
ecti
on
al e
xpo
sure
Rel
ativ
e R
etu
rn (
Lon
g /
Sh
ort
exp
osu
re)
R
eal Rates
Growth Momentum
Carry
Value
Infla
tion
Defensive
Mexican vs Korean Equ
ity /
US Inflation Lkd Bon
d
/
Eu
ro Equity
US
Equity
US vs Japan Equity
/
Gl
obal High yield Bond -
BR
L vs RU
B
JapanEquity
US Corp
Bond
Liquidity
Euro
Austr
alian vs US Gov Bond
/
US Energy
vs
US Materials
Eur Corp
Bond
Source: HSBC Global Asset Management. December 2017. For illustrative purposes only.

Non contractual document10
A style factor is any characteristic commonly shared by a group of assets which consistently explains the return relative to that asset class (cross section return).
Style factors can be implemented in their “purest” form through a portfolio of traditional assets whose allocation/portfolio construction is:
- Long and short, to ensure low correlation to the market and target a “pure” style premium.
- Dynamic and systematic, based on a simple and transparent metric.
Style factor analysis is well-known at the individual stock level. For example, the Value factor introduced by Fama-French* is a portfolio that:
- Goes long the cheapest stocks and short the most expensive ones, based on the Book-to-Market ratio.
- Has low market exposure (cash neutral).
Interestingly, some factors can be invested in a Multi-Asset portfolio, resulting in improved diversification.
What are style factors?
* In asset pricing and portfolio management the Fama–French three-factor model is a model designed by Eugene Fama and Kenneth French to describe stock returns. The three factors are 1. company Size, 2. company Price-to-Book Ratio, and 3. Market Risk.

11Non contractual document
Allocation 3.0 Asset allocation has gone through different stages in its evolution:
ALLOCATION
2.0 Allocation to specific segments of the traditional assets
(high yield, emerging markets) or alternative assets (e.g. private equity, real estate).
“Diversifying” asset classes are usually strongly correlated with the equity risk (rising correlation during crises).
Liquidity risk.
CO
RE S
AT
ELL
ITE
AP
PR
OA
CH
Alpha - « Alternative » risk premia - Bond Risk premium - Equity Risk
premium - Credit Risk premium
Strategic allocation of traditional asset classes (equities, government bonds, corporate bonds) to capture market risk premia.
Does not perform in all environments (rising inflation, heightened sovereign risk) and is dominated by equity risk.
Alpha is often the result of systematic exposure to non-traditional market risk factors.
TR
AD
ITIO
NA
L B
ALA
NC
ED
AS
SE
T A
LLO
CA
TIO
NALLOCATION
1.0Alpha - Bond Risk premium -
Equity Risk premium - Credit Risk premium
ALLOCATION
3.0“True” Alpha
Dynamic factors premia*:Style factors and hedge fund strategies
Static factors premia**: Traditionalmarket risk premia
Switch from an asset-based allocation to a factor-based allocation, for a “true” diversification.
Dynamic factors premia reward exposure to style factors (examples: value, carry, momentum, liquidity) and hedge fund strategies (examples : basic convertible or merger arbitrage). They are often marketed as alpha.
Dynamic factors can be replicated with long-short strategies implemented in a systematic and transparent way.
A F
AC
TOR-B
AS
ED
AP
PR
OA
CH T
O H
AR
VE
ST
A B
RO
AD
ER S
ET O
F P
RE
MIA
* Medium capacity - Moderate costs. ** High capacity - Low costs.

Non contractual document12
HSBC Multi-Asset Style Factors strategy
A new approach
A third generation strategy.
Not a traditional asset allocation strategy. HSBC MASF has low exposure to traditional asset classes by design (combination of long and short positions). It involves some use of leverage, short-selling and derivatives.
Nor a Hedge Fund strategy: - Hedge fund philosophy is all about alpha.
- Hedge funds often have low levels of transparency... - ...and may invest in complex and illiquid assets.
HSBC MASF philosophy is to take systematic exposure to style factors to harvest their risk premia across liquid traditional asset classes. Portfolio construction aims to maximise diversification across style factors and asset classes.
The above mentioned objectives is to be considered on the recommended minimum investment period and do not constitute a commitment from HSBC Global Asset Management; there can be no assurance that the strategy will achieve this objective.
Main risks: equity risk, interest rate risk, foreign exchange risk, emerging market risk, derivative risk, counterparty risk

13Non contractual document
Key features*
Investment objective The strategy aims to provide long term total return with a low correlation to traditional asset classes
Average expected volatility Between 6 and 8%
Value
Equities
Momentum
Bonds
Carry
Currencies
HSBC Multi-Asset Style Factors at a glance
* The above mentioned target/limits/objectives are to be considered on the recommended minimum investment period and do not constitute a commitment from HSBC Global Asset Management; there can be no assurance that the strategy will achieve these objectives.
Non contractual document14
How did we select style factors?
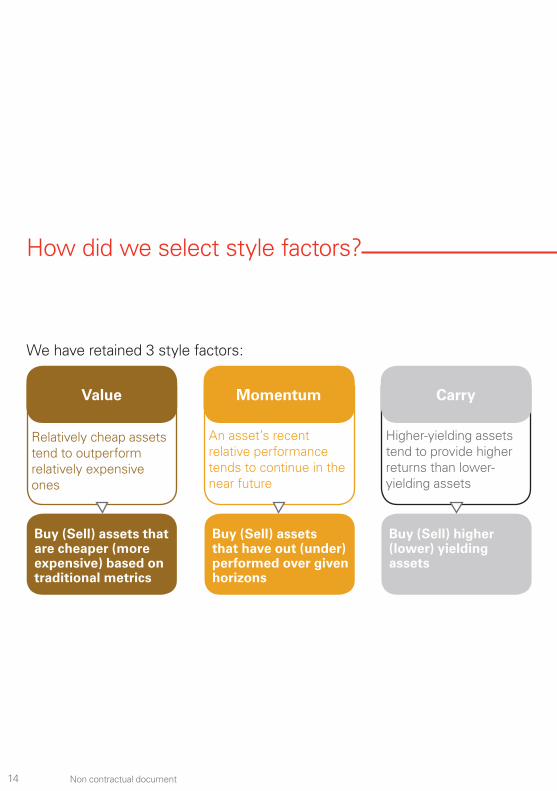
We have retained 3 style factors:
Relatively cheap assets tend to outperform relatively expensive ones
An asset’s recent relative performance tends to continue in the near future
Higher-yielding assets tend to provide higher returns than lower-yielding assets
Value Momentum Carry
Buy (Sell) assets that are cheaper (more expensive) based on traditional metrics
Buy (Sell) assets that have out (under) performed over given horizons
Buy (Sell) higher (lower) yielding assets

15Non contractual document
Each style factor we selected had to pass four filters and has to be:
Justified and widely documented by academic research. In particular, it should compensate an intuitive and specific risk which has its own cycle;
Persistent across equity, bond and FX markets over time, based on very long data series;
Weakly correlated to traditional asset classes and other styles;
Investable using only liquid instruments.
We have rejected any style that could not be qualified as a pure factor according to our criteria. This was the case for instance of specific equity styles such as the “Defensive/Low-Beta“ and “Size” or factors that are highly related to market risk or cannot be easily investable using liquid instruments such as “Volatility”, “Credit” and “Illiquidity”.
Non contractual document16
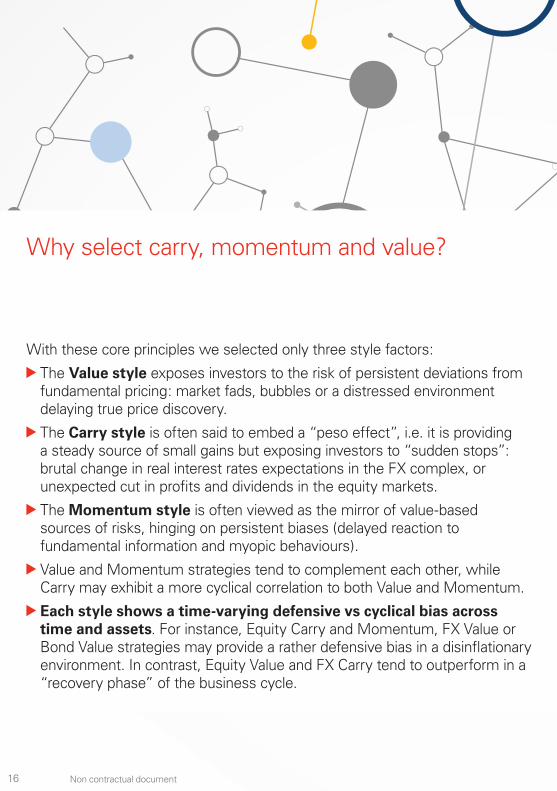
With these core principles we selected only three style factors:
The Value style exposes investors to the risk of persistent deviations from fundamental pricing: market fads, bubbles or a distressed environment delaying true price discovery.
The Carry style is often said to embed a “peso effect”, i.e. it is providing a steady source of small gains but exposing investors to “sudden stops”: brutal change in real interest rates expectations in the FX complex, or unexpected cut in profits and dividends in the equity markets.
The Momentum style is often viewed as the mirror of value-based sources of risks, hinging on persistent biases (delayed reaction to fundamental information and myopic behaviours).
Value and Momentum strategies tend to complement each other, while Carry may exhibit a more cyclical correlation to both Value and Momentum.
Each style shows a time-varying defensive vs cyclical bias across time and assets. For instance, Equity Carry and Momentum, FX Value or Bond Value strategies may provide a rather defensive bias in a disinflationary environment. In contrast, Equity Value and FX Carry tend to outperform in a “recovery phase” of the business cycle.
Why select carry, momentum and value?
17Non contractual document
One specific factor may suffer a long period of underperformance. However, a balanced combination of style factors should limit the risks of synchronisation of cycles.
17Non contractual document

Non contractual document18
Although the portfolio offers many attractive characteristics, there are two scenarios which are especially detrimental to a factor-based approach:
- The risk premia attached to the factors vanish; in other words, the factors are arbitraged away.
- The diversification offered by the combination of factors vanishes, leading the strategy to be exposed to a single risk factor.
We strongly believe that both risks are not likely to materialise.
The existence of any factor premium is usually justified on risk or behavioural considerations. Anyway, fundamental changes in the economy, investment community or market structure are required before a premium would change in nature or even vanish. More importantly, should such significant changes happen, they would have to be observed over long periods.
In order to minimise this risk, the 3 factors that we have selected have been persistent across time, considering long data series, and asset classes. Unlike “newly discovered” premia that are usually specific to a particular asset class, these are widely recognised by academic research. As an example, although Equity Value and Momentum have been recognised for more than 70 years, they have not been arbitraged away.
How sustainable is the strategy?
The commentary and analysis presented in this document reflect the opinion of HSBC Global Asset Management on the markets, according to the information available to date. They do not constitute any kind of commitment from HSBC Global Asset Management. Consequently, HSBC Global Asset Management will not be held responsible for any investment or disinvestment decision taken on the basis of the commentary and/or analysis in this document.

19Non contractual document
Finally, we have selected Carry, Momentum and Value style factors also because they offer strong diversification properties. Based on long data-series, they are weakly correlated to each other on average. As previously mentioned, value and momentum factors tend to complement each other, while carry is expected to exhibit more cyclical correlations to the two other factors. Again, a significant change in the nature of the premia would be required to impact the correlation structure of the three selected factors.
The commentary and analysis presented in this document reflect the opinion of HSBC Global Asset Management on the markets, according to the information available to date. They do not constitute any kind of commitment from HSBC Global Asset Management. Consequently, HSBC Global Asset Management will not be held responsible for any investment or disinvestment decision taken on the basis of the commentary and/or analysis in this document.
In conclusion, our Multi-Factor and Multi-Asset approach, is designed to provide a return/risk profile that does not heavily rely on any particular factor or asset class.

Non contractual document20
Portfolio construction
The strategy aims to capture 3 style premia across 3 asset classes thanks to 9 customised style portfolios. Each style portfolio combines long and short positions to capture the style premium in its “purest” form with no structural exposure to any asset class.
The allocation of each style portfolio is systematic and dynamic, based on a simple and intuitive metric related to the selected style.
Example: Currency Carry factor
NZD AUD NOK CAD GBP JPY EUR SEK CHF
3-mth IR 2.6% 2.3% 1.1% 0.9% 0.6% 0.0% -0.2% -0.5% -0.8%
Ranking 1 2 3 4 5 6 7 8 9
Source: HSBC Global Asset Management (France) – For illustrative purposes only

21Non contractual document
The allocation of the style portfolio derives from the ranking of the universe on a defined metric, here the 3-month interest rate.
The style portfolio goes long the better ranked assets and short the lower ranked.
NZDAUDNOKCADGBPJPYEURSEKCHF
-50% -40% 40% 50%-30% 30%-20% 20%-10% 10%0%
0%
40%
30%
20%
10%
-10%
-20%
-30%
-40%
The style portfolios’ allocation will move over time as changes in the metric values trigger changes in the ranking of the universe.
Non contractual document22
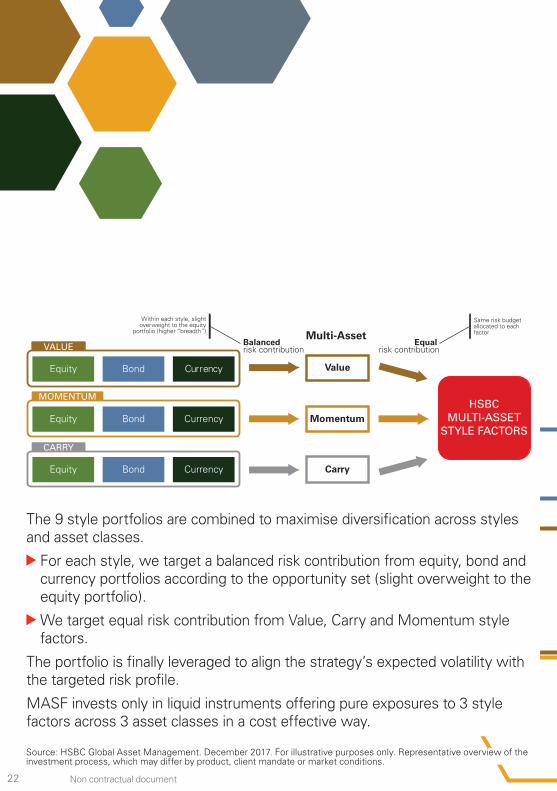
The 9 style portfolios are combined to maximise diversification across styles and asset classes.
For each style, we target a balanced risk contribution from equity, bond and currency portfolios according to the opportunity set (slight overweight to the equity portfolio).
We target equal risk contribution from Value, Carry and Momentum style factors.
The portfolio is finally leveraged to align the strategy’s expected volatility with the targeted risk profile.
MASF invests only in liquid instruments offering pure exposures to 3 style factors across 3 asset classes in a cost effective way.
Source: HSBC Global Asset Management. December 2017. For illustrative purposes only. Representative overview of the investment process, which may differ by product, client mandate or market conditions.
Multi-Asset
HSBCMULTI-ASSET
STYLE FACTORS
Balanced risk contribution
Within each style, slight �overweight to the equity �
portfolio (higher “breadth”)
Equal risk contribution
Same risk budget allocated to each factor
ValueEquity Bond Currency
VALUE
CarryEquity Bond Currency
CARRY
MomentumEquity Bond Currency
MOMENTUM

23Non contractual document 23

Non contractual document24
HSBC Multi-Asset Style Factors - Example of portfolio allocation
Developed markets Emerging markets
-20% -10% 0% 10% 20%
UK
Japan
Spain
France
Canada
Switzerland
USA
Australia
Germany
Italy
Sweden
-10% -5% 0% 5% 10%
Malaysia
Mexico
India
South-Africa
Brazil
Thailand
China
Poland
Taiwan
Korea
EQUITIES - COUNTRY ALLOCATION
Source: HSBC Global Asset Management, data as at 29/12/2017. Allocation is as at the date indicated, may not represent current or future allocation and is subject to change without prior notice.

25Non contractual document
Europe USA
-4% -2% 0% 2% 4% 6%
Energy
Information Tech.
Health
Financials
Utilities
Industry
Consumer Dis.
Consumer St.
Materials
-4% -2% 0% 2% 4%
RetailOil and Gas
ConstructionTechnology
BanksBasic Resources
Food & BeveragesAuto
HealthcareHousehold Goods
ChemicalsIndustry
FinancialsMedia
InsurancetelecomUtilities
Travel & Leisure
EQUITIES - SECTOR ALLOCATION
Source: HSBC Global Asset Management, data as at 29/12/2017. Allocation is as at the date indicated, may not represent current or future allocation and is subject to change without prior notice.
Non contractual document26
-75% -50% -25% 0% 25% 50% 75%
UK
Canada
Switzerland
Germany
Sweden
Australia
Norway
USA
New Zealand
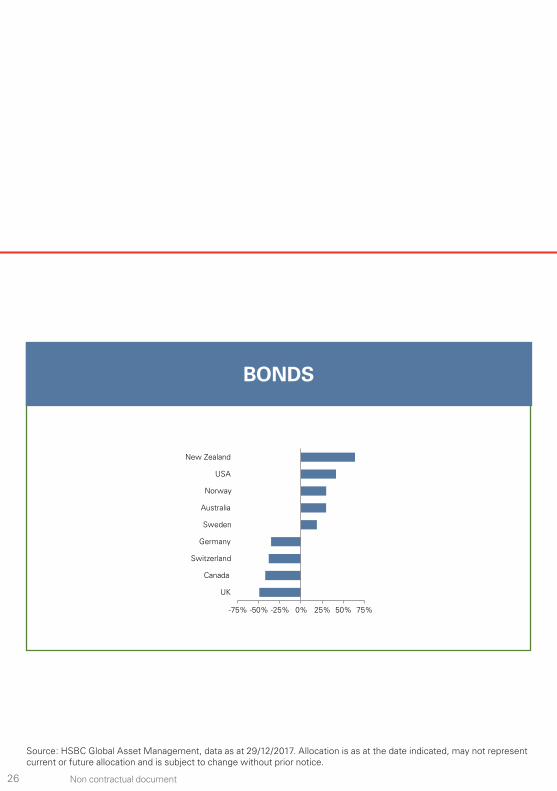
BONDS
Source: HSBC Global Asset Management, data as at 29/12/2017. Allocation is as at the date indicated, may not represent current or future allocation and is subject to change without prior notice.
27Non contractual document
Emerging marketsDeveloped markets
-15% -5% 5% 15%
CHF
NZD
EUR
CAD
JPY
GBP
AUD
NOK
SEK
-15% -5% 5% 15%
KRWCLPZARPLNCOPHUFBRL
TWDSGDIDR
MXNINR
RUB
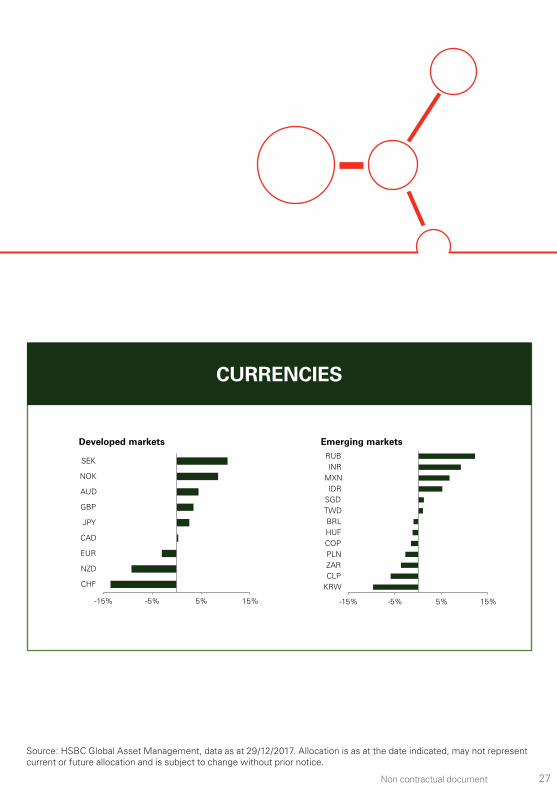
CURRENCIES
Source: HSBC Global Asset Management, data as at 29/12/2017. Allocation is as at the date indicated, may not represent current or future allocation and is subject to change without prior notice.

Non contractual document28
HSBC MASF aims to provide diversification
Diversification is always crucial but especially in volatile periods
An allocation based on traditional asset classes may seem to be well diversified but traditional asset classes are in fact exposed to the same risk factors.
The correlation between these risk factors tend to increase significantly in periods of financial crisis.
-0.2
-0.1
0.0
0.1
0.2
0.3
0.4
0.5
03/2000 02/2006 01/2012 12/2017
Lehman Brothersbankruptcy
Euro sovereigndebt crisis
Liquidity crisis
Style portfolios average pairwise 1Y correlation Asset classes average pairwise 1Y correlation
In contrast, the correlation of style portfolios is very stable.
The figures refer to simulated past performance. Simulated past performance are not a reliable indicator of future performance. Data in USD from 22/03/2000 to 29/12/17. Sources: HSBC Global Asset Management, Bloomberg, DataStream. For illustrative purposes only. The figures refer to simulated past performance. Simulated past performance are not a reliable indicator of future performance. The performance figures displayed in the document relate to the past and past performance should not be seen as an indication of future returns.

29Non contractual document
This is because within a particular asset class, styles are weakly correlated; similarly, for a given style, asset classes are weakly correlated.
Style portfolios average correlation
FXValue
0.0 1 0.2 -0.3
-0.2 1 0.0 0.0 0.0
FXMomentum
FXCarry 0.0 0.1 0.1 -0.1
0.2 0.0 0.2 1 -0.4
- 1.0 0.1 -0.1 0.1 -0.1 -0.1 0.0 -0.3 -0.4 1
-0.2 -0.1 0.2 -0.1 - 1
BondValue 0.0 0.0 0.1 -0.3
BondMomentum 0.0 0.2 -0.1 0.2
- 0.5
0.0 0.3 -0.1 0.1
-0.1
-0.3 0.1 0.1 -0.1
0.1 0.1 -0.1 0.1 0.5
-0.1
0.0 0.0 0.0 1
EquityValue 0.1 -0.4 1 0.0
BondCarry 0.2
1.0
EquityMomentum 0.0 1 -0.4 0.0
EquityCarry
FXV
alueFX
Mom
ent
umFXC
arry
Bon
dV
alue
Bon
dM
ome
ntum
Equ
ityV
alue
Bon
dC
arry
Equ
ityM
ome
ntum
Equ
ityC
arry
1 0.0 0.1 0.0
0.2 0.0 0.0 0.3 -0.1
0.0 -0.1 0.0 0.10.0
The figures refer to simulated past performance. Simulated past performance are not a reliable indicator of future performance. Sources: HSBC Global Asset Management, Bloomberg, DataStream. Weekly performances from 22/03/1999 to 29/12/2017.

Non contractual document30
Offering “true“ diversification
Most Multi-Asset portfolios concentrate their risk on three specific risks:
- The equity risk factor or market beta. - The real interest or real duration premium. - The global inflation risk.
HSBC MASF has been designed to harvest alternative sources of risk. It aims to provide diversification when it is needed the most. For example, when international credit and equity risk align with duration risks to account for a single factor often called “Risk on - Risk off”.
Over the past 10 years, the global economy has endured specific episodes of market stress with a tremendous variety of shocks. We provide below three illustrations showing that MASF performance has been diversifying, while maintaining a daily liquidity.

31Non contractual document
1) The “Lehman Brothers Moment” in September-October 2008 was marked by a sudden stop in liquidity. During this period, most assets correlated…
Great Financial Crisis, 2008-2009
-35%
-30%
-25%
-20%
-15%
-10%
-5%
0%
12/07 03/08 06/08 09/08 12/08 03/09 06/09 09/09 12/09
Max
imum
dra
wdo
wn,
%
MASF Strategy 50% Equity - 50% Bonds
… while Equity Carry and Momentum, FX and Bond Momentum styles supported performance and limited the drawdown of the strategy. In 2008, the strategy recovered rapidly thanks to the EM FX Carry and Equity Value styles, while traditional balanced beta continued to struggle until March 2009.
The figures refer to simulated past performance. Simulated past performance are not a reliable indicator of future performance. Source: HSBC Global Asset Management. Data from 31/12/2007 to 31/12/2009. Simulated performance in excess of cash. 50% MSCI World TR Hedged + 50% JPM GBI Broad Index Hedged, in excess of cash.

Non contractual document32
2) The “US debt ceiling crisis” in August 2011.
During this period, the high degree of uncertainty related to the possible extension of the “US debt ceiling” and to the amplification of the Euro sovereign crisis, created an abrupt crash in risky assets.
US debt ceiling and Euro sovereign crisis, August 2011
-8%
-6%
-4%
-2%
0%
12/10 03/11 06/11 09/11 12/11
Max
imum
dra
wdo
wn,
%
MASF Strategy 50% Equity - 50% Bonds
Our MASF strategy should be immune to this period of “extreme” asset re-correlation thanks to positive performance of Equity Carry, Equity Value or FX Value styles.
The figures refer to simulated past performance. Simulated past performance are not a reliable indicator of future performance. Sources: HSBC Global Asset Management. Data from 31/12/2010 to 31/12/2011. Simulated performance in excess of cash. 50% MSCI World TR Hedged + 50% JPM GBI Broad Index Hedged, in excess of cash.

33Non contractual document
3) The “Commodity bear market and Yuan Crisis” in August 2015 and the “Brexit” crisis in June 2016 created downward pressures on cyclical and financial sectors through a sequence of brief crashes.
Commodity bear and Brexit, 2015-2016
-8%
-6%
-4%
-2%
0%
06/15 09/15 12/15 03/16 06/16 09/16
Max
imum
dra
wdo
wn,
%
SF Strategy 50% Equity - 50% Bonds
In H2 2015 all Value styles acted as defensive buffers, while in H1 2016, FX Carry and Equity Carry helped to diversify from the Brexit and Euro-centric troubles which followed in February and June 2016.
The figures refer to simulated past performance. Simulated past performance are not a reliable indicator of future performance. Sources: HSBC Global Asset Management. Data from 30/06/2015 to 30/09/2016. Actual performance in excess of cash. 50% MSCI World TR Hedged + 50% JPM GBI Broad Index Hedged, in excess of cash.

Non contractual document34
When may style factors struggle?
The risk-adjusted performance of the MASF strategy has been cyclical over time. The different style factors correspond to specific sources of risk which have their own cycle.
As their related risk and popularity ebb and flow, each style may face periods of underperformance. This may last a few months to a few years and maybe viewed as a necessary rebuilding process of a style prospective return.
For instance, the Value Equity style suffered from 2000 to 2003 and in 2007-2008, while sharply recovering between 2003 and 2006 as well as between 2009 to 2011.
In contrast, Equity Momentum and Carry styles tended to offset those periods of disappointing performance.

35Non contractual document
Equity styles performance (1-year rolling performance)
-20%
-10%
0%
10%
20%
30%
03/00 10/03 05/07 11/10 06/14 12/17
Equity Momentum Equity Carry Equity Value
The figures refer to simulated past performance. Simulated past performance are not a reliable indicator of future performance. The performance figures displayed in the document relate to the past and past performance should not be seen as an indication of future returns.Sources: HSBC Global Asset Management, Bloomberg, DataStream. Data from 22/03/1999 to 29/12/2017. Simulated performance in excess of cash from 22/03/1999 to 28/04/2015 and actual performance in excess of cash thereafter.

Non contractual document36
The diversification benefits of balancing styles
The table below illustrates by how much style performance rotation has been a powerful source of diversification and explains how alternative sources of risk may have been harvested across time and different market regimes.
2000 2001 2002 2003 2004 2005 2006 2007 2008 2009 2010 2011 2012 2013 2014 2015 2016 2017
1.8 2.0
1.4 2.1 1.7 2.5 1.7 1.9 2.5 2.5
1.0 1.4 3.2 2.5 1.4 1.6 1.0 1.7 2.0 2.1 1.5 1.6 1.1
0.8 1.0 2.4 2.4 1.0 1.2 0.6 1.6 0.9 1.3 1.4 1.3 1.3 1.4 1.6 0.9 1.9
0.4 0.9 1.6 1.4 0.8 0.9 0.4 1.5 0.7 1.0 1.0 1.1 0.4 1.0 1.0 0.7 0.9
0.3 0.9 1.1 1.3 0.7 0.4 0.4 1.0 0.6 0.7 0.9 1.1 0.4 0.6 0.3 0.5 0.8
0.2 0.5 0.4 0.6 0.5 0.4 0.3 0.9 0.6 0.7 0.3 0.3 0.1 0.4 0.2 1.4 0.3 0.6
0.1 0.5 0.4 0.2 0.2 0.1 0.2 0.6 0.6 0.5 0.1 0.0 0.1 0.2 0.1 0.3 0.1 0.1
-0.1 -0.3 -0.2 -0.1 -0.4 -0.7 -0.1 -0.4 -0.1 -0.4 -0.3 -0.3 -0.3 -0.4 -0.2 0.0 -0.2 -0.3
-0.6 -0.2 -0.1 -1.5 -0.4 -2.0 -0.1 -0.6 -0.3 -0.5 -0.4 -0.4 -0.3 -0.3 -0.7 -0.5
-0.5 -0.5 -0.7 -0.7 -0.8 -0.6 -1.2 -0.6 -0.8 -0.8
-1.1 -0.6 -1.0 -0.9 -1.1
-0.9
-1.4
-1.6
Equity Carry
Bond Carry
FX Carry
Equity Momentum
Bond Momentum
FX Momentum
Equity Value
Bond Value
FX Value
The figures refer to simulated past performance. Simulated past performance are not a reliable indicator of future performance. The performance figures displayed in the document relate to the past and past performance should not be seen as an indication of future returns. Sources: HSBC Global Asset Management, Bloomberg, DataStream. Data as at 29/12/2017.
37Non contractual document
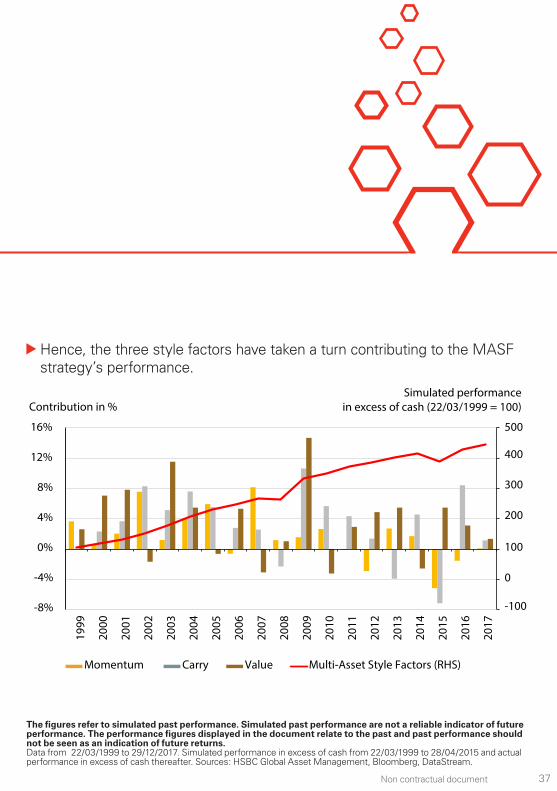
Hence, the three style factors have taken a turn contributing to the MASF strategy’s performance.
-100
0
100
200
400
300
500
-8%
-4%
0%
4%
8%
12%
16%
Momentum Carry Value Multi-Asset Style Factors (RHS)
Simulated performancein excess of cash (22/03/1999 = 100)Contribution in %
1999
2000
2001
2002
2003
2004
2005
2006
2007
2008
2009
2010
2011
2012
2013
2014
2015
2016
2017
The figures refer to simulated past performance. Simulated past performance are not a reliable indicator of future performance. The performance figures displayed in the document relate to the past and past performance should not be seen as an indication of future returns. Data from 22/03/1999 to 29/12/2017. Simulated performance in excess of cash from 22/03/1999 to 28/04/2015 and actual performance in excess of cash thereafter. Sources: HSBC Global Asset Management, Bloomberg, DataStream.

Non contractual document38
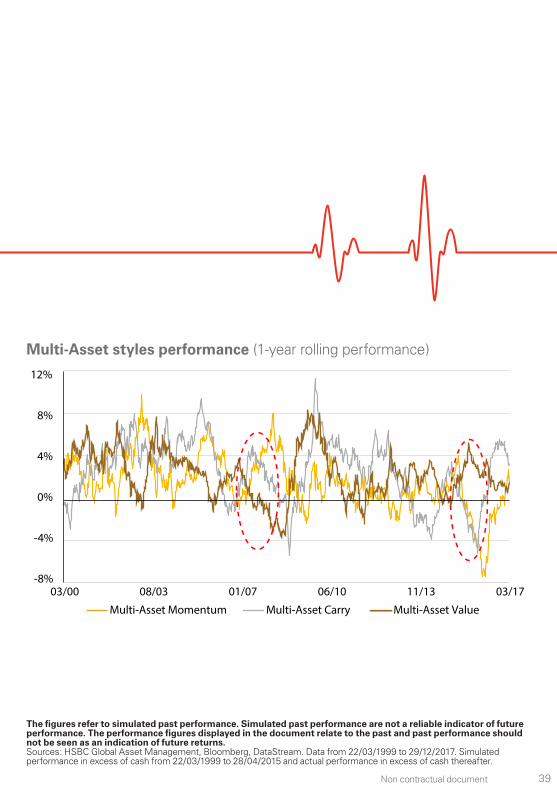
When the majority of cross-asset styles struggle at the same time, a balanced strategy is very likely to be affected. While these events are seldom, they do occur.
For instance:
- In H1 2008 a majority of Value and Carry synchronised to the downside.
- In H2 2015 a majority of Carry and Momentum factors did the same.
As illustrated in the chart, each aggregated cross-asset style follows its own cycle of expansion and contraction, while exhibiting no predictable pattern, suggesting that any attempt to time factor allocation would be quite hazardous.
When might the MASF strategy suffer?
The commentary and analysis presented in this document reflect the opinion of HSBC Global Asset Management on the markets, according to the information available to date. They do not constitute any kind of commitment from HSBC Global Asset Management. Consequently, HSBC Global Asset Management will not be held responsible for any investment or disinvestment decision taken on the basis of the commentary and/or analysis in this document.
Our research suggests that most of the performance of a style strategy comes from diversification and harvesting long term risk premia. Therefore, there is no manager intervention to tilt the portfolio away from this systematic approach.
39Non contractual document
Multi-Asset styles performance (1-year rolling performance)
-8%
-4%
0%
4%
8%
12%
03/00 08/03 01/07 06/10 11/13 03/17
Multi-Asset Momentum Multi-Asset Carry Multi-Asset Value
The figures refer to simulated past performance. Simulated past performance are not a reliable indicator of future performance. The performance figures displayed in the document relate to the past and past performance should not be seen as an indication of future returns.Sources: HSBC Global Asset Management, Bloomberg, DataStream. Data from 22/03/1999 to 29/12/2017. Simulated performance in excess of cash from 22/03/1999 to 28/04/2015 and actual performance in excess of cash thereafter.

Non contractual document40
Diversification when combined with balanced portfolio
As the MASF strategy has no structural exposure to equity, bond and currency markets, the portfolio is highly diversified in itself and is diversifying when combined with balanced portfolios.
Multi-Asset Style Factors strategy average correlations to
The figures refer to simulated past performance. Simulated past performance are not a reliable indicator of future performance. The performance figures displayed in the document relate to the past and past performance should not be seen as an indication of future returns.Equity markets = MSCI World TR Net USD hedged index; bond markets = JPM GBI Broad USD hedged index ; currency markets = Dollar indexWeekly data from 22/03/1999 to 29/12/2017. Data are simulated performance from 22/03/1999 to 28/04/2015 and actual performance posted by a real fund thereafter. Data net of estimated bid-ask spreads and gross of management fees. Sources: HSBC Global Asset Management, Bloomberg, DataStream.
Equity markets
Bond markets
FX markets
0.04 0.07 0.01
41Non contractual document
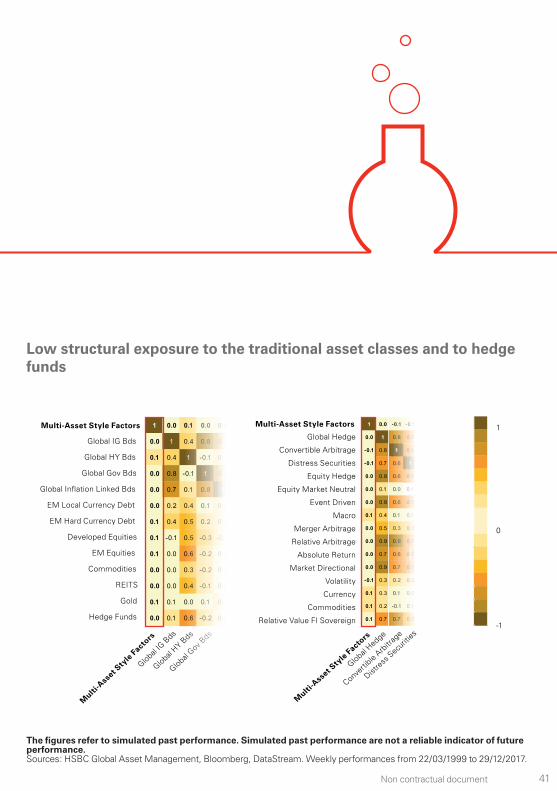
Low structural exposure to the traditional asset classes and to hedge funds
Multi-Asset Style Factors
Global IG Bds
Global HY Bds
Global Gov Bds
Global Inflation Linked Bds
EM Local Currency Debt
EM Hard Currency Debt
Developed Equities
EM Equities
Commodities
REITS
Gold
Hedge Funds
Multi
-Ass
et Sty
le Fa
ctors
Global IG
Bds
Global HY B
ds
Global Gov
Bds
1
0
-1
1 0.0 0.1 0.0 0.0
0.0 1 0.4 0.8 0.7
0.1 0.4 1 -0.1 0.1
0.0 0.8 -0.1 1 0.8
0.0 0.7 0.1 0.8 1
0.0 0.2 0.4 0.1 0.2
0.1 0.4 0.5 0.2 0.3
0.1 -0.1 0.5 -0.3 -0.1
0.1 0.0 0.6 -0.2 0.0
0.0 0.0 0.3 -0.2 0.0
0.0 0.0 0.4 -0.1 0.0
0.1 0.1 0.0 0.1 0.1
0.0 0.1 0.6 -0.2 0.0
1 0.0 -0.1 -0.1 0.0
0.0 1 0.8 0.7 0.9
-0.1 0.8 1 0.6 0.6
-0.1 0.7 0.6 1 0.6
0.0 0.9 0.6 0.6 1
0.0 0.1 0.0 0.1 0.2
0.0 0.9 0.6 0.7 0.8
0.1 0.4 0.1 0.1 0.3
0.0 0.5 0.3 0.3 0.5
0.0 0.9 0.9 0.7 0.7
0.0 0.7 0.6 0.6 0.7
0.0 0.9 0.7 0.7
-0.1 0.3 0.2 0.2
0.1 0.3 0.1 0.0
0.1 0.2 -0.1 0.1
0.1 0.7 0.7 0.5
Multi-Asset Style Factors
Global Hedge
Convertible Arbitrage
Distress Securities
Equity Hedge
Equity Market Neutral
Event Driven
Macro
Merger Arbitrage
Relative Arbitrage
Absolute Return
Market Directional
Volatility
Currency
Commodities
Relative Value FI Sovereign
Multi
-Ass
et Sty
le Fact
ors
Global Hedge
Converti
ble Arb
itrag
e
Distre
ss S
ecurit
ies
The figures refer to simulated past performance. Simulated past performance are not a reliable indicator of future performance.Sources: HSBC Global Asset Management, Bloomberg, DataStream. Weekly performances from 22/03/1999 to 29/12/2017.

Non contractual document42
Robust performance
3.9% gross return from strategy inception on 28/04/2015 to 29/12/2017
Performance gross of fees since inception (28/04/2015 - 29/12/2017)
The performance figures displayed above relate to the past and past performance should not be seen as an indication of future returns. Source: HSBC Global Asset Management. Data from inception on 28/04/2015 to 29/12/2017. Performance gross of management fees (had fees had been taken into account, the performance displayed would have been lower). The commentary and analysis presented in this document reflect the opinion of HSBC Global Asset Management on the markets, according to the information available to date. They do not constitute any kind of commitment from HSBC Global Asset Management.
90
95
100
105
110
04/2
015
08/2
015
12/2
015
04/2
016
08/2
016
12/2
016
04/2
017
08/2
017
12/2
017
43Non contractual document
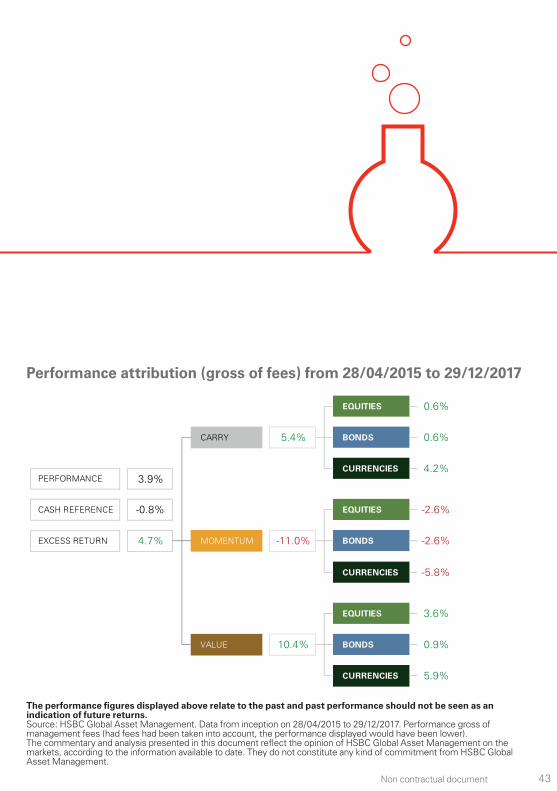
Performance attribution (gross of fees) from 28/04/2015 to 29/12/2017
EQUITIES 0.6%
-2.6%
CURRENCIES 4.2%
CARRY 5.4% BONDS 0.6%
PERFORMANCE 3.9%
CASH REFERENCE -0.8% EQUITIES
CURRENCIES -5.8%
EXCESS RETURN 4.7% MOMENTUM -11.0% BONDS -2.6%
CURRENCIES 5.9%
EQUITIES 3.6%
VALUE 10.4% BONDS 0.9%
The performance figures displayed above relate to the past and past performance should not be seen as an indication of future returns. Source: HSBC Global Asset Management. Data from inception on 28/04/2015 to 29/12/2017. Performance gross of management fees (had fees had been taken into account, the performance displayed would have been lower). The commentary and analysis presented in this document reflect the opinion of HSBC Global Asset Management on the markets, according to the information available to date. They do not constitute any kind of commitment from HSBC Global Asset Management.

Non contractual document44
Interviews
What are the most common problems faced by investors today as regards asset allocation?
The most important challenges faced by investors are the current market yields and valuations, which mean lower future returns from traditional asset classes. Government bond yields have been driven to historically ultra-low levels and this has resulted in other risk premia falling as well, to include credit and equity markets. With unattractive valuations for most asset classes, we believe that today is relatively unique and that there is less potential for diversification in asset allocation.The common responses to these challenges are to give more weight to traditional active management (search of alpha) and to invest in alternative asset classes as private equity, real estate (search of diversification). However, true alpha is notoriously scarce while alternative classes have low liquidity and tend to show significant equity exposure. Our recommendation is to switch from an asset-based allocation to a factor-based allocation and to harvest a broader set of risk premia than those linked to traditional asset classes: the so-called dynamic factor premia and in particular style factors premia.
HSBC Multi-Asset Style Factors, relevant and suitable for a strategic asset allocation.
Jean-Charles Bertrand, Head of Multi-Asset HSBC Global Asset Management (France).
45Non contractual documentNon contractual document
What are Style Factor Premia and why should they be added to strategic allocation?
A style factor is any characteristic commonly shared by a group of assets which consistently explains the return relative to that asset class. Style factors can be implemented in their purest form through a portfolio of traditional assets whose allocation is long and short and dynamic and systematic. Style factor analysis is well-known at the individual stock level with the examples of the value and size factors. Interestingly, some factors can be invested in a multi-asset portfolio at the macro level with very liquid instruments. Style factors have been extensively studied by academic research. They have generated attractive historical returns but even more importantly can be justified by economic theory (either risk-based or behavorial explanations). They are expected to generate sustainable returns over the long-run and are highly diversifying strategies by construction. Hence, they should be added to Strategic Allocation as new return sources. HSBC Multi-Asset Style Factors is built to offer a pure exposure to style factor premia in an efficient way.
Non contractual document46
Interviews
Does it mean that HSBC MASF is a Hedge Fund strategy?
HSBC Multi-Asset Style Factors is not a traditional asset allocation strategy as it has low exposure to traditional asset classes by design (combination of long and short positions).Obviously, it shares some common characteristics with Hedge Funds as it involves some use of leverage, short-selling and derivatives. However, Hedge Fund philosophy is all about Alpha while HSBC Multi-Asset Style Factors philosophy is to take systematic exposure to style factors to harvest their risk premia. Those systematic exposures are taken in a transparent way across liquid asset classes. On the contrary, Hedge Funds often have low levels of transparency and may invest in complex and illiquid assets.

47Non contractual document
Why HSBC Global AM for a MASF approach?
HSBC Global Asset Management has built a dedicated team of R&D specialists and Portfolio managers with more than 15 years of experience on multi-asset style factor investing. In the early 2000’s, we created one of the first government bond futures and Emerging market currencies arbitrage products mainly based on carry and value approach. Since then we have extended this expertise to the stock market, at country or sector levels.Our R&D has been focused on delivering long term investment solutions which are backed by economic rationale, intuition and robust academic research. We believe that long-term performance depends on a solid process designed to harvest risk premia and that diversification is the only free lunch. Finally, HSBC Global Asset Management has a 20-year long experience on trading liquid instruments such as FX forwards, futures or interest rates swaps. HSBC Global Asset Management has also a conservative culture in terms of best trading practices and managing risks associated to sophisticated strategies. As such, our internal rules on credit and counterpart risks, and on instrument selection are among the most stringent of the industry.
Non contractual document
Our competitive edge
Benoit Bellone, Head of Multi-Asset Research HSBC Global Asset Management (France).
Non contractual document48
What are our factors and how did we select them?We have defined four strict filters in our selection. First, a style factor has to be justified and widely documented by academic research. In particular, it should compensate an intuitive and specific risk which has its own cycle. Second, it has to be persistent across equity, bond and FX markets over decades. Most importantly, and that may be a differentiating criterion, it must be weakly correlated to traditional asset classes and other styles. Finally, it has to be investable using only liquid instruments.With those principles we selected only three major styles. First, “Value”, is rather intuitive, buying assets that are cheap and selling the ones that are expensive. The second one, “Carry” favours the higher yielding assets. The third style, “Momentum” is based on the belief that existing trends will continue in the short run: you buy assets that have outperformed and sell underperformers.
What are our main competitive advantages?
Ideas and concepts are important but we believe that execution details are far more critical to explain differences in performance. We see our competitive advantage through four dimensions:

49Non contractual document
First, intuition and clarity in our investment rules are a true competitive advantage. Over the years, our research team has aimed to reduce complexity in portfolio construction and rule design, which makes our investment process transparent and performance attribution easy to understand. Our R&D team and fund managers’ experience in rigorous data management is also a core asset. We attach a great care to the choice of investable instruments and asset classes, the quality and construction of the data to generate sound rule-based allocations. Portfolio construction and risk budgeting procedures may also have a large impact. Our ability to select and assemble the most diversifying and robust factors is a key factor of differentiation. As such,we are avoiding styles that do not have a strong economic rationale, that are specific to a given asset class (Equity Defensive and Size) or are not easily investable using liquid instruments (Commodities, Credit and Volatility…). We adopt a risk budgeting approach aiming to maximise style diversification and we follow a systematic approach “resisting the temptation of factor timing”.Trading and portfolio management policies may lead to significant differences in performance. We are thus focused on selecting appropriate portfolio turnover and rebalancing strategies. As mentioned earlier, our internal rules are among the most stringent of the industry, so our best execution trading practices and our risk management policies also play a critical part in a successful implementation.
Non contractual document50
Our Multi-Asset capabilities
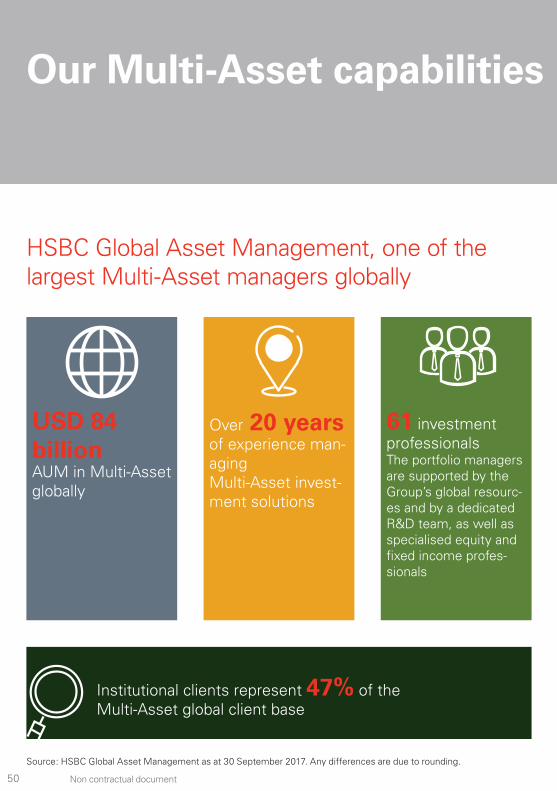
HSBC Global Asset Management, one of the largest Multi-Asset managers globally
61 investment professionals The portfolio managers are supported by the Group’s global resourc-es and by a dedicated R&D team, as well as specialised equity and fixed income profes-sionals
Institutional clients represent 47% of the Multi-Asset global client base
Over 20 years of experience man-aging Multi-Asset invest-ment solutions
USD 84 billion AUM in Multi-Asset globally
Source: HSBC Global Asset Management as at 30 September 2017. Any differences are due to rounding.

51Non contractual document
Source: HSBC Global Asset Management – September 2017. Any asset differences are due to rounding.
EMEA
Americas
Asia
USD 55.4 billion AUM53 investment professionals
USD 9.2 billion AUM7 investment professionals
USD 11.4 billion AUM6 investment professionals

Non contractual document52
The Multi-Asset team based in Paris has EUR 7.4 billion assets under management, as at 30 September 2017, representing 10% of the Paris office total AUM and 10% of Multi-Asset global AUM.
In the Multi-Asset space, institutional clients represent about 60% of the Paris business.
These institutional clients are invested mainly though segregated accounts and mandates.
The client base includes:
- Major pension funds.
- Well-established mutual insurance and provident companies.
- Large corporate firms.
- Several employee savings schemes.
Source: HSBC Global Asset Management – September 2017. Any asset differences are due to rounding.
Paris-based Multi-Asset team
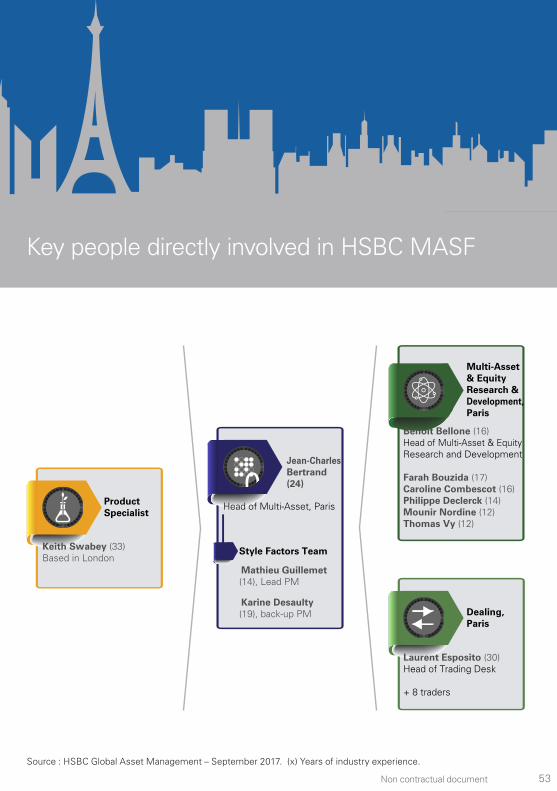
53Non contractual document
Benoît Bellone (16)Head of Multi-Asset & EquityResearch and Development
Farah Bouzida (17)Caroline Combescot (16)Philippe Declerck (14)Mounir Nordine (12)Thomas Vy (12)
Multi-Asset& Equity Research & Development,Paris
Style Factors Team
Jean-CharlesBertrand(24)
Head of Multi-Asset, Paris
Mathieu Guillemet(14), Lead PM
Karine Desaulty(19), back-up PM Dealing,
Paris
Laurent Esposito (30)Head of Trading Desk
+ 8 traders
ProductSpecialist
Keith Swabey (33) Based in London
Source : HSBC Global Asset Management – September 2017. (x) Years of industry experience.
Key people directly involved in HSBC MASF

Non contractual document54
About the authors
Benoit Bellone, Head of Multi-Asset Research HSBC Global Asset Management (France).Benoit Bellone (Paris) is Head of Equities and Multi Asset Research and has been working in the industry since 2001. Prior to joining HSBC in 2007, Benoit worked as an economist at the OECD in France. He holds a Masters degree in Economics and Statistics from ENSAE (France), a
Masters degree in Mathematics (DEA) from the Université Paris IX - Dauphine and a BA in Economics from the Ecole Normale Supérieure de Cachan.
Jean-Charles Bertrand, Head of Multi-Asset HSBC Global Asset Management (France).Jean-Charles Bertrand (Paris) is Head of Multi-Asset of HSBC Global Asset Management (France). Before, Jean-Charles was Global CIO, Quantitative Strategies and Head of Quantitative Fixed Income &
Absolute Return. He has been working in the industry since 1993, when he joined HSBC. He graduated from the Ecole Supérieure des Sciences Economiques et Commerciales (France) and holds a post graduate degree in Applied Probability from the Paris VI University (France). Jean-Charles is a lecturer at HEC, a premier business school in France and at Université Paris-Dauphine. Jean-Charles is an Affiliate Professor at HEC Paris.

55Non contractual document
Mathieu Guillemet, Lead Portfolio Manager HSBC Global Asset Management (France).Mathieu Guillemet (Paris) is a Multi-Asset Portfolio Manager focusing on Absolute Return strategies and has been working in the industry since 2003, when he joined HSBC. Prior to his current position, Mathieu was a financial engineer in the Multi-Asset Research department, working
on asset allocation, portfolio construction and option pricing. Mathieu spent 4 years in the Hong Kong office as a financial engineer where he was responsible for the development of the pricing and allocation tools of Hong Kong-based funds. He graduated with a Master degree from the Ecole Nationale de la Statistique et de l’Analyse de l’Information where he specialized in Statistics, Financial Engineering and Risk Management.
Keith Swabey, Senior Product Specialist HSBC Global Asset Management (UK) Ltd.Keith Swabey is a Senior Product Specialist in the Multi-Asset team and has been working in the industry since 1984. Prior to joining HSBC in 2015, Keith worked as Product Specialist in Fixed Income and Multi-Asset at JPMorgan and LGIM. Prior to that he was a portfolio manager
in Emerging Market Debt and began he career as sales/trader in derivatives and structured products. He holds a MA Hons from Edinburgh University and is a Holder of the IMC and ISMA qualifications. In addition to this, he is an Independent Trustee of two charity pension funds.
Non contractual document56
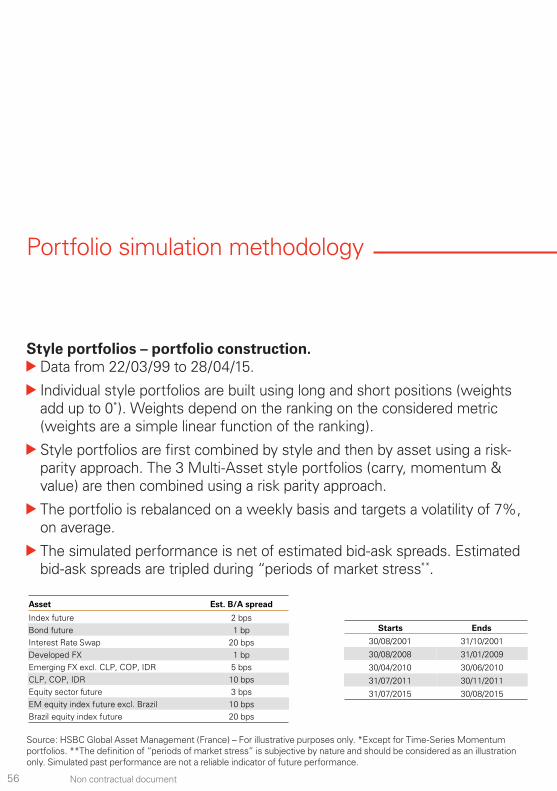
Portfolio simulation methodology
Style portfolios – portfolio construction. Data from 22/03/99 to 28/04/15.
Individual style portfolios are built using long and short positions (weights add up to 0*). Weights depend on the ranking on the considered metric (weights are a simple linear function of the ranking).
Style portfolios are first combined by style and then by asset using a risk-parity approach. The 3 Multi-Asset style portfolios (carry, momentum & value) are then combined using a risk parity approach.
The portfolio is rebalanced on a weekly basis and targets a volatility of 7%, on average.
The simulated performance is net of estimated bid-ask spreads. Estimated bid-ask spreads are tripled during “periods of market stress**.
Source: HSBC Global Asset Management (France) – For illustrative purposes only. *Except for Time-Series Momentum portfolios. **The definition of “periods of market stress” is subjective by nature and should be considered as an illustration only. Simulated past performance are not a reliable indicator of future performance.
Asset Est. B/A spread
Index future 2 bpsBond future 1 bpInterest Rate Swap 20 bpsDeveloped FX 1 bpEmerging FX excl. CLP, COP, IDR 5 bpsCLP, COP, IDR 10 bpsEquity sector future 3 bpsEM equity index future excl. Brazil 10 bpsBrazil equity index future 20 bps
Starts Ends
30/08/2001 31/10/2001
30/08/2008 31/01/2009
30/04/2010 30/06/2010
31/07/2011 30/11/2011
31/07/2015 30/08/2015

57Non contractual document
Equities. Instruments: Index futures
Developed country investment universe: ASX (Australia), TSX (Canada), CAC (France), DAX (Germany), MIB (Italy), TPX (Japan), IBEX (Spain), OMX (Sweden), SMI (Switzerland), FTSE (United Kingdom), S&P500 (United States)
Emerging country investment universe: BOVESPA (Brazil), RDX (Russia), HSCEI (China H), KOSPI2 (Korea), NIFTY (India), KLCI (Malaysia), MSCI TAIWAN, SET (Thailand), WIG (Poland), BOLSA (Mexico), BIST (Turkey), TOP (South-Africa), MSCI INDONESIA (Indonesia)
US Sector investment universe: S&P Select Sector futures (Consumer Discretionary, Consumer Staples, Energy, Financial, Industry, Materials, Technology, Utilities, Health Care).
Europe Sector investment universe: Eurex Stoxx 600 futures (Auto, Banks, Basic Resources, Chemicals, Construction, Financial Services, Food & Beverage, HealthCare, Industrial, Insurance, Media, Oil & Gas, Household Goods, Retail, Information Technology, Telecom, Travel & Leisure, Utilities).
Long-term Value: Adjusted P/E excluding stocks with negative P/E. Long (short) positions in the less (more) expensive markets.
Source: HSBC Global Asset Management (France) – For illustrative purposes only. Simulated past performance are not a reliable indicator of future performance.
1

Non contractual document58
Portfolio simulation methodology
Short-term Value: 1-mth performance. Long (short) positions in the worst (best) performing markets.
Cross-Section Momentum: 1yr – 1 mth performance. Long (short) positions in the best (worst) performing markets.
Time-Series Momentum: 3, 6, 9 & 12 mth performance. Long (short) positions in the markets with positive (negative) return.
Carry: Return-on-Equity. Long (short) positions in markets with the highest (lowest) Return-on-Equity.
59Non contractual document
Source: HSBC Global Asset Management (France) – For illustrative purposes only. Simulated past performance are not a reliable indicator of future performance.
2
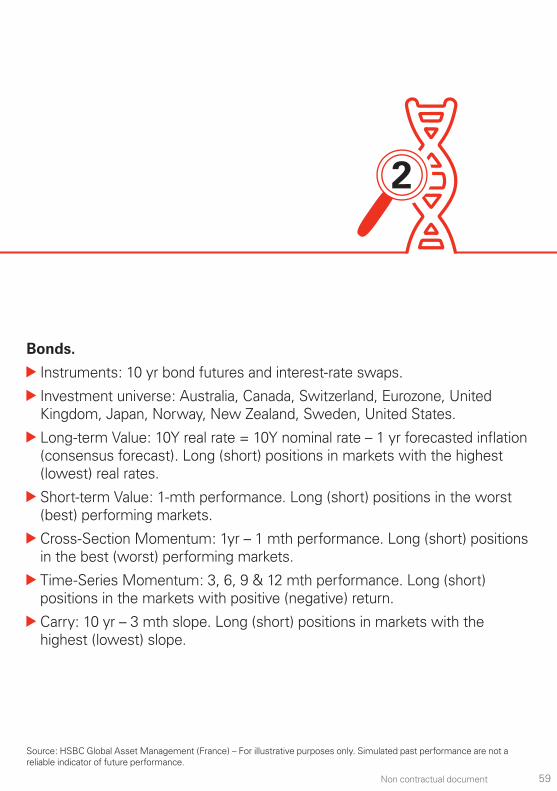
Bonds.
Instruments: 10 yr bond futures and interest-rate swaps.
Investment universe: Australia, Canada, Switzerland, Eurozone, United Kingdom, Japan, Norway, New Zealand, Sweden, United States.
Long-term Value: 10Y real rate = 10Y nominal rate – 1 yr forecasted inflation (consensus forecast). Long (short) positions in markets with the highest (lowest) real rates.
Short-term Value: 1-mth performance. Long (short) positions in the worst (best) performing markets.
Cross-Section Momentum: 1yr – 1 mth performance. Long (short) positions in the best (worst) performing markets.
Time-Series Momentum: 3, 6, 9 & 12 mth performance. Long (short) positions in the markets with positive (negative) return.
Carry: 10 yr – 3 mth slope. Long (short) positions in markets with the highest (lowest) slope.
Non contractual document60
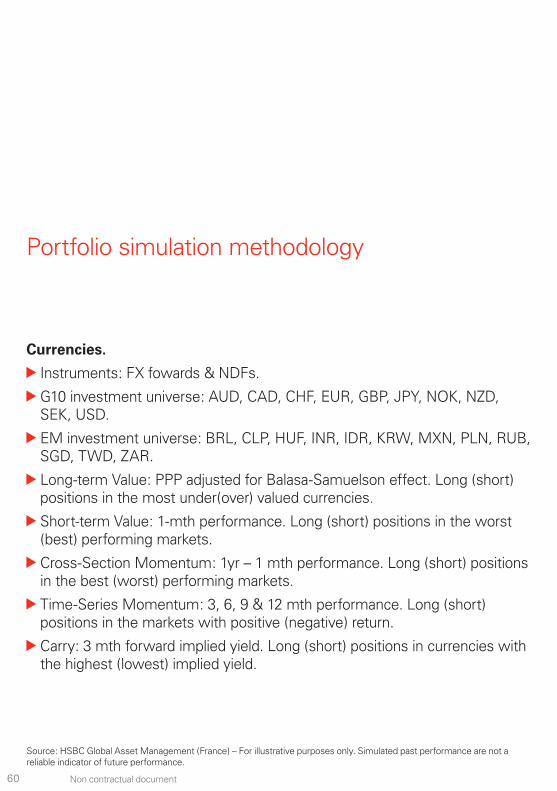
Currencies.
Instruments: FX fowards & NDFs.
G10 investment universe: AUD, CAD, CHF, EUR, GBP, JPY, NOK, NZD, SEK, USD.
EM investment universe: BRL, CLP, HUF, INR, IDR, KRW, MXN, PLN, RUB, SGD, TWD, ZAR.
Long-term Value: PPP adjusted for Balasa-Samuelson effect. Long (short) positions in the most under(over) valued currencies.
Short-term Value: 1-mth performance. Long (short) positions in the worst (best) performing markets.
Cross-Section Momentum: 1yr – 1 mth performance. Long (short) positions in the best (worst) performing markets.
Time-Series Momentum: 3, 6, 9 & 12 mth performance. Long (short) positions in the markets with positive (negative) return.
Carry: 3 mth forward implied yield. Long (short) positions in currencies with the highest (lowest) implied yield.
Source: HSBC Global Asset Management (France) – For illustrative purposes only. Simulated past performance are not a reliable indicator of future performance.
Portfolio simulation methodology

61Non contractual document 61
Non contractual document62
Source: HSBC Global Asset Management (France) – For illustrative purposes only. Simulated past performance are not a reliable indicator of future performance.
Glossary of terms
The Book-to-Market ratio is a valuation ratio of a company’s book value (size of its balance sheet) to its market value (market capitalisation).
A carry strategy is an investment strategy that takes long positions in higher-yielding assets and short positions in lower-yielding assets.
A derivative is a contract whose price depends on the price of another underlying investment. The underlying can be an asset, index, or interest rate. Most common –– examples of derivatives include futures, options and swaps. Derivatives can be traded over-the-counter or listed on an exchange.
A future is a standardised financial contract listed on a regulated market in which the buyer has the obligation to purchase an asset (called “the underlying”) and the seller to sell this asset for an agreed price at a predetermined future date. The underlying can be a commodity, an index, a currency or a bond.
Hedge funds are alternative investments funds that generally use derivatives and leverage in order to generate high returns for their investors. In theory, their performance does not depend on that of equity and fixed income markets.
Leverage is the use of derivatives or borrowed capital to increase the risk profile –hence potential return- of an investment.

63Non contractual document
The maximum drawdown is an indicator of downside risk over a specified time period. It measures the maximum loss from a peak to a trough of a portfolio. It is expressed in percentage terms and computed as Trough Value minus Peak Value, divided by Peak Value.
A Momentum strategy is an investment strategy that aims to benefit from the continuance of existing trends in the market. The strategy takes long positions in the assets that have outperformed over given horizons, and short positions in the assets that have underperformed.
A NDF (non-deliverable forward) is a currency forward contract which is useful to take exposure to foreign currencies that are non-convertible or whose trade is limited.
The P/E (price/earnings ratio) is a valuation ratio of a company’s current share price compared to its per-share earnings.
The ROE (return on equity) is a profitability ratio of a company’s net income compared to its shareholders equity.
Risk-on risk-off refers to changes in investment activity in response to global economic patterns. During periods when risk is perceived as low, investors tend to favour riskier investments; when risk is perceived as high, investors have the tendency to prefer lower-risk investments.

Non contractual document64
Risk parity refers to an approach to investment portfolio construction that focuses on allocation of risk (risk premia) usually defined as volatility, rather than allocation of capital (asset classes). In a risk parity approach, risk is divided equally across the investment portfolio in order to achieve optimal portfolio diversification.
A risk premium is the return in excess of the risk-free rate an investment is expected to generate. It is the extra yield required by investors as a compensation for the extra risk they will bear (compared to a risk-free investment).
Short selling is the sale of a security that is not owned by the seller, or that the seller has borrowed. Short selling is motivated by the belief that a security’s price will decline, enabling it to be bought back in the future at a lower price in order to make a profit.
A style factor is any characteristic commonly shared by a group of assets which consistently explains the return relative to that asset class (cross section return).
A systematic approach is an investment approach where the portfolio manager buys, keeps or sells an asset according to specific pre-defined rules.
A Value strategy is an investment strategy that takes long positions in cheaper assets based on usual valuation metrics and short positions in more expensive assets.
Glossary of terms
65Non contractual document
Risk definitions
It is important to remember that the value of investments and any income from them can go down as well as up and is not guaranteed.
Equity risk: portfolios that invest in securities listed on a stock exchange or market could be affected by general changes in the stock market. The value of investments can go down as well as up due to equity markets movements.
Interest rate risk: as interest rates rise debt securities will fall in value. The value of debt securities is inversely proportional to interest rate movements.
Foreign exchange risk: where overseas investments are held, the rate of exchange of the currency may cause the value to go down as well as up.
Emerging market risk: Investments in emerging markets have by nature higher risk and are potentially more volatile than those made in developed countries. Markets are not always well regulated or efficient and investments can be affected by reduced liquidity.
Derivative risk: the value of derivative contracts is dependent upon the performance of an underlying asset. A small movement in the value of the underlying can cause a large movement in the value of the derivative.
Counterparty risk: The portfolio is exposed to Over the Counter (OTC) markets for all or part of its total assets. The portfolio will therefore be subject to the risk that its direct counterparty will not perform its obligations under the OTC transactions and that the strategy will sustain losses.

Non contractual document66
IMPORTANT INFORMATIONThis content is distributed in France, Italy, Spain and Sweden by HSBC Global Asset Management (France), in Switzerland by HSBC Global Asset Management (Switzerland) Ltd, in the United Kingdom by HSBC Global Asset Management (UK) ltd, in Germany by HSBC Global Asset Management (Deutschland) GmbH and is only intended for professional investors as defined by MiFID. Retail Clients should not rely upon its content and may want to consider seeking professional advice before purchase.The content contained herein is for information only and does not constitute legal, tax or investment advice or a recommendation to any reader of this content to buy or sell investments. Readers must not, therefore, rely on this content when making any investment decisions. This content is not intended for distribution to or use by any person or entity in any jurisdiction or country where such distribution or use would be contrary to law or regulation. All non-authorised reproduction or use of this content and analysis will be the responsibility of the user and will be likely to lead to legal proceedings. The information contained herein is subject to change without notice. The commentary and analysis provided reflect the opinion of HSBC Global Asset Management on the markets, according to the information available to date. They do not constitute any kind of commitment from HSBC Global Asset Management. Consequently, HSBC Global Asset Management will not be held responsible for any investment or disinvestment decision taken on the basis of the commentary and/or analysis in this document. Any forecast, projection or target where provided is indicative only and not guaranteed in any way. HSBC Global Asset Management accepts no liability for any failure to meet such forecast, projection or target. All data from HSBC Global Asset Management unless otherwise specified. Any third party information has been obtained from sources we believe to be reliable, but which we have not independently verified. Investment targets/limits/objectives are to be considered on the recommended minimum investment period; there can be no assurance that the strategies will achieve their objectives.Performance figures displayed in this content relate to the past and past performance should not be seen as an indication of future returns. Simulated past performance is not a reliable indicator of future performance.It is important to remember that the value of investments and any income from them can go down as well as up and investors may not get back the amount originally invested. Capital is not guaranteed. It is important to remember that the value of investments and any income from them can go down as well as up and is not guaranteed.Characteristics and weightings provided are for information only, are not guaranteed and are subject to change over time, and without prior notice, taking into account any changes in markets. Only representative overviews of the investment process have been provided, which may differ by product, client mandate or market conditions.Where overseas investments are held the rate of currency exchange may cause the value of such investments to go down as well as up. Strategies that invest in securities listed on a stock exchange or market could be affected by general changes in the stock market. The value of investments can go down as well as up due to equity markets movements. Investments in emerging markets have by nature higher risk and are potentially more volatile than those made in developed countries. Markets are not always well regulated or efficient and investments can be affected by reduced liquidity. The value of derivative contracts is dependent upon the performance of an underlying asset. A small movement in the value of the underlying can cause a large movement in the value of the derivative. Unlike exchange traded derivatives, over-the-counter (OTC) derivatives have credit risk associated with the counterparty or institution facilitating the trade. As interest rates rise debt securities will fall in value. The value of debt securities is inversely proportional to interest rate movements. The strategy is exposed to Over the Counter (OTC) markets for all or part of its total assets. The strategy will therefore be subject to the risk that its direct counterparty will not perform its obligations under the OTC transactions and that the strategy will sustain losses.Source: MSCI. The MSCI information may only be used for your internal use, may not be reproduced or re-disseminated in any form and may not be used to create any financial instruments or products or any indices. The MSCI information is provided on an ‘as is’ basis and the user of this information assumes the entire risk

67Non contractual document
of any use it may make or permit to be made of this information. Neither MSCI, any of its affiliates or any other person involved in or related to compiling, computing or creating the MSCI information (collectively, the ‘MSCI Parties’) makes any express or implied warranties or representations with respect to such information or the results to be obtained by the use thereof, and the MSCI Parties hereby expressly disclaim all warranties (including, without limitation, all warranties of originality, accuracy, completeness, timeliness, non-infringement, merchantability and fitness for a particular purpose) with respect to this information. Without limiting any of the foregoing, in no event shall any MSCI Party have any liability for any direct, indirect, special, incidental, punitive, consequential or any other damages (including, without limitation, lost profits) even if notified of, or if it might otherwise have anticipated, the possibility of such damages.Important information for Luxembourg investors: HSBC entities in Luxembourg are regulated and authorised by the Commission de Surveillance du Secteur Financier (CSSF).Important information for Swiss investors: This content is intended exclusively towards qualified investors in the meaning of Art. 10 para 3, 3bis and 3ter of the Federal Collective Investment Schemes Act (CISA). HSBC Global Asset Management is the brand name for the asset management business of HSBC Group.Important information for German investors: This content is distributed in Germany by HSBC Global Asset Management (Deutschland) GmbH which is regulated by BaFin. This presentation is not meant for private clients in terms of § 67 Abs. 3 WpHG. The content or parts of it may not be disclosed to any third party. All information within this website do neither replace the prospectus for the fund nor the Key Investor Information Documents and the most recent annual and semi-annual reports. These documents can be obtained upon request and free of charge from HSBC Trinkaus & Burkhardt AG, Koenigsallee 21/23, 40212 Duesseldorf, Germany. They are also available on the internet via www.assetmanagement.hsbc.com/de.Important information for Austrian investors: This content is distributed in Austria by HSBC Global Asset Management (Österreich) GmbH which is regulated by FMA. This presentation is not meant for private clients in terms of WAG 2018.Important information for investors in the United Kingdom: HSBC Global Asset Management (UK) Limited provides information to Institutions, Professional Advisers and their clients on the investment products and services of the HSBC Group. HSBC Global Asset Management (UK) Limited who are authorised and regulated by the Financial Conduct Authority.The content has been approved for distribution/issued by the following entities:HSBC Global Asset Management (France) – 421 345 489 RCS Nanterre. Portfolio management company authorised by the French regulatory authority AMF (no. GP99026) with capital of 8.050.320 euros. Postal address: 75419 Paris cedex 08, France. Offices: Immeuble Coeur Défense, 110, esplanade du Général Charles de Gaulle, 92400 Courbevoie - La Défense 4. Website: www.assetmanagement.hsbc.com/frHSBC Global Asset Management (Switzerland) Limited – Gartenstrasse 26, PO Box, CH-8002 Zurich, Switzerland. Website: www.assetmanagement.hsbc.com/chHSBC Global Asset Management (Deutschland) GmbH – Koenigsallee 21/23, 40212 Duesseldorf, Germany. Website: www.assetmanagement.hsbc.com/deHSBC Global Asset Management (Österreich) GmbH – Herrengasse 1-3, 1010 Wien, Austria. Website: www.assetmanagement.hsbc.com/atHSBC Global Asset Management (UK) Limited Website: www.assetmanagement.hsbc.com/ukAll rights reserved. Copyright © 2018 HSBC Global Asset Management. Non contractual document, updated in January 2018
