hss hire group plc 2017 strategic plan complete; business
TRANSCRIPT
HSS Hire Group Plc
2017 strategic plan complete; business positioned for next phase of accelerated growth
HSS Hire Group plc (“HSS” or the “Group”) today announces results for the 27 week period ended 3 July 2021
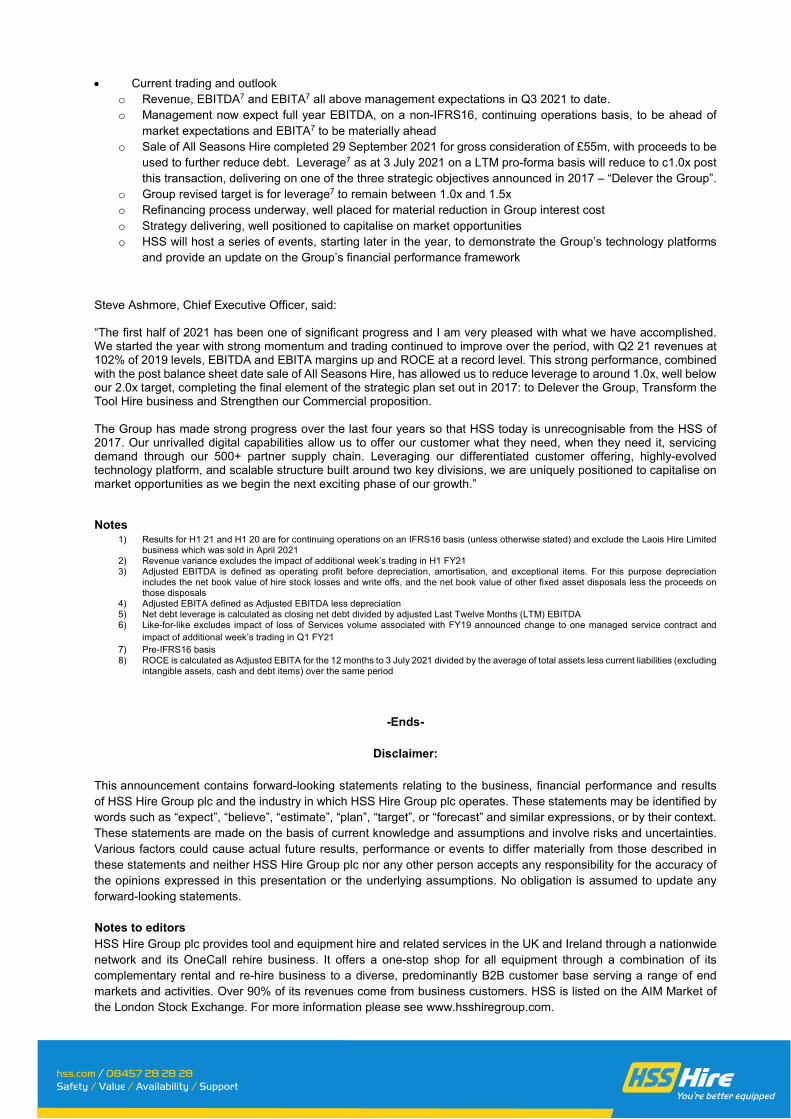
Financial Highlights 1 (Unaudited)
H1 2021
H1 2020
Change
Revenue2 £150.5m £120.7m 22.0%
Adjusted EBITDA3 £38.3m £27.9m 37.2%
Adjusted EBITDA margin 25.4% 23.1% 2.3pp
Adjusted EBITA4 £17.7m £1.1m £16.6m
Adjusted EBITA margin 11.8% 0.9% 10.9pp
Net debt leverage5,7 1.7x 2.9x 1.2x
Other extracts
Operating profit / (loss) £22.6m £(0.7)m £23.3m
Profit / (loss) after tax £11.2m £(12.9)m £24.1m
Basic earnings/(loss) per share 1.61p (7.55)p 9.16p • Strong trading performance with new operating model driving significantly improved profitability above 2019 levels
o H1 2021 like-for-like6 revenues at 99% of H1 2019, with Q2 2021 at 102% o Capital-light Services segment 17% ahead of FY19 on a like-for-like6 basis o EBITDA7 and EBITA7 comfortably ahead of 2019, up 13% and 99% respectively o Digitally-led, lower-cost operating model underpinning Group profitability with EBITDA margin up 2.3pp on H1
2020 and ROCE8 increasing to 24.0%, up 13.3pp since December 2020 • Further strengthening of balance sheet with leverage reduced to 1.7x7
o Net debt7 reduced further to £97.6m (FY 2020: £120.4m) o Leverage at a record low and significantly ahead of previous FY 2021 target o Sale of Laois completed April 2021 for €11.2m o Efficient working capital management maintained, overdue debt remains at low levels
• Delivered 2017 strategic plan, focus now on leveraging digital offering to drive accelerated growth o Transition to new digital platform, HSS Pro POS, largely complete; improving the customer experience by
providing single point-of-sale access to full range of HSS products and services o Restructured organisation into two divisions, already delivering improved sales conversion and customer
service o “Sales Acquisition”, focused on customer conversion and the leveraging of digital assets; and o “Make it Happen”, focused on customer fulfilment and service.
o Low cost builders merchant network expanded to 50 locations (June 2020: 10), now representing 13% of customer orders in England & Wales
o Continued technology investment including enhancements to HSS.com, with online revenue up 75% compared to prior year representing 24% of transactions in H1 2021
• Current trading and outlook
o Revenue, EBITDA7 and EBITA7 all above management expectations in Q3 2021 to date. o Management now expect full year EBITDA, on a non-IFRS16, continuing operations basis, to be ahead of
market expectations and EBITA7 to be materially ahead o Sale of All Seasons Hire completed 29 September 2021 for gross consideration of £55m, with proceeds to be
used to further reduce debt. Leverage7 as at 3 July 2021 on a LTM pro-forma basis will reduce to c1.0x post this transaction, delivering on one of the three strategic objectives announced in 2017 – “Delever the Group”.
o Group revised target is for leverage7 to remain between 1.0x and 1.5x o Refinancing process underway, well placed for material reduction in Group interest cost o Strategy delivering, well positioned to capitalise on market opportunities o HSS will host a series of events, starting later in the year, to demonstrate the Group’s technology platforms
and provide an update on the Group’s financial performance framework
Steve Ashmore, Chief Executive Officer, said: “The first half of 2021 has been one of significant progress and I am very pleased with what we have accomplished. We started the year with strong momentum and trading continued to improve over the period, with Q2 21 revenues at 102% of 2019 levels, EBITDA and EBITA margins up and ROCE at a record level. This strong performance, combined with the post balance sheet date sale of All Seasons Hire, has allowed us to reduce leverage to around 1.0x, well below our 2.0x target, completing the final element of the strategic plan set out in 2017: to Delever the Group, Transform the Tool Hire business and Strengthen our Commercial proposition. The Group has made strong progress over the last four years so that HSS today is unrecognisable from the HSS of 2017. Our unrivalled digital capabilities allow us to offer our customer what they need, when they need it, servicing demand through our 500+ partner supply chain. Leveraging our differentiated customer offering, highly-evolved technology platform, and scalable structure built around two key divisions, we are uniquely positioned to capitalise on market opportunities as we begin the next exciting phase of our growth.” Notes
1) Results for H1 21 and H1 20 are for continuing operations on an IFRS16 basis (unless otherwise stated) and exclude the Laois Hire Limited business which was sold in April 2021
2) Revenue variance excludes the impact of additional week’s trading in H1 FY21 3) Adjusted EBITDA is defined as operating profit before depreciation, amortisation, and exceptional items. For this purpose depreciation
includes the net book value of hire stock losses and write offs, and the net book value of other fixed asset disposals less the proceeds on those disposals
4) Adjusted EBITA defined as Adjusted EBITDA less depreciation 5) Net debt leverage is calculated as closing net debt divided by adjusted Last Twelve Months (LTM) EBITDA 6) Like-for-like excludes impact of loss of Services volume associated with FY19 announced change to one managed service contract and
impact of additional week’s trading in Q1 FY21 7) Pre-IFRS16 basis 8) ROCE is calculated as Adjusted EBITA for the 12 months to 3 July 2021 divided by the average of total assets less current liabilities (excluding
intangible assets, cash and debt items) over the same period
-Ends-
Disclaimer:
This announcement contains forward-looking statements relating to the business, financial performance and results of HSS Hire Group plc and the industry in which HSS Hire Group plc operates. These statements may be identified by words such as “expect”, “believe”, “estimate”, “plan”, “target”, or “forecast” and similar expressions, or by their context. These statements are made on the basis of current knowledge and assumptions and involve risks and uncertainties. Various factors could cause actual future results, performance or events to differ materially from those described in these statements and neither HSS Hire Group plc nor any other person accepts any responsibility for the accuracy of the opinions expressed in this presentation or the underlying assumptions. No obligation is assumed to update any forward-looking statements. Notes to editors HSS Hire Group plc provides tool and equipment hire and related services in the UK and Ireland through a nationwide network and its OneCall rehire business. It offers a one-stop shop for all equipment through a combination of its complementary rental and re-hire business to a diverse, predominantly B2B customer base serving a range of end markets and activities. Over 90% of its revenues come from business customers. HSS is listed on the AIM Market of the London Stock Exchange. For more information please see www.hsshiregroup.com.

For further information, please contact:
HSS Hire Group plc Tel: 07557 491 860 (on 30 September 2021) Steve Ashmore, Chief Executive Officer Thereafter, please email: [email protected] Paul Quested, Chief Financial Officer Greig Thomas, Head of Group Finance
Teneo Tom Davies Charles Armitstead
Tel: 07557 491 860 Tel: 07703 330 269
Numis Securities (Nominated Adviser and Broker) Tel: 020 7260 1000 Stuart Skinner George Price

Chief Executive Officer’s Report
The first six months of 2021 saw our new operating model deliver well, with revenue returning to pre-COVID-19 levels despite further related government restrictions, and profitability increasing significantly above 2019 levels. Performance has been driven by the rollout of new technology (HSS Pro POS) to our salesforce, expansion of the builders merchant model and a resilient construction market. The changes made to our network in Q4 2020 have proved successful, delivering strong customer service, while reducing costs and our carbon footprint. Following on from that we have reorganised our business into two divisions, Sales Acquisition and Make it Happen, which is bringing separate focus to how we acquire customers and then fulfil their requirements.
HSS Pro POS Technology Rollout
We have continued to invest in the Brenda platform since its launch for the OneCall business in 2018. During Q1 2021 we rolled out the latest application, HSS Pro POS, to our entire salesforce. This allows them direct access to our full range of products and services, whether sourced directly from owned fleet or via our large supply chain of rehire suppliers. The platform has landed well with colleagues, being simple, quick and intuitive, and most important of all, allowing them to say “Yes!” to customers quickly for all hire enquiries.
We are already seeing HSS Pro POS deliver great results with rehire enquiries up 18%, conversion rates improved by 17ppts and a resultant 17% improvement in like-for-like Services revenue. We are also seeing better decision-making, reducing the number of high cost-to-serve and high-carbon, long-distance jobs in favour of using our rehire supply chain to offer a more efficient response to customers. This is likely to drive continued outperformance of Services revenue against Rental.
Builders Merchants Network Expansion
In H1 2021 we increased the number of builders merchant locations from 24 to 43, and at mid-September have 50 open, all of which have significantly higher footfall than a typical standalone hire location. These builders merchants are proving to be a convenient location for our customers to order and collect hire equipment, with 13% of our contracts raised in England & Wales now being done at these locations. Our network is approaching optimum size with a national footprint now in place with 14 partners. The pace of rollout will slow in H2 as we focus instead on maturing open locations and working with our partners to improve penetration with their larger customers.
Market Resilience
While some important end-user markets like retail, hospitality and airports continued to be adversely impacted by COVID-19 in H1, the lack of volume there has been replaced by strong demand in areas like housebuilding, home improvement, repair & maintenance and infrastructure. It is testament to our diversified customer base and exposure to so many end-user markets that our revenue performance remains strong. As more COVID-19 restrictions are removed we see further opportunities for growth in H2. The outlook for the market is positive with the Construction Products Association forecasting 6.3% growth in construction output for 2022 and the ONS publishing forecasts for GDP growth in 2022 averaging 5.4%.
Operating Network Changes
The changes to our operating network in October 2020 have delivered ahead of our operational and financial expectations and we are now better placed than ever to fulfil customer requirements. We believe that we have the leading national fulfilment network, offering both depth of coverage and breadth of offering across the UK and Ireland. Our directly employed operations teams have new-found focus on operating 40 well established distribution hubs, into which we consolidated the vast majority of our owned fleet. This strategically located network is fit for the future and we do not foresee any major changes, providing an opportunity for our teams to focus on delivering exceptional customer service using the new routing and scheduling technologies that we are introducing in H2.
Our network also includes fulfilment from a further 2000+ locations operated by over 500 supply partners, ranging from large multi-site generalists to small single-site specialists. Our technology platform allows these suppliers to access our enquiries and fulfil those suited to them. This gives customers access to an unrivalled level of availability in addition to lowering the cost to serve and reducing duplicated carbon footprint.
Finally, the combination of our distribution centres, local sales branches and builders merchants locations means that we now have 135 click-and-collect locations nationwide. I am pleased to report that 21% of customer orders were fulfilled this way in H1, a reflection of customer demand for this technology-driven fulfilment channel.

Business Reorganisation
Following the changes made to our operating network in Q4 2020 and the rollout of HSS Pro POS in Q1 2021, we have now reorganised our business around two divisions in order to drive superior customer service and to create clarity around performance management.
Our Sales Acquisition division comprises our directly employed field sales teams, 45 local sales branches, 50 HSS builders merchant hire counters and over 100 ProService managers. Its role is to drive revenue growth through generating enquiry volume and maximising conversion rates, while maintaining gross margins and improving digital penetration. The rollout of HSS Pro POS has enhanced cross-selling and is driving a quicker response for customers.
Our Make It Happen division comprises our directly employed operations teams in 40 distribution centres, plus the operations teams of the 500 supplier partners which operate from over 2000 locations. This division is focused on fulfilment rates, customer service measures, utilisation, cost-to-serve and returns. We now have an operating model well suited to minimise the Group’s carbon footprint going forward.
These two divisions offer customers what we believe is an unrivalled speed of response, the deepest and broadest product offering and by far the best availability in the market. It certainly appears to be working with like-for-like Services revenue up 17% in H1 (versus 2019) and Trustpilot scores of 4.3 stars.
Strategy update
We are approaching the four year anniversary of our strategy reset launched in December 2017, where we set out to: 1. Delever the Group; 2. Repair the Tool Hire business; and 3. Strengthen our Commercial Proposition. I am pleased to report that these three strategic priorities have been fulfilled and our business turnaround is complete. The business is now in great shape, delivering superior profitability and return on capital, and has a strong balance sheet. I believe we are uniquely positioned to target market share gains through outstanding service, driven by unparalleled technology and a focused organisational structure. 1. Delever the Group
Since we announced our strategy reset we have reduced our leverage (pre-IFRS16) from 4.8x to 1.7x. This is an outstanding achievement and testament to both the hard work of colleagues and the support from our Board and shareholders on key strategic decisions. The divestments of UKP, Laois and ASH have provided proceeds to reduce debt, while retaining capability and customer service through long-term commercial partnerships. Significantly improved profitability has also reduced our leverage, both through improved trading and cost reduction. In particular, the decisions taken to remove the NDEC and reduce central costs in 2018 removing circa £14m in operating costs per annum, to implement a builders merchant model starting from 2019 and to close 134 branches in October 2020 resulting in £15m annualised cost savings have all led to a leaner, more agile operating network and record returns. 2. Repair the Tool Hire business (more latterly ‘Transform’)
The original priority of improving profitability in key areas of products, branches and customers in 2018 allowed us to repair the tool hire business and then focus on transforming it into the great business we have today. The customer segmentation study in 2018 led to a new vision to become the market-leading digitally-led brand for equipment services. Our journey to make the customer proposition ‘easy’ started with the launch of our customer App in 2018, the first fully transactional App in our sector, and has more recently involved the launch of HSS Pro POS. Our employee proposition has improved too with continued improvements in engagement scores over four years and significantly improved safety performance.
3. Strengthen our Commercial Proposition
Significant progress has been made here in the last 12 months as we accelerated our strategy and created a more scalable organisation model. Our national network of Customer Distribution Centres, click-and-collect locations and supply chain partners offers superior customer choice and availability. Our successful builders merchant network rollout is built on convenience for customers and gives us access to new customers. Our technology provides colleagues with a platform that is easy to operate, allowing them to convert enquiries across the full range of hire products. We now have a scalable, agile, technology-driven proposition in place which has the opportunity to target ambitious market share gains in the next chapter of our development. We are already seeing 24% of orders transacted online.
In conclusion, our turnaround phase is complete and the business is in great shape both financially and operationally. I look forward to sharing our ambitions for the next exciting phase of business growth later in H2. Group Financial Performance Results and commentary are presented on a continuing operations basis unless otherwise noted, reflecting the impact of the strategic disposal of Laois in April 2021.
Revenue and segmental contribution
The H1 21 results are based on 27 weeks of trading whereas H1 20 is 26 weeks. Revenue growth metrics versus FY20 have been adjusted to exclude the impact of this additional week (with the adjusted metric shown in brackets). We have made comparisons to FY19 because, given COVID-19, FY20 is not a typical period for trading. All comparisons to FY19 are on a like-for-like basis, taking into account this adjustment as well as the impact of a loss of Services volume associated with the FY19 announced change to one managed service contract.
Revenue in H1 21 was £150.5m, 25% (22%) higher than the previous period (H1 20: £120.7m), which was heavily impacted by the COVID-19 pandemic and associated lockdowns in the UK and Ireland from March 2020. Since then, revenue has recovered to pre-COVID-19 levels through effective strategy implementation in an improving market as government restrictions relax. In H1 21 the Group’s revenue, on a like for like basis, was 99% of the comparable FY19 period with an improving trend over the six months.
Turning to segmental performance, Rental and related revenues were £101.7m in H1 21 (H1 20: £82.3m), 24% (21%) higher than in H1 20, and recovered to 94% of FY19 levels on a comparable basis. Contribution is up 27% at £72.0m (H1 20: £56.6m). Margin increased to 70.8% (H1 20: 68.8%) with good cost control as volume recovered and reflecting the benefit of the new operating model. H1 20 contribution benefited from around £1.6m of government furlough income, and after adjusting for the impact of this the improvement in margin rises to 3.8pp.
Services revenue has increased by 27% (24%) to £48.7m (H1 20: £38.4m). Against FY19, on a like for like basis, revenue has grown 17%, reflecting a very strong performance from the business segment with customers continuing to value the one stop shop offer through the Group’s evolving technology platforms; making it easy for customers to access all of their hire needs in one simple transaction. Contribution increased to £7.2m (H1 20: £4.9m). Margins are increased by 2.1pp at 14.9% (H1 20: 12.8%), reflecting the mix benefit of recovering Training revenue and the increased OneCall volume. H1 20 contribution benefited from around £0.6m of government furlough income, and after adjusting for the impact of this the improvement in margin rises to 3.6pp.
Costs
In October 2020 the Group implemented a new digitally-led operating model, reducing the fixed cost base by £15m. The benefit of this change is borne out by the year on year reduction in costs set out below.
Cost of sales increased to £68.3m during the period (H1 20: £60.1m) primarily as a result of the recovery in revenue following a COVID-19 related decline in our Services business during 2020. Distribution costs increased only slightly by £0.2m versus the prior year to £13.1m (H1 20: £12.9m). Costs have been tightly managed despite the increase in activity.
Administrative expenses decreased by £7.2m to £48.0m (H1 20: £55.2m) with the reduction mainly driven by the move to a digitally-led operating model noted above and the associated property and headcount related savings.
An exceptional credit of £7.5m was recognised in H1 21 largely as a result of the Group’s efforts to negotiate and complete early surrenders on stores closed as part of the changes to the Group’s operating model referenced above. The figure includes £0.9m of associated professional fees. In H1 20 an exceptional credit of £0.8m was recognised reflecting a release from onerous lease provision on adoption of IFRS16.
Net finance expenses have reduced reflecting the reduction in discount unwind following lease surrenders and the reduced interest and debt issue cost amortisation following repayments of senior finance facility debt in January and May.
Other operating income
Other operating income at £1.6m (H1 20: £6.7m) relates to £1.2m received under a COVID-19 business interruption insurance claim, a £0.2m release of provision held against Irish Temporary Wage Subsidy Scheme 2020 receipts (now that eligibility to participate in the scheme has been confirmed) and £0.1m of sublease rental income. Government support has not been taken in FY21 given the recovery of trading and strengthened balance sheet. Prior year income comprises the receipt of £6.2m in grant income as a result of participation in the UK Job Retention Scheme and a similar scheme operated in the Republic of Ireland, alongside rates grants of £0.3m and sublease rental income of £0.2m.
Profitability
Adjusted EBITDA of £38.3m in H1 21 is significantly higher than the prior period (H1 20: £27.9m); improving revenue performance delivered through the Group’s lower cost operating model being the principal driver. This has resulted in a corresponding increase in adjusted EBITDA margin of 2.3pp to 25.4% (H1 20: 23.1%).
Adjusted EBITA increased from £1.1m in H1 20 to £17.7m in H1 21 with margin increasing 10.9pp to 11.8% (H1 20: 0.9%). In addition to the drivers of EBITDA performance, depreciation of right-of-use assets materially reduced with the implementation of the new operating model.
The result of the drivers noted above is that the Group recognised a profit before tax of £11.2m versus a loss of £12.9m in the prior period.
The basic earnings per share were 1.61p in H1 21 versus a basic loss per share of 7.55p in H1 20 reflecting the large improvement in profit before tax but reduced by the significant increase in average shares in issue following the Group’s highly successful capital raise in December 2020. The diluted earnings per share were 1.55p, versus a loss of 7.55p in the prior period (when all potentially dilutive instruments were anti-dilutive).
Sale of Laois Hire Limited
To enable the Group to focus on its strategic priority to Transform the Tool Hire Business, the disposal of Laois Hire Limited, the Irish large plant hire business, to Briggs Equipment Ireland Limited (“Briggs”) completed on 7 April 2021. Proceeds of the disposal, net of transaction costs, were £10.0m generating a profit on disposal of £3.2m. As part of the transaction, HSS entered into a commercial agreement with Briggs for the cross hire of equipment to ensure the broadest possible distribution of, and customer access to, each party’s existing fleet. Accordingly, Laois has been treated as a discontinued operation. The loss from the discontinued operation was £0.3m (H1 20: loss of £21k)
The profit on disposal of Laois, net of the loss in the period, increased the profit from total operations for the financial period to £14.1m compared to a loss of £12.9m in the prior period.
Return on Capital Employed
ROCE was 24.0% reflecting the significant improvement in EBITA driven by the improvements in revenue noted above. ROCE is calculated as Adjusted EBITA divided by average capital employed, where capital employed is total assets except intangibles, derivatives and cash, less current liabilities excluding debt items.
Net debt
Net debt at 3 July 2021 was £97.6m, a reduction of £22.8m from the year end. This has been driven by improved EBITDA, strong working capital management, proceeds from the disposal of Laois and a reduction in lease liabilities following the successful surrender of closed branches. Leverage has reduced to 1.7x (pre-IFRS16 basis), ahead of the Group’s target of below 2x by the end of 2021. Leverage post-IFRS16 is 2.0x.
The debt facilities consist of a £160.8m senior finance facility, maturing in June 2023, and an undrawn revolving credit and overdraft facility of £23.2m maturing in January 2023. Including net cash balances the Group had access to £119.2m of combined liquidity at 3 July 2021.

Dividend
The Group has made great progress in reducing leverage by executing against its strategy. Reducing net debt and continuing to invest in the technology to drive better returns remain the focus for the Board. As such, it believes that the interests of the shareholders of the Group are best served by not paying a dividend at this time, a position which will be reviewed in the next twelve months.
Going concern
While encouraged by the resilience of the Group during a period of unprecedented disruption, the Directors continue to model via a number of scenarios the potential impact of COVID-19 on results. At the 26 December 2020 year end the Group had sufficient liquidity to operate within banking covenants for the next 12 months even under its reasonable worst case scenario. Actual events and trading since then have been favourable compared to the assumptions made and as a result the more recent models predict only increased liquidity from that position.
After reviewing the above, taking into account current and future developments and principal risks and uncertainties, and making appropriate enquiries, the Directors have a reasonable expectation that the Group has adequate resources to continue in operational existence over a period of at least twelve months from the date of approval of these financial statements. Accordingly they continue to adopt the going concern basis in preparing these unaudited condensed consolidated financial statements.
Risks and uncertainties
The principal risks and uncertainties that could have a material impact upon the Group’s performance over the remaining 26 weeks of the 2021 financial year have not changed significantly from those described in the Group’s 2020 Annual Report and are summarised in note 19 of this interim report.
The main risk expected to affect the Group in the remaining 26 weeks of the 2021 financial year is macro-economic conditions, which includes the impact that COVID-19 and Brexit related developments could have on the business.
By order of the Board
Steve Ashmore Director 29 September 2021
HSS Hire Group plc Unaudited condensed consolidated income statement
27 weeks ended
3 July 2021 26 weeks ended
27 June 2020 Note £000s £000s
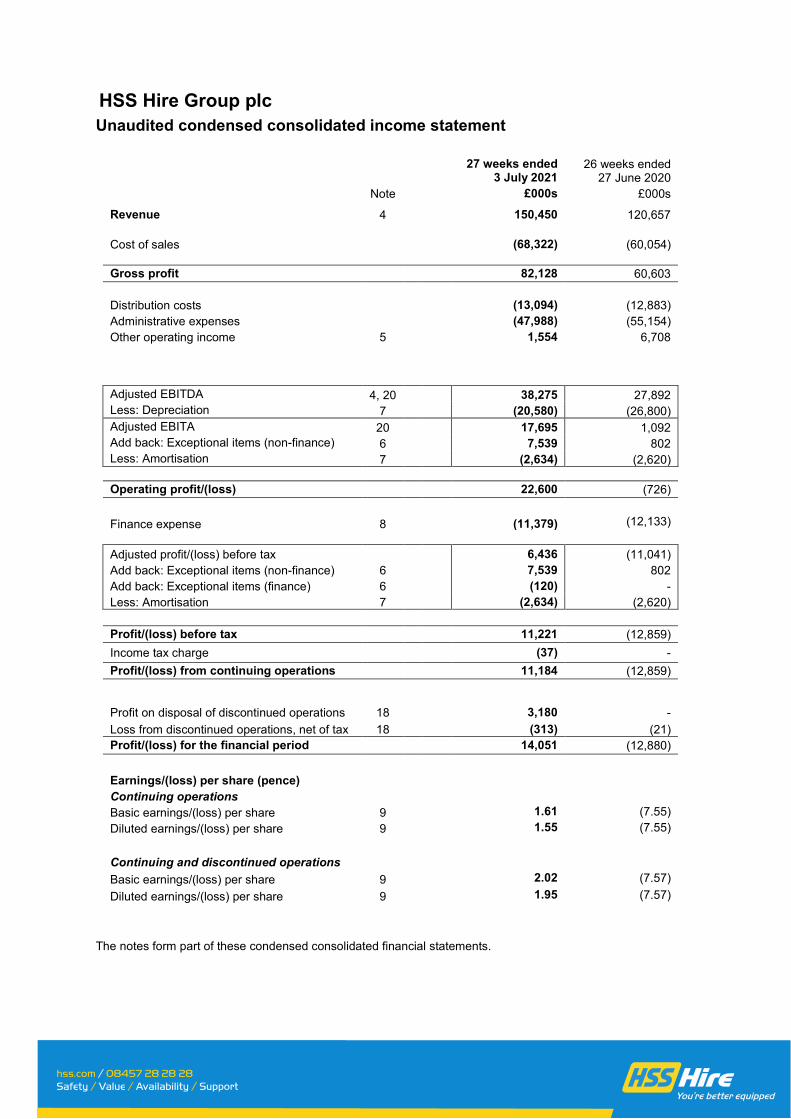
Revenue 4 150,450 120,657
Cost of sales (68,322) (60,054) Gross profit 82,128 60,603 Distribution costs (13,094) (12,883) Administrative expenses (47,988) (55,154) Other operating income 5 1,554 6,708
Adjusted EBITDA 4, 20 38,275 27,892 Less: Depreciation 7 (20,580) (26,800) Adjusted EBITA 20 17,695 1,092 Add back: Exceptional items (non-finance) 6 7,539 802 Less: Amortisation 7 (2,634) (2,620)
Operating profit/(loss) 22,600 (726)
Finance expense 8 (11,379) (12,133)
Adjusted profit/(loss) before tax 6,436 (11,041) Add back: Exceptional items (non-finance) 6 7,539 802 Add back: Exceptional items (finance) 6 (120) - Less: Amortisation 7 (2,634) (2,620) Profit/(loss) before tax 11,221 (12,859) Income tax charge (37) - Profit/(loss) from continuing operations 11,184 (12,859)
Profit on disposal of discontinued operations 18 3,180 - Loss from discontinued operations, net of tax 18 (313) (21) Profit/(loss) for the financial period 14,051 (12,880)
Earnings/(loss) per share (pence) Continuing operations Basic earnings/(loss) per share 9 1.61 (7.55) Diluted earnings/(loss) per share 9 1.55 (7.55)
Continuing and discontinued operations
Basic earnings/(loss) per share 9 2.02 (7.57) Diluted earnings/(loss) per share 9 1.95 (7.57)
The notes form part of these condensed consolidated financial statements.

HSS Hire Group plc Unaudited condensed consolidated statement of comprehensive income
27 weeks ended
3 July 2021 26 weeks ended
27 June 2020
£000s £000s
Profit/(loss) for the financial period 14,051 (12,880) Items that may be reclassified to profit or loss: Foreign currency translation differences arising on consolidation of foreign operations (654) 842 Gains arising on cash flow hedges - 86 Other comprehensive (loss)/gain for the period, net of tax (654) 928
Total comprehensive profit/(loss) for the period 13,397 (11,952)
Attributable to owners of the Company 13,397 (11,952)
The notes form part of these condensed consolidated financial statements.

HSS Hire Group plc Unaudited condensed consolidated statement of financial position
3 July
2021
26 December
2020 Note £000s £000s
ASSETS Non-current assets Intangible assets 10 155,920 158,498 Property, plant and equipment 11 60,228 62,024 Right of use assets 12 80,243 89,839
296,391 310,361
Current assets Inventories 3,366 3,183 Trade and other receivables 13 68,790 75,880 Cash 81,256 97,573
153,412 176,636
Total assets 449,803 486,997
LIABILITIES Current liabilities Trade and other payables 14 (70,049) (61,821) Borrowings 16 - (15,000) Lease liabilities 15 (19,233) (23,395) Provisions 17 (5,395) (7,448) Current tax liabilities (75) (1)
(94,752) (107,665)
Non-current liabilities Borrowings 16 (156,875) (179,099) Lease liabilities 15 (56,250) (66,177) Provisions 17 (20,363) (26,206) Deferred tax liabilities (230) (260)
(233,718) (271,742)
Total liabilities (328,470) (379,407)
Net assets 121,333 107,590
EQUITY Share capital 6,965 6,965 Share premium 45,552 45,580 Warrant reserves 2,694 2,694 Merger reserve 97,780 97,780 Foreign exchange translation reserve (639) 15 Retained deficit (31,019) (45,444) Total equity 121,333 107,590
The notes form part of these condensed consolidated financial statements.
HSS Hire Group plc Unaudited condensed consolidated statement of changes in equity
Share
capital Share
premium Warrant reserve
Merger reserve
Foreign exchange
translation reserve
Cash flow
hedging reserve
Retained earnings/
(deficit) Total
equity £000s £000s £000s £000s £000s £000s £000s £000s
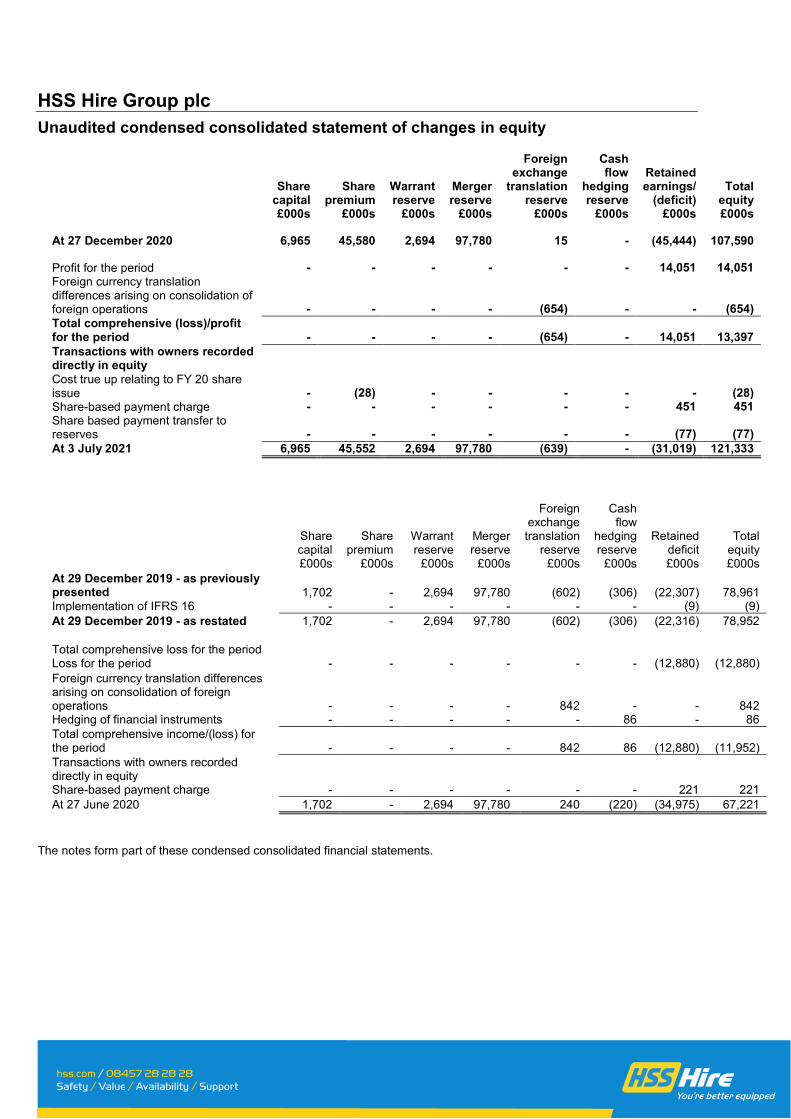
At 27 December 2020 6,965 45,580 2,694 97,780 15 - (45,444) 107,590
Profit for the period - - - - - - 14,051 14,051 Foreign currency translation differences arising on consolidation of foreign operations - - - - (654) - - (654) Total comprehensive (loss)/profit for the period - - - - (654) - 14,051 13,397 Transactions with owners recorded directly in equity Cost true up relating to FY 20 share issue - (28) - - - - - (28) Share-based payment charge - - - - - - 451 451 Share based payment transfer to reserves - - - - - - (77) (77) At 3 July 2021 6,965 45,552 2,694 97,780 (639) - (31,019) 121,333
Share capital
Share premium
Warrant reserve
Merger reserve
Foreign exchange translation
reserve
Cash flow
hedging reserve
Retained deficit
Total equity
£000s £000s £000s £000s £000s £000s £000s £000s At 29 December 2019 - as previously presented 1,702 - 2,694 97,780 (602) (306) (22,307) 78,961 Implementation of IFRS 16 - - - - - - (9) (9) At 29 December 2019 - as restated 1,702 - 2,694 97,780 (602) (306) (22,316) 78,952
Total comprehensive loss for the period Loss for the period - - - - - - (12,880) (12,880) Foreign currency translation differences arising on consolidation of foreign operations - - - - 842 - - 842 Hedging of financial instruments - - - - - 86 - 86 Total comprehensive income/(loss) for the period - - - - 842 86 (12,880) (11,952) Transactions with owners recorded directly in equity Share-based payment charge - - - - - - 221 221 At 27 June 2020 1,702 - 2,694 97,780 240 (220) (34,975) 67,221
The notes form part of these condensed consolidated financial statements.

HSS Hire Group plc Unaudited condensed consolidated statement of cash flows
Note 27 weeks ended
3 July 2021 26 weeks ended
27 June 2020
£000s £000s Profit/(loss) after income tax 14,051 (12,880) Adjustments for: – Tax 37 - – Profit on disposal of discontinued operations 18 (3,180) - – Amortisation 7 2,634 2,620 – Depreciation 7 19,398 25,294 – Accelerated depreciation relating to hire stock customer losses and hire stock write offs 7 1,766 2,324 – (Profit)/loss on disposal of property, plant and equipment and right of use assets 7 (47) 14
– Lease disposals (3,463) - – Share-based payment charge 451 221 – Foreign exchange (gains)/loss on operating activities (378) 516 – Finance expense 8 11,388 12,140 Changes in working capital (excluding the effects of disposals and exchange differences on consolidation):
– Inventories (389) 469 – Trade and other receivables 3,265 20,697 – Trade and other payables 10,217 4,154 – Provisions (6,929) (2,770) Net cash flows from operating activities before changes in hire equipment
48,821 52,799
Purchase of hire equipment 11 (9,749) (6,630) Cash generated from operating activities 39,072 46,169
Net interest paid (10,498) (8,871) Income tax repaid 7 648 Net cash generated from operating activities 28,581 37,946
Cash flows from investing activities Proceeds on disposal of business, net of cash disposed of 18 9,550 - Proceeds on disposal of fixed assets 526 Purchases of non-hire property, plant, equipment and software 10,11 (2,836) (3,411) Net cash generated from/(used in) investing activities 7,240 (3,411)
Cash flows from financing activities Costs of capital raise (1,556) - Proceeds from borrowings 16 - 17,200 Repayment of borrowings 16 (38,432) - Capital element of lease liability payments (12,279) (11,689) Capital element of net investment in sublease receipts 129 -
- Net cash (paid)/received from financing activities (52,138) 5,511
Net (decrease)/increase in cash (16,317) 40,046
Cash at the start of the period 97,573 22,658 Cash at the end of the period - continuing operations 81,256 61,626 Cash at the end of the period - discontinued operations - 1,078 Cash at the end of the period 81,256 62,704
The notes form part of these condensed consolidated financial statements.

HSS Hire Group plc Notes forming part of the unaudited condensed consolidated financial statements
1. General information
The Company is a public limited company which is listed on the London Stock Exchange and is incorporated and domiciled in the United Kingdom. The address of the registered office is Oakland House, 76 Talbot Road, Manchester, M16 0PQ. These condensed consolidated financial statements comprise the Company and its subsidiaries (the ‘Group’) and cover the 27 week period ended 3 July 2021. The Group is primarily involved in providing tool and equipment hire and related services in the United Kingdom and the Republic of Ireland. The condensed consolidated financial statements were approved for issue by the Board on 29 September 2021. The condensed consolidated financial statements do not constitute the Statutory Accounts within the meaning of Section 434 of the Companies Act 2006 and have not been subject to audit by the Group’s auditor. Statutory Accounts for the year ended 26 December 2020 were approved by the Board on 28 April 2021 and delivered to the Registrar of Companies. The auditor’s report on those accounts was unqualified and did not contain a statement under Section 498(2) or (3) of the Companies Act 2006. 2. Basis of preparation and significant accounting policies The condensed consolidated financial statements for the 27 weeks ended 3 July 2021 have been prepared in accordance with IAS 34 Interim Financial Reporting. The condensed consolidated financial statements should be read in conjunction with the Group’s Annual Report and Accounts for the year ended 26 December 2020, which were prepared in accordance with IFRS as adopted by the European Union. Accounting policies are consistent with those in the Statutory Accounts for the year ended 26 December 2020. Going concern At 3 July 2021, the Group’s financing arrangements consisted of a drawn senior finance facility of £160.8m, undrawn overdraft facilities of £6.0m, undrawn revolving credit facilities of £17.2m and finance lease lines to fund hire fleet capital expenditure, of which £14.7m had not been utilised. Both the senior finance facility and revolving credit facility are subject to a net debt leverage financial covenant test every quarter. At the balance sheet date the Group had 51% headroom against this covenant. While encouraged by the resilience of the Group during a period of unprecedented disruption, the Directors continue to model via a number of scenarios the potential impact of COVID-19 on results. At the 26 December 2020 year end the Group had sufficient liquidity to operate within banking covenants for the next 12 months even under its reasonable worst case scenario. Actual events and trading since then have been favourable compared to the assumptions made and as a result the more recent models only predict increased liquidity from that position. After reviewing the above, taking into account current and future developments and principal risks and uncertainties, and making appropriate enquiries, the Directors have a reasonable expectation that the Group has adequate resources to continue in operational existence over a period of at least twelve months from the date of approval of these financial statements. Accordingly they continue to adopt the going concern basis in preparing these unaudited condensed consolidated financial statements.

3. Restatement of interim results for 26 weeks ending 27 June 2020 During the preparation of the 26 December 2020 annual financial statements, a lease validation exercise was performed that identified the following restatements relating to the transition date. The restatement of property, plant and equipment of £4.5m represents hire stock assets held under finance lease that had not been included in the transfer to right of use assets. The remaining restatement of right of use assets relates to contractual rent escalations, rolling leases and lease term amendments. The impact of these entries on the consolidated statement of financial position as at the date of initial application (DIA) 29 December 2019 is reflected below:
As previously reported Restatement
Restated 29 December
2019 £000s £000s £000s Intangible assets 160,378 - 160,378 Property, plant and equipment 76,999 (4,460) 72,539 Right of use assets 104,059 5,472 109,531 Derivative financial instruments 14 - 14 Current assets 112,938 375 113,313 Lease liabilities (98,351) (958) (99,309) Other liabilities (238,508) (272) (238,780) Provisions (38,393) - (38,393) Deferred tax liabilities (341) - (341) Net assets 78,795 157 78,952
The impact of these entries on the consolidated statement of financial position as at 27 June 2020 is reflected below:
As previously reported Restatement
Restated 27 June
2020 £000s £000s £000s Intangible assets 159,618 - 159,618 Property, plant and equipment 71,545 (4,460) 67,085 Right of use assets 99,140 5,472 104,612 Current assets 131,007 375 131,382 Lease liabilities (96,928) (958) (97,886) Other liabilities (261,350) (272) (261,622) Provisions (35,627) - (35,627) Deferred tax liabilities (341) - (341) Net assets 67,064 157 67,221
There was no impact on the income statement or the statement of cash flow as a result of this restatement and no change is required to the financial statements for the year ending 26 December 2020.

4. Segmental reporting The Group’s operations are segmented into the following reportable segments: - Rental and related revenue; and - Services. Rental and related revenue comprises the rental income earned from owned tools and equipment, including powered access, power generation and HVAC assets, together with directly related revenue such as resale (fuel and other consumables), transport and other ancillary revenues. Services comprise the Group’s HSS OneCall rehire business and HSS Training. HSS OneCall provides customers with a single point of contact for the hire of products that are not typically held within HSS’ fleet and are obtained from approved third party partners; HSS Training provides customers with specialist safety training across a wide range of products and sectors.
Contribution is defined as segment operating profit before branch and selling costs, central costs, depreciation, amortisation and exceptional items. In the 27 weeks ending 3 July 2021 the Group recognised £0.2m of income received in 2020, the result of participation in Republic of Ireland’s COVID-19 Wage Subsidy Scheme, recognition of which had been deferred pending confirmation of entitlement (26 weeks ended 27 June 2020: £6.2m recognised from participation in UK and Republic of Ireland schemes). Income has been allocated to segments based on where the underlying costs were incurred. This resulted in £0.1m being allocated to Rental and related contribution (26 weeks ending 27 June 2020: £1.6m), £nil to Services contribution (26 weeks ending 27 June 2020: £0.6m), £0.1m to Branch and Selling Costs (26 weeks ending 27 June 2020: £3.8m) and £nil to Central costs (26 weeks ending 27 June 2020: £0.2m). £0.3m of grant income related to property rates was allocated to Branch and Selling Costs for the 26 weeks ending 27 June 2020.
All segment revenue, operating profit, assets and liabilities are attributable to the principal activity of the Group being the provision of tool and equipment hire and related services in, and to customers in, the United Kingdom and the Republic of Ireland. Revenue from one customer was 10% or more of Group Revenue in the period ending 3 July 2021 (26 weeks ending 27 June 2020: one customer was 10% or more of Group Revenue).
27 weeks ended 3 July 2021
Rental (and related
revenue) Services Central Total £000s £000s £000s £000s
Total revenue from external customers from continuing operations
101,742 48,708 - 150,450
Contribution 71,992 7,248 - 79,240 Branch and selling costs (26,115) (26,115) Central costs (14,850) (14,850) Adjusted EBITDA 38,275 Add back: Exceptional items 7,539 7,539 Less: Depreciation and amortisation (14,237) (297) (8,680) (23,214) Operating profit 22,600 Net finance expenses (11,379) Profit before tax from continuing operations 11,221
As at 3 July 2021
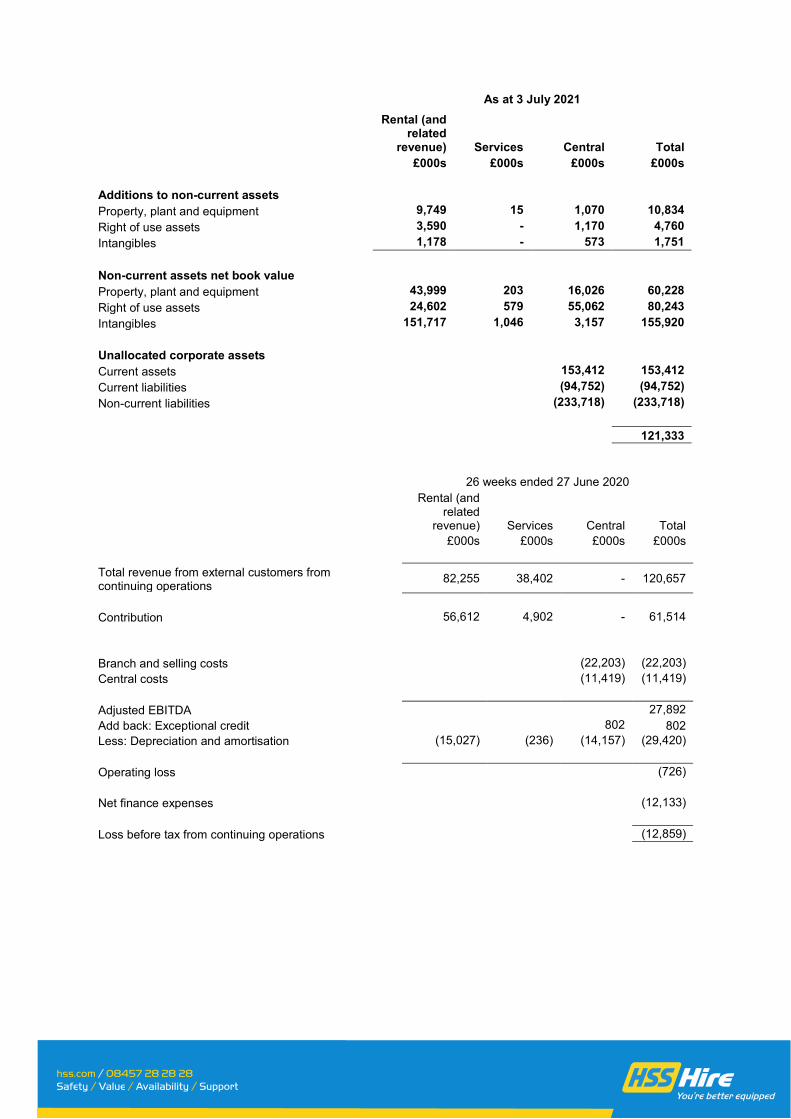
Rental (and related
revenue) Services Central Total £000s £000s £000s £000s Additions to non-current assets Property, plant and equipment 9,749 15 1,070 10,834 Right of use assets 3,590 - 1,170 4,760 Intangibles 1,178 - 573 1,751 Non-current assets net book value Property, plant and equipment 43,999 203 16,026 60,228 Right of use assets 24,602 579 55,062 80,243 Intangibles 151,717 1,046 3,157 155,920 Unallocated corporate assets Current assets 153,412 153,412 Current liabilities (94,752) (94,752) Non-current liabilities (233,718) (233,718) 121,333
26 weeks ended 27 June 2020
Rental (and related
revenue) Services Central Total £000s £000s £000s £000s
Total revenue from external customers from continuing operations 82,255 38,402 - 120,657
Contribution 56,612 4,902 - 61,514 Branch and selling costs (22,203) (22,203) Central costs (11,419) (11,419) Adjusted EBITDA 27,892 Add back: Exceptional credit 802 802 Less: Depreciation and amortisation (15,027) (236) (14,157) (29,420) Operating loss (726) Net finance expenses (12,133) Loss before tax from continuing operations (12,859)
Year ended 26 December 2020
Rental (and related
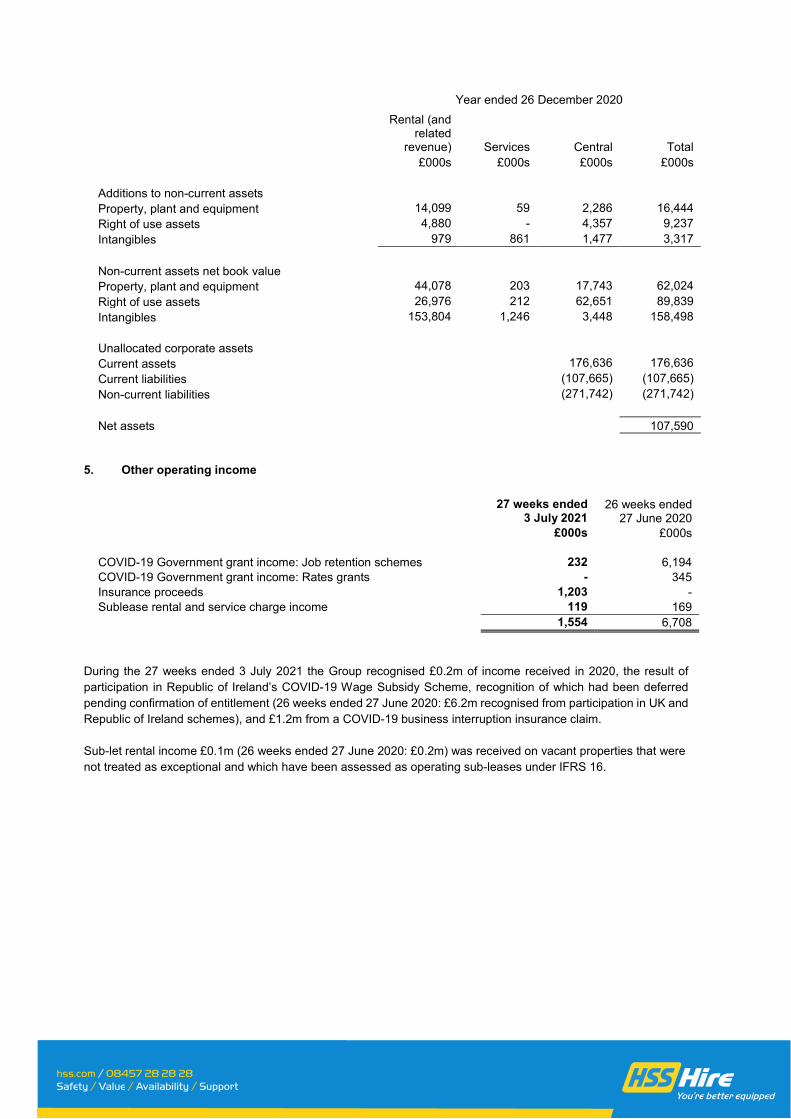
revenue) Services Central Total £000s £000s £000s £000s Additions to non-current assets Property, plant and equipment 14,099 59 2,286 16,444 Right of use assets 4,880 - 4,357 9,237 Intangibles 979 861 1,477 3,317 Non-current assets net book value Property, plant and equipment 44,078 203 17,743 62,024 Right of use assets 26,976 212 62,651 89,839 Intangibles 153,804 1,246 3,448 158,498 Unallocated corporate assets Current assets 176,636 176,636 Current liabilities (107,665) (107,665) Non-current liabilities (271,742) (271,742) Net assets 107,590
5. Other operating income
27 weeks ended
3 July 2021 26 weeks ended
27 June 2020 £000s £000s COVID-19 Government grant income: Job retention schemes 232 6,194 COVID-19 Government grant income: Rates grants - 345 Insurance proceeds 1,203 - Sublease rental and service charge income 119 169 1,554 6,708
During the 27 weeks ended 3 July 2021 the Group recognised £0.2m of income received in 2020, the result of participation in Republic of Ireland’s COVID-19 Wage Subsidy Scheme, recognition of which had been deferred pending confirmation of entitlement (26 weeks ended 27 June 2020: £6.2m recognised from participation in UK and Republic of Ireland schemes), and £1.2m from a COVID-19 business interruption insurance claim. Sub-let rental income £0.1m (26 weeks ended 27 June 2020: £0.2m) was received on vacant properties that were not treated as exceptional and which have been assessed as operating sub-leases under IFRS 16.

6. Exceptional items Items of income or expense have been shown as exceptional because of their size and nature or because they are outside the normal course of business. As a result, during the period ended 3 July 2021 the Group has recognised exceptional items as follows:
Included in administrative
expenses
Included in finance
expense 27 weeks ended
3 July 2021 £000s £000s £000s Release of onerous property costs (7,539) 120 (7,419) Exceptional items - continuing operations (7,539) 120 (7,419) Business divesture - discontinued operations (3,180) - (3,180) Total (10,719) 120 (10,599)
During the period ended 27 June 2020, the Group recognised exceptional costs analysed as follows:
Included in administrative
expenses 26 weeks ended
27 June 2020 £000s £000s Release of onerous property costs (828) (828) Cost reduction programme 26 26 Total (802) (802)
Costs related to onerous properties: branch and office closures (incurred in 2021 and 2020) An exceptional credit of £7.4m (26 weeks ended 27 June 2020 exceptional credit of £0.8m) has been recognised in the 27 weeks ended 3 July 2021. This relates mainly to the release of lease liabilities, onerous property cost and dilapidations provisions on surrender of properties following the branch closures as part of the Group’s acceleration of its digital and network strategy announced in October 2020. The figure includes £0.9m of associated professional fees. Lease liability discount unwind on closed stores totalling £0.1m was recognised as an exceptional finance expense.
In H1 20 an exceptional credit of £0.8m was recognised reflecting a release from onerous lease provision on adoption of IFRS16.
Business divesture (incurred in 2021 only) To enable the Group to focus on its strategic priority to Transform the Tool Hire Business, the disposal of Laois Hire Limited, the Irish large plant hire business, to Briggs Equipment Ireland Limited (“Briggs”) completed on 7 April 2021. Proceeds of the disposal, net of transaction costs, were £10.0m generating a profit on disposal of £3.2m. As part of the transaction, HSS entered into a commercial agreement with Briggs for the cross hire of equipment to ensure the broadest possible distribution of, and customer access to, each party’s existing fleet. Cost reduction programme (incurred in 2020 only) In the 26 weeks ended 27 June 2020 the Group recognised final costs related to a cost reduction programme which included internal restructuring that was announced and largely completed during 2019.

7. Depreciation and amortisation expense
27 weeks ended
3 July 2021 26 weeks ended
27 June 2020
£000s £000s
Amortisation 2,634 2,620 Depreciation 20,580 26,800
Amounts charged in respect of depreciation:
27 weeks ending 3 July
2021
27 weeks ending 3 July
2021
27 weeks ending 3 July
2021
26 weeks ending
27 June 2020
26 weeks ending
27 June 2020
26 weeks ending
27 June 2020
Depreciation
Depreciation
Depreciation
Depreciation
Depreciation
Depreciation
Property, plant and
equipment Right of use
assets Total
Property, plant and
equipment Right of use
assets Total £000s £000s £000s £000s £000s £000s
Depreciation (note 11,12)
7,889
11,509
19,398
12,045
12,978
25,023 Accelerated depreciation relating to hire stock customer losses and hire stock write offs (note 11,12)
6,488
133
6,621
2,324 1
2,325
Loss on disposal of other assets (note 11,12)
625
304
929
284 1
285
15,002
11,946
26,948
14,653
12,980
27,633 Less accelerated depreciation included in exceptionals (243) - (243) - - - Less disposal of Laois hire stock assets (4,612) - (4,612) - - - Less (loss)/profit on disposals included in exceptional amounts (94) 145 51 - (1) (1) Less disposal of Laois other assets (588) (439) (1,027) - - - Less depreciation from discontinued operations (413) (124) (537) (731) (101) (832) Total non-exceptional depreciation
9,052
11,528
20,580
13,922
12,878
26,800

Amounts charged in respect of amortisation
27 weeks ending
3 July 2021 26 weeks ending
27 June 2020 £000s £000s
Intangible assets
Amortisation (note 10) 2,634
2,620 Loss on disposal of intangible assets 1,695 -
4,329 2,620 Less disposal of Laois goodwill (1,695) - Total non-exceptional amortisation 2,634 2,620
8. Finance income and expense
27 weeks ended
3 July 2021 26 weeks ended
27 June 2020 £000s £000s
Senior finance facility 7,590 8,167 Debt issue costs 1,085 1,199 Accelerated amortisation of debt issue costs 166 - Lease liabilities 2,088 2,315 Interest unwind on discounted provisions 13 142 Revolving credit facility 104 75 Interest on financial instruments - 100 Bank loans and overdrafts 333 135
11,379 12,133

9. Earnings per share
Basic earnings/(loss) per share
Profit/(loss) after tax from
continuing operations
Weighted average number of shares
Profit/(loss) per share from continuing operations
£000s 000s pence 27 weeks ended 3 July 2021 11,184 696,478 1.61 26 weeks ended 27 June 2020 (12,859) 170,207 (7.55)
Basic earnings/(loss) per share is calculated by dividing the result attributable to equity holders by the weighted average number of ordinary shares in issue for that period. Diluted earnings per share is calculated using the result attributable to equity holders divided by the weighted average number of shares outstanding assuming the conversion of potentially dilutive equity derivatives outstanding, being market value options, nil-cost share options (LTIP shares), restricted stock grants, deferred bonus shares, Sharesave Scheme share options and warrants. All of the Group’s potentially dilutive equity derivative securities were dilutive (26 weeks ending 27 June 2020: anti-dilutive) for the purpose of diluted basic earnings per share for the period except for market value options and their related CSOP’s which were anti-dilutive.
Diluted earnings/(loss) per share
Profit/(loss) after tax from
continuing operations
Weighted average number of shares
Profit/(loss) per share from continuing operations
£000s 000s pence 27 weeks ended 3 July 2021 11,184 721,364 1.55 26 weeks ended 27 June 2020 (12,859) 170,207 (7.55)
The weighted average number of shares for the purposes of calculating the diluted earnings per share are as follows:
27 weeks ended
3 July 2021 26 weeks ended
27 June 2020
Weighted average number of shares
Weighted average number of shares
000s 000s
Basic 696,478 170,207 Warrants 8,505 - LTIP share options 8,368 - Restricted stock grant 7,265 - CSOP options 748 - Diluted 721,364 170,207
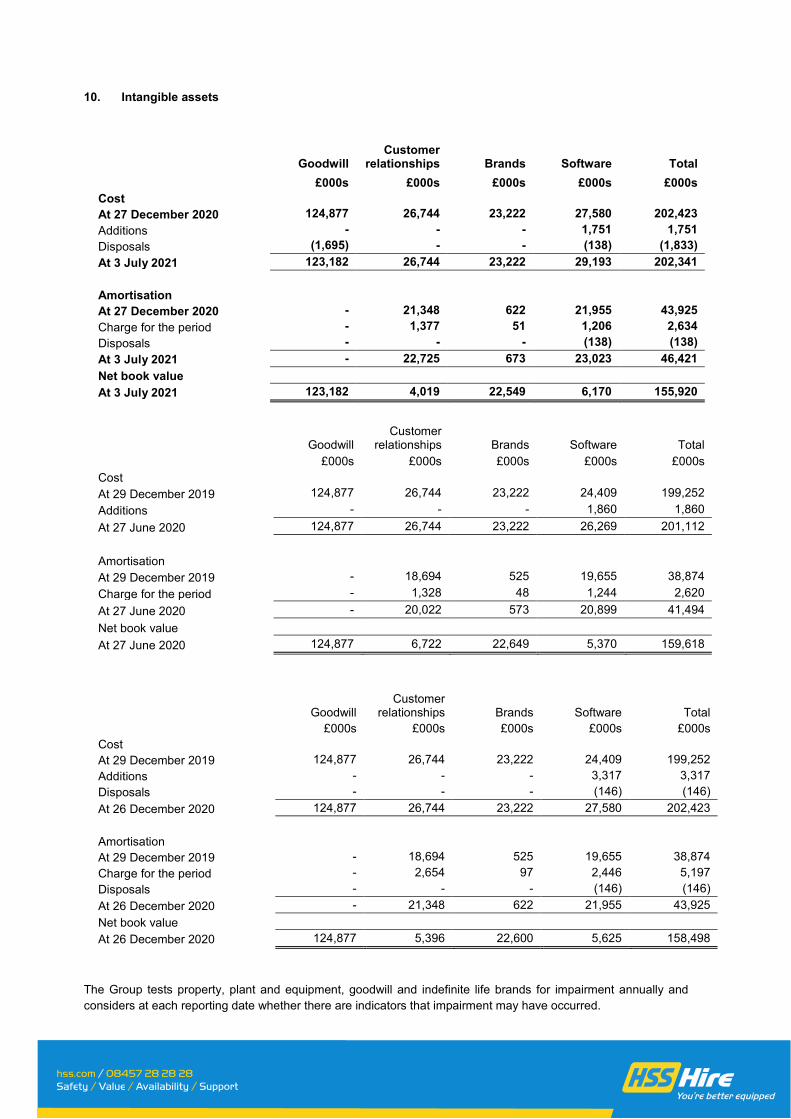
10. Intangible assets
Goodwill Customer
relationships Brands Software Total
£000s £000s £000s £000s £000s Cost At 27 December 2020 124,877 26,744 23,222 27,580 202,423 Additions - - - 1,751 1,751 Disposals (1,695) - - (138) (1,833) At 3 July 2021 123,182 26,744 23,222 29,193 202,341
Amortisation At 27 December 2020 - 21,348 622 21,955 43,925 Charge for the period - 1,377 51 1,206 2,634 Disposals - - - (138) (138) At 3 July 2021 - 22,725 673 23,023 46,421 Net book value At 3 July 2021 123,182 4,019 22,549 6,170 155,920
Goodwill Customer
relationships Brands Software Total £000s £000s £000s £000s £000s
Cost At 29 December 2019 124,877 26,744 23,222 24,409 199,252 Additions - - - 1,860 1,860 At 27 June 2020 124,877 26,744 23,222 26,269 201,112
Amortisation
At 29 December 2019 - 18,694 525 19,655 38,874 Charge for the period - 1,328 48 1,244 2,620 At 27 June 2020 - 20,022 573 20,899 41,494 Net book value
At 27 June 2020 124,877 6,722 22,649 5,370 159,618
Goodwill Customer
relationships Brands Software Total £000s £000s £000s £000s £000s
Cost At 29 December 2019 124,877 26,744 23,222 24,409 199,252 Additions - - - 3,317 3,317 Disposals - - - (146) (146) At 26 December 2020 124,877 26,744 23,222 27,580 202,423
Amortisation At 29 December 2019 - 18,694 525 19,655 38,874 Charge for the period - 2,654 97 2,446 5,197 Disposals - - - (146) (146) At 26 December 2020 - 21,348 622 21,955 43,925 Net book value
At 26 December 2020 124,877 5,396 22,600 5,625 158,498
The Group tests property, plant and equipment, goodwill and indefinite life brands for impairment annually and considers at each reporting date whether there are indicators that impairment may have occurred.

11. Property, plant and equipment
Land and buildings
Plant and machinery
Materials and
equipment held for hire Total
£000s £000s £000s £000s Cost At 27 December 2020 58,419 55,315 133,280 247,014 Transferred from right of use assets - - 5,967 5,967 Additions 673 412 9,749 10,834 Disposals (618) (1,235) (17,669) (19,522) Foreign exchange differences (31) (31) (581) (643) At 3 July 2021 58,443 54,461 130,746 243,650
Accumulated depreciation At 27 December 2020 45,208 50,580 89,202 184,990 Transferred from right of use assets - - 3,336 3,336 Charge for the year 1,318 859 5,712 7,889 Disposals (163) (1,065) (11,181) (12,409) Foreign exchange differences (6) (56) (322) (384) At 3 July 2021 46,357 50,318 86,747 183,422
Net book value At 3 July 2021 12,086 4,143 43,999 60,228
Restated Restated
Land and buildings
Plant and machinery
Materials and equipment
held for hire Total £000s £000s £000s £000s Cost At 29 December 2019 73,505 61,925 179,788 315,218 Transferred to right of use assets - - (46,888) (46,888) Additions 1,012 551 7,279 8,842 Disposals (559) (236) (9,778) (10,573) Foreign exchange differences 118 149 734 1,001 At 27 June 2020 74,076 62,389 131,135 267,600
Accumulated depreciation At 29 December 2019 54,437 55,936 102,994 213,367 Transferred to right of use assets - - (17,576) (17,576) Charge for the year 1,971 887 9,187 12,045 Disposals (343) (168) (7,454) (7,965) Foreign exchange differences 95 123 426 644 At 27 June 2020 56,160 56,778 87,577 200,515
Net book value At 27 June 2020 17,916 5,611 43,558 67,085
Refer to note 3 for further details on the restatement relating to the 26 weeks ending 27 June 2020.

Land and buildings
Plant and machinery
Materials and equipment
held for hire Total £000s £000s £000s £000s Cost At 29 December 2019 73,505 61,925 179,788 315,218 Transferred to right of use assets - - (46,888) (46,888) Transferred from right of use assets - - 3,144 3,144 Additions 1,284 1,061 14,099 16,444 Disposals (16,408) (7,748) (17,328) (41,484) Foreign exchange differences 38 77 465 580 At 26 December 2020 58,419 55,315 133,280 247,014
Accumulated depreciation At 29 December 2019 54,437 55,936 102,994 213,367 Transferred to right of use assets - - (17,576) (17,576) Transferred from right of use assets - - 1,652 1,652 Charge for the year 3,516 2,139 14,518 20,173 Impairment 1,789 227 - 2,016 Disposals (14,536) (7,592) (13,004) (35,132) Foreign exchange differences 2 40 448 490 Transfers - (170) 170 - At 26 December 2020 45,208 50,580 89,202 184,990
Net book value At 26 December 2020 13,211 4,735 44,078 62,024
‘Transferred from right of use assets’ category represents assets previously held under a lease where ownership has passed to the Group. ‘Transferred to right of use assets’ category represents the value of assets transferred to right of use assets on adoption of IFRS16.
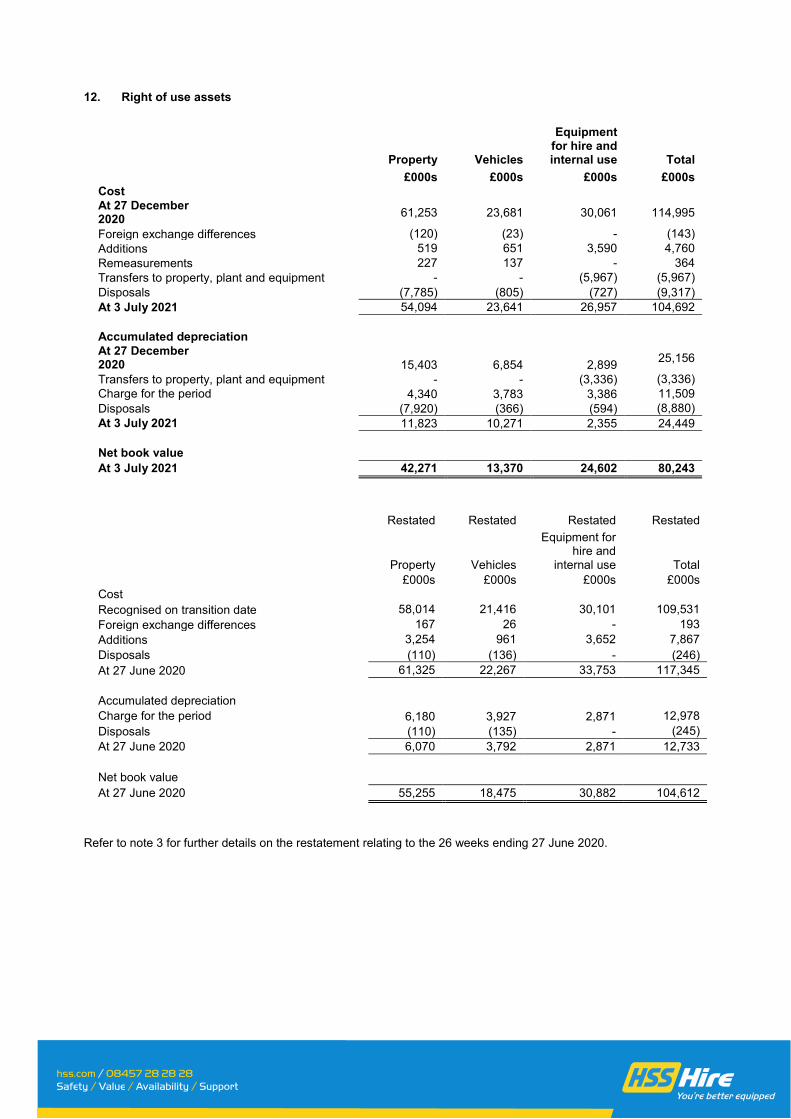
12. Right of use assets
Property Vehicles
Equipment for hire and internal use Total
£000s £000s £000s £000s Cost At 27 December 2020
61,253 23,681 30,061 114,995
Foreign exchange differences (120) (23) - (143) Additions 519 651 3,590 4,760 Remeasurements 227 137 - 364 Transfers to property, plant and equipment - - (5,967) (5,967) Disposals (7,785) (805) (727) (9,317) At 3 July 2021 54,094 23,641 26,957 104,692
Accumulated depreciation At 27 December 2020 15,403 6,854 2,899 25,156
Transfers to property, plant and equipment - - (3,336) (3,336) Charge for the period 4,340 3,783 3,386 11,509 Disposals (7,920) (366) (594) (8,880) At 3 July 2021 11,823 10,271 2,355 24,449
Net book value At 3 July 2021 42,271 13,370 24,602 80,243
Restated Restated Restated Restated
Property Vehicles
Equipment for hire and
internal use Total £000s £000s £000s £000s Cost Recognised on transition date 58,014 21,416 30,101 109,531 Foreign exchange differences 167 26 - 193 Additions 3,254 961 3,652 7,867 Disposals (110) (136) - (246) At 27 June 2020 61,325 22,267 33,753 117,345
Accumulated depreciation Charge for the period 6,180 3,927 2,871 12,978 Disposals (110) (135) - (245) At 27 June 2020 6,070 3,792 2,871 12,733
Net book value At 27 June 2020 55,255 18,475 30,882 104,612
Refer to note 3 for further details on the restatement relating to the 26 weeks ending 27 June 2020.

Property Vehicles
Equipment for hire and
internal use Total £000s £000s £000s £000s Cost Recognised on transition date 58,014 21,416 30,101 109,531 Foreign exchange differences 155 22 - 177 Additions 1,317 3,040 4,880 9,237 Remeasurements 6,931 17 - 6,948 Transfers to property, plant and equipment - - (3,144) (3,144) Disposals (5,164) (814) (1,776) (7,754) At 26 December 2020
61,253 23,681 30,061 114,995
Accumulated depreciation Transfers to property, plant and equipment - - (1,652) (1,652) Charge for the period 10,999 7,613 5,924 24,536 Impairments 9,541 - - 9,541 Disposals (5,137) (759) (1,373) (7,269) At 26 December 2020 15,403 6,854 2,899 25,156
Net book value At 26 December 2020 45,850 16,827 27,162 89,839
Right of use assets are measured at cost comprising the initial measurement of lease liability, initial direct costs and restoration costs. Right of use assets are depreciated over the lease term on a straight line basis, except where the Group has the right, and expects to exercise that right, to take ownership of the assets after the end of the lease; in such cases the assets are depreciated over the useful life. Disclosures relating to lease liabilities are included in note 15.

13. Trade and other receivables
3 July 2021 26 December 2020
Gross Provision for
impairment Net of
provision Gross Provision for
impairment Net of
provision £000s £000s £000s £000s £000s £000s Trade receivables 65,607 (5,698) 59,909 66,434 (5,374) 61,060 Accrued income 3,288 (73) 3,215 6,965 (107) 6,858 Contract assets 68,895 (5,771) 63,124 73,399 (5,481) 67,918 Net investment in sublease 1,029 - 1,029 1,497 - 1,497 Other debtors 939 - 939 3,502 - 3,502 Prepayments 3,698 - 3,698 2,963 - 2,963 Total trade and other receivables 74,561 (5,771) 68,790 81,361 (5,481) 75,880
The following table details the movements in the provision for impairment of trade receivables and other receivables:
3 July 2021
26 December 2020
£000s £000s Balance at the beginning of the period (5,481) (3,745) Movement in provision (290) (1,736) Balance at the end of the period (5,771) (5,481)
The provision for impairment of trade receivables is comprised as follows:
3 July
2021 26 December
2020 £000s £000s
Bad debt provision
(3,156) (3,023) Credit note provision (2,615) (2,458) (5,771) (5,481)
The bad debt provision based on expected credit losses and applied to trade receivables, all of which are current assets, is as follows:
3 July 2021
Current
0-60 days
past due
61-365 days
past due 1-2 years past due Total
Contract assets
57,208
5,342
4,993
1,352
68,895 Expected loss rate 1.6% 5.7% 25.5% 50.1% 4.6% Provision for impairment charge 902 302 1,274 678 3,156
26 December 2020
Current
0-60 days past
due
61-365 days past
due 1-2 years past due Total
Contract assets
61,197
5,902
4,962
1,338
73,399 Expected loss rate 1.4% 4.6% 25.7% 47.5% 4.1% Provision for impairment charge 839 272 1,276 636 3,023
Contract assets consist of trade receivables and accrued income.

The bad debt provision is estimated using the simplified approach to expected credit loss methodology and is based upon past default experience and the Directors' assessment of the current economic environment for each of the Group's ageing categories. The Directors have given specific consideration to the impact of COVID-19 on the general economy, particularly given tapering of government support. At the balance sheet date the Group has not seen a marked increase in debt write-offs. However the Group expects the situation to deteriorate as government support is withdrawn. Given the above, historical losses are not a good predictor of future failures and the Group has exercised judgement in increasing the expected loss rates across all categories of debt. In so doing the provision has been increased by around £1.2m from that which would have been required based on loss experience over the past two years. The position is being monitored closely and the Group expects to review these judgements at year-end based on ageing of debt, write-offs in the second half of the year and the economic outlook at that point. Provisions are made for credit notes expected to be raised after the reporting date for income recognised during the year. 14. Trade and other payables
3 July
2021 26 December
2020 £000s £000s
Current Trade payables 30,407 23,957 Other taxes and social security costs 5,091 5,109 Other creditors 1,603 2,300 Accrued interest on borrowings 2,785 3,442 Accruals 29,760 26,907 Deferred income 403 106 70,049 61,821

15. Lease liabilities
3 July
2021 26 December
2020 £000s £000s Current Lease liabilities 19,233 23,395 19,233 23,395 Non-current Lease liabilities 56,250 66,177 56,250 66,177
The weighted average interest rates on the Group’s lease liabilities are as follows:
3 July
2021 26 December
2020
Lease liabilities 5.2% 4.8%
The Group’s leases have the following maturity profile:
3 July
2021 26 December
2020 £000s £000s
Less than one year 22,685 27,452 Two to five years 47,342 55,544 More than five years 20,091 23,483
90,118 106,479
Less interest cash flows: (14,635) (16,907) Total principal cash flows 75,483 89,572
The maturity profile, excluding interest cash flows of the Group’s leases is as follows:
3 July
2021 26 December
2020 £000s £000s
Less than one year 19,233 23,395 Two to five years 39,909 47,030 More than five years 16,341 19,147
75,483 89,572
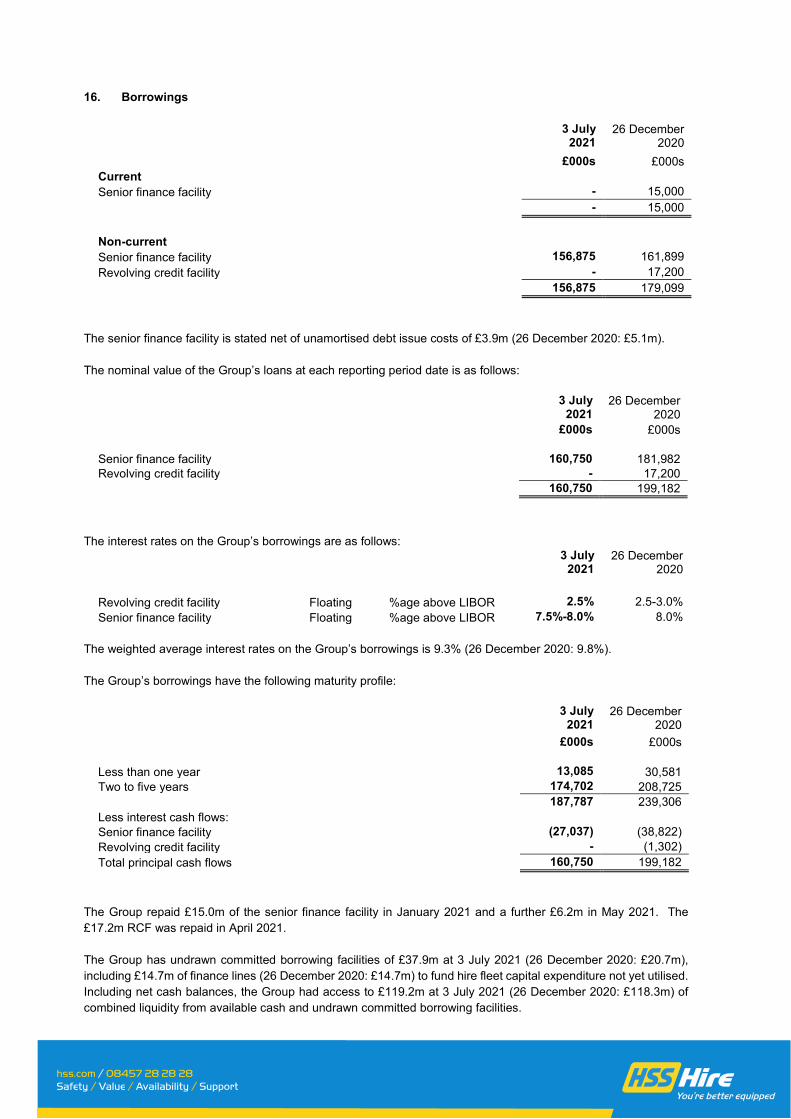
16. Borrowings
3 July
2021 26 December
2020 £000s £000s Current Senior finance facility - 15,000 - 15,000 Non-current Senior finance facility 156,875 161,899 Revolving credit facility - 17,200 156,875 179,099
The senior finance facility is stated net of unamortised debt issue costs of £3.9m (26 December 2020: £5.1m). The nominal value of the Group’s loans at each reporting period date is as follows:
3 July
2021 26 December
2020 £000s £000s Senior finance facility 160,750 181,982 Revolving credit facility - 17,200 160,750 199,182
The interest rates on the Group’s borrowings are as follows:
3 July
2021 26 December
2020
Revolving credit facility Floating %age above LIBOR 2.5% 2.5-3.0% Senior finance facility Floating %age above LIBOR 7.5%-8.0% 8.0%
The weighted average interest rates on the Group’s borrowings is 9.3% (26 December 2020: 9.8%). The Group’s borrowings have the following maturity profile:
3 July
2021 26 December
2020 £000s £000s
Less than one year 13,085 30,581 Two to five years 174,702 208,725
187,787 239,306 Less interest cash flows: Senior finance facility (27,037) (38,822) Revolving credit facility - (1,302) Total principal cash flows 160,750 199,182
The Group repaid £15.0m of the senior finance facility in January 2021 and a further £6.2m in May 2021. The £17.2m RCF was repaid in April 2021. The Group has undrawn committed borrowing facilities of £37.9m at 3 July 2021 (26 December 2020: £20.7m), including £14.7m of finance lines (26 December 2020: £14.7m) to fund hire fleet capital expenditure not yet utilised. Including net cash balances, the Group had access to £119.2m at 3 July 2021 (26 December 2020: £118.3m) of combined liquidity from available cash and undrawn committed borrowing facilities.

17. Provisions
Onerous
property costs Dilapidations Onerous
contracts Total £000s £000s £000s £000s
At 27 December 2020 3,959 12,677 17,018 33,654 Additions 147 24 - 171 Utilised during the period 268 (2,058) (1,645) (3,435) Unwind of provision - 13 - 13 Releases (3,727) (919) - (4,646) Foreign exchange - 1 - 1 At 3 July 2021 647 9,738 15,373 25,758
Of which: Current 212 1,894 3,289 5,395 Non-current 435 7,844 12,084 20,363
647 9,738 15,373 25,758
Onerous
property costs Dilapidations Onerous contracts Total
£000s £000s £000s £000s
At 29 December 2019 4,833 16,209 19,573 40,615 Eliminated on transition to IFRS 16
(2,222) - - (2,222)
Additions 5,326 1,452 - 6,778 Utilised during the period (601) (2,726) (3,330) (6,657) Unwind of provision 7 204 218 429 Impact of change in discount rate
88 747 557 1,392
Releases (3,472) (3,226) - (6,698) Foreign exchange - 17 - 17 At 26 December 2020 3,959 12,677 17,018 33,654
Of which: Current 1,328 2,823 3,297 7,448 Non-current 2,631 9,854 13,721 26,206
3,959 12,677 17,018 33,654
On the 8th October 2020, the Group announced a programme of restructuring which includes the permanent closure of around 130 of its branches. Since then, the Group has worked hard to negotiate and complete the early surrender of leases resulting in the large reduction in the value of onerous property cost and dilapidations provisions.

18. Business disposal To enable the Group to focus on its strategic priority to Transform the Tool Hire Business, the disposal of Laois Hire Limited, the Irish large plant hire business, along with its parent company Bannagroe Limited, to Briggs Equipment Ireland Limited (“Briggs”) completed on 7 April 2021. Proceeds of the disposal, net of transaction costs, were £10.0m generating a profit on disposal of £3.2m. As part of the transaction, HSS entered into a commercial agreement with Briggs for the cross hire of equipment to ensure the broadest possible distribution of, and customer access to, each party’s existing fleet. The funds from the sale are being used to invest in the hire fleet. The table below shows the assets and liabilities disposed of: Of the transaction fees included in the calculation £0.1m remains unpaid at period end. The table below shows the result of discontinued operations:
£000s Description of assets and liabilities Intangible assets (incl Goodwill) 1,695 Property, plant and equipment 5,200 Right of use assets 439 Current assets, excluding cash 2,509 Cash 504 Current liabilities (incl lease liabilities) (3,241) Foreign exchange reserve (53) Net assets disposed of 7,053 Proceeds of disposal less transaction costs 9,950 Profit on asset sale 283 Less net assets disposed of (7,053) Total profit from disposal of Laois Hire Limited 3,180
27 weeks ended
3 July 2021 26 weeks ended
27 June 2020 £000s £000s Result of discontinued operations Revenue 2,991 5,160 Expenses other than finance costs, amortisation and depreciation
(2,758) (4,342)
Depreciation (537) (832) Finance costs (9) (7) Loss from discontinued operations, net of tax (313) (21) Profit on disposal of discontinued operations 3,180 - Profit for the period 2,867 (21)
Basic earnings/(loss) per share 0.41 (0.01) Diluted earnings/(loss) per share 0.40 (0.01)

19. Risks and uncertainties The principal risks and uncertainties which could have a material impact upon the Group’s performance over the remaining 26 weeks of the 2021 financial year have not changed significantly from those set out on pages 30 to 35 of the Group’s 2020 Annual Report, which is available at https://www.hsshiregroup.com/wp-content/uploads/2021/05/HSS_ARA2020_Web.pdf. These risks and uncertainties are:
1) Macroeconomic conditions; 2) Competitor challenge; 3) Strategy execution; 4) Customer service; 5) Third party reliance; 6) IT infrastructure; 7) Financial risk; 8) Inability to attract and retain personnel; and 9) Safety, legal and regulatory requirements
COVID-19 has been considered in terms of its impact on each of the principal risks and uncertainties. The main risk expected to affect the Group in the remaining 26 weeks of the 2021 financial year is macroeconomic conditions, which includes the impact COVID-19 and Brexit could have on the prevailing demand from new and existing customers within the numerous and diverse market sectors which HSS serves.

20. Adjusted EBITDA and Adjusted EBITA Adjusted EBITDA is calculated as follows:
27 weeks ended
3 July 2021
26 weeks ended 27 June 2020
Continuing operations
Continuing operations
£000s £000s Operating profit/(loss) 22,600 (726) Add: Depreciation of property, plant and equipment 7,476 11,314 Add: Depreciation of right of use assets 11,385 12,877 Add: Accelerated depreciation relating to hire stock customer losses, hire stock write offs and other asset and right of use asset disposals
1,719
2,609
Add: Impairments of right of use assets - - Add: Loss on disposal of subleases - - Add: Amortisation of intangible assets 2,634 2,620 Add: Loss on disposal of intangible assets - - EBITDA 45,814 28,694 Less: Exceptional items (7,539) (802) Adjusted EBITDA 38,275 27,892
Adjusted EBITA is calculated as follows:
27 weeks ended
3 July 2021
26 weeks ended
27 June 2020
Continuing operations
Continuing operations
£000s £000s Operating profit/(loss) 22,600 (726) Add: Amortisation of intangible assets 2,634 2,620 Add: Loss on disposal of intangible assets - - EBITA 25,234 1,894 Less: Exceptional items (7,539) (802) Adjusted EBITA 17,695 1,092
21. Post balance sheet event On the 29th September 2021, following market close, the Group entered into an unconditional agreement to sell All Seasons Hire Limited (“ASH”), the Group’s heating, ventilation and air-conditioning (“HVAC”) hire solution provider, to Cross Rental Services (“CRS”) for a cash consideration of £55million (the “Disposal”). The proceeds from the Disposal will principally be used to accelerate the repayment of debt. As part of this transaction, HSS has entered into a commercial agreement with CRS for the cross hire of HVAC equipment to ensure the broadest possible distribution of, and customer access to, both parties existing fleets. The sale has been treated as a non-adjusting post balance sheet event.