human activity recognition with user-free accelerometers...
TRANSCRIPT

Human Activity Recognition with User-Free
Accelerometers in the Sensor NetworksShuangquan Wang
Jie YangInstitute of Image Processing & Pattern
RecognitionShanghai Jiaotong UniversityShanghai, China, 200030
E-mail: {wangshuangquan,jieyang}@sjtu.edu.cn
Abstract-Many applications using wireless sensor networks(WSNs) aim at providing friendly and intelligent services basedon the recognition of human's activities. Although the researchresult on wearable computing has been fruitful, our experienceindicates that a user-free sensor deployment is more naturaland acceptable to users. In our system, activities wererecognized through matching the movement patterns of theobjects, which tri-axial accelerometers had been attached to.Several representative features, including accelerations andtheir fusion, were calculated and three classifiers were testedon these features. Compared with Decision Tree (DT) C4.5 andMultiple-Layer Perception (MLP), Support Vector Machine(SVM) performs relatively well across different tests.Additionally, feature selection will be discussed for bettersystem performance for WSNs.
I. INTRODUCTION
The technological advances in wireless sensor networks(WSNs) enables the development of various applications,such as smart house, intelligent office and health care [1,2],which intend to provide appropriate and friendly servicesbased on the recognition of human's activities. WSNs usemany kinds of sensors for different applications, includingsound, infrared, light, temperature, accelerometer,magnetometer, etc. Because of their inherent property,accelerometers are most often employed in human activityrecognition to measure the speed and orientation changes ofhuman bodies and objects.
Since the movements of human bodies are the maincharacter of their activities, many research groups [3, 4, 5]focus their research on the wearable system. Ambulation,typing, talking and some other activities were distinguishedin [6] with five small bi-axial accelerometers. In [7] and [8],similar daily activities, such as standing, walking, climbingup/down stairs and brushing teeth, were analyzed withseveral classifiers. Paul Lukowicz et al. [9] used body wornsensors to automatically track the progress of maintenanceor assembly tasks in a wood shop. [10] measured tri-axesaccelerations in freestyle swimming on Japanese top-levelcollege swimmers to analyze and evaluate swimmers' stroke
Ningjiang ChenXin Chen
Qinfeng ZhangPhilips Research East AsiaShanghai, China, 200070
E-mail: james.nj.chen, mylan.chen,qinfeng.zhang}@philips.com
technique.Although the research result on wearable computing has
been fruitful, during our investigation, the users of thesesystems don't always feel comfortable wearing sensors. Weneed a more natural way to recognize human's activities andin a more friendly manner. In addition, human's activitiesare usually complicated and ambiguous, different with eachother. The more natural and unbending the human'sactivities are, the more difficult to recognize.Human's activities can be represented from three aspects.
1) The most direct method is identifying the movements ofhuman bodies. The wearable systems we introduced aboveare a typical representation. These wearable sensorsmounted on special places of the bodies can be used torecognize even very small activities. 2) A person's activitiescan also be detected from the movements of the objectsassociated with these activities. For example, we can inferwhether somebody is drinldng according to the movementsof a cup. No movement, no drinldng. But at the same time,deceptive movements must to be excluded through machinelearning of the classifier. 3) Person-object interaction mayprovide clues of actions from a person's approaching to,touching, or moving an object. The recognition results arenot as accurate as the first two methods. It does not extractand match the activity patterns as the second method does.
Wearable sensors are often used in health care or medicalsurveillance, for special applications. While for dailyactivity recognition, as discussed above, wearing thesesensors is uncomfortable for users. The person-objectinteraction often plays an assistant role to other information.Therefore, we focused on recognizing human's activitiesfrom the movements of the objects which keeps the usersfree of wearing any sensors. Additionally, the analysis onthe movement patterns of the object excludes the affect ofhuman's ambiguous activities.Compared with other methods, which classify a time
series based on the values of each time point, thefeature-based classification method [11] is verified to beefficient. Representative features are statistical quantities ofthe digital signal itself. The physical and inherent attributes
0-7803-9422-4/05/$20.00 C2005 IEEE1212
Authorized licensed use limited to: Yonsei University. Downloaded on March 02,2010 at 07:45:45 EST from IEEE Xplore. Restrictions apply.

of accelerometers, accelerations, are often ignored. Theseattributes enable the recognition of movement or incline ofthe accelerometer when it is moving or not. In this paper,the acceleration related features are added into the trainingand testing sets to embody the human's activities.Additionally, feature selection is also considered for bettersystem performance.
Activity recognition is formulated as a classificationproblem. That is to say, the recognition capability largelyrelies on the classification algorithm. On the one hand, thealgorithm should classify the similar actions it learned fromthe training. On the other hand, it needs to identify newunknown actions as accurately as possible. Thecross-validated test and independent data test wereemployed with three commonly used classifiers (DecisionTree (DT), Multiple-Layer Perception (MLP), and SupportVector Machine (SVM)) for these two above-mentionedaspects. The results indicated the SVM was the best one forrecognizing activities in our scenario.
The rest of the paper is organized as follows. In Section 2,we introduce the accelerometer and its recognition rationale.Feature extraction is presented in Section 3. We describe theclassification and feature selection in Section 4.Experiments and discussion on feature selection will beillustrated in Section 5 and Section 6. Section 7 concludesthe paper.
II. ACCELEROMETERS
Accelerometers are used to detect the acceleration usingthe piezoelectric technology. They can be deployed tomonitor a person's motion and allow the system give correctfeedback.
In our experimental environment, an office room, typicalactivities include writing, phoning, drinking, walking,working on the computer, and talking with others. Of allthese activities, walking can be detected by locationinformation, while working on computer and talking can bediscovered through other kinds of sensors or their fusion.Accelerometers are used to recognize writing, phoning anddrinking with their strong capability of detecting thechanges of speed and orientation. In our recognitionframework, each activity was decomposed into severalelement activities [12]. For instance, during the phoningprocess, three element activities are: someone is near thephone, sound is detected by the microphone and thetelephone receiver is picked up. Although all of theseelement activities happening simultaneously means a highprobability of phoning, the first two has no direct andinevitable evidence to prove that a phone call is being made.The most obvious proof is the position and orientationchange of the accelerometer mounted on the receiver. Thisis the same for drinking and writing. Of course, one may ask:when I move the receiver or pick it up, what will happen?Yes, we will assure that you are really phoning if its
direction and movement are similar enough with yourphoning activity in practice. Otherwise, the classifier shoulddistinguish this deceptive action.The tri-axial accelerometer we used detects and
transforms changes in capacitance into an analog outputvoltage, which is proportional to acceleration. This voltageis digitized by an on-board A/D converter and is accessedvia a Serial Peripheral Interface (SPI) [13].A linear model can be used to describe the mapping from
electrical data to acceleration [14]:Iax = kxvx + bxay = kyvy +bylaz =kzvz +bz
(1)
where vx , vy, vz are the output voltages along three axes,and ax ay, az stand for the corresponding accelerationsthe real world. kx, ky, kz denote the sensitivity parameters,which describe the gain of the sensor, and bx by, bz arethe zero-g level (offset), which describe the deviation of anactual output signal from the true output signal if there is noacceleration present.
These parameters can be determined by a simple method.Position each of the three axes of the sensor in the directionof gravity and in the opposite direction. Then for each case,note down the sensor outputs and calculate the relatedparameters directly. For example, when the x-axis is alongwith and contrary to gravity direction, the sensor outputs arevxl and vx2 respectively. The sensitivity and offsetparameters are:
k=k 2gVxl - Vx2
Lb _ kx (Vxl + vx2 )
where g is the gravitational acceleration. We set g = 9.8in our experiments.
a
tY
Gy
(a) (b)Figure 1. The Decomposition of the Acceleration along Three Axes
1213
(2)
Y,
Authorized licensed use limited to: Yonsei University. Downloaded on March 02,2010 at 07:45:45 EST from IEEE Xplore. Restrictions apply.

As we know, when the sensor is static, the totalacceleration of the sensor is due to the gravitationalacceleration, which means [14]:
a 2 +a 2 +a 2 =2 (3)The gravitational acceleration orthogonal is decomposed
along three axes (see Fig. 1 (a)). If the sensor is dynamic, theaccelerations are decompositions of the synthesization of thereal acceleration and the gravitational acceleration (see Fig. 1(b)). r is the synthesization of G and a. X, Y and Z aredecompositions of along three axes.
III. FEATURE EXTRACTION
Features were extracted from the raw accelerometer datausing a window size of 64 with 32 samples overlappingbetween consecutive windows. This window size enablesfast computation of FFTs for calculating some features.Feature extraction on a sliding window with 50% overlaphas demonstrated to be successful in previous work [15]. Ata sampling frequency of 32Hz, each window represents 2seconds. According to our experience, a much shorterwindow can't seize the activity pattern. However, if it is toolong, there will be a delayed response.
Six features were extracted from each of the three axes ofthe accelerometer. The features were: acceleration, mean,standard deviation, energy, frequency-domain entropy andcorrelation between axes. In addition, there was a fusionfeature, A, of three directions representing vibration of thesensor, giving a total of nineteen attributes.
The accelerations, as we mentioned above, are thedecomposition along three axes. In addition, the heaviervibration of the accelerometer is, the farther the value ofax2 +ay + az2 deviates from g . We use
A= ax2 +ay2 +az2 as a feature to represent the
vibration of the sensor.The DC feature is the mean acceleration value of the
sliding window [6]. Standard deviation was used tocharacterize the stability of the signal. The energy feature,which can capture the data periodicity [8], was calculated asthe sum of the squared discrete FFT component magnitudesof the signal.
Frequency-domain entropy is calculated as thenormalized information entropy of the discrete FFTcomponent magnitudes of the signal. This may help todiscriminate activities with similar energy values. Thecorrelation feature aims to find out the relationship betweenaxes in three directions [6].
It is obvious that the ranges of these features are different.The correlation ranges from 0 to 1, while energy is oftenmuch larger than 1. We normalized all features into [- 1,1]for later classification.
IV. CLASSIFICATION AND FEATURE SELECTION
A. ClassificationActivity recognition was performed using Decision Tree
(DT) C4.5, Multiple-Layer Perception (MLP) neuralnetworks, and Support Vector Machine (SVM). Theseclassifiers have been used in many activity recognitionapplications [8, 11].
These three classifiers were trained and tested in threeways for each activity. In the self-consistency test, wecombined the positive samples and the negative samples ofeach activity to form the training set. The classifiers werethen trained and tested with the same data set.
In the cross-validated test, the above data set wasrandomly partitioned into n mutually exclusive andexhaustive ones. During this test, each in the n sets was inturn taken out and all the rule parameters were calculatedbased on the remaining sets. In other words, the actionswere predicted using the rule parameters derived from allthe other actions except those being identified.
Usually the training set is limited. The generalizationcapability of the classifier is more important for recognition.We use the leave-one-subject-out validation test to evaluatethe classifier' ability to recognize unacquainted actions.Classifiers were trained on activity data for all subjectsexcept one. The classifiers were then tested on the data foronly the subject left out of the training data set. This processwas repeated for all subjects.
B. Feature SelectionIn almost all recognition applications mentioned above,
the data was processed in a centralized way. In WSNs,however, only relevant data, which was preprocessed at thenodes, was downloaded to a centralized location.Dimensionality reduction provides a scalable method forthis question where careful attention is paid to computing,communication, storage and human factors in order to usethem in a near optimal fashion.
In general, reduction methods can be divided into twomain categories. Feature selection techniques attempt toreduce dimensionality by discarding some of the originalfeatures, whereas feature transform methods attempt to mapthe original features into a lower dimensional subspace [16].For the latter, the principal component analysis (PCA) andindependent component analysis (ICA) are applied on the 24dimensional feature vector in [7]. The SVM based featureselection method [17] will be used in our experiments.
V. EXPERIMENTS AND DISCUSSION
A. System SetupThe acceleration data was collected using the KXP74
accelerometers [13]. Its sensitivity is programmed from
1214
Authorized licensed use limited to: Yonsei University. Downloaded on March 02,2010 at 07:45:45 EST from IEEE Xplore. Restrictions apply.

--2.Og to +2.0g. This can fully meet our demands, forprevious work has shown promising activity recognitionresults from ±2.Og acceleration data [18].The sensor was mounted onto the sensor board and sealed
hermetically. The sensor node attached with the sensorboard wirelessly transmitted the data via RF signal to thebase station, which is connected to the serial port of a laptopthrough an interface board and a serial cable.
For convenience, the node was fixed to the rear of thetelephone receiver for recognizing the phoning activity. Theother two were attached to the base of the cup and on the topof the pen (Fig. 2), for recognizing the other two activities.
Figure 2. The Deployment ofAccelerometers in Drinking, Phoning andWriting
B. Data CollectionThe sensor data of the accelerometer has the following
attributes: time, acceleration along x-axis, acceleration alongy-axis and acceleration along z-axis. It was collected with asampling frequency of 32 Hz and no noise filtering wascarried out.Each of these three activities was performed by four
subjects. For each activity, everyone executed two differentgroups of experiments: positive actions and negative actionsin accordance to whether this activity takes place or not,each lasted 5 minutes. Any action that represented thisactivity happening was included in the positive samples.Otherwise, they would be classed into the negative samples.During writing, for example, the subject can write on thetable or on the blackboard, slowly or fast, and any gesturehe wants. These actions were considered as writing. On thecontrary, if the subject rotated the pen with his fmgers,played with the pen randomly, all these actions wereregarded as not writing. And the same case with drinkingand phoning.When the sensor is static, the gravitational acceleration
orthogonal decomposes along three axes, which means thatif we attach the sensor on the pen laterally, when rotatingthe pen along its long axes, the decomposition changesaccordingly. The same action may present different
acceleration values along three axes when the angle betweenthe real acceleration and the gravitational accelerationchanged. The subjects were, therefore, encouraged to dopositive actions with diverse rotation angles of the pen toreduce the gravity effect. The same impact will be taken intoconsideration in drinking and phoning data collection.The subjects were asked to continuously perform each
activity, positive and negative, respectively. Accelerationdata collected between the start and stop times were labeledwith the name of that activity. The interval between twoactions was not excluded despite the fact that this activitylabel around these times may not correspond to the actualactivity.
C. Experimental ResultsIn the self-consistency test, the three classifiers all
perform well with an overall accuracy rate of more than95%. That is to say, these three classifiers are capable ofrecognizing the same data that they have learned.
In the cross-validated test, the fold number was set 10.We average the accuracy of 10 tests, and the results arelisted in Table I.
TABLE I
THE ACCURACY OF THE CROSS-VALIDATED TEST
Classifier Accuracy %Drinking Phoning Writing
DTC4.5 98.00 99.05 97.66MLP 86.95 93.00 88.41SVM 89.48 94.32 88.42
As you can see from Table I, recognition accuracy ishighest for the decision tree classifier, which got an averageaccuracy of about 98%. SVM is the second most accuratealgorithm although there is only a little difference between itand the MLP. For activities, the phoning recognition isbetter than drinking and writing recognition. This result isreasonable, because the phoning activity is comparativelysimple and the gravitational acceleration only has a littleinfluence under the constraint of the receiver orientationsand positions. For the actions learned by the classifiers, ingeneral, similar ones can also be classified correctly, by andlarge. The DT algorithm displayed strongest capability.
In the leave-one-subject-out validation test, the mean andstandard deviation for classification accuracy aresummarized in Table II.
TABLE II
THE ACCURACY (MEAN ± STANDARD DEVIATION) OF THELEAVE-ONE-SUBJECT-OUT TEST
Classifier Accuracy (%)Drinking Phoning Writing
DT C4.5 67.47 ± 7.37 81.71± 8.61 74.97 ± 3.82MLP 72.50 ± 6.45 82.25 ± 3.56 80.34 ± 4.62SVM 72.17 ± 6.21 84.28 ± 3.39 80.35 ± 5.89
1215
Authorized licensed use limited to: Yonsei University. Downloaded on March 02,2010 at 07:45:45 EST from IEEE Xplore. Restrictions apply.
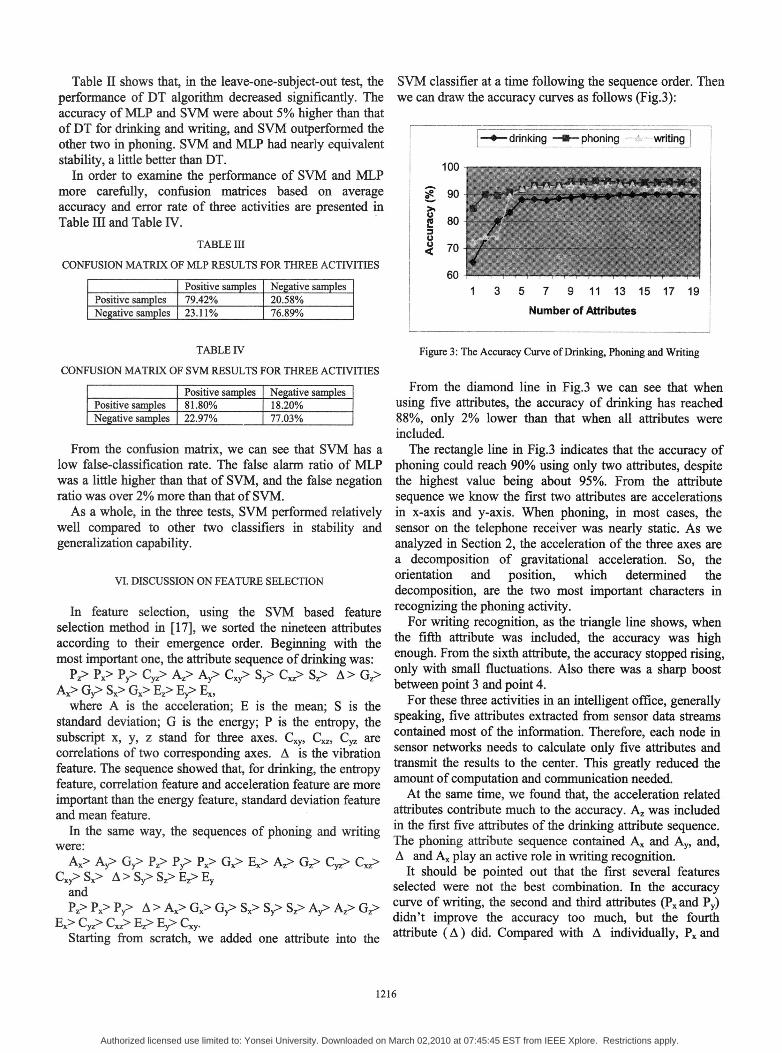
Table II shows that, in the leave-one-subject-out test, theperformance of DT algorithm decreased significantly. Theaccuracy ofMLP and SVM were about 5% higher than thatofDT for drinking and writing, and SVM outperformed theother two in phoning. SVM and MLP had nearly equivalentstability, a little better than DT.
In order to examine the performance of SVM and MLPmore carefully, confusion matrices based on averageaccuracy and error rate of three activities are presented inTable III and Table IV.
TABLE III
CONFUSION MATRIX OF MLP RESULTS FOR THREE ACTIVITIES
Positive samples Negative samplesPositive samples 79.42% 20.58%Negative samples 23.11% 76.89%
SVM classifier at a time following the sequence order. Thenwe can draw the accuracy curves as follows (Fig.3):
-4drinking ---phoning --writing
100
1-
0,
CUU.
aU
90
80
70
601 3 5 7 9 11 13 15 17 19
Number of Attributes
TABLE IV
CONFUSION MATRIX OF SVM RESULTS FOR THREE ACTIVITIES
Positive samples Negative samplesPositive samples 81.80% 18.20%Negative samples 22.97% 77.03%
From the confusion matrix, we can see that SVM has alow false-classification rate. The false alarm ratio of MLPwas a little higher than that of SVM, and the false negationratio was over 2% more than that ofSVM.As a whole, in the three tests, SVM performed relatively
well compared to other two classifiers in stability andgeneralization capability.
VI. DISCUSSION ON FEATURE SELECTION
In feature selection, using the SVM based featureselection method in [17], we sorted the nineteen attributesaccording to their emergence order. Beginning with themost important one, the attribute sequence ofdrinking was:
PZ> PX> Py> Cyz> Az> Ay> Cxy> S> Cxz> Sz> A> Gz.Ax> Gy> Sx> Gx> Ez> Ey> Ex,
where A is the acceleration; E is the mean; S is thestandard deviation; G is the energy; P is the entropy, thesubscript x, y, z stand for three axes. Cxy,, CX,Z CYZ arecorrelations of two corresponding axes. A is the vibrationfeature. The sequence showed that, for drinking, the entropyfeature, correlation feature and acceleration feature are moreimportant than the energy feature, standard deviation featureand mean feature.
In the same way, the sequences of phoning and writingwere:Ax> Ay> G?> Pz. Py> Px> Gx Ex> Az> Gz> C,z> Cxz>
Cxy> Sx> A > Sy> S> Ez> EyandPZ> PX> P,> A> Ax> Gx> Gy3> S? Sy> Sz> Ay,> Az> Gz>
ExS Cyz> Cxz> Ez> Ey>CxysStarting from scratch, we added one attribute into the
Figure 3: The Accuracy Curve ofDrinking, Phoning and Writing
From the diamond line in Fig.3 we can see that whenusing five attributes, the accuracy of drinking has reached88%, only 2% lower than that when all attributes wereincluded.The rectangle line in Fig.3 indicates that the accuracy of
phoning could reach 90% using only two attributes, despitethe highest value being about 95%. From the attributesequence we know the first two attributes are accelerationsin x-axis and y-axis. When phoning, in most cases, thesensor on the telephone receiver was nearly static. As weanalyzed in Section 2, the acceleration of the three axes area decomposition of gravitational acceleration. So, theorientation and position, which determined thedecomposition, are the two most important characters inrecognizing the phoning activity.
For writing recognition, as the triangle line shows, whenthe fifth attribute was included, the accuracy was highenough. From the sixth attribute, the accuracy stopped rising,only with small fluctuations. Also there was a sharp boostbetween point 3 and point 4.
For these three activities in an intelligent office, generallyspeaking, five attributes extracted from sensor data streamscontained most of the information. Therefore, each node insensor networks needs to calculate only five attributes andtransmit the results to the center. This greatly reduced theamount of computation and communication needed.At the same time, we found that, the acceleration related
attributes contribute much to the accuracy. Az was includedin the first five attributes of the drinking attribute sequence.The phoning attribute sequence contained Ax and Ay, and,A and Ax play an active role in writing recognition.
It should be pointed out that the first several featuresselected were not the best combination. In the accuracycurve of writing, the second and third attributes (Px and Py)didn't improve the accuracy too much, but the fourthattribute (A) did. Compared with A individually, Px and
1216
Authorized licensed use limited to: Yonsei University. Downloaded on March 02,2010 at 07:45:45 EST from IEEE Xplore. Restrictions apply.

PY contributed more to the classifier if just one attribute isused. Unfortunately, the combination of P, Py and P,contributed little to the performance. The experimentshowed that the accuracy can also reach 88% using only Pxand A. That is to say, the second and third attributes areredundant. As stated in [16], the main problem with featureselection techniques is that they are unable to find featuresthat jointly maximize a predefined criterion. It proposed amethod to select the most context features based oncalculating characteristics of the different features andcalculating similarity values for feature pairs using Gaussiankernels. On the contrary, [8] preserved valuable features byremoving the ones that were less important than others. Forus, selecting efficient features for activity recognition insensor networks via analysis of relevance and redundancy isour future work.
VII. CONCLUSION
We used the objects attached with sensors for usersduring activity recognition using WSNs. It eliminates theuncomfortable sense of wearable computing. Accelerationfeatures were analyzed in detail and tested with severalother features by three classifiers. SVM performed the bestwhen classifying the learned actions and identifying the newunknown actions with a strong stability and generalizationcapability. Feature selection was applied to select severalmost important attributes. The experiment results showedthat the accuracy of activity recognition using only fiveattributes is high enough for these daily activities. The firstfive attributes of each sequence contained severalacceleration attributes proved the validity ofthe accelerationfeature in activity recognition. While we also analyzed thelimitation of the used feature selection method, the analysisresult can guide our further work.
[8] N. Ravi, N. Dandekar, P. Mysore, M. Littman. Activity Recognitionfrom Accelerometer Data. In Proceedings of the 17th AnnualConference on Innovative Applications of Artificial Intelligence,IAAI 2005.
[9] P. Lukowicz, J.A. Ward et al. Recognizing Workshop Activity UsingBody Worn Microphones and Accelerometers. Pervasive 2004. LNCS3001, pp. 18-32, 2004.
[10] Y. Ohgi, M. Yasumura, H. Ichikawa, C. Miyaji. Analysis of stroketechnique using acceleration sensor IC in freestyle swimming. TheEngineering of SPORT, pp.503-511, 2000.
[11] A. Nanopoulos , R. Alcock , Y. Manolopoulos. Feature-basedclassification of time-series data. Information processing andtechnology. Nova Science Publishers, Inc., Commack, NY, 2001.
[12] N.J. Chen, W. Fontijn, X. Chen and Q.F. Zhang. A Framework forAmbient Applications. International Conference on SensorNetworks. Montreal, Canada, August 14, 2005.
[13] http://www.kionix.com/Product0/o20Sheets/KXP74%20Series.pdf[14] J.W. Tu, F. Liu. A Motion-Sensor-Based Interactive System. Global
Signal Processing Expo and Conference. Santa Clara, USA,September 27, 2004.
[15] R.W. Devaul and S. Dunn. Real-Time Motion Classification forWearable Computing Applications. Technical report, MIT MediaLaboratory, 2001.
[16] P. Nurmi, P. Floreen. Online feature selection for contextual timeseries data (extended abstract). Presented in the PASCAL Subspace,Latent Structure and Feature Selection Workshop, Bohinj, Slovenia,2005.
[17] G.Z. Li, J. Yang, G.P. Liu, L. Xue. Feature selection for multi-classproblems using support vector machines, In Proceedings of 8thPacific Rim International Conference on ArtificialIntelligence(PRICAI-04), Sheraton, Auckland, August 9 to August 13,LNCS3157, pp. 292-300,2004.
[18] N.Kern, B. Schiele, and A. Schmidt. Multi-sensor activity contextdetection for wearable computing. In European Symposium onWearable Computers, pp. 88-97. IEEE Press, 2003.
REFERENCES
[1] I.F. Akyildiz, W. Su, Y. Sankarasubramaniam, and E. Cayirci.Wireless Sensor Networks: A Survey. Computer Networks, vol. 38,no. 4, pp. 393-422, 2002.
[2] T. Hori , Y. Nishida et al. Sensor network for supporting elderly carehome. Proceedings of IEEE. Sensors, 2004(2), pp. 575-578.
[3] G.D. Abowd, A.K. Dey, R. Orr, J.A. Brotherton. Context-awarenessin wearable and ubiquitous computing. Virtual Reality, (3),pp.200--211, 1998.
[4] T. Stainer, B. Schiele, A. Pentland. Visual contextual awareness inwearable computing. In IEEE International Symposium on WearableComputers, Pittsburgh, October 19-20, 1998, pp. 50-57.
[5] C. Randell and H. Muller. Context awareness by analyzingaccelerometer data. In Digest of Papers. Fourth InternationalSymposium on Wearable Computers, pp. 175-176, 2000.
[6] L. Bao, and S.S. Intille. Activity recognition from user-annotatedacceleration data. In Proceedings of PERVASIVE 2004. Springer,April, 2004.
[7] J. Mantyla, J. Himberg, T. Seppanen. Recognizing Human Motionwith Multiple Acceleration Sensors. In IEEE International Conferenceon Systems, Man and Cybernetics, Tucson, USA, vol. (3494), pp.747-752, 2001.
1217
Authorized licensed use limited to: Yonsei University. Downloaded on March 02,2010 at 07:45:45 EST from IEEE Xplore. Restrictions apply.