human capital dynamics in three … capital dynamics in three technology platforms: ... biovac ......
TRANSCRIPT
Human Sciences Development Policy Sociology of Work Research Council Research Unit Unit
RESEARCH CONSORTIUM
________________________________________________________________
HUMAN CAPITAL DYNAMICS IN THREE TECHNOLOGY PLATFORMS: NUCLEAR,
SPACE AND BIOTECHNOLOGY
Sector Studies
Research Project
MARCH 2008
RESEARCH COMMISSIONED BY DEPARTMENT OF LABOUR
SOUTH AFRICA HUMAN CAPITAL DYNAMICS IN THREE TECHNOLOGY PLATFORMS:
NUCLEAR, SPACE, AND BIOTECHNOLOGY

1
Jo Lorentzen and Il-haam Petersen
This draft: February 2008


CONTENTS INTRODUCTION ..................................................................................................1 PART 1: NUCLEAR .............................................................................................2
1 SECTORAL PROFILE .................................................................................3 Nuclear power in the world ..............................................................................3
The technology ............................................................................................4 Major competitors ........................................................................................6 Nuclear power and public opinion................................................................6
Nuclear power in South Africa.........................................................................6 Introduction ..................................................................................................6 Policy............................................................................................................7 Legislation and regulation............................................................................9 Knowledge infrastructure .............................................................................9 Skills development .................................................................................... 10 Global knowledge networks...................................................................... 10 Regional power demand........................................................................... 11 PBMR........................................................................................................ 11 Market prospects of the PBMR................................................................. 12
2 THE DEMAND FOR SKILLS .................................................................... 13 Introduction ................................................................................................... 13 The nature and magnitude of the demand for skills ..................................... 13 Summary ...................................................................................................... 22
3 THE SUPPLY OF SKILLS ........................................................................ 22 The stock of engineers and scientists .......................................................... 22 The pool of new engineering specialists ...................................................... 25
Graduates ................................................................................................. 25 Enrolments ................................................................................................ 31
Targeted initiatives in the nuclear sector...................................................... 39 Summary: Is supply sufficient given the level of demand? .......................... 41
4 CASE STUDIES........................................................................................ 43 Introduction ................................................................................................... 43 Nuclear Consultants International ................................................................ 43 Westinghouse South Africa .......................................................................... 45 Eskom........................................................................................................... 48 Summary ...................................................................................................... 51
5 RECOMMENDATIONS............................................................................. 52 PART 2: SPACE ................................................................................................54
1 SECTORAL PROFILE .............................................................................. 55 Space science and technology in the world ................................................. 55
Space technology and public opinion ....................................................... 57 Space science and technology in South Africa ............................................ 58
Introduction ............................................................................................... 58 Policy......................................................................................................... 62 Legislation ................................................................................................. 63 International space collaboration .............................................................. 64

ii
Knowledge infrastructure .......................................................................... 65 Southern African Large Telescope (SALT)............................................... 68 The Square Kilometer Array (SKA)........................................................... 71
2 SKILLS: DEMAND AND SUPPLY ............................................................ 78 Introduction ................................................................................................... 78 The nature and magnitude of the demand for skills ..................................... 78 The nature and magnitude of the supply of skills......................................... 80 The stock of space specialists...................................................................... 80
Graduates ................................................................................................. 80 New entrants into the sector......................................................................... 86
Enrolments ................................................................................................ 86 Targeted initiatives in astrophysics and space science ............................... 93
3 CASE STUDIES........................................................................................ 97 Introduction ................................................................................................... 97 SALT............................................................................................................. 97 MeerKAT..................................................................................................... 101 Summary .................................................................................................... 105
4 RECOMMENDATIONS........................................................................... 106 PART 3: BIOTECHNOLOGY ...........................................................................107
1 SECTORAL PROFILE ............................................................................ 108 Introduction ................................................................................................. 108 Biotechnology in the world.......................................................................... 108 Biotechnology in Africa ............................................................................... 109 Biotechnology in South Africa .................................................................... 110
Background............................................................................................. 110 Policy....................................................................................................... 111 Institutions and regulatory framework..................................................... 112
2 THE DEMAND FOR SKILLS .................................................................. 113 Introduction ................................................................................................. 113 The nature and magnitude of the demand for skills ................................... 113 Summary .................................................................................................... 113
3 THE SUPPLY OF SKILLS ...................................................................... 115 The stock of biotechnology specialists ....................................................... 115
Graduates ............................................................................................... 115 The pool of emerging biotechnology specialists ........................................ 123
Enrolments .............................................................................................. 123 Skills developments at the top end............................................................. 132 Summary: Is supply sufficient given the level of demand? ........................ 135
4 CASE STUDIES...................................................................................... 138 Introduction ................................................................................................. 138 Biovac ......................................................................................................... 138
History ..................................................................................................... 138 Current activities ..................................................................................... 138
The Centre for Proteomic & Genomic Research (CPGR).......................... 141 5 Recommendations .................................................................................. 143
REFERENCES .................................................................................................144
1
INTRODUCTION Why undertake big science in a developing, middle-income country such as South Africa? Critics might see the requisite investments as a zero-sum game – every Rand spent on advanced technology platforms is a Rand less spent on the alleviation of the most dramatic manifestations of underdevelopment afflicting large parts of the population: hunger, disease, unemployment, lack of services, and so on. In addition, they might argue that these investments are a waste of money in that a developing economy must stick to its guns rather than dabble in activities that are simply too big for its shoes. Although there is some merit to these considerations, things are not quite as simple. One, advances in earth observation can in principle of course alert poor, subsistent rural populations to adverse weather conditions, much like developments in green biotechnology can help them cope with and adjust to them. Two, although it is true that catch-up is initially based on technological accumulation through adoption and adaptation, there is a point at which latecomer countries must venture into frontier activities so as to graduate to a higher level of technological sophistication. Hence what matters is striking a judicious balance between big science and the other developmental activities in support of catch-up. Much like an exclusive focus on big science would be mistaken, its complete neglect would also likely deprive the country of development opportunities. In essence, therefore, the justification or otherwise of the degree of big science support is an empirical question. In South Africa, big science was made part of the reconstituted national innovation system from the very beginning and has become more prominent ever since. It co-existed somewhat uneasily with lower-tech activities in national innovation strategy documents that were remarkable more for the range of activities they proposed to cover as opposed to the focus they established on selected activities (see DST 1996). This report does not address the trade-off between big science and other developmental activities. Instead, it focuses on a narrower question of efficiency, namely whether the country commands the kinds of human capital required to make big science work. This report focuses on human capital dynamics in three technology platforms: nuclear, space, and biotechnology. Each of these activities generates demand for skill and competences that are not always available in the country and for which South Africa at least in part competes against the rest of the world. For each platform, the report firstly reviews pertinent characteristics and trends for the platform and establishes the relationship between the demand for and the supply of skills, and finally concludes with recommendations.

2
PART 1: NUCLEAR*
* We are grateful to Carmen Adams, Elmari Bester, Shirley Crawford, Chris Hodgson, Velaphi Msimang, Sean Phillips, Johan Pienaar, Dries Van Schalkwyk, Derik Wolvaardt for their generous help in providing us with information that was essential to completing this study.

3
1 SECTORAL PROFILE1
Nuclear power in the world South Africa is one of 30 countries worldwide making use of nuclear power which in 2006 provided some 15-16 per cent of the world’s energy, or 370 GW(e). This compares to 40 per cent for coal, 10 per cent for oil, 15 per cent for natural gas, and 19 per cent for hydro and other forms. Due to population growth and rising living standards, especially in developing countries, as well as a political commitment to extend electricity to the two billion people currently without access to it, the demand for primary energy and electricity is forecast to grow by 54 and almost 100 per cent, respectively, between 2004 and 2030. The current and future expansion of nuclear power is focused in Asia. Yet newcomers to the industry exist elsewhere as well; Belarus, Egypt, Indonesia, Nigeria, and Turkey have recently made announcements to this effect. The renewed interest in nuclear power – although fraught with considerable uncertainty – is based on the increasing realization that meeting this demand through fossil fuels would exact too high a price on the environment (IAEA 2007). The generation of nuclear power does not produce carbon dioxide emissions (although the total fuel cycle of course does), and uranium fuel is in relatively ample supply. Nuclear power is therefore an attractive generation option for base-load electricity, especially since renewables and energy saving mechanisms at least to date do not seem to be able to accommodate in total the projected increase in demand. Internationally discussions are under way under the Kyoto Protocol to consider including nuclear power in the clean development mechanism aimed at curbing greenhouse gas emissions. According to the 2007 report of the Intergovernmental Panel on Climate Change (IPCC), the world will only manage to restrict temperature increases to below three degrees Centigrade if non-carbon electricity generation grows to about half (from currently a third) of the total energy mix by 2030. This would translate roughly into a doubling of nuclear energy output. Projections by the International Atomic Energy Agency (IAEA) reckon with some 60 new plants over the next 15 years. In addition, in some countries existing reactors are uprated to increase capacity by up to 30 per cent; plant lives have also been extended. But even without the internalization of environmental costs, nuclear energy is in many places already cost-competitive with fossil fuels in the generation of electricity. This is despite the fact that nuclear plants are much more expensive to build than coal or gas plants and always incorporate waste disposal and
1 This section is largely based on background material and data assembled by the International Atomic Energy Association (www.iaea.or.at), OECD/IEA (2006), the Nuclear Energy Corporation of South Africa (NECSA; www.necsa.co.za), and the World Nuclear Association (www.world-nuclear.org).

4
decommissioning costs. A series of recent studies, undertaken among others by the European Commission and the OECD, showed that when plausible financial figures are put against environmental damage from different forms of electricity production, the kWh charge incurred by nuclear lies by a multiple below that of coal and gas. This is helped by the reduction in cost of nuclear power generation over the last decade, thanks to lower fuel (including enrichment), operation and maintenance costs, especially of course when plants concerned have been paid for. As for new plants, however, it is worth noting that delays in completion periods will push up financing costs, and might indeed do so spectacularly. It is also important to realize that the relative competitiveness of nuclear power is situation specific; it depends on the level and growth of electricity demand in a country, market structure and investment environment, environmental constraints, and risks associated with possible regulatory or political changes. The world supply of uranium is dominated by Canada (25%), Australia (19%), and Kazakhstan (13%). At the beginning of the decade, South Africa supplied about 2.3 per cent; in 2006 its share was down to 1.3 per cent. However, seven to ten per cent of the world’s currently known recoverable uranium reserves are in South Africa, making the country the fourth richest source, jointly with the US, behind Canada, Kazakhstan, and Australia. Global demand for uranium amounts to about 77,000 tons annually. At current use rates and technologies, known reserves would last about 70 years. Due to relatively little exploration in the past 20 years, an increase in exploration could conceivably lead to considerably upwardly revised estimates of reserves. In fact, annual production of new-mined uranium amounts to only some 3,000 tons (www.anglogold.co.za). Annual exploration expenditures in 2006 were more than three times higher than in 2001. Likewise, technological progress can of course extend existing resources. The market for uranium is expected to grow slightly over the next decade. In 2006, uranium spot prices reached $72/lb U3O8 and were thus ten times higher than their historic low in 2000 (IAEA 2007).2 Trends in the future will depend on new commissions as well as retirement of older plants. Eight companies control about 85 per cent of the market (Cameco, Rio Tinto, Areva, KazAtomProm, TVEL, BHP Billiton, Navoi, Uranium One).
The technology Nuclear power is generated by the production and controlled release of energy from splitting atoms of certain elements in a reactor. The resulting energy is used in the form of heat to produce steam which in turn drives the turbines that produce the electricity. There are three different technologies, namely water-cooled, gas-cooled, and liquid-metal-cooled reactors. At the end of 2006, 435 reactors were in operation. Worldwide 27 countries currently operate 355 light-water reactors, with another 22 currently under construction. 38 heavy-water 2 In long-term contracts in which uranium is normally traded, prices rose from $7/lb to $33/lb.

5
moderated reactors which can potentially burn the spent fuel from light-water reactors and thus reduce waste, exist in seven countries, and eight more are under construction. Water-cooled reactors make up the bulk of reactor technology, generating about 336 GW(e) which amounts to more than four fifths of total nuclear energy. Gas-cooled reactors, of which the South African Pebble-Bed Modular Reactor (PBMR) is one example, have also been around for many years but only 26 exist worldwide. There are only three liquid-metal-cooled reactors in operation. They are also referred to as “breeders” because they produce their own fuel supply. This technology harbors potential to reduce long-lived waste material. While most of these reactors have an average size of 1000 MW(e), about a third of all reactors in the world are small or medium-sized, with a generating capacity not exceeding 300MW(e) and 700MW(e), respectively. These plants are especially appropriate for countries with smaller grids, fewer resources, and generally for newcomers to nuclear energy, including developing countries. The PBMR belongs in this category. Small reactors can be built independently or as modular parts of larger units. They are thought of as combining simplicity of design, economies of scale, reduced siting costs, and a high level of passive safety features. One can distinguish among four generations of reactors. Generation I reactors hail from the 1950s and 1960s the majority of which have been decommissioned. Most of the reactors currently in operation belong to Generation II. A few advanced Generation III reactors exist in Japan, others are being constructed elsewhere. The PBMR belongs in this category. Generation IV reactors, such as fast neutron reactors, exist to date only as blueprints and are unlikely to be operational for another decade and a half or so. Their major departure from traditional designs is that they will have closed fuel cycles, reducing the high-level waste they produce. The nuclear fuel cycle begins with the mining of uranium ore. Uranium oxide concentrate (“yellow cake”) is produced through milling where the uranium is extracted from the ore. The concentrate is first converted to uranium dioxide and eventually to uranium hexafluoride. An enrichment process produces a higher concentration of the fissile material in the uranium. The resulting enriched uranium oxide is turned into ceramic pellets which are encased in fuel rods. The fission that takes place in the reactor releases energy which is used to heat water and turn it into steam that in turn powers a turbine and subsequently a generator. In this process reactors also produce plutonium whose fission contributes to the release of energy. Excess heat is given off to large volumes of water (e.g. the sea or rivers) or to cooling towers. After one or two years spent fuel is removed from the reactor. It can either be reprocessed which has consequences for the kind of waste produced, or

6
destined for permanent disposal. To date about one third of the world’s discharged spent fuel has been reprocessed. To date there is no solution for permanent disposal which due to the extremely long half-life times of spent fuel has implications for thousands of generations. Current thinking is to use geological repositories.
Major competitors The world reactor supply market is dominated by three alliances:
• Areva (France) and Mitsubishi Heavy Industries (Japan) • General Electric (US) and Hitachi (Japan) • Westinghouse (US) and Toshiba (Japan) (Westinghouse has de facto
become a subsidiary of Toshiba.)
Nuclear power and public opinion Nuclear power has always been a contentious technology because of the huge inherent risks associated with radiation. In large parts of Europe public opinion became decidedly anti-nuclear following the nuclear accident at Chernobyl in the Ukraine in 1986. Subsequently many European governments decided to halt their nuclear programmes and phase out nuclear power. Although this policy could in principle be reversed, it is clearly too simple to say that the challenges to combat climate change will automatically lead to a multiple increase in the share of the world’s energy generated by nuclear power. In this light some of the extremely optimistic forecasts of the global nuclear industry appear somewhat spurious. In South Africa, Earthlife led a successful challenge against the Environmental Impact Assessment of the PBMR demonstration reactor. Both the City of Cape Town and the Provincial Government of the Western Cape have voiced reservations about the PBMR. Hence, nuclear energy is contentious, and this is likely to have an impact on demand for this technology both globally and in the country itself.
Nuclear power in South Africa
Introduction South Africa’s foray into nuclear power started in the 1980s. The country derives about 90 per cent of its primary energy from coal. In fact, South Africa is the world’s fifth largest producer of coal and among the cheapest producers of energy. Yet coal reserves are located some 1,500kms from Cape Town, an important load centre in the country. Studies undertaken in the 1970s determined that it would be cheaper to build a nuclear power plant than a coal-fired plant in

7
the Western Cape or than transmitting power to the Cape through transmission lines. The Koeberg Nuclear Power Plant, located some 35kms north of Cape Town and consisting of two pressurized water reactors, each with a capacity of 900MW, was built by French Framatome and commissioned in 1984. The design life of the plant is 40 years. Eskom owns and operates the plant which supplies about 5-6 per cent of total electricity to the country. Koeberg employs about 1,200 people. Off-site jobs amount to 600, plus there are 2,000 jobs in the nuclear supplier industry. About 100 non-nuclear firms supply equipment to Koeberg. Initially South Africa also maintained conversion, enrichment, and fuel element fabrication facilities in order to guard itself against the possible impact of sanctions against fissile fuel. With the normalization of the country’s international position, these facilities have since been discontinued. In light of the country’s new nuclear policy they are currently being revisited, about which more below. Upstream the country processes uranium rich slurries produced as a by-product of gold or copper mines. This has traditionally been in the hands of the Nuclear Fuels Corporation of South Africa (NUFCOR), a subsidiary of AngloGold Ltd. NUFCOR operates a processing facility in Westonaria near the town of Carletonville in the North West Province where it turns uranium rich slurries into an annual production of about 1,000 tonnes of uranium oxide powder which is subsequently marketed and shipped to local and international utilities. In the future, this could be increased by 300 tonnes (www.anglogold.co.za). Multinational companies that have recently become active in South African uranium mining include Uranium One, UraMin Inc., and First Uranium Corp. Radiation protection and waste management is provided by RADPRO, a NUFCOR subsidiary. Low and intermediate level waste from Koeberg is stored at the national radioactive waste repository at Vaalputs in the Northern Cape Province. Spent fuel is kept on site at Koeberg.
Policy The 1998 White Paper on Energy Policy (DME 1998) identified a number of policy objectives of which a few are directly relevant, albeit not explicitly so, to nuclear energy. For example, the document supported the diversification of primary energy sources and stated that government policy is to encourage energy prices to be as cost-reflective as possible, including quantifiable externalities. It further committed government towards using electric power for social progress as well as to the establishment of targets for the reduction of energy-related emissions that are harmful to the environment and to human health. Both these latter aims are given renewed emphasis through increased international awareness of the climate-change inducing use of non-renewables.
8
The operation of a nuclear power plant does not produce carbon emissions, quite unlike traditional coal-fired power stations. The Draft Nuclear Energy Policy and Strategy of July 2007 supports nuclear power much more explicitly (DME 2007), partly to mitigate the effects of climate change. It provides for an ambitious programme encompassing the entire nuclear fuel cycle. This involves the (re-)activation of conversion, enrichment, fuel fabrication, and reprocessing of used fuel, all in view of guaranteeing energy security, contributing to job creation and skills upgrading, and attaining global leadership in the nuclear energy sector. It also calls for an increase in the local beneficiation of uranium ore concentrates, whether for local use or for export. South Africa is not the only country considering reviving or exploring enrichment programmes; Argentina and Australia have made similar announcements, Brazil has already opened its Resende facility, while both the US and France have started work on an enrichment facility. According to the Policy, by 2016 South Africa should be engaged in local manufacturing of nuclear components and equipment, and the PBMR should be commercialized and ready for export. All of this amounts to a construction programme of some 12 large pressurized water reactor (PWR) units and 24 PBMRs. In order to support an indigenous capability to manufacture to nuclear standards, the government has provided funding to NECSA to set up a National Nuclear Manufacturing Centre (NNMC). Government support is further pledged for the development of human resources capable of managing the nuclear infrastructure including in conjunction with universities, an industrial support base and technology transfer, a national nuclear architectural capability, and related tasks. Skills development is a responsibility accepted by each IAEA member state under the Convention on Nuclear Safety which aims to stem the loss of tacit knowledge due to workforce aging. Article 11.2 states that “[e]ach Contracting Party shall take appropriate steps to ensure that sufficient numbers of qualified staff with appropriate education, training and retraining are available for all safety-related activities in or for each nuclear installation, throughout its life” (IAEA 2004, 22). It is clear that the South African government is taking a major bet on nuclear technology and especially on the PBMR. So far the country has invested almost R5bn on a project whose demonstration plant and fuel facility are currently thought to cost about R16bn, a figure that can easily go up (Davie 2007). In early 2006 the government announced that it was considering building an additional conventional unit, possibly on the Koeberg site, to alleviate supply constraints in the Western Cape. Similarly, in early 2007 Eskom included 20 GW(e) of new nuclear capacity in its plan to double generating capacity to 80 GW(e) by 2025. This would increase the share of nuclear in total power generation to 25 per cent. The first phase provides for the construction of a 4 GW(e) PWR (like the current Koeberg model), which is hoped to be
9
commissioned in 2016. The environmental assessment process is looking at five sites. The exact reactor technology as well as the manufacturer still need to be chosen.
Legislation and regulation Regulatory control over the industry lies with the National Nuclear Regulator (NNR) whose primary function is nuclear safety, in terms of the Nuclear Energy Act (Act No.46 of 1999) and the National Nuclear Regulator Act of 1999 (Act No.47 of 1999). The Nuclear Energy Corporation (NECSA), a public company owned by the state in terms of the Nuclear Energy Act, operates and manages the repository at Vaalputs. Radioactive waste management is regulated by the Radioactive Waste Management Policy and Strategy for the Republic of South Africa, issued in 2005. Overall responsibility for nuclear energy lies with the Department of Minerals and Energy (DME) which administers the two Acts. The Department of Environmental Affairs (DEA) controls environmental assessments of nuclear projects.
Knowledge infrastructure NECSA undertakes research and development for use in industry, foodprocessing, the medical field, and nuclear energy. It operates a 20MW research reactor, Safari I, at Pelindaba. It processes source and other special materials. Other prominent research institutes include the Schonland Research Centre for Nuclear Sciences at Wits [UPDATE] and the iThemba Laboratory for Accelerator-Based Sciences with a site each in Gauteng and the Western Cape both of which perform research in radiation medicine but also more generally in nuclear science and technologies, including electrical power generation. The country’s foremost centre on training and research in nuclear energy is located at the Potchefstroom Campus of North-West University which has been involved with the PBMR since 1997. It is the first university in the country to have been awarded a chair in Nuclear Science and Engineering by DST and PBMR. It organizes continuing professional development courses in nuclear engineering and high temperature gas reactor technology. It hosts the Post-graduate School of Nuclear Science and Engineering which specializes on training graduates for the PBMR project and the nuclear energy sector more generally, offering masters courses in nuclear engineering and engineering sciences. Since its inception in 2000, it has awarded more than 60 masters degrees and currently trains 54 students, 40 of whom are involved in research in support of the PBMR project, funded both by the PBMR and THRIP. The faculty is planning the introduction of an undergraduate degree as well as a postgraduate diploma in nuclear engineering from 2008. The engineering faculty undertook the prototype test of the closed-cycle helium system and houses the Pebble Bed Micro Model

10
(PBMM), the High Pressure Test Unit, and the High Temperature Test Unit, all of which are essential to testing aspects of the PBMR design. PBMR also cooperates with the University of Pretoria on R&D covering materials evaluation, super computational power to analyse nuclear fuels, and microbiology to minimize nuclear waste.
Skills development NECSA works with HEIs in support of masters and doctoral research programmes and teaches the MSc in reactor science at Pretoria University. iThemba Labs has joint graduate schools with North-West University (Masters in Applied Radiation Science and Technology, MARST) and with the University of the Western Cape and the University of Zululand (Masters in Accelerator and Nuclear Science, MANuS; Masters in Materials Science, MATSCI). French Areva sponsors South African postgraduate students of nuclear science in France, and the US Department of Energy and IAEA have supported training in South Africa. DST runs the South African Human Asset & Research Programme (SANHARP) which aims to align skill availability in the nuclear sector with the planned technology platforms. It deals with brain drain in the context of a global shortage of technical personnel, the aging of the relevant workforce, competition from other public or private investment programmes, underdevelopment of the local manufacturing supply chain, the length of the training pipeline, the lack of trainers, and university-industry linkages. SANHARP runs a bursary scheme offering full sponsorships to students in selected areas of science and engineering, from undergraduate through to postgraduate levels. Recipients of these bursaries are selected from among successful matriculants of Dinaledi schools. SANHARP also offers funding for research chairs at universities in themes pertinent to nuclear technology. The aim is to include six more chairs to the two existing ones, with a total of at least five established by 2007/08.
Global knowledge networks South Africa participates in a number of international fora dedicated to innovative reactors and fuel cycles. The Generation IV International Forum (GIF) aims jointly to define the future of nuclear energy research and development beyond the currently available Generation II and III reactors. It focuses on six reactor technologies most of which employ a closed fuel cycle. Related to the GIF is the Multinational Design Evaluation Program (MDEP) which is led by the Nuclear Energy Agency of the OECD and also involves the IAEA. It is concerned with international regulatory standards for Generation IV designs. The International Atomic Energy Agency (IAEA) directs a project on Innovative Nuclear Reactors

11
and Fuel Cycles (INPRO) which is a multilateral effort to consider the role of sustainable nuclear energy in the Twenty-First century and focuses particularly on developing country needs. Finally, South Africa participates in the African Regional Cooperative Agreement for Research Development and Training related to Nuclear Science and Technology (AFRA), an intergovernmental agreement to promote the development and application of nuclear science and technology in Africa which is supported by the IAEA.
Regional power demand In 1996 12 members of SADC started the Southern African Power Pool (SAPP). This concerns hydroelectric power generated outside South Africa and in the future possibly nuclear power for export from South Africa, similarly to the already existing supply of electricity to Namibia over a dedicated 400 MW power line. Eskom supplies some 60 per cent of Africa’s electricity. However, exports are being curtailed in view of the regional excess demand over supply capacity, following shortcomings in the national supply from mid-decade.
PBMR The PBMR is based on a German design which Eskom bought the rights to in the 1990s. These high-temperature reactors (HTR) are small (165MWe), with reported advantages in terms of high thermal efficiency (41%), great load flexibility (40-100%) with rapid change in power settings, on-line refueling of expended pebbles, and modest construction and competitive generating costs (Nicholls 2002). As of January 2006, the PBMR company’s shareholders include Eskom, the Industrial Development Corporation (IDC), the South African government, and Westinghouse. In principle there is space for another investor. The consortium obtained environmental approval for the construction of a demonstration unit at Koeberg in 2003, and for a fuel plant at Pelindaba. A court challenge against approval of the environmental impact assessment of the demonstration plant and a subsequent change in the technical design of the turbine necessitated a new assessment which commenced in August 2005 and is not yet completed. However, a revised final scoping report was made available in January 2007. At the same time the Minister of Environmental Affairs and Tourism upheld the positive Record of Decision (RoD) for the fuel plant. Current planning provides for construction to start in 2009, with criticality scheduled for 2013. Construction of the first commercial units is planned for 2016. The PBMR company is also working on a higher-temperature process heat plant which they hope to complete by 2016. This next-generation nuclear plant is
12
for processes like oil sands production, process steam in the petrochemical industry, and eventually also hydrogen. A subsidiary of Germany Thyssenkrupp Engineering, Uhde, has been contracted to build a plant at Pelindaba to manufacture the fuel pebbles for the demonstration unit, with a planned completion date of 2010. This can go ahead once nuclear authorization has been received by the NNR. Design certification application in the US is planned for 2008. The PBMR’s 700-strong project team is located in Centurion. The South African government has allocated substantial funding to the PBMR since 2004. Its aim eventually to produce 4-5,000MW of power from PBMRs translates into demand of some 20-30 reactors. Thanks to this funding, PBMR was able to award contracts for the development of key components such as the turbine machinery – to Mitsubishi Heavy Industries – and the helium test facility. The PBMR company has a Memorandum of Understanding with Chinergy of Beijing, the Chinese developers of pebble bed technology, covering cooperation in the demonstration and commercialization phases.
Market prospects of the PBMR The national and international sales prospects of the PBMR are controversial. The PBMR company is understandably upbeat (Nicholls 2002). Yet for a number of reasons the success of this technology is not certain. To date there have been very sizeable delays and massive cost overruns even though construction has yet to begin. This might mean that the nature and scale of the challenges were not fully appreciated by the developers. If the problems experienced to date are a harbinger of things to come during construction, operation and maintenance, neither further slippage nor additional cost escalations can be excluded. Also, before the design has not been afforded approval by the US authorities, export prospects which Eskom initially put at 20 units per year, are merely a theoretical possibility. In addition, international experts have questioned the unit cost estimations by Eskom for the commercial successors of the demonstration plant, the opportunity costs of the project, as well as the underlying market analysis for the forecast export orders (Auf der Heide and Thomas 2002, Thomas 2005, 2007b). Another factor is the absolute inexperience of the South African regulator in approving a design ex novo, let alone dealing with two different technologies in parallel (i.e. the conventional PWRs plus the PBMR). It has already flexed its muscle once, however, when it halted work on the manufacture of safety related components in October 2006.

13
2 THE DEMAND FOR SKILLS
Introduction Engineering skills are globally in short supply. According to a survey of some 37,000 employers in 27 countries undertaken by Manpower Inc (2007), technicians and engineers are the third and fourth scarcest professional qualification in the labour market. The same survey also found that in South Africa, engineers, skilled manual trades such as electricians, welders, and carpenters, and technicians, respectively, occupy the first three spots. A survey conducted by Deloitte and Touche found that 81 per cent of firms suffered from skills shortages. Occupations in short supply included information technology specialists and scientists (Companies Still Hamstrung by Skills Shortage 2007). The Global Talent Index, prepared by the Economist Intelligence Unit and the executive search firm Heidrick & Struggles, predicted that South Africa’s failing education system will exacerbate a talent crisis as increasing foreign direct investment inflows translate into demands for skilled labour. Of 30 countries ranked worldwide, only Iran, Nigeria, and Indonesia fared worse in the rankings of the quality of higher education (Fisher-French 2007). Industry bodies report that the shortage concerns all qualifications from artisans such as welders and electrical and electronic technicians to R&D staff, and specialist engineers; it affects the private sector and, perhaps even more so, the public sector, such as the various regulatory agencies, including the NNR (CDE 2007, Madibeng 2007, Mafu 2007, National Advisory Council on Innovation 2003, SA Faces Severe Skills Shortage 2007). The nature of the problem precludes quick fixes. The low number of higher-grade passes in secondary schools in science and mathematics and a perceived lack of attraction of the engineering field mean that too few young people enter the career pipeline (Deane 2006). In addition, it takes three to four years to train a coded welder, and longer to obtain advanced welding skills which are more and more in demand (Davenport 2005).
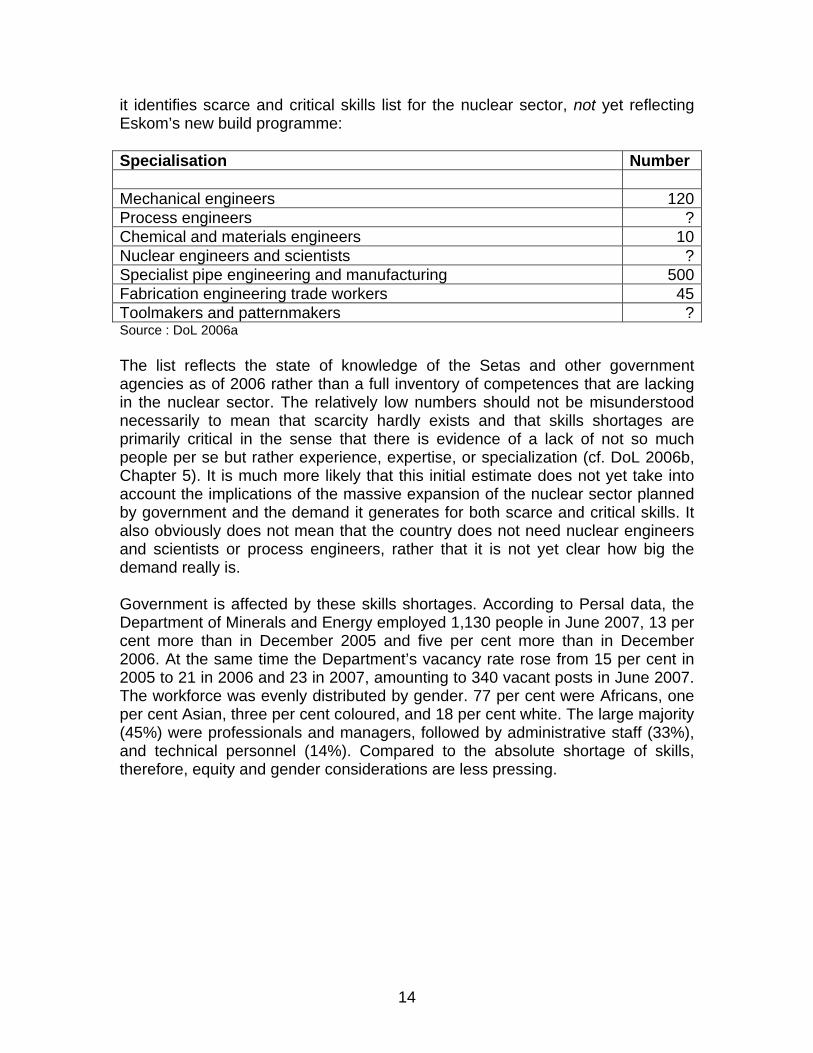
The nature and magnitude of the demand for skills It is necessary to derive the demand for skills from a variety of data sources. Due to the specificity of the demand for certain professions under consideration here, it is not possible to exploit household and labour force survey data neither of which supports enquiries at this level of disaggregation. The list of scarce and critical skills published by the Department of Labour is based on estimations of the Setas and others, and as such is very much a document under construction (DoL 2006a). The list covers engineering and technical professions within which
14
it identifies scarce and critical skills list for the nuclear sector, not yet reflecting Eskom’s new build programme: Specialisation Number Mechanical engineers 120Process engineers ?Chemical and materials engineers 10Nuclear engineers and scientists ?Specialist pipe engineering and manufacturing 500Fabrication engineering trade workers 45Toolmakers and patternmakers ?Source : DoL 2006a The list reflects the state of knowledge of the Setas and other government agencies as of 2006 rather than a full inventory of competences that are lacking in the nuclear sector. The relatively low numbers should not be misunderstood necessarily to mean that scarcity hardly exists and that skills shortages are primarily critical in the sense that there is evidence of a lack of not so much people per se but rather experience, expertise, or specialization (cf. DoL 2006b, Chapter 5). It is much more likely that this initial estimate does not yet take into account the implications of the massive expansion of the nuclear sector planned by government and the demand it generates for both scarce and critical skills. It also obviously does not mean that the country does not need nuclear engineers and scientists or process engineers, rather that it is not yet clear how big the demand really is. Government is affected by these skills shortages. According to Persal data, the Department of Minerals and Energy employed 1,130 people in June 2007, 13 per cent more than in December 2005 and five per cent more than in December 2006. At the same time the Department’s vacancy rate rose from 15 per cent in 2005 to 21 in 2006 and 23 in 2007, amounting to 340 vacant posts in June 2007. The workforce was evenly distributed by gender. 77 per cent were Africans, one per cent Asian, three per cent coloured, and 18 per cent white. The large majority (45%) were professionals and managers, followed by administrative staff (33%), and technical personnel (14%). Compared to the absolute shortage of skills, therefore, equity and gender considerations are less pressing.

15
Table 1.1. Staff at DME, June 2007 By race Female Male Total African 459 416 875 Asian 3 9 12 Coloured 21 17 38 White 83 122 205 Total 566 564 1130 By occupation Admin. office workers 369 Professionals and managers 513 Technical and associate professionals 157 Other 91 Total 1130 Source: PERSAL
According to DPE estimates, between 2006 and 2012 Eskom needs almost 4,000 people, including those with the skills needed at Koeberg. This translates into annual hirings of between 390 and 709 people, a tall order that requires careful planning. More than a third of these are electricians (39%), followed by electrical and electronic engineering draftspersons and technicians (19%), electrical distribution trades workers (10%), power plant process technicians (6%), mechanical and other building and engineering draftspersons and technicians (6%), metal fitters and machinists (5%), safety inspectors (3%), millwrights and mechatronic trade workers (3%), and electronics trades workers (3%). It is therefore not primarily and certainly not only the skills at the very high end that are in demand.

16
Table 1.2. Eskom skills needs 2006-2012 OWN EMPLOYEE Skills needed 1. Science Technicians 02 . Architectural, Building and Surveying Technicians 563. Civil Engineering Draftspersons and Technicians 594. Electrical Engineering Draftspersons and Technicians 4855. Electronic Engineering Draftspersons and Technicians 2505. Mechanical Engineering Draftspersons and Technicians 986. Safety Inspectors 1357. Other Building and Engineering Technicians 1228. ICT Support Technicians 149. Telecommunications Technical Specialists 3410. Manufacturing Technicians 011. Power Plant Process Technicians 22812. Automotive Electricians 013. Motor Mechanics 014. Metal Casting, Forging and Finishing Trades Workers 015. Sheetmetal Trades Workers 016. Structural Steel and Welding Trades Workers 017. Aircraft Maintenance Engineers ( Artisan) 018. Metal Fitters and Machinists 18519. Precision Metal Trades Workers 020. Toolmakers and Engineering Patternmakers 021. Millwrights and Mechatronics Trades Workers 12122. Panelbeaters 023. Vehicle Painters 024. Manufacturing Trades Workers 025. Bricklayers and Stonemasons 026.Carpenters and Joiners 027.Painting Trades Workers 028. Plumbers 029 Electricians 153130. Airconditioning and Refrigeration Mechanics 031 Electrical Distribution Trades Workers 40632. Electronics Trades Workers 10533.Telecommunications Trades Workers 034 Food Trades Workers 035. Horticultural Trades Workers 036.Wood Trades Workers 037. Miscellaneous Technicians and Trades Workers 73 Total 3902 Source: DPE
The PBMR company is short of 150 people over the same period. They consist of civil and mechanical engineering draftspersons and technicians (48%), other building and engineering technicians (21%), electronic engineering draftspersons

17
and technicians (17%), and science technicians (12%). This is clearly more a case of critical rather than scarce skills per se, and it is worthwhile noting that many of these fall into the medium- as opposed to the high-skills band as well. Table 1.3. PBMR skills needs 2006-2012 Current Variance Skills needed 1. Science Technicians 6 -18 242 . Architectural, Building and Surveying Technicians 0 0 03. Civil Engineering Draftspersons and Technicians 3 -36 394. Electrical Engineering Draftspersons and Technicians 9 1 85. Electronic Engineering Draftspersons and Technicians 0 -26 265. Mechanical Engineering Draftspersons and Technicians 12 -36 486. Safety Inspectors 0 -2 27. Other Building and Engineering Technicians 3 -32 358. ICT Support Technicians 0 -1 19. Telecommunications Technical Specialists 0 0 010. Manufacturing Technicians 0 0 011. Power Plant Process Technicians 0 0 012. Automotive Electricians 0 0 013. Motor Mechanics 0 0 014. Metal Casting, Forging and Finishing Trades Workers 0 0 015. Sheetmetal Trades Workers 0 0 016. Structural Steel and Welding Trades Workers 0 0 017. Aircraft Maintenance Engineers ( Artisan) 0 0 018. Metal Fitters and Machinists 0 0 019. Precision Metal Trades Workers 0 0 020. Toolmakers and Engineering Patternmakers 0 0 021. Millwrights and Mechatronics Trades Workers 0 0 022. Panelbeaters 0 0 023. Vehicle Painters 0 0 024. Manufacturing Trades Workers 0 0 025. Bricklayers and Stonemasons 0 0 026.Carpenters and Joiners 0 0 027.Painting Trades Workers 0 0 028. Plumbers 0 0 029 Electricians 0 0 030. Airconditioning and Refrigeration Mechanics 0 0 031 Electrical Distribution Trades Workers 0 0 032. Electronics Trades Workers 0 0 033.Telecommunications Trades Workers 0 0 034 Food Trades Workers 0 0 035. Horticultural Trades Workers 0 0 036.Wood Trades Workers 0 0 037. Miscellaneous Technicians and Trades Workers 0 0 0Total 33 -150 183Source: DPE
18
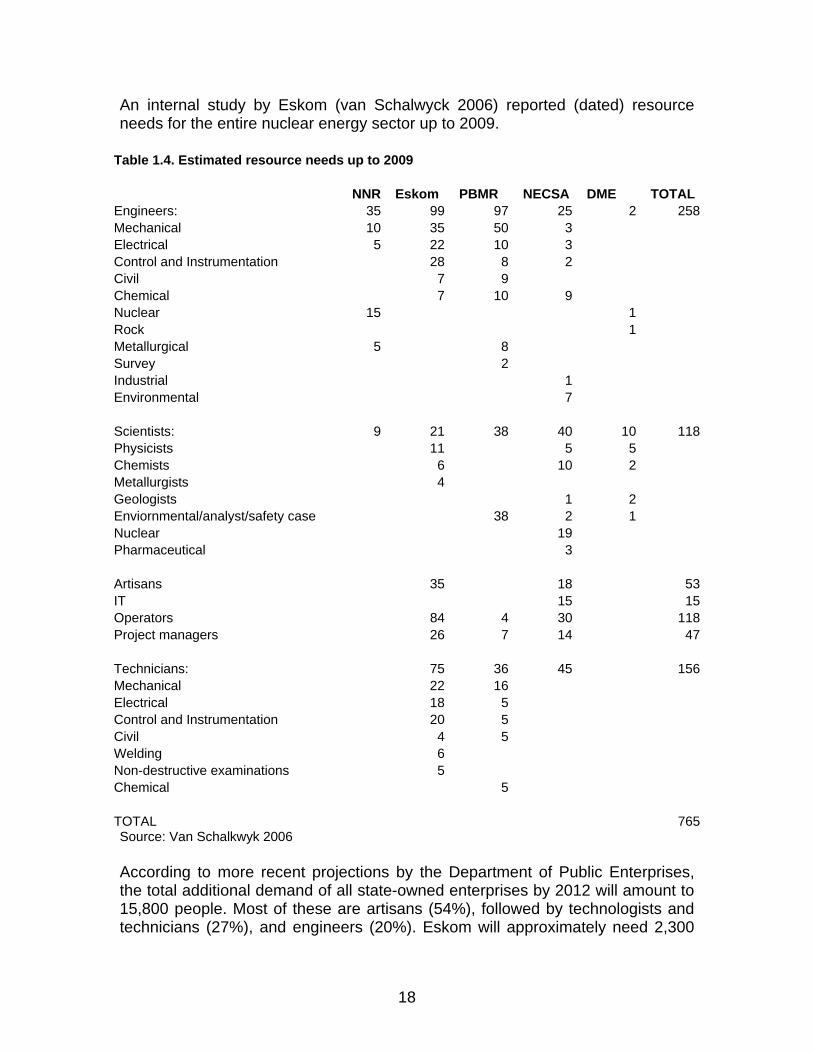
An internal study by Eskom (van Schalwyck 2006) reported (dated) resource needs for the entire nuclear energy sector up to 2009.
Table 1.4. Estimated resource needs up to 2009 NNR Eskom PBMR NECSA DME TOTAL Engineers: 35 99 97 25 2 258Mechanical 10 35 50 3 Electrical 5 22 10 3 Control and Instrumentation 28 8 2 Civil 7 9 Chemical 7 10 9 Nuclear 15 1 Rock 1 Metallurgical 5 8 Survey 2 Industrial 1 Environmental 7 Scientists: 9 21 38 40 10 118Physicists 11 5 5 Chemists 6 10 2 Metallurgists 4 Geologists 1 2 Enviornmental/analyst/safety case 38 2 1 Nuclear 19 Pharmaceutical 3 Artisans 35 18 53IT 15 15Operators 84 4 30 118Project managers 26 7 14 47 Technicians: 75 36 45 156Mechanical 22 16 Electrical 18 5 Control and Instrumentation 20 5 Civil 4 5 Welding 6 Non-destructive examinations 5 Chemical 5 TOTAL 765Source: Van Schalkwyk 2006 According to more recent projections by the Department of Public Enterprises, the total additional demand of all state-owned enterprises by 2012 will amount to 15,800 people. Most of these are artisans (54%), followed by technologists and technicians (27%), and engineers (20%). Eskom will approximately need 2,300

19
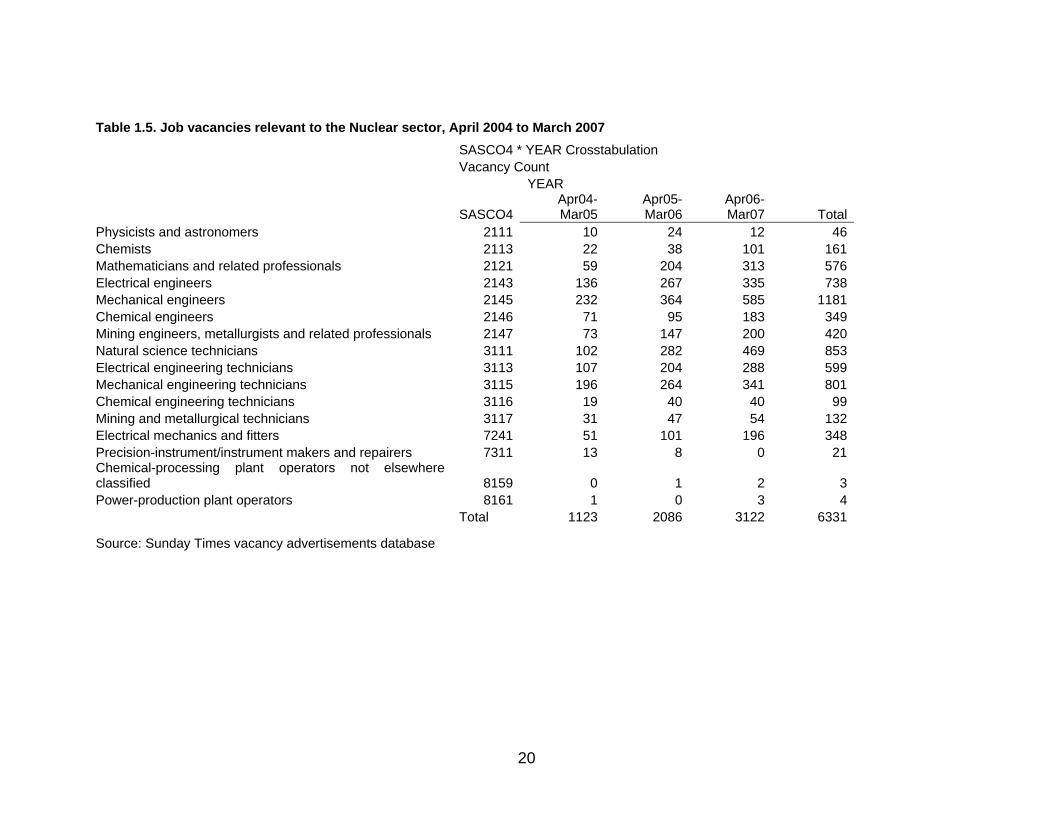
artisans, 2,600 technologists and technicians, and 2,400 engineers. The PBMR company will need about 50 engineers. The nuclear sector of course competes with other sectors for scientific, engineering, and technical skills. Information about job vacancies derived from the Sunday Times database shows that over a three-year period starting in April 2004, employers were looking for about 2,000 mechanical engineers and technicians, 1,300 electrical engineers and technicians, 600 chemists, chemical engineers and technicians, and 3,200 civil engineers and technicians. Demand for physicists and instruments makers, by contrast, was below 50. Demand for specialists with specific nuclear skills was few and far between, at less than 20. This reflects two facts, namely that the nuclear sector is indeed competing for generic technical skills with other sectors, and that the data do not yet include trends associated with the new build programme announced in the course of 2006.
20
Table 1.5. Job vacancies relevant to the Nuclear sector, April 2004 to March 2007
Source: Sunday Times vacancy advertisements database
SASCO4 * YEAR Crosstabulation Vacancy Count YEAR
SASCO4Apr04-Mar05
Apr05-Mar06
Apr06-Mar07 Total
Physicists and astronomers 2111 10 24 12 46Chemists 2113 22 38 101 161Mathematicians and related professionals 2121 59 204 313 576Electrical engineers 2143 136 267 335 738Mechanical engineers 2145 232 364 585 1181Chemical engineers 2146 71 95 183 349Mining engineers, metallurgists and related professionals 2147 73 147 200 420Natural science technicians 3111 102 282 469 853Electrical engineering technicians 3113 107 204 288 599Mechanical engineering technicians 3115 196 264 341 801Chemical engineering technicians 3116 19 40 40 99Mining and metallurgical technicians 3117 31 47 54 132Electrical mechanics and fitters 7241 51 101 196 348Precision-instrument/instrument makers and repairers 7311 13 8 0 21Chemical-processing plant operators not elsewhere classified 8159 0 1 2 3Power-production plant operators 8161 1 0 3 4 Total 1123 2086 3122 6331

21
Table 1.6. Job vacancies for Nuclear specialists, April 2004 to March 2007
Job Title SASCO4Apr04-Mar05
Apr05-Mar06
Apr06-Mar07 Total
Nuclear Specialist 2,145 1 1Mechanical Engineer(Snr Specialist Nuclear) 2,145 1 1Engineer: Nuclear Instrumentation & Control 2,145 1 1NUCLEAR ENGINEERS 2,145 1 1NUCLEAR ENGINEERS 2,145 1 1Principal Specialist - Nuclear Safety 2,146 1 1Nuclear Engineer 2,111 1 1Nuclear Engineer 2,111 1 1Nuclear Engineer 2,111 1 1Nuclear Engineer 2,111 1 1Nuclear Engineer 2,111 1 1Nuclear Engineer 2,111 1 1Nuclear Reactor Physicist 2,111 1 1Physicist: Engineering and Radiation Protection 2,111 1 1Reactor Design Analyst 2,111 1 1Reactor physicists 2,111 1 1Snr/Chief Reactor Physicist/Nuclear Eng 2,111 1 1 Total 3 12 2 17
Source: Sunday Times vacancy advertisements database

22
Summary In general it appears that the nuclear sector primarily experiences a lack of scarce skills at the medium skill level and a lack of critical skills at the high level. It is also clear that in light of the very sizeable planned increase of the nuclear sector, some of the official information, notably the scarce and critical skills list of DoL, underestimates the demand for expertise. What exacerbates the situation especially at the high end is that nuclear expertise is a critical skill globally. Hence South Africa directly competes with all other countries with nuclear industries for a small pool of specialists, including its own who might be attracted by employers abroad. This puts the emphasis on indigenous skills training.
3 THE SUPPLY OF SKILLS
The stock of engineers and scientists In 2007, some 28,500 engineering professionals were registered with the Engineering Council of South Africa (ECSA). This represented an increase of nine per cent over 2004. From 1994, ECSA each year registered between 1,300 and 1,900 new members. In 2006, 47 per cent were black. The share of blacks is generally on the increase while that of all other groups has been shrinking. ECSA estimates that fewer than half of the engineers in the country are registered with it. It does not know how many members have emigrated or are otherwise no longer active.

23
Table 1.7. Persons Registered as at 30 SEPTEMBER 2004, 2005, 2006 and 2007
Registration Category 2004/09/30 2005/09/30 2006/09/30 2007/09/30
EMF .
International Professional Engineers 14 19 19 22
Professionals
Professional Engineers 14,900 14,901 14,786 14,757
Professional Engineering Technologists 2,581 2,708 2,833 2,963
Professional Certificated Engineers 815 820 874 966
Professional Engineering Technicians 973 1,223 1,431 1,629
Candidates
Candidate Engineers 3,413 3,441 3,577 3,859
Candidate Engineering Technologists 617 712 862 1,002
Candidate Certificated Engineers 105 109 130 159
Candidate Engineering Technicians 821 986 1,160 1,371
Specified Category
Registered Lift Inspectors 162 163 165 167
Registered Lifting Machinery Inspector 96
Dormant (since 28 August 2001)
Registered Engineering Technicians 1,215 1,159 1,100 1,038
Reg. Eng. Technicians (Master) 503 491 464 452
TOTAL 26,119 26,732 27,401 28,481
Table1.8. REGISTRATIONS FOR ALL CATEGORIES
2004 2005 Oct
2006 ASIANS 165 196 126 BLACKS 561 744 859 COLOUREDS 42 31 26 TOTAL A, B & C 768 971 1011 WHITES 920 788 832
Source: ECSA

24
The South African Council for Natural Scientific Professions registers natural scientists. In 2006, 3,191 people were registered with the Council, of whom just eight per cent were black and 87 per cent white. Women accounted for less than a fifth of the membership. Scientists that could in principle work in the nuclear sector, numbered roughly 600. By comparison, the world of science is much more in need of gender and equity transformation than the world of engineering. Table 1.9. Natural Scientists registered with The South African Council for Natural Scientific Professions, 2006
Pro
fess
iona
l nat
ural
sci
entis
t
Can
dida
te N
atur
al S
cien
tist
Cer
tific
ated
Nat
ural
Sci
entis
t
Tota
l
All Fields 2962 171 58 3191 Chemical science 302 12 15 329 Materials science 18 0 0 18 Physical science 125 6 0 131 Radiation science 15 0 0 15 Race distribution Asian 89 13 5 107 Black 171 56 25 252 Coloured 40 3 4 47 White 2662 99 24 2785 Gender distribution Male 2474 95 38 2607 Female 488 76 20 584
Source: The South African Council for Natural Scientific Professions (2006) According to a DPE study, in-house training by Eskom from 2008 to 2012 will add 400 artisans per year, 500 technologists and technicians, and 500 engineers. In addition, the PBMR company will also train some 10 new engineers per year in the same period.
25
The pool of new engineering specialists
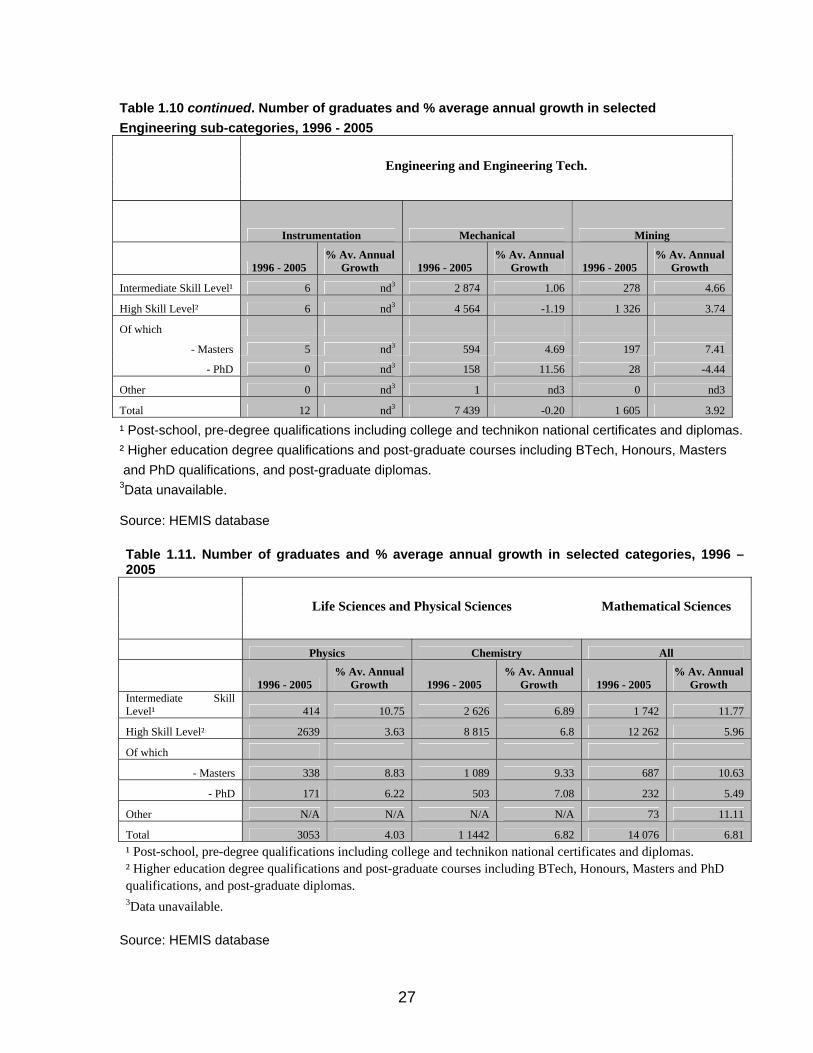
Graduates Specialists in the nuclear sector primarily originate in three broad study fields, namely engineering, physics, and mathematics. Between 1996 and 2005, South Africa produced some 80,000 graduates in this area. In engineering, 57 per cent of these graduates had at least a bachelor’s degree, while the remainder had pre-degree qualifications (see Tables 10 and 11 below). With the exception of mechanical engineering, instrumentation and – notably – nuclear engineering in which the country did not produce graduates at all, all fields experienced positive growth. Growth rates tended to be higher at the postgraduate end of the high-skill level, especially in the area of masters degrees. In physics and mathematics by contrast, intermediate skills grew at a higher level than high skills. However, high skills made up the bulk (86% in physics and 87% in mathematics) of graduates.

26
Table 1.10. Number of graduates and % average annual growth in selected Engineering sub-categories, 1996 - 2005
Engineering and Engineering Tech.
All Nuclear Chemical Civil Computer Electrical Engineering
Science
1996 - 2005
% Av. Annual Growth
1996 - 2005
% Av. Annual Growth
1996 - 2005
% Av. Annual Growth
1996 - 2005
% Av. Annual Growth
1996 - 2005
% Av. Annual Growth
1996 - 2005
% Av. Annual Growth
1996 - 2005
% Av. Annual Growth
Intermediate Skill Level¹ 21 699 2.42 0 0.00 2 137 2.2 4 117 4.61 158 -11.11 7 952 5.05 16 nd3 High Skill Level² 29 181 3.35 0 0.00 3 618 4.33 4 404 0.58 577 19.34 8 070 2.21 56 22.22 Of which
- Masters 4 298 6.28 0 0.00 458 5.6 551 1.75 56 13.76 1 251 8.69 35 22.22 - PhD 686 4.38 0 0.00 126 2.67 94 -1.31 0 nd3 171 2.78 0 nd3
Other 156 nd3 0 0.00 0 nd3 1 nd3 0 nd3 141 nd3 0 nd3 Total 51 036 2.93 0 0.00 5 755 3.51 8 522 2.62 735 11.97 16 164 3.68 72 22.22 ¹ Post-school, pre-degree qualifications including college and technikon national certificates and diplomas. ² Higher education degree qualifications and post-graduate courses including BTech, Honours, Masters and PhD qualifications, and post-graduate diplomas. 3Data unavailable.
Source: HEMIS database
27
Table 1.10 continued. Number of graduates and % average annual growth in selected Engineering sub-categories, 1996 - 2005
Engineering and Engineering Tech.
Instrumentation Mechanical Mining
1996 - 2005 % Av. Annual
Growth 1996 - 2005 % Av. Annual
Growth 1996 - 2005 % Av. Annual
Growth Intermediate Skill Level¹ 6 nd3 2 874 1.06 278 4.66 High Skill Level² 6 nd3 4 564 -1.19 1 326 3.74 Of which
- Masters 5 nd3 594 4.69 197 7.41 - PhD 0 nd3 158 11.56 28 -4.44
Other 0 nd3 1 nd3 0 nd3 Total 12 nd3 7 439 -0.20 1 605 3.92 ¹ Post-school, pre-degree qualifications including college and technikon national certificates and diplomas. ² Higher education degree qualifications and post-graduate courses including BTech, Honours, Masters and PhD qualifications, and post-graduate diplomas. 3Data unavailable. Source: HEMIS database Table 1.11. Number of graduates and % average annual growth in selected categories, 1996 – 2005
Life Sciences and Physical Sciences Mathematical Sciences
Physics Chemistry All
1996 - 2005 % Av. Annual
Growth 1996 - 2005 % Av. Annual
Growth 1996 - 2005 % Av. Annual
Growth Intermediate Skill Level¹ 414 10.75 2 626 6.89 1 742 11.77
High Skill Level² 2639 3.63 8 815 6.8 12 262 5.96
Of which - Masters 338 8.83 1 089 9.33 687 10.63
- PhD 171 6.22 503 7.08 232 5.49
Other N/A N/A N/A N/A 73 11.11
Total 3053 4.03 1 1442 6.82 14 076 6.81 ¹ Post-school, pre-degree qualifications including college and technikon national certificates and diplomas. ² Higher education degree qualifications and post-graduate courses including BTech, Honours, Masters and PhD qualifications, and post-graduate diplomas. 3Data unavailable.
Source: HEMIS database

28
All three areas were dominated by men but this changed over time. In 1996, fewer than one in thirteen engineering graduates was female, while by 2005 this ratio had risen to more than one in five. In mathematics, in 1996 there were two male for every female graduate; by 2005 the ratio had improved to just over 4:6. In physics, however, male predominance strengthened over time.
Table 1.12. Number of graduates and % average annual growth in selected categories, 1996 – 2005, by gender
% Share of Total
Study Fields/Graduates Gender 1996 - 2005
% Average Annual Growth 1996 2005
Engineering and Engineering Tech. Female 7 773 12.53 7.73 21.25 Engineering and Engineering Tech.
(All) Male 43 264 1.19 92.27 78.75 Female 0 0.00 0.00 0.00
Nuclear Male 0 0.00 0.00 0.00 Female 1 894 9.99 21.80 41.77
Chemical Male 3 861 0.26 78.20 58.23 Female 1 337 12.39 7.83 21.73
Civil Male 7 185 0.81 92.17 78.27 Female 99 10.47 17.08 14.24
Computer Male 637 12.24 82.92 85.76 Female 1 860 14.40 5.06 16.93
Electrical Male 14 303 2.23 94.94 83.07 Female 1 nd3 0 nd3
Engineering Science Male 71 22.22 0 nd3 Female 3 nd3 0 nd3
Instrumentation Male 9 nd3 0 nd3 Female 500 12.51 2.57 9.38
Mechanical Male 6 939 -1.01 97.43 90.62 Female 104 16.50 2.97 14.06
Mining Male 1 501 2.60 97.03 85.94
Life Sciences and Physical Sciences Female 1 064 2.97 31.57 28.63
Physics Male 1 989 4.48 68.43 71.37 Female 6 395 8.80 47.02 57.59
Chemistry Male 5 047 4.51 52.98 42.41
Mathematical Sciences Female 5 840 9.41 33.22 43.55
Mathematical Sciences (All) Male 8 237 5.08 66.78 56.45 3Data unavailable. Source: HEMIS database

29
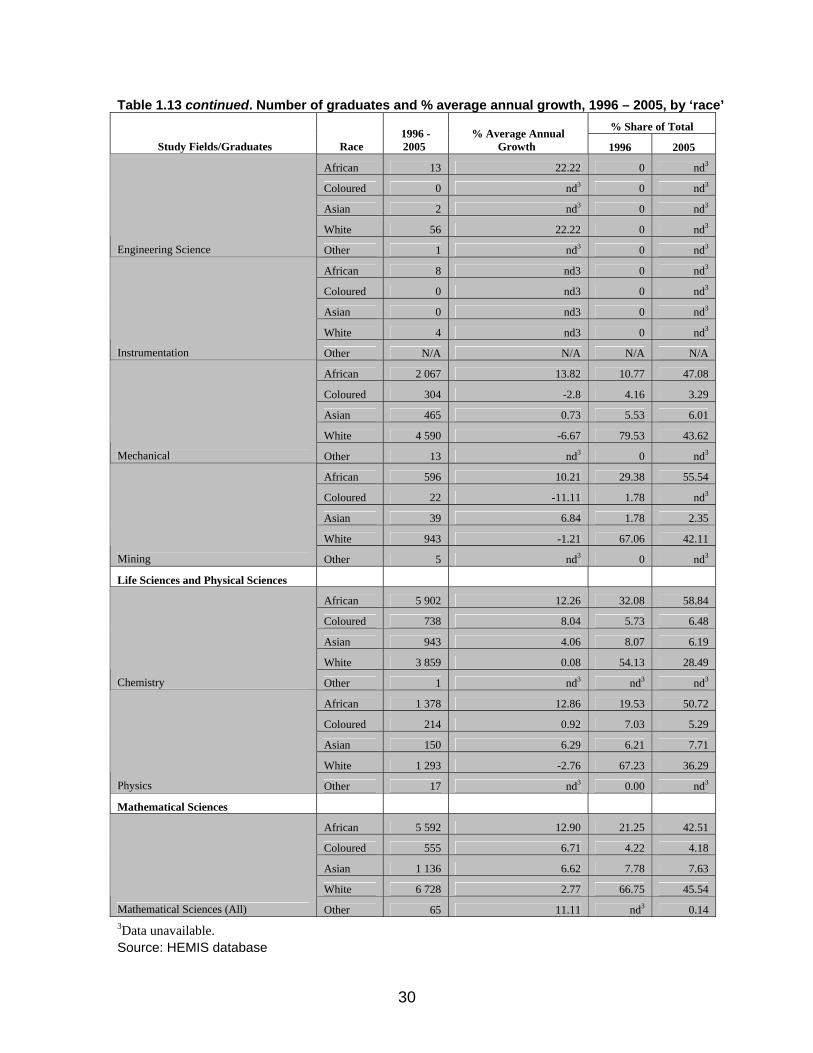
The race distribution changed more substantially in the decade to 2005. The share of whites in engineering had fallen from approximately two thirds to just over one third; blacks rose from accounting from a fifth to one half of the total. The same is true in physics and less so in mathematics. Table 1.13. Number of graduates and % average annual growth in Engineering and Engineering Technology in selected sub-categories, by ‘race’, 1996 – 2005
% Share of Total
Study Fields/Graduates Race 1996 - 2005
% Average Annual Growth 1996 2005
Engineering and Engineering Tech.
African 18 671 12.06 19.5 50.46
Coloured 2 822 -0.48 6.55 4.81
Asian 3 897 4.3 6.67 7.57
White 25 579 -3.62 67.28 37.14 Engineering and Engineering Tech. (All) Other 67 22.22 0.00 0.02
African 0 0.00 0 0.00
Coloured 0 0 0 0
Asian 0 0 0 0
White 0 0.00 0 0.00
Nuclear Other N/A N/A N/A N/A
African 2 718 8.8 33.24 55.9
Coloured 366 2.84 6.95 6.54
Asian 887 2.36 17.41 15.66
White 1 782 -3.8 42.41 21.83
Chemical Other 3 22.22 0.00 0.07
African 3 188 15.18 14.09 59.06
Coloured 544 10.34 2.68 5.8
Asian 556 10.85 2.61 5.99
White 4 229 -8.26 80.62 29.15
Civil Other 5 nd3 0 nd3
African 161 -4.22 61.91 12.64
Coloured 39 -15.87 32.02 1.6
Asian 73 22.22 0 14.72
White 463 21.11 6.06 71.04
Computer Other N/A N/A N/A N/A
African 6 166 11.83 21.59 50.66
Coloured 961 2.29 6.77 5.96
Asian 1 234 4.99 6.8 7.68
White 7 792 -2.89 64.83 35.7
Electrical Other 11 nd3 0 nd3 3Data unavailable. Source: HEMIS database
30
Table 1.13 continued. Number of graduates and % average annual growth, 1996 – 2005, by ‘race’% Share of Total
Study Fields/Graduates Race 1996 - 2005
% Average Annual Growth 1996 2005
African 13 22.22 0 nd3 Coloured 0 nd3 0 nd3 Asian 2 nd3 0 nd3 White 56 22.22 0 nd3
Engineering Science Other 1 nd3 0 nd3 African 8 nd3 0 nd3 Coloured 0 nd3 0 nd3 Asian 0 nd3 0 nd3 White 4 nd3 0 nd3
Instrumentation Other N/A N/A N/A N/A African 2 067 13.82 10.77 47.08 Coloured 304 -2.8 4.16 3.29 Asian 465 0.73 5.53 6.01 White 4 590 -6.67 79.53 43.62
Mechanical Other 13 nd3 0 nd3 African 596 10.21 29.38 55.54 Coloured 22 -11.11 1.78 nd3 Asian 39 6.84 1.78 2.35 White 943 -1.21 67.06 42.11
Mining Other 5 nd3 0 nd3 Life Sciences and Physical Sciences
African 5 902 12.26 32.08 58.84 Coloured 738 8.04 5.73 6.48 Asian 943 4.06 8.07 6.19 White 3 859 0.08 54.13 28.49
Chemistry Other 1 nd3 nd3 nd3 African 1 378 12.86 19.53 50.72 Coloured 214 0.92 7.03 5.29 Asian 150 6.29 6.21 7.71 White 1 293 -2.76 67.23 36.29
Physics Other 17 nd3 0.00 nd3 Mathematical Sciences
African 5 592 12.90 21.25 42.51 Coloured 555 6.71 4.22 4.18 Asian 1 136 6.62 7.78 7.63 White 6 728 2.77 66.75 45.54
Mathematical Sciences (All) Other 65 11.11 nd3 0.14 3Data unavailable. Source: HEMIS database

31
Enrolments This report looks at recent enrolment trends over the period 2000 to 2005. The analysis of enrolments is limited to those that cannot possibly have graduated yet during the period 1996 to 2005 in that they have not yet lasted a full course of study. This still overreports the total human capital available, but at least it does not doublecount graduates and enrolments. Thus, in the six-year period under review here, South African training and education institutions enrolled a quarter of a million people in the engineering field, slightly more than half at the intermediate skill level. With a few exceptions (intermediate skills in computer engineering; engineering science, especially high skills; PhDs in civil and mining engineering), growth rates were positive. Both physics and mathematics are much more top-heavy than engineering, with six to eight times more high-level than intermediate skills. Total enrolments in mathematics are almost stagnant. The same is true for intermediate level skills in physics, while they fell considerably in mathematics.

32
Table 1.14. Number of enrolments and % average annual growth in enrolment in selected Engineering sub-categories, 2000 - 2005
Engineering and Engineering Tech.
All Nuclear Chemical Civil Computer Electrical Engineering
Science
2000 - 2005
% Av. Annual Growth
2000 - 2005
% Av. Annual Growth
2000 - 2005
% Av. Annual Growth
2000 - 2005
% Av. Annual Growth
2000 - 2005
% Av. Annual Growth
2000 - 2005
% Av. Annual Growth
2000 - 2005
% Av. Annual Growth
Intermediate Skill Level¹ 131 927 13.50 nd3 nd3 17 078 11.17 24 251 11.30 34 -20.00 51 062 14.29 23 20.00 High Skill Level² 125 002 4.40 8 25.00 15 907 5.25 15 914 6.47 3 252 15.15 41 880 1.33 801 -34.25 Of which
- Masters 14 173 5.39 7 nd3 1 556 0.38 1 965 2.59 174 15.76 3 930 9.21 132 -26.28 - PhD 3 622 7.09 nd3 nd3 596 14.8 508 -1.76 3 nd3 934 7.42 9 nd3
Other 1 nd3 nd3 nd3 nd3 nd3 nd3 nd3 nd3 nd3 nd3 nd3 nd3 nd3 Total 256 931 9.62 8 25.00 32 986 8.42 40 164 9.52 3 286 13.44 92 942 9.40 824 -23.84 ¹ Post-school, pre-degree qualifications including college and technikon national certificates and diplomas. ² Higher education degree qualifications and post-graduate courses including BTech, Honours, Masters and PhD qualifications, and post-graduate diplomas. 3Data unavailable.
Source: HEMIS database

33
Table 1.14 continued. Number of enrolments and % average annual growth in enrolment, 2000 - 2005.
Engineering and Engineering Tech.
Instrumentation Mechanical Mining
2000 - 2005
% Av. Annual Growth
2000 - 2005
% Av. Annual Growth
2000 - 2005
% Av. Annual Growth
Intermediate Skill Level¹ 0 nd3 16 839 18.15 1 893 29.89 High Skill Level² 99 24.00 18 069 3.81 3 461 12.34 Of which
- Masters 74 nd3 1 831 2.76 477 -0.18 - PhD 15 nd3 882 4.82 128 -7.57
Other nd3 nd3 nd3 nd3 nd3 nd3 Total 99 24.00 34 908 11.71 5 354 20.38 ¹ Post-school, pre-degree qualifications including college and technikon national certificates and diplomas. ² Higher education degree qualifications and post-graduate courses including BTech, Honours, Masters and PhD qualifications,and post-graduate diplomas. 3Data unavailable.
Source: HEMIS database Table 1.15. Number of enrolments and % average annual growth in enrolment in selected categories, 2000 - 2005
Life Sciences and Physical Sciences Mathematical Sciences
Physics Chemistry All
2000 - 2005
% Av. Annual Growth 2000 - 2005
% Av. Annual Growth 2000 - 2005
% Av. Annual Growth
Intermediate Skill Level¹ 1 928 -0.84 13 199 5.3 10 046 -10.54 High Skill Level² 15 502 5.44 38 835 5.48 63 685 2.12 Of which
- Masters 993 6.62 3 251 3.13 2 192 9.50 - PhD 734 -1.13 2 516 2.36 923 1.40
Other 98 nd3 71 nd3 319 nd3 Total 17 528 4.77 52 105 5.57 74 049 0.69 ¹ Post-school, pre-degree qualifications including college and technikon national certificates and diplomas. ² Higher education degree qualifications and post-graduate courses including BTech, Honours, Masters and PhD qualifications, and post-graduate diplomas. 3Data unavailable.
Source: HEMIS database

34
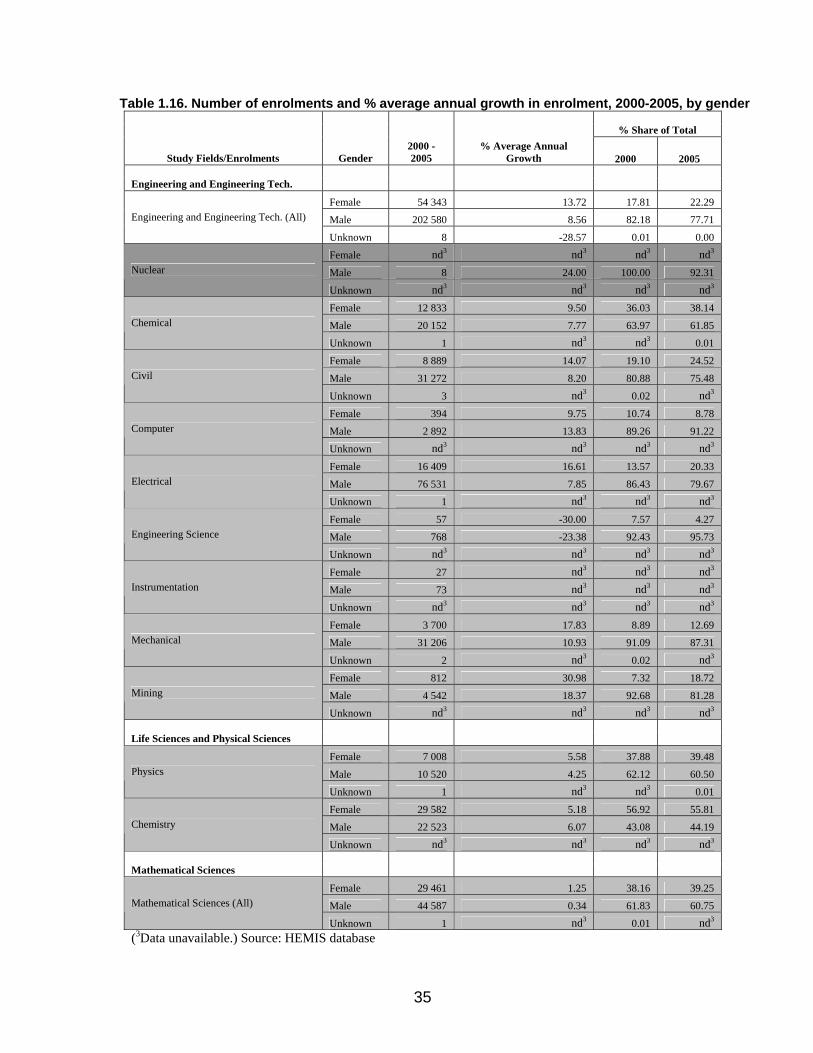
Growth rates for female enrolments were considerably higher in engineering but only marginally so in physics and mathematics. Thus, while the share of women in engineering improved by 4.5 points between 2000 and 2005, it hardly changed in the other two areas.
35
Table 1.16. Number of enrolments and % average annual growth in enrolment, 2000-2005, by gender % Share of Total
Study Fields/Enrolments Gender 2000 - 2005
% Average Annual Growth
2000
2005
Engineering and Engineering Tech.
Female 54 343 13.72 17.81 22.29
Male 202 580 8.56 82.18 77.71 Engineering and Engineering Tech. (All)
Unknown 8 -28.57 0.01 0.00
Female nd3 nd3 nd3 nd3 Male 8 24.00 100.00 92.31 Nuclear
Unknown nd3 nd3 nd3 nd3 Female 12 833 9.50 36.03 38.14
Male 20 152 7.77 63.97 61.85 Chemical
Unknown 1 nd3 nd3 0.01
Female 8 889 14.07 19.10 24.52
Male 31 272 8.20 80.88 75.48 Civil
Unknown 3 nd3 0.02 nd3 Female 394 9.75 10.74 8.78
Male 2 892 13.83 89.26 91.22 Computer
Unknown nd3 nd3 nd3 nd3 Female 16 409 16.61 13.57 20.33
Male 76 531 7.85 86.43 79.67 Electrical
Unknown 1 nd3 nd3 nd3 Female 57 -30.00 7.57 4.27
Male 768 -23.38 92.43 95.73 Engineering Science
Unknown nd3 nd3 nd3 nd3 Female 27 nd3 nd3 nd3 Male 73 nd3 nd3 nd3 Instrumentation
Unknown nd3 nd3 nd3 nd3 Female 3 700 17.83 8.89 12.69
Male 31 206 10.93 91.09 87.31 Mechanical
Unknown 2 nd3 0.02 nd3 Female 812 30.98 7.32 18.72
Male 4 542 18.37 92.68 81.28 Mining
Unknown nd3 nd3 nd3 nd3
Life Sciences and Physical Sciences
Female 7 008 5.58 37.88 39.48
Male 10 520 4.25 62.12 60.50 Physics
Unknown 1 nd3 nd3 0.01
Female 29 582 5.18 56.92 55.81
Male 22 523 6.07 43.08 44.19 Chemistry
Unknown nd3 nd3 nd3 nd3
Mathematical Sciences
Female 29 461 1.25 38.16 39.25
Male 44 587 0.34 61.83 60.75 Mathematical Sciences (All)
Unknown 1 nd3 0.01 nd3 (3Data unavailable.) Source: HEMIS database

36
The share of blacks in engineering rose to almost two thirds in 2005, while that of whites fell to below a quarter. The trend was similar in physics, but less pronounced in mathematics. Table 1.17. Number of enrolments and % average annual growth in enrolment, 2000-2005, by race
% Share of Total
Study Fields/Enrolments ‘Race’ 2000 – 2005
% Average Annual Growth 2000 2005
Engineering and Engineering Tech.
African 154 025 12.38 55.59 64.55
Coloured 12 808 9.92 4.56 4.63
Asian 20 601 6.44 8.68 7.35
White 69 355 4.11 31.11 23.41
Engineering and Engineering Tech. (All)
Unknown 142 8.16 0.07 0.06
African 3 0.00 100.00 23.08
Coloured nd3 nd3 nd3 nd3
Asian 1 nd3 nd3 12.82 White 4 nd3 nd3 60.26
Nuclear
Unknown nd3 nd3 nd3 nd3
African 22 623 10.55 62.16 69.59
Coloured 1 506 10.79 4.25 4.82
Asian 4 187 2.19 15.67 11.40
White 4 657 3.72 17.92 14.09
Chemical
Unknown 12 36.71 0.00 0.09
African 25 152 13.91 55.26 70.30
Coloured 2 586 5.66 6.67 5.46
Asian 2 485 4.53 7.05 5.46
White 9 929 -0.34 30.97 18.74
Civil
Unknown 13 5.71 0.05 0.04
African 530 24.31 10.08 20.52
Coloured 34 23.45 1.11 2.12
Asian 412 13.51 10.69 10.73
White 2 308 10.50 78.12 66.47
Computer
Unknown 2 nd3 nd3 0.16
African 57 065 12.46 56.90 67.15
Coloured 5 002 12.34 4.31 5.06
Asian 7 753 4.73 9.60 7.54
White 23 090 2.26 29.15 20.22
Electrical
Unknown 32 6.92 0.04 0.03
African 321 6.43 16.22 88.61
Coloured 18 nd3 4.32 nd3
Asian 46 nd3 14.05 nd3
White 439 -36.62 65.41 11.39
Engineering Science
Unknown nd3 nd3 nd3 nd3 3Data unavailable.
Source: HEMIS database
37
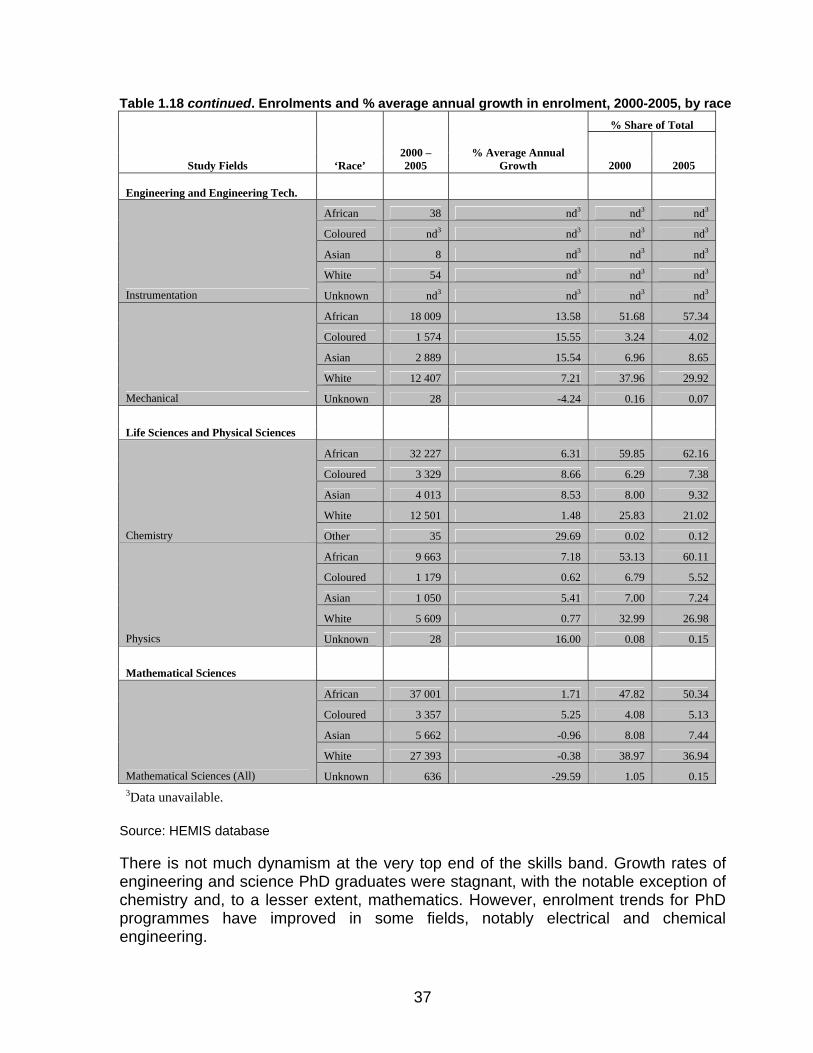
Table 1.18 continued. Enrolments and % average annual growth in enrolment, 2000-2005, by race % Share of Total
Study Fields ‘Race’ 2000 – 2005
% Average Annual Growth 2000 2005
Engineering and Engineering Tech.
African 38 nd3 nd3 nd3
Coloured nd3 nd3 nd3 nd3
Asian 8 nd3 nd3 nd3
White 54 nd3 nd3 nd3
Instrumentation Unknown nd3 nd3 nd3 nd3
African 18 009 13.58 51.68 57.34
Coloured 1 574 15.55 3.24 4.02
Asian 2 889 15.54 6.96 8.65
White 12 407 7.21 37.96 29.92
Mechanical Unknown 28 -4.24 0.16 0.07
Life Sciences and Physical Sciences
African 32 227 6.31 59.85 62.16
Coloured 3 329 8.66 6.29 7.38
Asian 4 013 8.53 8.00 9.32
White 12 501 1.48 25.83 21.02
Chemistry Other 35 29.69 0.02 0.12
African 9 663 7.18 53.13 60.11
Coloured 1 179 0.62 6.79 5.52
Asian 1 050 5.41 7.00 7.24
White 5 609 0.77 32.99 26.98
Physics Unknown 28 16.00 0.08 0.15
Mathematical Sciences
African 37 001 1.71 47.82 50.34
Coloured 3 357 5.25 4.08 5.13
Asian 5 662 -0.96 8.08 7.44
White 27 393 -0.38 38.97 36.94
Mathematical Sciences (All) Unknown 636 -29.59 1.05 0.15 3Data unavailable.
Source: HEMIS database There is not much dynamism at the very top end of the skills band. Growth rates of engineering and science PhD graduates were stagnant, with the notable exception of chemistry and, to a lesser extent, mathematics. However, enrolment trends for PhD programmes have improved in some fields, notably electrical and chemical engineering.
38
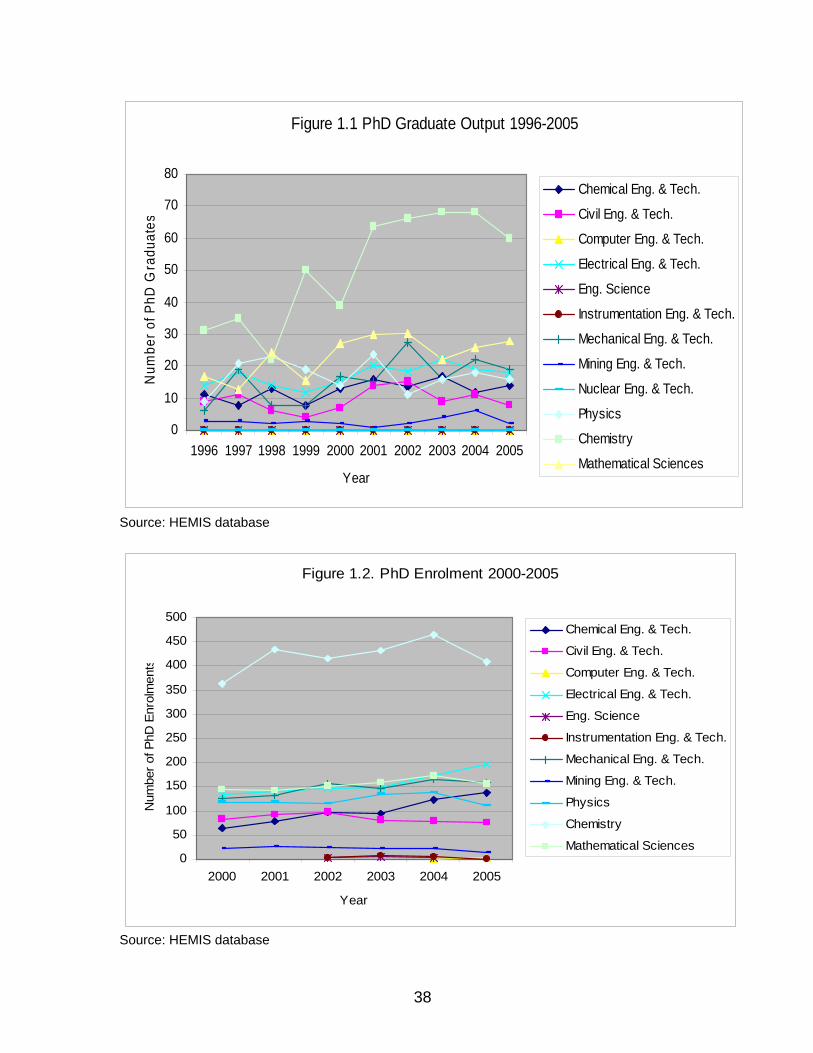
Figure 1.1 PhD Graduate Output 1996-2005
0
10
20
30
40
50
60
70
80
1996 1997 1998 1999 2000 2001 2002 2003 2004 2005
Year
Num
ber o
f PhD
Gra
duat
es
Chemical Eng. & Tech.
Civil Eng. & Tech.
Computer Eng. & Tech.
Electrical Eng. & Tech.
Eng. Science
Instrumentation Eng. & Tech.
Mechanical Eng. & Tech.
Mining Eng. & Tech.
Nuclear Eng. & Tech.
Physics
Chemistry
Mathematical Sciences
Source: HEMIS database
Figure 1.2. PhD Enrolment 2000-2005
0
50
100
150
200
250
300
350
400
450
500
2000 2001 2002 2003 2004 2005
Year
Num
ber o
f PhD
Enr
olm
ents
Chemical Eng. & Tech.
Civil Eng. & Tech.
Computer Eng. & Tech.
Electrical Eng. & Tech.
Eng. Science
Instrumentation Eng. & Tech.
Mechanical Eng. & Tech.
Mining Eng. & Tech.
Physics
Chemistry
Mathematical Sciences
Source: HEMIS database
39
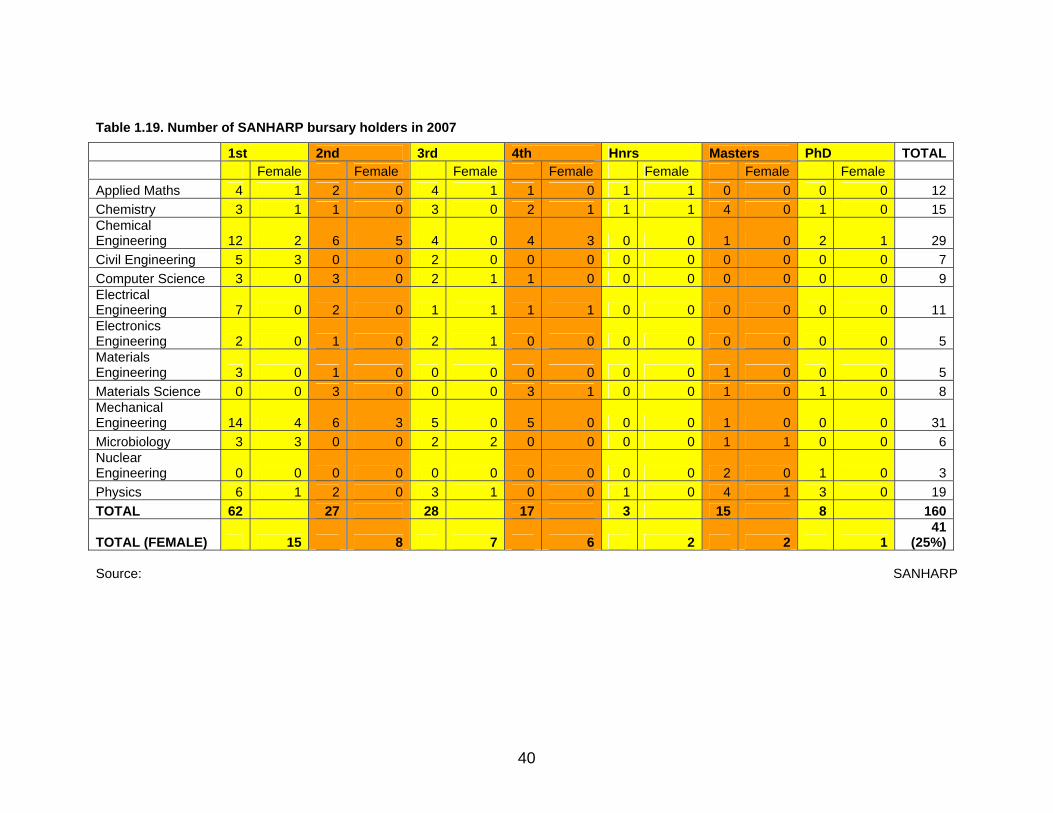
Targeted initiatives in the nuclear sector SANHARP bursary holders numbered 160 in 2007. The bulk of these (57%) studied engineering and the rest (43%) sciences. On average one in four were women who opted more for engineering (58%) than for sciences (42%), but among female students the world of science is evidently much more of a career option than for their adult counterparts. SANHARP originally aimed at producing 173 undergraduates and 156 postgraduate and postdoctoral students from 2005 to 2014. However, initially this only reflected the need of the PBMR which is why in light of the new build programme a new skills assessment is needed.
40
Table 1.19. Number of SANHARP bursary holders in 2007
Source: SANHARP
1st 2nd 3rd 4th Hnrs Masters PhD TOTAL Female Female Female Female Female Female Female Applied Maths 4 1 2 0 4 1 1 0 1 1 0 0 0 0 12Chemistry 3 1 1 0 3 0 2 1 1 1 4 0 1 0 15Chemical Engineering 12 2 6 5 4 0 4 3 0 0 1 0 2 1 29Civil Engineering 5 3 0 0 2 0 0 0 0 0 0 0 0 0 7Computer Science 3 0 3 0 2 1 1 0 0 0 0 0 0 0 9Electrical Engineering 7 0 2 0 1 1 1 1 0 0 0 0 0 0 11Electronics Engineering 2 0 1 0 2 1 0 0 0 0 0 0 0 0 5Materials Engineering 3 0 1 0 0 0 0 0 0 0 1 0 0 0 5Materials Science 0 0 3 0 0 0 3 1 0 0 1 0 1 0 8Mechanical Engineering 14 4 6 3 5 0 5 0 0 0 1 0 0 0 31Microbiology 3 3 0 0 2 2 0 0 0 0 1 1 0 0 6Nuclear Engineering 0 0 0 0 0 0 0 0 0 0 2 0 1 0 3Physics 6 1 2 0 3 1 0 0 1 0 4 1 3 0 19TOTAL 62 27 28 17 3 15 8 160
TOTAL (FEMALE) 15 8 7 6 2 2 141
(25%)

41
In 2007 five students graduated from North-West University in nuclear engineering and went to work for the PBMR, NECSA, M-Tech Industrial, or Eskom.
Summary: Is supply sufficient given the level of demand? On the basis of the available data it does not appear that there is a material shortage of engineers. Graduates consistently exceed the number of vacancies many times over. This is true for all fields of engineering and sciences that are of relevance to the nuclear sector. It is really only in nuclear engineering proper where an admittedly very low vacancy rate is higher than the graduation and even the enrolment rate. In view of the numbers involved, this is unlikely to amount to a crisis per se, but it suggests that nuclear growth in the future might be hampered by skill availability at the specialist end of the skills spectrum. Figure 1.3. Skills supply and demand in Engineering and Engineering Technology, 2000-2006
Engineering & Engineering Technology
0
5000
10000
15000
20000
25000
30000
35000
40000
45000
50000
2000 2001 2002 2003 2004 2005 2006
Engineering & Eng.Tech. EnrolmentsEngineering & Eng.Tech. GraduatesEngineering & Eng.Tech. Vacancies
Source: HEMIS database, Sunday Times vacancy advertisements database
42
Figure 1.4. Skills supply and demand in Chemistry, 2000-2006
Chemistry
0
2000
4000
6000
8000
10000
12000
2000 2001 2002 2003 2004 2005 2006
Year
Num
ber o
f Stu
dent
s/Va
canc
ies
Chemistry Enrol.
Chemistry Grads.
Chemistry Vacancies
Source: HEMIS database, Sunday Times vacancy advertisements database
Figure 1.5. Skills supply and demand in Physics, 2000-2006
Physics
0
500
1000
1500
2000
2500
3000
3500
4000
2000 2001 2002 2003 2004 2005 2006
Year
Num
ber o
f Stu
dent
s/Va
canc
ies
Physics Enrolments
Physics Graduates
Physics Vacancies
Source: HEMIS database, Sunday Times vacancy advertisements database

43
Figure 1.6. Skills supply and demand in Mathematical Sciences, 2000-2006
Mathematical Sciences
0
2000
4000
6000
8000
10000
12000
14000
2000 2001 2002 2003 2004 2005 2006
Year
Num
ber o
f Stu
dent
s/Va
canc
ies
Maths Enrolments
Maths Graduates
Maths Vacancies
Source: HEMIS database, Sunday Times vacancy advertisements database
4 CASE STUDIES
Introduction The most important manifestations of the nuclear energy sector in South Africa include the power plant at Koeberg, the work surrounding the PBMR, and the new build programme, both PWR and HTR. The case studies that follow reflect this. They include a consultancy that provides maintenance and operational services to Koeberg and participates in the PBMR, one of the major vendors of reactor vessels in the world, and Eskom, the sole operator of nuclear power stations in the country.
Nuclear Consultants International NCI started as a South African company in 2001 with only four employees who were seconded to Eskom. In 2002 NNC (now AMEC Nuclear), the UK’s largest nuclear consultancy bought a 50 per cent share in NCI in order to gain a foothold in a market it saw as promising. This afforded NCI instantaneously a lot of international credibility in that it now had access to a large skill base, resources and services, global experience, and exposure to quality management systems that are required in the nuclear industry. This allowed implementing quality management systems at NCI thanks to which the company subsequently became an approved supplier to Eskom. This in turn
44
made it possible to bid for business at Koeberg, in competition with Areva and local suppliers. NCI thus changed from initially a manpower company to one that provided turnkey project management services to both utilities and OEMs. For example, NCI has locally partnered with Westinghouse and has become one of their suppliers. Koeberg opened up as a market for Westinghouse after Eskom successfully introduced competition between the world’s two major OEMs for services, modifications, safety studies, etc. for Koeberg. The market for this kind of services is currently made up of just one other project management company, Lesedi, with whom NCI competes for Koeberg business. On the implementation side, there are preferred suppliers such as mechanical and electrical subcontractors. For example the welding shop is in the hands of a subsidiary of Alsthom. As an independent company, NCI is strategically geared toward providing services to the utilities and the regulators. For example, AMEC helps the severely staff-challenged NNR cope with all the licensing work emanating from the PBMR project. NCI grew rapidly; its turnover between 2002 and 2007 rose fifteen-fold. It expanded its workforce to currently some 50 people, most of whom work on the site office at Koeberg. Locally available skills at the high end have been and continue to be a major constraint to growth. There is a large skills base overseas, and it is possible to access this pool – for example, NCI’s contingent of 10 experts working at PBMR are all expats. NCI’s growth trajectory is based on hiring two kinds of engineers and technicians. The first consists of some 12-13 recent graduates primarily from UCT, Stellenbosch, and CPUT, while the second is made up of more senior white project managers who came from Eskom where they had been involved with Koeberg. It is fair to say that the former join a relatively small consultancy – despite the fact that this might seem a riskier move – because as whites it is difficult for them to start their careers in the large corporates, and the latter do so because their careers had hit a dead end at those same corporates. BEE therefore saw to it that NCI is largely a white company. The background of both groups is mostly in mechanical, electrical, or electromechanical engineering. However, some senior staff have attended a dedicated nuclear engineering course offered by Koeberg itself, while the more junior people have had exposure to primary courses also at the plant. In essence, maintenance and operation (by contrast to design proper) in the nuclear industry require standard mechanical and electrical engineering skills, albeit at a higher level than in most other industrial applications. This is because the available reactors come not just with a ready design, but also with a turn-key nuclear island which will not require local input. Where local input is required is in

45
the auxiliary systems such as ventilation, construction, civils, and so forth. That’s therefore where local competence is required. NCI currently has a ratio of roughly 2:1 of senior to junior people. Although it attracts excellent graduates for reasons pointed out above, it takes time to turn the younger people into fully productive members of the company. Therefore, the limits to growth consist both of the capability of NCI to absorb and upgrade skills and of the difficulty in finding suitably qualified people. Thus, in the hypothetical case of Koeberg doubling its capacity tomorrow, NCI would not be able to deliver on twice as high a business volume. But with the lead times associated with building new plants, it might grow organically into that position provided there is a higher supply of engineers than currently on the market. It is important to realise that utilities who need large capital projects done and who, unlike NCI, cannot pick-and-choose, are in a very different position. This indirectly suggests that there may be a conflict between the PBMR agenda and the new-build programme. This concerns not just the volume of people required to support a vastly expanded nuclear generation of electricity, but also the kinds of skills or competences that it takes to operate 2nd generation plants on the one hand, or to develop and manufacture a 3rd generation reactor ex novo.
Westinghouse South Africa Westinghouse, alongside Areva, is one of two big vendors of PWRs in the world. The company employs globally some 10,000 people. Its current flagship product is the AP-1000, with 1000MW output. The AP-1000 is marketed as an inherently safe product with extensive passive safety features. Westinghouse’s involvement with Koeberg results from the fact that Framatome built Koeberg under license from Westinghouse. Hence Westinghouse has been intimately involved with the 900 and 1300 MW reactors, both here and initially in France itself, i.e. before the license expired and the French developed their own technology. For most of Koeberg’s gestation, Eskom privileged the relationship with Framatome/Areva, but Westinghouse had occasional involvements to do with the safety systems, fuel supply, and so forth. In 2003, however, Eskom wanted to introduce competition between the OEMs and departed from its exclusive long-term relationship with Areva. Westinghouse which until then had not had a physical presence in the country, successfully bid for a tender that initially involved a safety upgrade and some maintenance tasks as well as nuclear fuel business. At the same time, it also got involved in the PBMR. In addition, Eskom declared that Westinghouse would be one of two preferred bidders for the planned expansion of conventional reactors. Hence, the company now has three activities in its portfolio: Koeberg, where it has five employees on site, the
46
traditional new build programme where Eskom seems inclined to a the-winner-takes-it-all position whereby either Westinghouse or Areva would get the entire order, and the PBMR. With respect to the latter, Westinghouse is currently putting the finishing touches on its acquisition of the South African nuclear company IST in Centurion, with some 120 engineers, where it immediately organised personnel and technology exchanges with its US operations. Westinghouse’s business model is that of a global design company that works as much as possible with local partners and suppliers. It has developed requisite skills in projects in France, Korea, Japan, and China. On average, its operations at Koeberg involve 50 per cent local inputs. However, for the services to Koeberg, the client also prefers to see a certain share of “proper” Westinghouse personnel on site which therefore limits the degree to which the company can rely on local contractors. Its current workforce is made up mostly of people with nuclear experience, including former Eskom employees. However, it is also possible to hire specialist engineers from, e.g. the mining sector or with a background in petrochemical applications, and train them in nuclear applications. Westinghouse is sensitive not to poach engineers from its clients within SA.. The local workforce is supported by nuclear specialists from Westinghouse operations in Europe that join the SA operation (for Koeberg) on long-term assignments or shorter visits. Thus even servicing the current Koeberg contract requires specialist skills that are not available in the country. In sum, Westinghouse has access to the kind of human capital both locally and internationally that it needs to honour its current workload at Koeberg. But it is running at full capacity. Therefore, if the workload were to increase further, skills constraints would likely become binding. (In principle, the workload will increase because Koeberg’s advancing age implies that maintenance will become more intense.) Also, should it become necessary to build up a local long-term operation consisting of some 50 or 100 engineers, this would be very difficult under current circumstances. The acquisition of IST does not obviate this need in the sense that their engineers do not have significant PWR and operating experience. The expectation is, however, that once the new build construction starts in three years or so, IST personnel, through Westinghouse’s involvement with Koeberg, would have gotten more exposure to PWR technology and could thus support the new build as well. Koeberg runs its own in-house training programme for Eskom engineers with which Westinghouse is involved and to which it contributes. Eskom is about to embark on a more ambitious training and recruitment programme in view of the new build with which Westinghouse would try to align its own HR needs should it win the new build contract.

47
For the new build programme, the time lines are such that construction could feasibly start in 2010 and would last six years, irrespective of location. New build implies a massive human capital effort at the level of artisans, technicians, and engineers. Insofar as the new plants are turn-key projects, it would be the contractor’s responsibility to field the required number and quality of welders, electricians, and so forth. But it is also true that in view of the scarcity of these kinds of skills in the country, any upscale of the nuclear workforce would come at the expense of other infrastructure projects, thus resulting in a zero-sum game. In light of this massive market failure, it is unlikely that the solution to the skills constraints could be entirely privatised, i.e. rest with Westinghouse and whoever else makes up its consortium. In general, Westinghouse is more confident about finding and training the right calibre and number of engineers than it is about skills at the artisan level (from which it is obviously further removed). So lower-level skills present a bigger coordination problem – in other words one where the private sector relies more on government to help come up with a solution – than medium and high skills. Since the ambition of the nuclear expansion plans is to localise as much of the hardware production as possible – up to 90 per cent -- the contractor would over time face an increasing pressure of skills creation and retention as the responsibility for localisation will stay with the supplier, while the local supply chain and the public sector would face the same trend. Whoever ends up having to “invent” a sufficient number of people with an adequate skills profile is in the unenviable position not to be able to resort to quick fixes (as might exist, for example, when Indian maths teacher substitute currently unavailable South African capacity in this regard). This is because due to the global downturn in the nuclear industry from the second half of the 1980s, there was little incentive for a rejuvenation of the workforce which has consequently thinned out considerably. In turn, the nuclear renaissance in countries like France and the US, alongside aggressive expansion plans in countries like China, mean that the global pool of requisite expertise is in excess demand. All this therefore puts a heavy emphasis on the need for training and education in nuclear technology, manufacturing, and operation to be expanded with due urgency in order to minimise likely shortfalls from 2010 or whenever new build kicks in. With respect to the PBMR, almost all capacity at IST is focused on the work there. IST staff have been marginally involved in Koeberg and there is a possibility (and the ambition) of cross-fertilisation. Westinghouse is very upbeat about PBMR technology because of its associated advantages of modularity, its small size suitable for isolated locations, safety, and so on. It might be particularly attractive for the generation of process heat. Contrary to what some of PBMR’s detractors say, there is interest in the PBMR technology in the US where Westinghouse has supplied relevant designs and feasibility studies to
48
DoE. The biggest likely constraint to the success of the PBMR is not technological or commercial, but due to the potential conflict over scarce skills when the new build of PWRs comes on stream, generating lots of demand for literally all skills relevant to the manufacture of components and the building and finally operation of the plant. Contrary to what NCI submitted, in principle skills between the two technologies are transferable both ways. It merely seems more likely that a project that actually exists or is being built (PWR) will enjoy seniority over another project that is stuck in the design phase or at best being built but with some years to go before criticality is achieved. Also, in light of the energy shortages projected for the country, there is obviously a trade-off between building a reactor that is known to deliver 1000 MW as soon as it is switched on as opposed to building one that might deliver roughly a tenth of this generating capacity (PBMR). The advantage of the transferability of skills is that one wouldn’t need two different training programmes. It might be possible to run a course on nuclear engineering that gives participants the choice of specialisation on one or the other technology towards the end.
Eskom The interview focuses on human resources related to operational readiness. It therefore does not include people needed for the build programme, but only people needed for plants that run already or will run in the future. Some 700 of the 1,200 staff at Koeberg can be considered critical skills. Koeberg’s most important commodity is licensed reactor operators. Matriculants, graduates from a technical college, university of technology, or university proper can become reactor operators. It takes roughly 3-4 years to train a person straight out of school in operational nuclear matters, at a cost of some R1m. The difference between those with more and less high skills is that the latter can eventually move into managerial positions. Engineers that train as designers or system engineers are also important. Their training period is the same, the difference being that they add – albeit little – value from Day One. Artisans take some 3-4 years to train. The difference between operators and engineers on the one hand and artisans on the other is that artisans work mostly from vendor manuals and concentrate largely on their familiarity with certain components. By contrast, knowledge of the overall plant and how it works is not that crucial. After the training these engineers and artisans are then nuclear specialists yet the true competence resides in the years of experience through direct exposure to plant operation and maintenance that follow the completed training.

49
Koeberg has recently been trying to fill 180 vacancies across all skill bands from artisans to senior staff. This recruitment drive was not entirely successful so parts of the recruitment campaign are currently being re-run. Of 66 open engineering positions, some 20 are for capacity development in the area of design. These are people straight out of university that will be trained some two years before they become productive members of the Koeberg workforce. Eskom is also busy getting its human capital pipelines organised in view of the new build programme. The planned mega wattage of the new build programme amounts to 20,000 MW, roughly ten times the size of Koeberg. To operate such a capacity requires recruiting and training some 3,500 engineers over the next ten years. The first contingent for Nuclear I of some 35 operators has already been training since 2006. They are trained on basic PWR technology using Koeberg as an example. The new build programme is not allowed to poach staff from within the organisation; i.e. Koeberg operators cannot become Nuclear I operators. The problem with in-house training is that because training (by SOEs) has fallen a little out of fashion, instructors are hard to find. Koeberg will therefore train instructors (nuclear power plant operation instructors) from scratch, something that will start next year with 24 individuals and take about three years to complete. When looking for engineers without experience, the South African pool of candidates consists literally of thousands of people. Eskom can approach them and make use of them because it has strong training programmes in place. Backgrounds looked for include mechanical, civil, electrical, chemical, electromechanical, and mechatronics engineering. Universities with poor engineering graduate output include UKZN, Limpopo, NMMU. All others are fine. The usefulness of the only proper nuclear engineering department in the country at the University of the North-West in Potchefstrom is limited insofar they turn out overqualified people whose skills are not really in demand at the operating level. What Koeberg primarily needs is not masters, let alone doctoral graduates, but undergraduates with a background in nuclear engineering. Where more advanced skills are needed is in those areas where through the build programme technology is supposed to be transferred so as to enable an indigenous South African nuclear capacity all the way to being able to export PWRs. But this is not something the operators are concerned with. One big problem with the incoming engineers is that the depth of their education is less than what it used to be. Candidates are de rigueur unable to draw the design of a power plant or answer basic questions of thermodynamics and so on. This is not something one could address by hiring masters instead of bachelor graduates. The former are merely more specialised but unless the specialisation is exactly what is needed in the plant, the additional education doesn’t add any
50
value. Research skills per se are of no use. What would add value is a more solid undergraduate education. From next year Koeberg is teaming up with UCT which will offer a course traditionally offered at Koeberg as a fourth-year elective to all its engineering students. The programme will initially run for three years. Eskom is also looking at financing an entire proper nuclear engineering faculty. UCT is a preferred partner both because its students are good and because they tend to stay in the Western Cape instead of eventually moving back to Gauteng. The relationship with the university is also beneficial because UCT administrators will alert Eskom to promising students in financial difficulties that Eskom can help with bursaries, thus co-opting them before graduation. The big prize in Eskom’s training endeavour is the building of a nuclear training academy on the Koeberg grounds. The project is currently still awaiting its EIA. The academy might be set up in partnership with other institutions such as the preferred vendor of the new build. It is also possible that the academy will include facilities where outside agencies such as the Institute of Welding can do specialised training against a lease fee for the premises. These things are still to be decided; what is clear is that Eskom has the funds to go ahead with the academy and will do so. The training programme will not be limited to strictly nuclear topics but include soft skills such as leadership and management as well. Koeberg does not rely on business school graduates for these competences because it finds that outsiders generally do not live up to the safety and compliance culture so intrinsic to a nuclear operation. In the past Koeberg also ran a bridging programme for high-school leavers. Against a monthly stipend and food and accommodation, these young people would be trained in practical physics. Half of the class would then typically stay on at Koeberg and go into specialised training as nuclear operators. Koeberg had to stop this programme because it needed the students’ on-site accommodation for other purposes. But this was an early-in-the-pipeline intervention that addressed the deficient sciences skills with which many young people leave school. Koeberg would be interested in reanimating such a programme provided sufficient funding were made available. Koeberg suffers from a high staff turnover. Every year some 70-80 people with critical skills (i.e. those that require years of experience such as engineers, technicians, operators, project managers) leave Eskom. They are on the whole highly trained and eminently marketable, both nationally and abroad. People with roots in Gauteng often end up returning there; others go and work for foreign utilities in Europe, especially the UK. Regionally the Eastern Cape has traditionally been a good recruitment ground if only because there are no jobs available there. However, recently that has been changing with Alcan gearing up its operations for COEGA and hiring the same kind of profile of young graduates as Koeberg.

51
Eskom operates with the rest of the industry, i.e. including its suppliers, a no-poaching agreement whereby job transfers across organisations are discouraged. This is a collective effort to combat free riding or zero-sum games that in theory could result from fishing in the same limited pool of talent. Eskom as the client would not be responsible for skills required to build new reactors – the vendors will have to deliver turn-key operations.
Summary The case studies produce the following insights. First, with a few exceptions, South Africa does not yet operate at the technological frontier in nuclear energy. It relies on outside designs in reactor technology, technology transfer and learning, skills upgrading, and so on. It is therefore paramount that the nuclear workforce, especially but not only at the high end, be involved in global knowledge networks. This is especially important in light of the stated ambition to make South Africa a builder and exporter of PWR technology over the next quarter century. Second, due to its technical complexity and extremely high safety standards, the industry requires a special kind of expertise. In other words no one from outside the industry can hit the ground running. This does not mean that there are no suitably qualified people, but they must undergo rigorous training for a few years before they become fully productive members of the nuclear workforce. This is true across the skill bands. This training currently takes place almost exclusively within nuclear enterprises. The constraints on training are twofold. Downstream they result from capacity limits in the private sector, especially in smaller companies. Upstream they result from cohorts of school leavers or higher education graduates whose grounding in science or engineering is found to be wanting. This is a problem insofar it imposes the burden of education – as opposed to training – on firms; something that they are not equipped to do. It is likely that the short- to medium-term solution to this problem lies in closer coordination of education and training programmes between education institutions and employers. Eskom’s partnership with UCT in support of an undergraduate course on nuclear engineering is a case in point. Third, in general it appears easier for employers to address skills shortages at the higher end. This is because while nuclear engineering skills are critical, the human resources to expose to enterprise training do exist. By contrast, artisan skills are both scarce and critical and as such more difficult to accommodate. Fourth, due to skill constraints the industry in principle faces a collective action problem that could lead to active poaching on the part of employers or job
52
hopping on the part of the work force. Such zero-sum games or other attempts at free riding would defeat the purpose and the objectives of the national nuclear programme. It is commendable that the industry has addressed this problem through rules that essentially ban poaching of human resources.
5 RECOMMENDATIONS The study has shown that the nuclear sector can currently make do with the volume and quality of human resources at its disposal. This is not to say that there are no problems – there are plenty – but that on the whole the numbers are there to operate and maintain both the existing and future plants, and that the necessary expertise in dealing with nuclear technology exists and can be passed on to new entrants into this industry. At the same time, however, the envisaged expansion of nuclear energy generation over the next two decades or so is unprecedented. The sector will need literally thousands of people across the skills spectrum to build and operate the new plants. This will exacerbate those problems that are already in evidence – such as poor backgrounds in science and mathematics of most school leavers – and possibly throw up new ones. The latter include the depth of technical knowledge required to localise the component industry required to sustain up to 90 per cent local content of the PWRs and possibly more in the case of the PBMR. Not all firms are equally equipped to deal with this challenge. The case studies provided evidence that Eskom has plans in place to hire thousands of people so that it can be ready when the first new nuclear reactors reach criticality. But Eskom is a large local company with a proud history of massive training programmes. Smaller firms are less likely to rise to the challenge, especially for scarce skills where there are economies of scale in training. Also, either Westinghouse or Areva will have to build some five or six reactors while gradually increasing local content. While they do have experience in working with local contractors, they, unlike Eskom, are not experienced in building up a local workforce from scratch. Given the numbers involved, this is a coordination problem that the private sector by itself may not be capable of solving. Government initiatives in this area – such as SANHARP’s bursaries and research chairs – address these concerns but they do so in a piecemeal and marginal fashion. A few hundred high-school graduates with specialisations in math and sciences are but a first step. The advantage of the nuclear build programme with respect to human resource development is its long lead times. It is known that the first new reactor will not be built before 2010 and not be finished before 2016. The others will take even longer. Hence interventions in favour of an intensification of science and maths

53
training at high school level will produce people that in principle could be raw material for becoming operators in a few years and nuclear engineers in four more years. What is required is not so much a change of tack as a massification of the initiatives underway. This would also address transformation most effectively. At the end of the pipeline, equity targets could be relaxed because the country relies on foreign expertise which clearly would not address inequities anyway. For the time being it would appear that South Africa needs all the expertise it can get, regardless of race or gender. In the future, the changing profile of enrolments and graduates of which this study gave evidence will hopefully see to it that at the end of the pipeline new talent reflects the demographics of the country.

54
PART 2: SPACE*
* The following people gave generously of their time and helped with resources: Anita Loots, Kobus Cloete, Patricia Whitelock and Glenda Kruss. We are grateful for their input.
55
1 SECTORAL PROFILE3
Space science and technology in the world4
This year marks the 50th anniversary of the Space Age. On the 4th of October 1957 the first artificial satellite, Sputnik 1, was launched by the then Soviet Union. Today the space industry is a multi-billion dollar industry, and some 25,976 payloads and debris have been sent into space since 1957 (Space Today Online 2000) with 900 satellites launched between 1996 and 2007 (SatNews 2007). The space industry today is shaped by three primary forces, geopolitics, commerce and cosmology (Geveden 2006). The face of the world space industry is changing. Euroconsult, a French consultancy specialising in assessment of the space industry, identified 35 leading countries (and organisations) and 48 emerging national space programmes in their 2006/2007 research report on space markets. The leading countries in the world space industry include the USA, Western Europe, Russia, Japan and China (see Figure 1 below). Ten new national space agencies have been formed since 2000 (Euroconsult 2007). The newcomers from the African region include Algeria, Egypt, Libya, Morocco, Tunisia, Ivory Coast, Kenya, Namibia, Nigeria and South Africa. At the start of the ‘Space Race’ countries participated in order to show “technical prowess and cultural superiority” (Geveden 2006: 493). Participation in space initiatives has now become more about the exploration, development and use of space. Space initiatives are becoming multi-national endeavours as more and more countries collaborate on their space initiatives. Collaboration on space initiatives results in more value-for-money projects as space science and technology initiatives are expensive and involve a high level of technical and other risk. There is also a move towards using space science and technology for humanitarian issues such as disaster management, telemedicine and water management. An example is a UK-lead initiative, the Disaster Monitoring Constellation (DMC), which consists of five satellites owned by Algeria, China, Nigeria, Turkey and the UK. Having five satellites positioned at various spots allows the DMC to monitor a wider area of the earth and thus have a greater impact in work on environmental monitoring, disaster management, etc. (www.bnsc.gov.uk). Satellites have a limited lifespan and thus new and improved satellites are always needed to replace those that have expired. 3 This section is largely based on background material and data assembled by Euroconsult (http://euroconsult-ec.com), the Department of Science and Technology’s space portal (www.space.gov.za), the SKA international project (www.skatelescope.org), the SKA South African project (www.ska.ac.za), and the SALT (www.salt.ac.za). 4 Various definitions of space technology exist. For the purposes of this report the definition of space technology employed by the South African government will be used. Space technology is defined as earth observation from space (satellite technology) and space observation from earth (telescope technology).
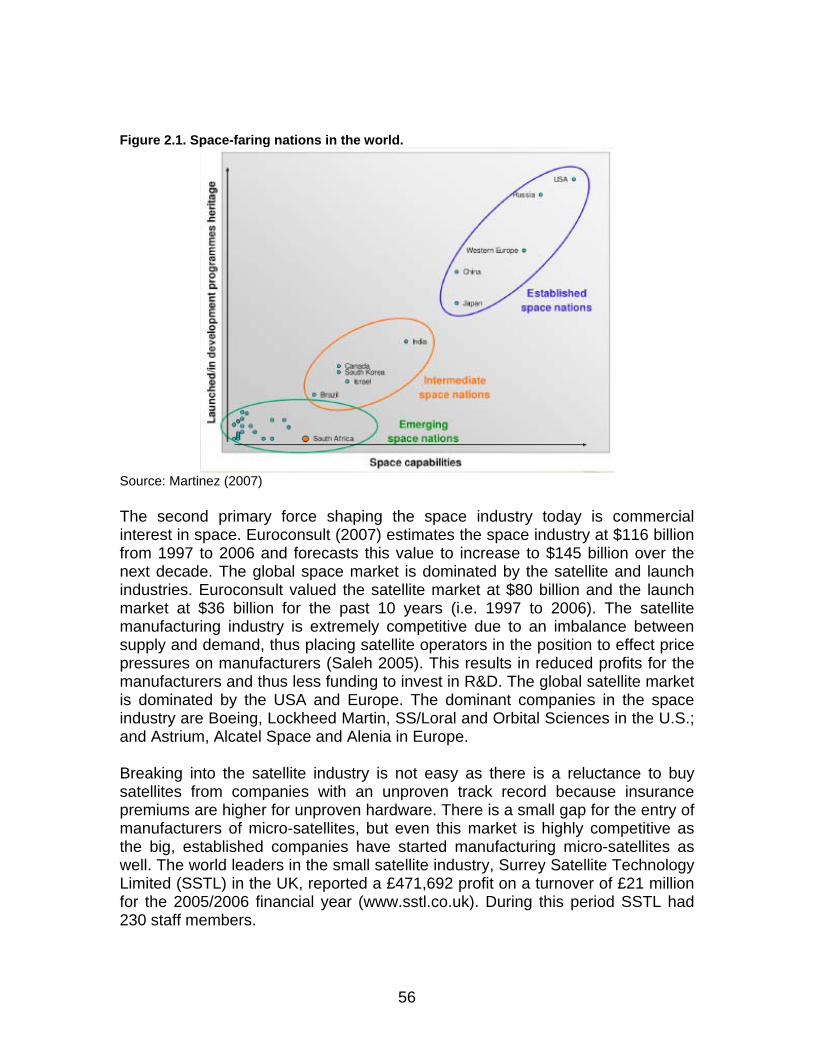
56
Figure 2.1. Space-faring nations in the world.
Source: Martinez (2007) The second primary force shaping the space industry today is commercial interest in space. Euroconsult (2007) estimates the space industry at $116 billion from 1997 to 2006 and forecasts this value to increase to $145 billion over the next decade. The global space market is dominated by the satellite and launch industries. Euroconsult valued the satellite market at $80 billion and the launch market at $36 billion for the past 10 years (i.e. 1997 to 2006). The satellite manufacturing industry is extremely competitive due to an imbalance between supply and demand, thus placing satellite operators in the position to effect price pressures on manufacturers (Saleh 2005). This results in reduced profits for the manufacturers and thus less funding to invest in R&D. The global satellite market is dominated by the USA and Europe. The dominant companies in the space industry are Boeing, Lockheed Martin, SS/Loral and Orbital Sciences in the U.S.; and Astrium, Alcatel Space and Alenia in Europe. Breaking into the satellite industry is not easy as there is a reluctance to buy satellites from companies with an unproven track record because insurance premiums are higher for unproven hardware. There is a small gap for the entry of manufacturers of micro-satellites, but even this market is highly competitive as the big, established companies have started manufacturing micro-satellites as well. The world leaders in the small satellite industry, Surrey Satellite Technology Limited (SSTL) in the UK, reported a £471,692 profit on a turnover of £21 million for the 2005/2006 financial year (www.sstl.co.uk). During this period SSTL had 230 staff members.

57
It is thus not surprising that leading space-faring countries and organisations have increased their investment in space applications for both civil and defense-related endeavours (Euroconsult 2007). Globally, expenditures for civil and defense-related space endeavours have reached a historical high of more than $50,5 billion, and showed a 5% growth since 2005 (Euroconsult 2007). The world leaders in space, NASA, had a budget of some $16,7 billion in 2007 and plans to increase the budget to $17,309 million in 2008 (www.nasa.gov). Human spaceflight is emerging as a commercial space activity. Virgin Galactic has already secured 157 passengers wanting to experience a few minutes of low gravity conditions at a cost of $20 000 per seat (Geveden 2006). The third primary force shaping the space industry today is cosmology. Humans have been interested in cosmology for centuries. A number of mega-science astronomy projects are planned for the 21st century. The aim is to upgrade existing technologies and develop new, improved technologies for probing deep into outer space and exploring questions about the evolution of the universe, testing Einstein’s Theory of General Relativity, etc. The Square Kilometer Array (SKA), which will be the world’s largest interferometer radio telescope, is one such mega-science technology planned for completion in 2020. South Africa, together with Australia, has been short-listed to host this world-class, multi-national initiative. The U.S.A are the world leaders in radio astronomy and the international radio astronomy community consists of approximately 1000 radio astronomers and there are about 20 radio astronomy technology facilities globally (Hall & Kahn 2006). Another example is the new large telescope, the successor to the Hubble Space Telescope in Texas (USA), which is to be built by 2013. The telescope will be called the James Webb Space Telescope (JWST) and will be a joint project of the European Space Agency (ESA), NASA and the Canadian Space Agency. There are also plans to upgrade the Hubble. Technologies such as the SKA and JWST provide the opportunity for nations to demonstrate their scientific capabilities, share technology know-how and collaborate on innovative R & D initiatives.
Space technology and public opinion In the 1950s, at the start of the space race, space agencies had a huge public following as it gave the hope that our daily lives would be dramatically improved by technology; but space agencies have since lost their public following (Brown 2007 citing Pelton 2006). The major public criticism of government investment in space is that the multi-million dollar investments in a highly competitive, high risk industry are at the expense of critical social needs. There is discontent that

58
progress in space science and technology has not been accompanied by a reduction in inequality and poverty (Brown 2007 citing Pelton 2006). For example, a spokesperson for the Democratic Alliance party in South Africa, Sakkie Blanchay, publicly disagreed with government spending $10 million for the SALT project. He was reported to have said that, "Many people across South Africa don't have access to schools with any books…I would have preferred seeing the millions of dollars spent on this project going towards training more teachers and buying better equipment for schools" (BBC News Online 2005). There is also world-wide concern with regard to the possibility of nuclear weapons and other weapons of mass destruction being sent into and used from space (Brown 2007 citing Pelton 2006). There is an increasing effort by governments to promote the use of space and space technology for peaceful uses. The United Nations plays a key role in monitoring the use of space and space technology. Ninety-eight countries have ratified or signed the UN’s Outer Space Treaty of 1967, which promotes the peaceful use of space and space technology and prevents the weaponisation of space (van Wyk 2007). The UN and individual nations have also promoted and collaborated on projects focused on using space technology for the benefit of humankind.
Space science and technology in South Africa
Introduction
South Africa has been identified as one of the best observing sites in the world and shares the lead in astronomy in the southern hemisphere with Chile and Australia (see Figure 2 below). South Africa has the geographic advantage in that it boasts optimal conditions for astronomy initiatives including clear skies, low levels of light pollution and low population density, and optimal weather conditions for observing the galaxies. Another geographic advantage is that South Africa “can access” the sky at different times to the other observatories in the southern hemisphere, that is, South Africa is able to make observations during the other countries’ daylight hours.

59
Figure 2.2. The best observing sites in the world (red). Those in the southern hemisphere are situated in Chile, Namibia, South Africa and Australia.
Source: www.salt.ac.za South Africa has a long history in space science and technology. Its first observatory, the Royal Observatory, was founded in 1820 in the Cape. South Africa was an active participant in space exploration from the beginning of the Space Age in 1957. The tracking station at Hartebeeshoek (HartRAO) was commissioned by NASA to track satellites from the 1950s to the 1970s. HartRAO received the images of Mars taken by the Mariner IV spacecraft, which were the first images to be received on earth. Space science and technology was well-funded by the apartheid government, which focused mainly on developing military space initiatives. In the 1980s South Africa developed its own satellite system that was to be used by the South African Air force. The satellite system included a satellite, called GreenSat; a launcher; a launch facility that also served as a tracking station (Overberg Testing Station); and a satellite applications and integration facility (Houwteq) (www.issa.org.za/satellite.html#3). These space initiatives were discontinued in 1994. The post-1994 democratic government has now recognised the country’s strength in space science and technology, and has begun to focus initiatives to revive the space sector to enable the country to once again participate actively in space initiatives and gain from the global space market. Space science and technology is one of the Frontier Science and Technology programmes of the Department of Science and Technology (DST). DST allocated about R52 million
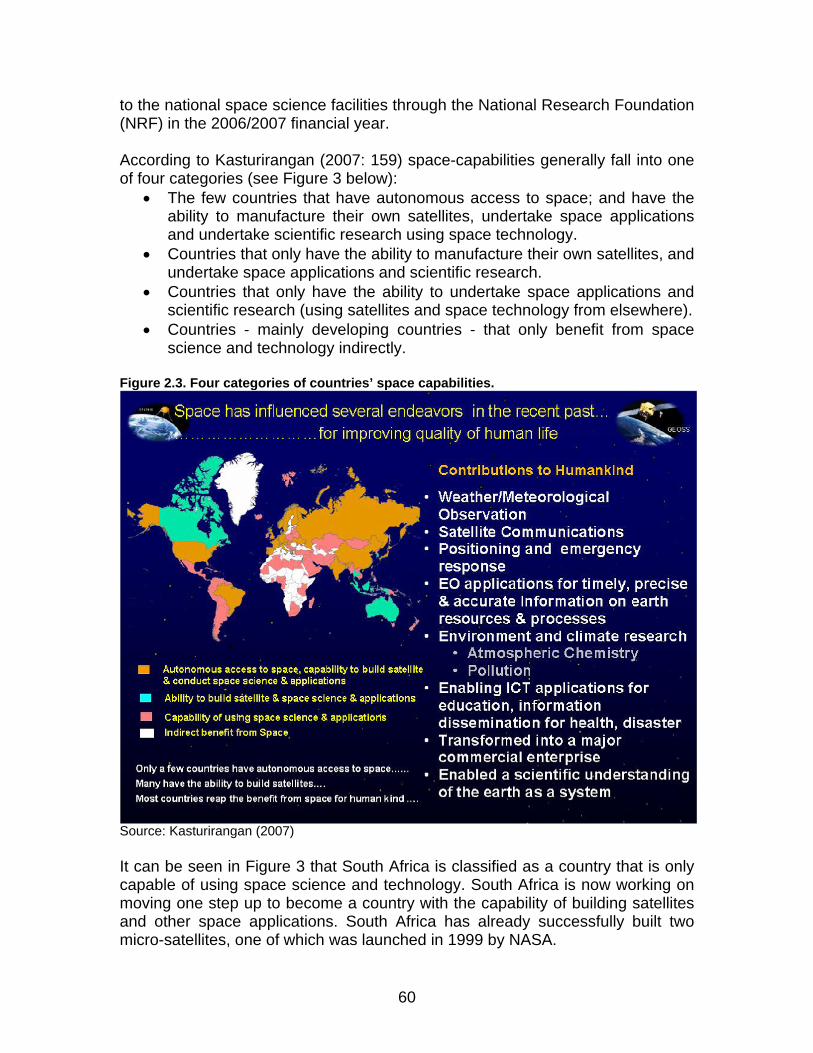
60
to the national space science facilities through the National Research Foundation (NRF) in the 2006/2007 financial year. According to Kasturirangan (2007: 159) space-capabilities generally fall into one of four categories (see Figure 3 below):
• The few countries that have autonomous access to space; and have the ability to manufacture their own satellites, undertake space applications and undertake scientific research using space technology.
• Countries that only have the ability to manufacture their own satellites, and undertake space applications and scientific research.
• Countries that only have the ability to undertake space applications and scientific research (using satellites and space technology from elsewhere).
• Countries - mainly developing countries - that only benefit from space science and technology indirectly.
Figure 2.3. Four categories of countries’ space capabilities.
Source: Kasturirangan (2007) It can be seen in Figure 3 that South Africa is classified as a country that is only capable of using space science and technology. South Africa is now working on moving one step up to become a country with the capability of building satellites and other space applications. South Africa has already successfully built two micro-satellites, one of which was launched in 1999 by NASA.

61
SunSat, a 64-kg micro-satellite, was designed and built by staff and students in the department of Electrical and Electronic Engineering at Stellenbosch University. This lead to the establishment of a spin-off company, SunSpace and Information Systems (Pty) Ltd (SunSpace), which manufactures small and medium-satellites, satellite-support equipment, and ground-based applications. SunSpace is the only satellite manufacturing company in South Africa. It has built a second small satellite, SumbandilaSat, which was completed in November 2006. The R26 million SumbandilaSat took two years to build and is owned by DST. The 81 kg satellite has a lifespan of approximately 3 years and was scheduled to be launched off a Russian submarine in June 2007. The launch has been postponed and it is uncertain as to when the satellite will be launched. (See Kruss 2007a and 2007b for a more detailed description of the fledgling micro-satellite industry in South Africa.) Successful launching and operation of satellites is necessary for demonstrating the capability of emerging space nations. In order to make use of satellite technology launchers are required to launch the satellites into outer space. Building and operating launchers is costly and requires government funding (Gibson, 2007). Recently, there has been an increase in international co-operation in the operation of launchers. For reasons related to security and defence, the major space-faring nations built their own launchers, which are now being used by emerging space nations. In addition to SunSpace, 17 other firms are listed on the government space portal as service-providers for the space industry in South Africa (it should be noted that this list is not exhaustive). These firms operate in five areas of space technology: eight firms operate in the satellite, aerospace and electronic engineering and systems sub-sector; four in the satellite applications and ground support sub-sector; seven in the telecommunications and information technology sub-sector; and two in the radar and satellite antennae sub-sector. Some firms operate in more than one sub-sector; for example, SunSpace provides services in the first two sub-sectors. Of the 18 firms operating in the space industry, only one firm specialises in manufacturing satellite systems (SunSpace) and one operates a testing site capable of launching satellites (Denel’s Aerospace Group). Reutech Radar Systems is the only firm (on the list) that specialises in developing digital and radio-frequency antennae and mechanical technologies for telescopes. Reutech designed and manufactured the mechanical control mechanisms for the SALT. The government space portal identifies three groups offering research and consulting services on space and space-related initiatives: The Tertiary Education Network (TENET), the Council for Geoscience (CGS) and the National Disaster Management Centre. Three national research facilities, nine universities and one science council focus on space science research and applications (see ‘Knowledge infrastructure’ section below).

62
Policy Space science and technology were first mentioned as a ‘big science’ commitment, although vaguely, in the National Research and Development Strategy in 2002 (Kruss, 2007). The South African government has now made a definite commitment to the development of space science and technology in South Africa. DST’s 10-year innovation plan for the period 2008 to 2018 (DST 2007: 15) conveys government’s commitment for South Africa to become “an important contributor to global space science and technology”. The three main strategic objectives are: environmental and resource management, safety and security, and innovation and economic growth. In order to achieve these objectives, six focus areas are identified including space sciences, earth observation, communication, navigation, engineering services, and expertise development. It is evident from DST’s ‘grand challenges’ for space (see Figure 4 below) that it places particular emphasis on winning a slice of the global satellite industry, ensuring that South Africa becomes an astronomy hub and uses space technology to address national social needs (DST 2007: 16). Figure 2.4. DST’s ‘grand challenges’ for space science and technology (2008 – 2018)
Source: DST (2007) South Africa is currently in the process of finalising a comprehensive outer space policy. The draft National Space and Technology Strategy is currently under review and will be finalised in 2008. The space policy will be implemented through a national space agency as proposed by the National Space Agency Bill (2007) currently under review. The National Space Agency will address a number of space-related issues including space and space-related research and applications; creating an environment conducive to the commercialisation of space technologies; human capital development; development of necessary infrastructure; regional and international co-operation in space activities; and using space science and technology for meeting socio-economic development needs generally. The National Space Agency will also provide co-ordination of the various stakeholders and space activities (including earth observation, space

63
science, navigation and maritime, telecommunication and broadcasting, launch facility and integration, industrial programmes, and capacity building). DST will be the driver of the National Space Agency. The Department of Trade and Industry (DTI) is responsible for the development and housing of the proposed National Space Policy, and the DST will be responsible for implementing the policy through the proposed National Space Agency (DST 2008). Currently, there are 18 departments playing a role in space science and technology in South Africa with little or no co-ordination between them. The major drivers of the space science and technology agenda are:
• The Department of Science & Technology (DST), which is responsible for space and related applications other than those mentioned above including earth observation, space science and testing laboratories;
• The Department of Trade & Industry (dti), which is the custodian of the Space Affairs Act (1993 as amended in 1996), and is responsible for developing and implementing the National Outer Space Policy and the Industrial Development Framework;
• The Department of Communication (DoC), which is responsible for capacity building, all satellite communications and ICT and postal activities; and
• The Department of Foreign Affairs (DFA). Other departments playing a role in the space sector in South Africa are that of Transport (DoT), Defence (DoD), Education (DoE), Environmental Affairs & Tourism (DEAT), Health (DoH), Land Affairs (DoLA), Minerals & Energy (DoME), Water Affairs & Forestry (DWAF), Agriculture (DoA), Safety & Security (DoS&S), Housing, & Provincial & Local Government (DPLG); and SACSA and Statistics South Africa .
Legislation Currently, the main legislative instrument directly related to space science and technology is the Space Affairs Act (Act 84 of 1993) as amended by the Space Affairs Amendment Act (No. 64 of 6 October 1995). Space activities are regulated by the South African Council for Space Affairs, whose primary functions are monitoring, licensing and registration in terms of the Space Affairs Act (Act 84 of 1993 as amended 1995). The Council is responsible for advising the Minister of DST on all space activities, ensure that all international agreements are met particularly with regard to the peaceful use of outer space, and encourage all involved in the space industry in South Africa to register with the Council in order to co-ordinate industry activities. All proposed launching activities – whether the launch is to take place from South Africa or from another country – and other space activities of entities registered in South Africa have to be licensed with the Council. The conditions of licensing include consideration of safety regulations, national interest and South Africa’s international
64
responsibilities. The Space Affairs Act has been deemed inadequate - by the consortium commissioned to draft a framework for the national space policy - as it does not encompass all critical space and related issues. The National Working Group on Space Science and Technology was established in 2003. The group focuses on the co-ordination and promotion of the study and peaceful use of space to meet national needs. Members of the group include representatives from DST, DTI, DoC and DFA. There are two new Bills directly related to the space sector that were approved towards the end of 2007: The National Space Agency Bill (2007) and The Astronomy Geographic Advantage Bill (2007). The latter proposes a framework for identifying, protecting and preserving areas in South Africa that are optimal for optical and radio astronomy and related activities, that is, Astronomy Advantage Areas. Optimal conditions for astronomy advantage include “high atmospheric transparency, low levels of light pollution, low population density and minimal radio-frequency interference” (Astronomy Geographic Advantage Bill of 2007: chp. 1). The Bill calls for the preservation of any area or part of an area of the Province of the Northern Cape that has been identified as an astronomy advantage area. One of the proposed sites for the Square Kilometer Array (SKA) radio telescope is near Carnarvon in the Northern Cape. Other legislation relevant to space science and technology is the Independent Communications Authority of South Africa Act (Act 13 of 2000) (ICASA) of the DoC, South African Maritime Safety Authority Act (Act 5 of 1998) of the DoT, Aviation Act (Act 74 of 1962 as amended) of the DoT, and the Spatial Data Infrastructure Act (Act 54 of 2003) of the DLA. South Africa has also signed or ratified various international space law agreements or conventions.
International space collaboration
South Africa is an active participant in the international space arena. It is an active participant in the United Nations Committee on the Peaceful Uses of Outer Space (COUPOS) and collaborates with various international partners, such as NASA and ESA. South Africa participates in ESA’s Tiger initiative, which focuses on water-resource management and has been a co-chair of the Group on Earth Observation (GEO) since its inception in 2003. GEO is an international partnership of several countries, including USA and China. South Africa also signed an agreement with Russia to collaborate on specific space initiatives and in the application of space technologies for peaceful purposes. The SKA project is another international initiative in which South Africa plays a leading role together with a team of international researchers from Australia, Holland, UK and USA.
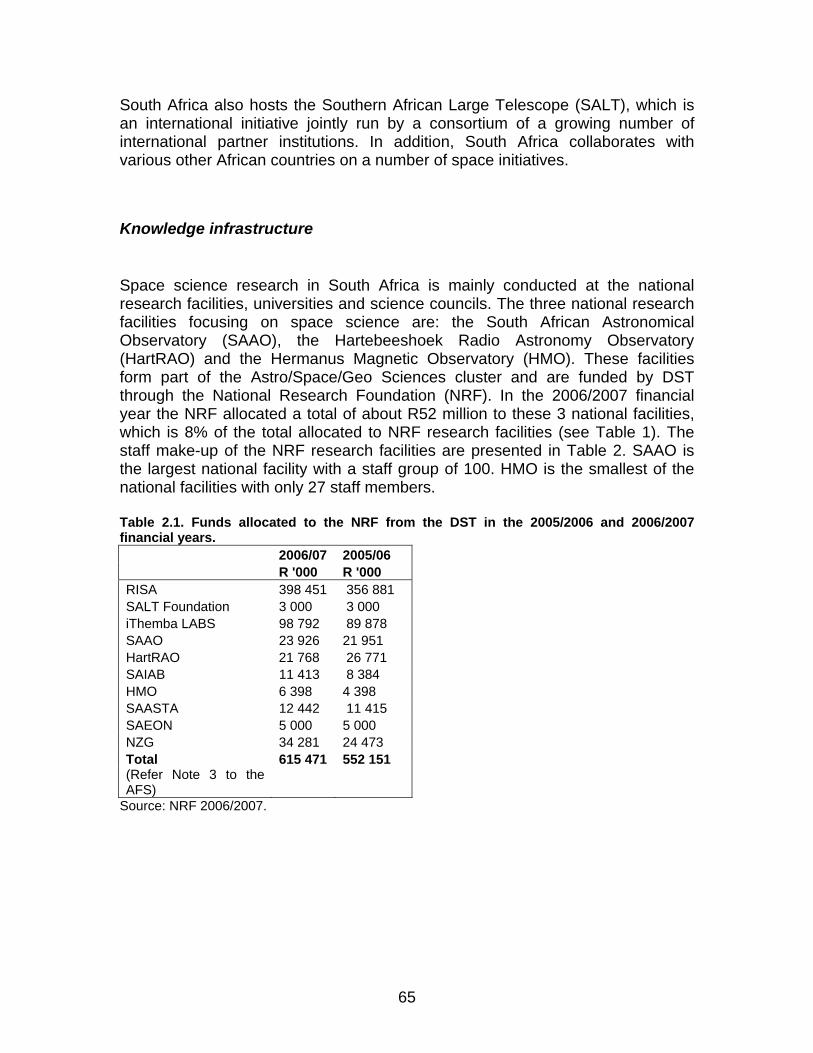
65
South Africa also hosts the Southern African Large Telescope (SALT), which is an international initiative jointly run by a consortium of a growing number of international partner institutions. In addition, South Africa collaborates with various other African countries on a number of space initiatives.
Knowledge infrastructure
Space science research in South Africa is mainly conducted at the national research facilities, universities and science councils. The three national research facilities focusing on space science are: the South African Astronomical Observatory (SAAO), the Hartebeeshoek Radio Astronomy Observatory (HartRAO) and the Hermanus Magnetic Observatory (HMO). These facilities form part of the Astro/Space/Geo Sciences cluster and are funded by DST through the National Research Foundation (NRF). In the 2006/2007 financial year the NRF allocated a total of about R52 million to these 3 national facilities, which is 8% of the total allocated to NRF research facilities (see Table 1). The staff make-up of the NRF research facilities are presented in Table 2. SAAO is the largest national facility with a staff group of 100. HMO is the smallest of the national facilities with only 27 staff members. Table 2.1. Funds allocated to the NRF from the DST in the 2005/2006 and 2006/2007 financial years. 2006/07 2005/06 R '000 R '000 RISA 398 451 356 881 SALT Foundation 3 000 3 000 iThemba LABS 98 792 89 878 SAAO 23 926 21 951 HartRAO 21 768 26 771 SAIAB 11 413 8 384 HMO 6 398 4 398 SAASTA 12 442 11 415 SAEON 5 000 5 000 NZG 34 281 24 473 Total 615 471 552 151 (Refer Note 3 to the AFS)
Source: NRF 2006/2007.

66
Table 2.2. Proportion of researchers to the total staff at NRF entities for the 2004/2005 and 2005/2006 financial years.
Source: NRF 2005/2006. The main functions of the national facilities are (NRF 2006):
• Knowledge generation and the utilisation of research results. • To provide academics, astronomers and students with access to
astronomy infrastructure. • Human resource development. • The national astronomy facilities also carry out public awareness
campaigns and youth programmes, particularly focusing on youth from disadvantaged communities, in developing interest in science and technology in the public arena. For example, SAAO arranges initiatives, such as space camps, to develop interest in science and space science among school learners. The learners also get hands-on experience of operating an observatory. More than 9 500 learners participated in SAAO’s learner-focused activities in 2004 and 2005. The observatories also run tours for the public.
The South African Astronomical Observatory (SAAO): SAAO, which was established in 1972, is the national facility for optical and infrared astronomy in South Africa (www.saao.ac.za). Its headquarters are located on the site of the old Royal Observatory in Observatory, Cape Town. The national library for astronomy and SAAO’s computer facilities are also located at its Cape Town office. Its major observing facilities are located at Sutherland in the Northern Cape. SAAO is the host institution of SALT. SAAO conducts research in the field of optical/infrared astronomy. SAAO offers post-graduate scholarships for study in South Africa and at its international partner institutions. Staff members teach courses and supervise student projects including master’s and PhD theses. SAAO also participates in exchange programmes for students in South Africa and abroad. For example, Rutgers University Graduate School of Education (GSE) (USA) links up with SALT on their annual tour of South Africa. This

67
provides the opportunity for the staff and learners at schools in Sutherland and Fraserburg, and the teachers of the Rutgers University GSE to interact and share knowledge, experiences and educational resources. The Hartebeeshoek Radio Astronomy Observatory (HartRAO): HartRAO is the only major radio astronomy observatory in Africa and is one of the five permanent space geodesy stations worldwide. The radio observatory was built in 1961 by NASA, which used the facility to track satellites. HartRAO is situated near Krugersdorp. HartRAO focuses on research into the radio waves emitted by celestial objects in the Milky Way Galaxy and other galaxies, and space geodesy. HartRAO forms part of an array of telescopes positioned in different parts of the world called ‘super’ telescopes. These ‘super’ telescopes use a technique called Very Long Baseline Interferometry (VLBI) that allows the telescopes to observe details finer than other optical telescopes (www.nrf.ac.za). Space geodesy includes the study of continental drift on earth in order to assess the impact of global warming. Space geodesy is not part of astronomy. HartRAO plays an important role in space geodesy because of its location. HartRAO forms part of the SKA bid committee, and is responsible for constructing the first prototype telescope for the meerKAT demonstrator model. HartRAO functions as a training facility for radio astronomers. The Hermanus Magnetic Observatory (HMO): HMO was established in 1932 and was originally located in Cape Town. The International Commission for the Polar Year requested Professor A. Ogg of the University of Cape Town to establish the observatory in Cape Town. A magnetic observatory in this part of the world is important as simultaneous observations at different places on the surface of the Earth is necessary for understanding the global nature of the Earth’s magnetic field (www.hmo.ac.za). The observatory was moved to Hermanus in the Western Cape in 1941, as the new electric railway system had an adverse effect on the magnetic field observations. HMO (as well as HartRAO) is an active participant in INTERMAGNET, the international network of magnetic observatories, which focuses on research on the Earth’s magnetic field (www.hmo.ac.za). HMO became part of CSIR in 1969 and thus began to commercialise its activities when CSIR became commercially oriented. In 2001 the HMO was transferred to the NRF and had to change its orientation to focus more on conducting research and training in order to meet the NRF requirements for national facilities. HMO still offers services to clients on a commercial basis. It provides clients with controlled magnetic field and sensor-related services, and contract-based research and development services (such as wavelength analysis). HMO also aims to expand its expertise into South Africa’s satellite programme by collaborating with Stellenbosch University and the Institute for Satellite and Software Applications (ISSA). It already has a contract with CSIR’s Satellite Application Centre (SAC).
68
HMO plays an important role in the bid for the SKA. It is the only ground facility south of the equator in Africa that can determine the total electron content (TEC) of the ionosphere, which is a requirement of sites for the SKA as TEC interferes with the recording and observation of radio signals. The NRF, in its 2004 5-year review of the national facilities, made a recommendation for the HMO to develop its human capacity in preparation for the SKA. Other space science and technology facilities are the Council for Scientific and Industrial Research (CSIR) Satellite Applications Centre, Institute for Satellite and Software Applications (ISSA), and the Overberg Test Range (OTB). CSIR has been in existence since 1960 and boasts 47 years of experience in telemetry, tracking and command services. Its ground station is situated in Hartebeeshoek. CSIR plays a significant role in research, earth observation and capacity building for space technology, and collaborates with various international institutions such as NASA. The Institute for Satellite and Software Applications (ISSA) is an initiative of the Department of Communications and is situated at the Houwteq satellite applications centre in Grabouw. The main purpose of the ISSA is capacity building for South Africa’s Information, Communications and Technology (ICT) sector. The ICT sector plays a significant role in the operation of large astronomy facilities like SALT, meerKAT and SKA. These facilities require infrastructure and support for signal transportation and the processing of data. ISSA was used to test South Africa’s Sumbandilasat and will also serve as a data centre for images that would be sent by the satellite. ISSA will provide data and imagery obtained from the satellite to the South African Earth Observation Network (SAEON) (www.issa.org.za/satellite.html). The Overberg Test Range (OTB) was built as a launch facility by the previous government. OTB serves as a flight testing facility for the South African Air force and various international clients; and as a telemetry, tracking and command ground station. OTB is also used by the ISSA as a data reception station. South Africa is also a partner in the High Energy Stereoscopic System (HESS) through Potchefstroom University. HESS is an international initiative located in Namibia. It consists of an array of four telescopes detecting gamma rays from the universe. It is likely that more telescopes will be added to the array at a later stage. Some of the outrigger antennae for the proposed South African SKA will be located in Namibia.
Southern African Large Telescope (SALT) The Southern African Large Telescope (SALT) is the largest single optical-infrared telescope in the southern hemisphere. SALT is a 10m-class telescope
69
located near Sutherland in the Northern Cape. SALT was inaugurated on 10th of November 2005 and released its first research results on the 11th of August 2006. Prior to the SALT, the largest optical telescope in Africa was the 1.9 m telescope located at SAAO’s observing facilities in Sutherland, which was becoming obsolete in the era of the 8-10m telescope technology (Buckley 2007). SALT is owned and used by a consortium of international partners including:
o South Africa: SAAO (host institution), National Research Foundation o Poland: Nicolaus Copernicus Astronomical Center o Hobby-Eberly Telescope Board (partners in the USA and Germany) o USA: Rutgers University, University of Wisconsin, Carnegie Mellon
University, University of North Carolina, Dartmouth College, American Museum of Natural History
o Germany: Georg-August-Universität Göttingen o New Zealand: University of Canterbury (founding institution) o Consortium of UK Universities and Institutions o India: Inter-University Centre for Astronomy and Astrophysics
The American Museum of Natural History (AMNH) of New York and the Inter-University Centre for Astronomy and Astrophysics (IUCAA) of Pune, India, are the two new SALT partners that joined the SALT consortium in 2007. They contribute funds, knowledge and skills in exchange for access to observing time on SALT. Members of the SALT consortium provide funding, and certain SALT instruments are developed by the international partners. South Africa only contributed about 34% of the funding to build SALT but about 60% of the contracts and tenders, and many of the high-tech aspects of SALT were awarded to South African industry. The SALT construction team included astronomers, software and mechanical engineers, software mirror and optical specialists, software developers, electronic engineers and technicians, and technical draftspersons. SALT is hosted by the SAAO, which is administered by DST through the NRF. Thus SAAO operates SALT on behalf of the SALT partners. The design of the SALT was modeled on that of the Hobby-Eberly Telescope (HET) at the McDonald Observatory in Texas, USA, which began operations in 1999. Modeling SALT on the HET allowed the SALT engineers to cut costs in developing the design, keep within the budget of $20 million and complete construction of the SALT in the record time of 5 years, which is seldom possible for ‘big science’ projects. Construction costs were thus less than that of a conventional large telescope. SALT is however an improvement in the design of the HET as the designers had the advantage of taking into consideration the faults in the design of the HET and technological developments subsequent to the HET. SALT is 13m in length and has a 11m x 10m array of 91 hexagonal mirrors. The telescope weighs 82 tonnes and its light collecting area spreads across 77.6 square meters.

70
SALT has a better optical design (a particular advantage is the use of a spherical aberration corrector) than the HET, which enables it to provide images over a larger field with a better image quality. It has a field view of 8 arcmin (i.e. about a quarter of the size of the Moon) and a resolution of 0.25 – 0.5 arcsec (i.e. the size of a R2 coin viewed at a distance of 10 km). SALT also has a larger light collecting area and an improved UV performance covering wavelengths between 320 and 420 nm. It has a tilted Arecibo design. The Arecibo radio telescope was the first telescope to track “objects by moving the prime focus payload rather than the primary mirror” (Buckley 2007: slide 10). The telescope collects light emitted from celestial objects and focuses it on the focal plane. It is also able to relay light from a number of celestial objects (10-20) in a field to the fibre-fed instruments in the instrument room in the basement of the telescope via its optical fibres. The tracker tracks the movement of the objects and is able to track images for up to 2.5 hours. The telescope can also be moved between objects in under five minutes. Some of the astronomy questions to be tackled by SALT are:
o What was the universe like when the first stars and galaxies were forming?
o What kind of worlds orbit other suns? o How are the stars in nearby galaxies different from those in the solar
neighbourhood? o What can these stars tells us about the scale and age of the universe? o How do quasars and gamma rays outshine trillions of stars like the sun?
SALT is expected to have a lifetime of more than 30 years. It is a ground-based telescope but operates more like a space-based telescope in that observation requests and the conveying of requested data is done via the internet. SALT partners thus do not have to travel to SALT in order to obtain the data they need. Astronomers from the partner organisations register with SALT via the internet and submit proposals for data. Users are required to specify the target(s) to be observed, the instrument(s) to be employed and the observation period. If the proposal is feasible the observations will be carried out and the data will be made available to the user via a secure web page. Large datasets are copied to DVD and sent by post. Registered SALT users are also able to check the status of their proposals and track information. The SALT is now operational and has experienced some technical problems that are being solved by SAAO in collaboration with the international partners. The major challenges reported are attracting and retaining suitable staff to work in the remote area, operating the high-technology facility on a tight budget, developing new instruments in order to keep SALT up-to-date, and developing SALT’s local user community within South African and Africa.
71
SALT is a technology that provides South Africa with the opportunity to remain internationally competitive. The SALT initiative plays an important role in strengthening South Africa’s bid to host SKA as it demonstrates the country’s ability in hosting ‘big science’ astronomy initiatives. The SKA is however a much larger project than the SALT project.
The Square Kilometer Array (SKA) The Square Kilometer Array (SKA) is one of a number of new generation mega-science astronomy facilities being planned for completion between 2010 and 2030. Some of the other facilities are (Gaensler & Lazio 2006):
o The Atacama Large Millimeter Array (ALMA), a single telescope with an array of 80 antennas. The ALMA is planned by an international consortium of Europe, Japan and North America. ALMA will be hosted by Chile (www.alma.nrao.edu/info/).
o The James Webb Space Telescope (JWST), a large infrared telescope that will be the successor to the Hubble Space Telescope. It is a joint project of ESA, NASA and the Canadian Space Agency (www.jwst.nasa.gov/index.html).
o The Large Synoptic Survey Telescope (LSST), a wide-field telescope capable of (repeatedly) taking digital images of the entire sky. Unlike many other mega-science projects, LSST is a Public-Private partnership (www.lsst.org/lsst_home.shtml).
o The Gamma Ray Large Area Space Telescope (GLAST), a gamma-ray facility. The space telescope is a NASA initiative. NASA has partnered with the U.S government and institutions in France, Germany, Italy, Japan and Sweden (www.nasa.gov/mission_pages/GLAST/main/index.html).
o The Laser Interferometer Space Antenna (LISA), a gravitational-wave facility. LISA is sponsored by ESA and NASA (http://lisa.nasa.gov/WHATIS/intro.html).
The proposed SKA will be the world’s largest radio telescope. It will constitute 3000 to 4500 dish-shaped antennae spread across a collecting area of about 1 million square meters (i.e. about 150 football fields) and a frequency band of 500MHz to 3GHz. Each dish will be 10-15m wide and 15-20m high. SKA will be 50-100 times more sensitive than existing radio telescopes. The large collecting area and sensitivity of the SKA will enable the telescope to detect signals emitted from celestial objects, including the faint signals from hydrogen gas emitted at a time when the Universe was in the first 1% of its life (www.astro.uwa.edu.au/ska/the_square_kilometre_array). These signals or radio waves will be collected by the dish-shaped antennae, which feed the radiation into a radio receiver. The receiver amplifies and digitises the radio signals, which are then sent to a computer. The computer processes the information. Astronomers then code the numbers, usually by assigning specific colours to the

72
numbers, and these colours are combined to form a picture of the information collected by the telescope. Radio signals will reach the earth at a frequency that is in the same radio band “saturated with man-made signals” (www.astro.uwa.edu.au/ska/the_square_kilometre_array). In order to escape the interference of man-made radio signals, the SKA will have to be located in a part of the world that is remote yet accessible to astronomers and engineers and is large enough to position the array (www.astro.uwa.edu.au/ska/the_square_kilometre_array). The array of thousands of antennae making up the telescope is likely to be positioned at different locations considering the large area that it will cover. About 50% of the collecting area, that is, the core array or central station, will be located in a host country. The data collected by the various stations will be sent to the central station and will be combined with the data collected at the central station. This design is called interferometry. SKA is an international endeavour that will be operated by a consortium of 18 countries. The project is co-ordinated by the International SKA Steering Committee. In 2004 the various countries in the consortium – including Australia, Canada, China, Europe, India, South Africa and the USA - signed an agreement to collaborate in efforts to advance the development of the SKA as an international endeavour. The agreement serves to develop a framework for collaboration in carrying out the specifications of the International SKA Steering Committee, in selecting a suitable site for the SKA and in the technical review of the design. The proposed budget for the SKA is about €1 billion. Initially, four countries bid to host the SKA: China, Argentina, Australia and South Africa. South Africa and Australia were short-listed in September 2006 and are now competing to host the large telescope. South Africa has proposed the Northern Cape as the ideal site for the core array. Other proposed stations for the South African SKA are various sites throughout South Africa and other countries in the region including Mozambique, Namibia, Botswana, Kenya, Ghana, Madagascar and Mauritius (see Figure 5 below).

73
Figure 2.5. Proposed stations for the South African SKA.
Source: Cloete (2007) The site for the SKA will be chosen in 2008 or 2009 (see Figure 6 for the timeline for the SKA). Construction of the SKA is scheduled to begin in 2010 and the project is scheduled to be completed in 2020. It is expected that the first observations will be made in 2015. Hall (2004) emphasises that with a nominal SKA construction period of three years, the project demands the completion and commissioning of a 100 m (equivalent) telescope every 3-4 days. In order to construct the SKA within in the proposed budget and time-frame, the SKA will be constructed in stages (Hall & Kahn 2006):
o Development phase (2000-2009) - construction and evaluation of SKA prototypes and pathfinder instruments developed by SKA partners but funded outside of the project.
o Phase 1 (2010-2013) - construction of a radio telescope that is about 10 % of the SKA’s sensitivity using the final SKA design on the selected SKA site.
o Phase 2 (2014-2020) - construction of the SKA. o Phase 3 (post-2020) – completion of the SKA and progressive upgrades.

74
Figure 2.6 Timeline for the SKA initiative.
Source: Cloete (2007) As indicated by the SKA timeline (Figure 6), the SKA project is now in the developmental phase. South Africa is in the process of developing its SKA demonstrator, the Karoo Array Telescope (meerKAT). The South African government has committed R 860 million for South African SKA initiatives, which includes the meerKAT initiative. The meerKAT design will be 1% of the technology of the proposed SKA design. meerKAT will constitute an array of 50-80 12m dish-shaped antennae with wide-band feeds with a frequency range of 500 MHz to 2.5 GHz. Figure 2.7. Timeline for the meerKAT initiative.
Source: Cloete (2007)

75
As illustrated in Figures 7 and 8, like the SKA, meerKAT will be constructed in stages; and is planned to be in full operation by 2013. Figure 2.8. The proposed prototyping phases for the MeerKAT initiative.
Source: Cloete (2007) The PED is a demonstration interferometric telescope that will be constructed by SAAO. The PED will be used to test operational and scientific software, and as a learning tool. The first (one-dish) prototype (XDM) has been constructed by the HartRAO. XDM was completed over a period of 13 months and the components were constructed by two firms in South Africa, MMS and IST Dynamics, and the meerKAT team (Campbell 2007). KAT-7 is an important part of the construction of MeerKAT as it will constitute the first 7 antennae of the MeerKAT and will serve as an engineering test-bed for MeerKAT. KAT-7 will also be used for scientific research. meerKAT will be constructed on the site proposed for the core array of the South African SKA, Carnarvon in the Northern Cape, and will form part of the SKA if South Africa wins the bid to host the SKA. meerKAT will be a world-class radio astronomy facility and it is hoped that the initiative will strengthen South Africa’s bid to host the SKA. The facility will be used to train scientists and engineers, and thus build human capital to prepare South Africa for the (possibility of) SKA. The meerKAT initiative will also provide the opportunity for industry in South Africa to develop and demonstrate their capability to contribute to the construction of large astronomy facilities, in this way strengthening their position in the competition for contracts and tenders for the construction of the SKA and its high-technology components. A large proportion (40% - 70%) of the funds

76
spent on constructing and operating large international facilities are usually spent in the host country (Hall & Kahn 2006 citing US OTA 1995). The SKA steering committee has indicated that a working network of industry, universities, astronomy facilities and government is necessary in order for a mega-science project like SKA to be completed within the required time-frame and budget. Other than the international astronomy community (i.e. astronomers and astro-engineers), significant stakeholders of the SKA are (Hall & Kahn 2006: 6): • Governments, which stand to benefit financially and with regard to human capital development and knowledge production in priority sectors; • Industry, which stands to benefit from medium and long-term financial returns, and the opportunity to develop technical skills. Industry may also gain in terms of the development of intellectual property and licensing agreements. • Academic research institutions, which stand to benefit financially and from training opportunities and opportunities to develop their intellectual property. The SKA technology will require various high-technology components to be designed and manufactured. The development of the SKA design requires expertise into the science requirements for the key astrophysical observations planned for the telescope and the development of new specialised technologies or instruments required to build a telescope capable of carrying out those key observations. Thus construction of the SKA requires expertise outside of the field of astronomy. Paterson, Kruss and Wildschut (2005) – in their report on astronomy in South Africa and the availability of human capital relevant for the SKA commissioned by the South African SKA Bid Committee – indicate that the SKA would require a broad range of high-level S&T skills including that for the development, installation, operation and maintenance of the physical infrastructure, technological components, and software systems. Thus construction will have to move beyond the astronomy community to include industry. The SKA Project’s Industrial Liaison Task Force (ILTF) is responsible for assessing and managing the role of industry in the SKA project. Traditionally, large radio telescopes have employed the expertise of specialists in astronomy technology design, and have employed civil and infrastructure engineers and technicians during the construction phase only (Hall 2004). In the case of the SKA it is imperative that industry be involved at all stages of the project considering the scale and complexity of the technology, and in order to keep within the budget and proposed time-frame (Hall 2004) (see Table 5 below). Collaboration with industry will be particularly important for the development of the antennae, and for meeting the signal transfer and processing requirements (Hall & Kahn 2006).
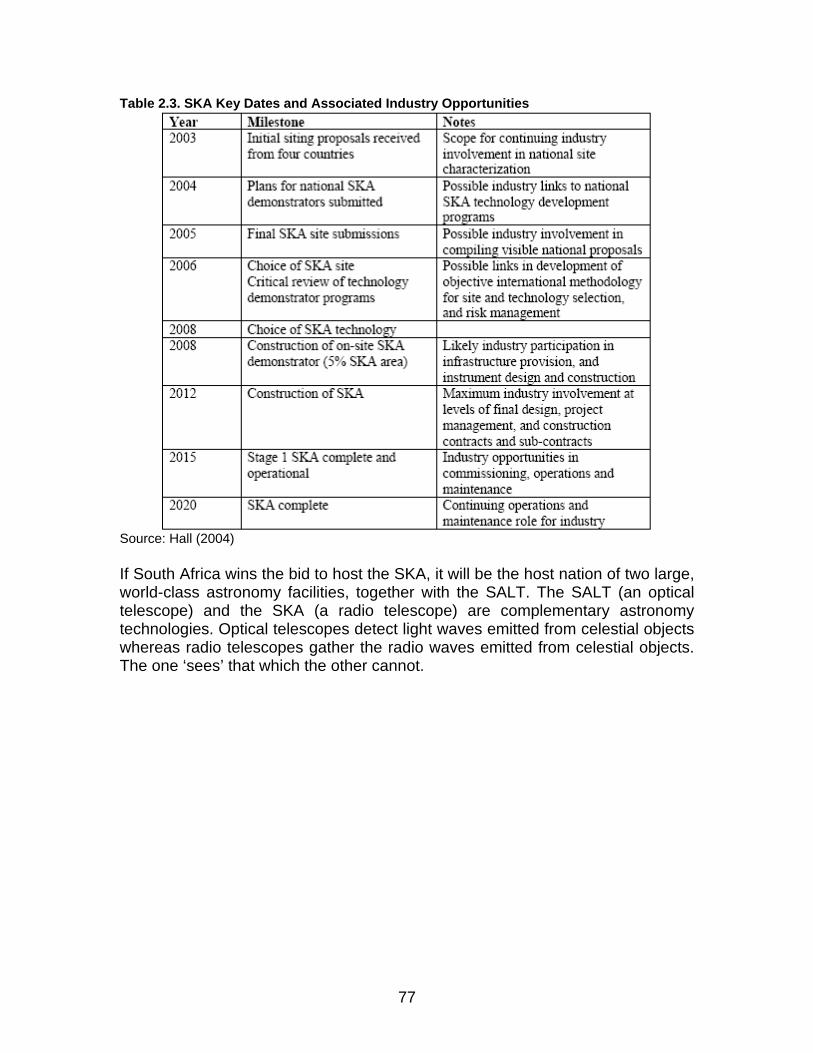
77
Table 2.3. SKA Key Dates and Associated Industry Opportunities
Source: Hall (2004) If South Africa wins the bid to host the SKA, it will be the host nation of two large, world-class astronomy facilities, together with the SALT. The SALT (an optical telescope) and the SKA (a radio telescope) are complementary astronomy technologies. Optical telescopes detect light waves emitted from celestial objects whereas radio telescopes gather the radio waves emitted from celestial objects. The one ‘sees’ that which the other cannot.
78
2 SKILLS: DEMAND AND SUPPLY
Introduction Space technologies are fundamentally based on competences in mathematics, physics and astronomy. But in addition they require many of the same skill sets used in other areas of the economy, such as in engineering and related generic, multi-use disciplines. It is not possible to isolate the precise demand for and supply of space-related skills and distinguish it from all other possible fields of occupations. Hence the data supplied in this section represents an upper boundary, effectively exaggerating skill demand and supply in this area.
The nature and magnitude of the demand for skills Between April 2004 and March 2007 the Sunday Times carried some 9,000 vacancy announcements that were potentially relevant to the space sector. However, the core demand for astronomers and physicists amounted to fewer than 50 people while the demand for engineers and technicians – who would likely be requested by other sectors as well – numbered in the thousands. Year on year demand grew by 86 and 42 per cent, respectively.
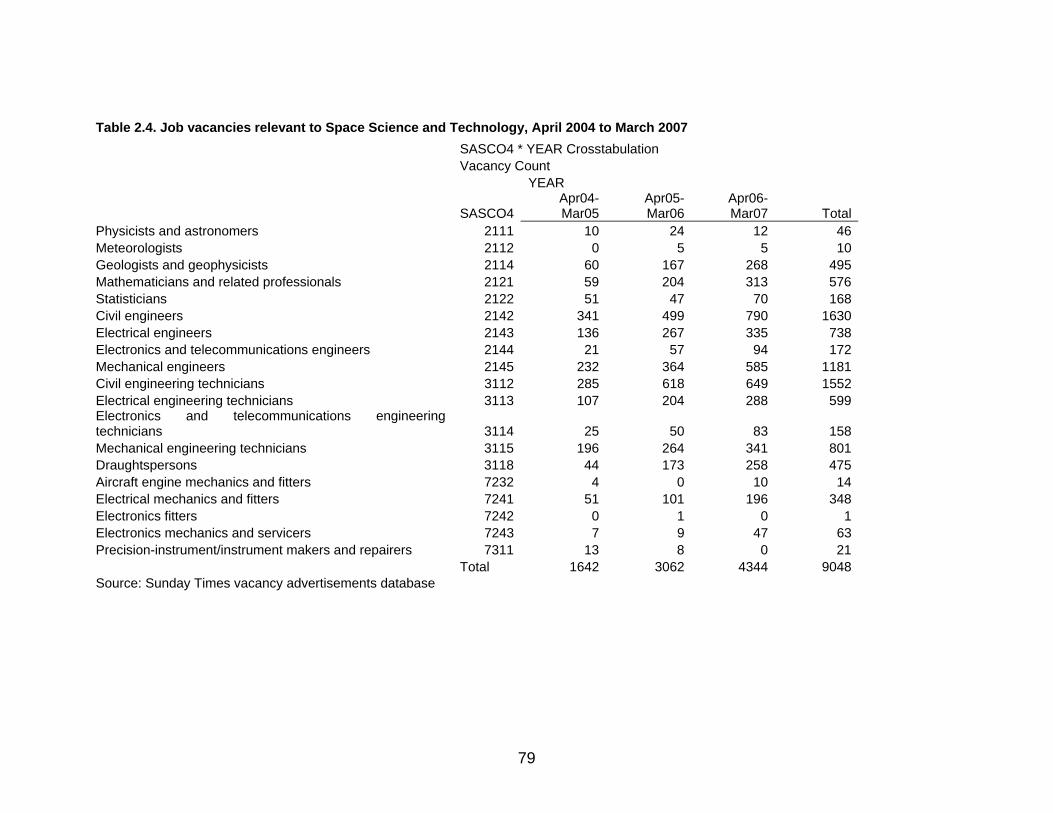
79
Table 2.4. Job vacancies relevant to Space Science and Technology, April 2004 to March 2007
Source: Sunday Times vacancy advertisements database
SASCO4 * YEAR Crosstabulation Vacancy Count YEAR
SASCO4Apr04-Mar05
Apr05-Mar06
Apr06-Mar07 Total
Physicists and astronomers 2111 10 24 12 46Meteorologists 2112 0 5 5 10Geologists and geophysicists 2114 60 167 268 495Mathematicians and related professionals 2121 59 204 313 576Statisticians 2122 51 47 70 168Civil engineers 2142 341 499 790 1630Electrical engineers 2143 136 267 335 738Electronics and telecommunications engineers 2144 21 57 94 172Mechanical engineers 2145 232 364 585 1181Civil engineering technicians 3112 285 618 649 1552Electrical engineering technicians 3113 107 204 288 599Electronics and telecommunications engineering technicians 3114 25 50 83 158Mechanical engineering technicians 3115 196 264 341 801Draughtspersons 3118 44 173 258 475Aircraft engine mechanics and fitters 7232 4 0 10 14Electrical mechanics and fitters 7241 51 101 196 348Electronics fitters 7242 0 1 0 1Electronics mechanics and servicers 7243 7 9 47 63Precision-instrument/instrument makers and repairers 7311 13 8 0 21 Total 1642 3062 4344 9048
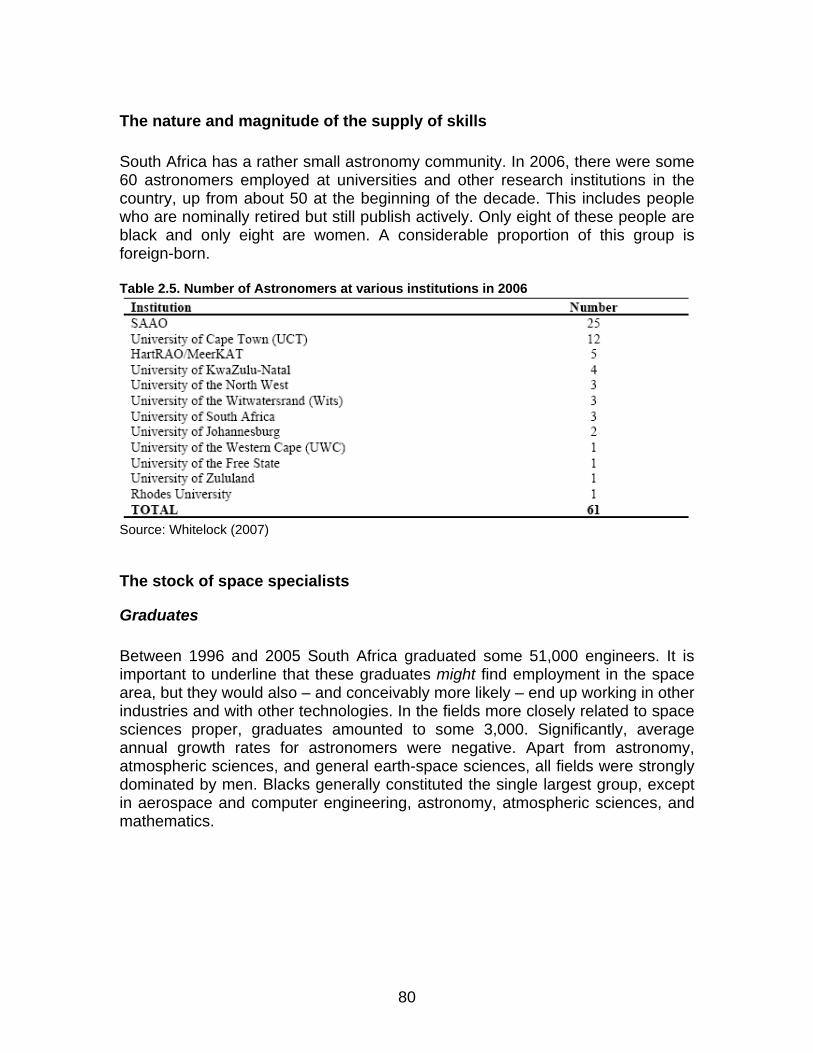
80
The nature and magnitude of the supply of skills South Africa has a rather small astronomy community. In 2006, there were some 60 astronomers employed at universities and other research institutions in the country, up from about 50 at the beginning of the decade. This includes people who are nominally retired but still publish actively. Only eight of these people are black and only eight are women. A considerable proportion of this group is foreign-born. Table 2.5. Number of Astronomers at various institutions in 2006
Source: Whitelock (2007)
The stock of space specialists
Graduates Between 1996 and 2005 South Africa graduated some 51,000 engineers. It is important to underline that these graduates might find employment in the space area, but they would also – and conceivably more likely – end up working in other industries and with other technologies. In the fields more closely related to space sciences proper, graduates amounted to some 3,000. Significantly, average annual growth rates for astronomers were negative. Apart from astronomy, atmospheric sciences, and general earth-space sciences, all fields were strongly dominated by men. Blacks generally constituted the single largest group, except in aerospace and computer engineering, astronomy, atmospheric sciences, and mathematics.

81
Table 2.6. Number of graduates and % average annual growth in selected Engineering sub-categories, 1996 - 2005
Engineering and Engineering Tech.
All Aerospace & Aeronautical Civil Computer Electrical
Engineering Science Instrumentation Mechanical
1996 - 2005
% Av. Annual Growth
1996 - 2005
% Av. Annual Growth
1996 - 2005
% Av. Annual Growth
1996 - 2005
% Av. Annual Growth
1996 - 2005
% Av. Annual Growth
1996 - 2005
% Av. Annual Growth
1996 - 2005
% Av. Annual Growth
1996 - 2005
% Av. Annual Growth
Intermediate Skill Level¹ 21 699 2.42 126 -21.65 4 117 4.61 158 -11.11 7 952 5.05 16 nd3 6 nd3 2 874 1.06
High Skill Level² 29 181 3.35 86 3.25 4 404 0.58 577 19.34 8 070 2.21 56 22.22 6 nd3 4 564 -1.19
Of which - Masters 4 298 6.28 1 nd3 551 1.75 56 13.76 1 251 8.69 35 22.22 5 nd3 594 4.69
- PhD 686 4.38 0 nd3 94 -1.31 0 nd3 171 2.78 0 nd3 0 nd3 158 11.56
Other 156 nd3 0 nd3 1 nd3 0 nd3 141 nd3 0 nd3 0 nd3 1 nd3
Total 51 036 2.93 212 -17.48 8 522 2.62 735 11.97 16 164 3.68 72 22.22 12 nd3 7 439 -0.20
¹ Post-school, pre-degree qualifications including college and technikon national certificates and diplomas. ² Higher education degree qualifications and post-graduate courses including BTech, Honours, Masters and PhD qualifications, and post-graduate diplomas. 3Data unavailable.
Source: HEMIS database
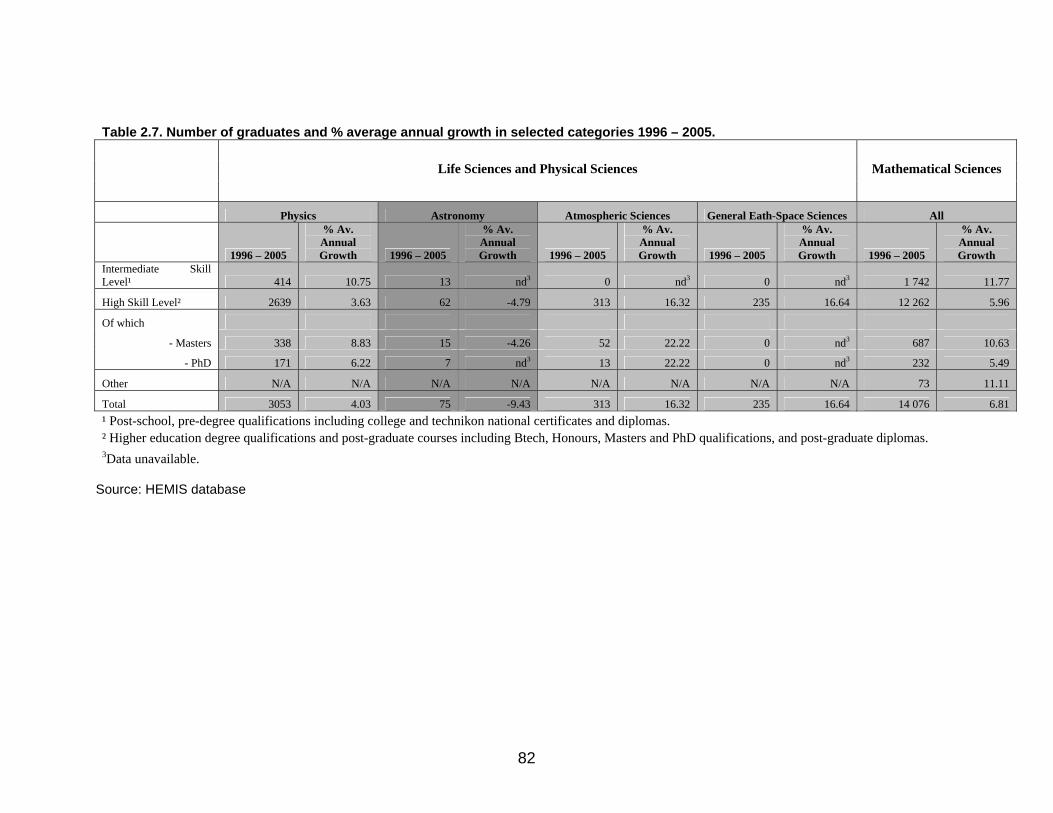
82
Table 2.7. Number of graduates and % average annual growth in selected categories 1996 – 2005.
Life Sciences and Physical Sciences Mathematical Sciences
Physics Astronomy Atmospheric Sciences General Eath-Space Sciences All
1996 – 2005
% Av. Annual Growth 1996 – 2005
% Av. Annual Growth 1996 – 2005
% Av. Annual Growth 1996 – 2005
% Av. Annual Growth 1996 – 2005
% Av. Annual Growth
Intermediate Skill Level¹ 414 10.75 13 nd3 0 nd3 0 nd3 1 742 11.77
High Skill Level² 2639 3.63 62 -4.79 313 16.32 235 16.64 12 262 5.96
Of which - Masters 338 8.83 15 -4.26 52 22.22 0 nd3 687 10.63
- PhD 171 6.22 7 nd3 13 22.22 0 nd3 232 5.49
Other N/A N/A N/A N/A N/A N/A N/A N/A 73 11.11
Total 3053 4.03 75 -9.43 313 16.32 235 16.64 14 076 6.81 ¹ Post-school, pre-degree qualifications including college and technikon national certificates and diplomas. ² Higher education degree qualifications and post-graduate courses including Btech, Honours, Masters and PhD qualifications, and post-graduate diplomas. 3Data unavailable.
Source: HEMIS database
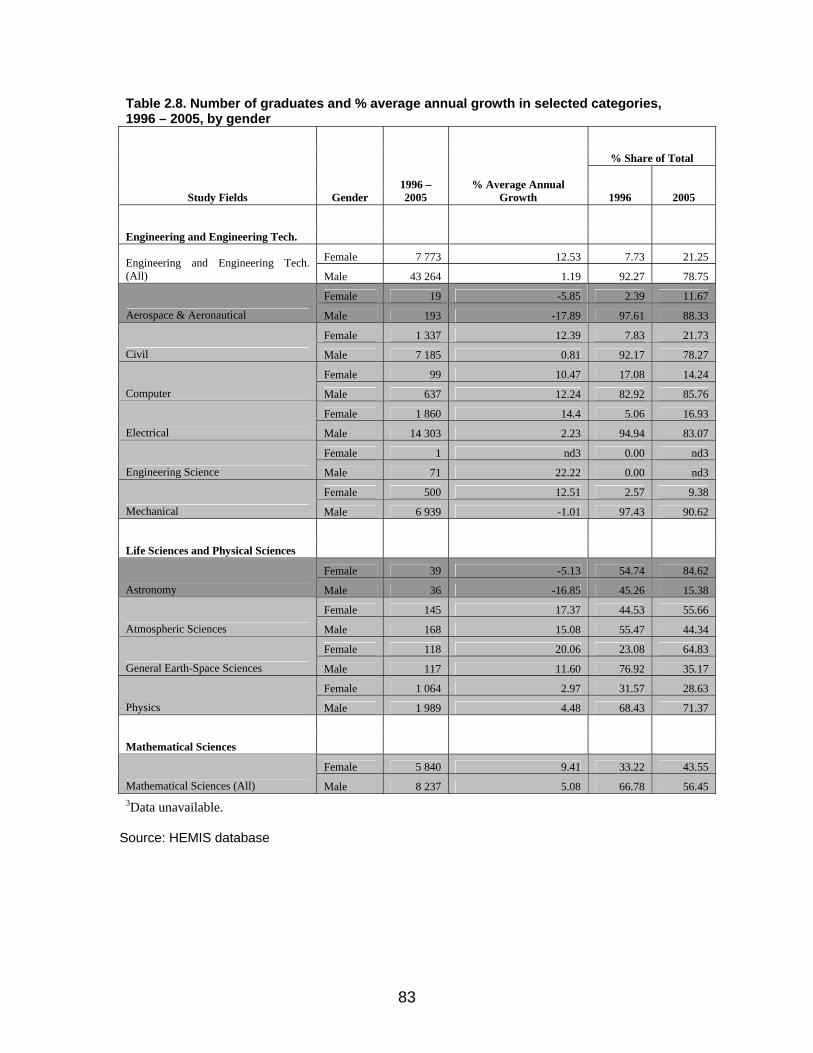
83
Table 2.8. Number of graduates and % average annual growth in selected categories, 1996 – 2005, by gender
% Share of Total
Study Fields Gender 1996 – 2005
% Average Annual Growth 1996 2005
Engineering and Engineering Tech.
Female 7 773 12.53 7.73 21.25 Engineering and Engineering Tech. (All) Male 43 264 1.19 92.27 78.75
Female 19 -5.85 2.39 11.67
Aerospace & Aeronautical Male 193 -17.89 97.61 88.33
Female 1 337 12.39 7.83 21.73
Civil Male 7 185 0.81 92.17 78.27
Female 99 10.47 17.08 14.24
Computer Male 637 12.24 82.92 85.76
Female 1 860 14.4 5.06 16.93
Electrical Male 14 303 2.23 94.94 83.07
Female 1 nd3 0.00 nd3
Engineering Science Male 71 22.22 0.00 nd3
Female 500 12.51 2.57 9.38
Mechanical Male 6 939 -1.01 97.43 90.62
Life Sciences and Physical Sciences
Female 39 -5.13 54.74 84.62
Astronomy Male 36 -16.85 45.26 15.38
Female 145 17.37 44.53 55.66
Atmospheric Sciences Male 168 15.08 55.47 44.34
Female 118 20.06 23.08 64.83
General Earth-Space Sciences Male 117 11.60 76.92 35.17
Female 1 064 2.97 31.57 28.63
Physics Male 1 989 4.48 68.43 71.37
Mathematical Sciences
Female 5 840 9.41 33.22 43.55
Mathematical Sciences (All) Male 8 237 5.08 66.78 56.45 3Data unavailable.
Source: HEMIS database

84
Table 2.9. Number of graduates and % average annual growth in selected categories, 1996-2005, by ‘race’
% Share of Total
Study Fields ‘Race’ 1996 – 2005
% Average Annual Growth 1996 2005
Engineering and Engineering Tech.
African 18 671 12.06 19.5 50.46
Coloured 2 822 -0.48 6.55 4.81
Asian 3 897 4.3 6.67 7.57
White 25 579 -3.62 67.28 37.14 Engineering and Engineering Tech. (All) Other 67 22.22 0.00 0.02
African 19 -14.81 5.97 10.00
Coloured 6 nd3 2.39 nd3
Asian 30 nd3 5.97 nd3
White 157 -17.27 85.66 90.00
Aerospace & Aeronautical Other 0 nd3 0.00 nd3
African 3 188 15.18 14.09 59.06
Coloured 544 10.34 2.68 5.8
Asian 556 10.85 2.61 5.99
White 4 229 -8.26 80.62 29.15
Civil Other 5 nd3 0 nd3
African 161 -4.22 61.91 12.64
Coloured 39 -15.87 32.02 1.6
Asian 73 22.22 0 14.72
White 463 21.11 6.06 71.04
Computer Other N/A N/A N/A N/A
African 6 166 11.83 21.59 50.66
Coloured 961 2.29 6.77 5.96
Asian 1 234 4.99 6.8 7.68
White 7 792 -2.89 64.83 35.7
Electrical Other 11 nd3 0 nd3
African 13 22.22 0 nd3
Coloured 0 nd3 0 nd3
Asian 2 nd3 0 nd3
White 56 22.22 0 nd3
Engineering Science Other 1 nd3 0 nd3
African 2 067 13.82 10.77 47.08
Coloured 304 -2.8 4.16 3.29
Asian 465 0.73 5.53 6.01
White 4 590 -6.67 79.53 43.62
Mechanical Other 13 nd3 0 nd3 3Data unavailable.
Source: HEMIS databse

85
Table 2.10. Number of graduates and % average annual growth in selected categories, 1996 – 2005, by ‘race’
% Share of Total
Study Fields ‘Race’ 1996 – 2005
% Average Annual Growth 1996 2005
Life Sciences and Physical Sciences
African 21 -4.71 19.13 30.77
Coloured 7 -3.17 12.44 23.08
Asian 4 18.18 0.62 15.38
White 44 -15.33 67.81 30.77
Astronomy Other N/A N/A N/A N/A
African 115 22.22 0.00 41.51
Coloured 6 22.22 0.00 1.89
Asian 24 2.69 9.66 1.89
White 168 13.26 90.34 54.72
Atmospheric Sciences Other N/A N/A N/A N/A
African 135 18.79 38.46 65.93
Coloured 6 7.41 7.69 2.21
Asian 4 22.22 0.00 0.55
White 91 13.42 53.85 31.31
General Earth-Space Sciences Other N/A N/A N/A N/A
African 1 378 12.86 19.53 50.72
Coloured 214 0.92 7.03 5.29
Asian 150 6.29 6.21 7.71
White 1 293 -2.76 67.23 36.29
Physics Other 17 nd3 0 nd3
Mathematical Sciences
African 5 592 12.9 21.25 42.51
Coloured 555 6.71 4.22 4.18
Asian 1 136 6.62 7.78 7.63
White 6 728 2.77 66.75 45.54
Mathematical Sciences (All) Other 65 11.11 nd3 0.14 3Data unavailable.
Source: HEMIS database
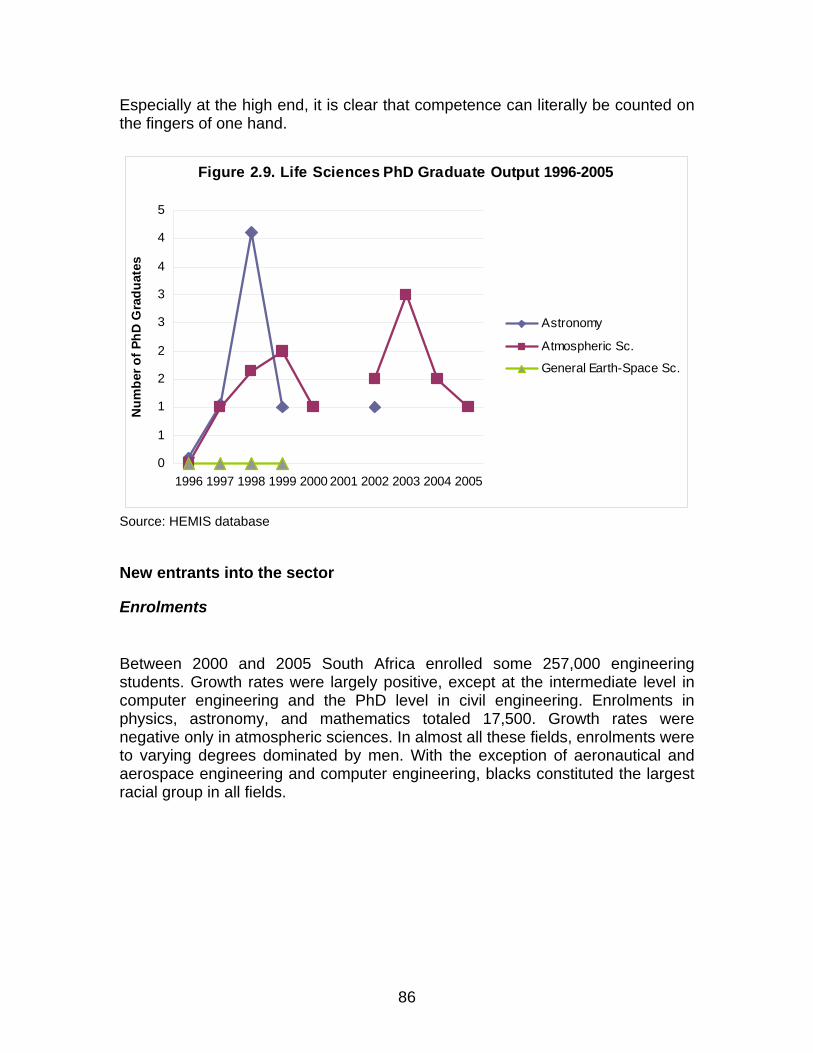
86
Especially at the high end, it is clear that competence can literally be counted on the fingers of one hand.
Figure 2.9. Life Sciences PhD Graduate Output 1996-2005
0
1
1
2
2
3
3
4
4
5
1996 1997 1998 1999 2000 2001 2002 2003 2004 2005
Num
ber o
f PhD
Gra
duat
es
Astronomy
Atmospheric Sc.
General Earth-Space Sc.
Source: HEMIS database
New entrants into the sector
Enrolments
Between 2000 and 2005 South Africa enrolled some 257,000 engineering students. Growth rates were largely positive, except at the intermediate level in computer engineering and the PhD level in civil engineering. Enrolments in physics, astronomy, and mathematics totaled 17,500. Growth rates were negative only in atmospheric sciences. In almost all these fields, enrolments were to varying degrees dominated by men. With the exception of aeronautical and aerospace engineering and computer engineering, blacks constituted the largest racial group in all fields.

87
Table 2.11. Number of enrolments and % average annual growth in enrolment in selected Engineering categories, 2000 - 2005
Engineering and Engineering Tech.
All Aerospace & Aeronautical Civil Computer Electrical
Engineering Science Instrumentation Mechanical
2000 - 2005
% Av. Annual Growth
2000 - 2005
% Av. Annual Growth
2000 - 2005
% Av. Annual Growth
2000 - 2005
% Av. Annual Growth
2000 - 2005
% Av. Annual Growth
2000 - 2005
% Av. Annual Growth
2000 - 2005
% Av. Annual Growth
2000 - 2005
% Av. Annual Growth
Intermediate Skill Level¹
131 927 13.50 13.50 -34.07 24 251 11.30 34 -20.00 51 062 14.29 23 20.00 0 nd3 16 839 18.15
High Skill Level² 125 002 4.40 730 18.49 15 914 6.47 3 252 15.15 41 880 1.33 801 -34.25 99 24.00 18 069 3.81
Of which - Masters 14 173 5.39 2 nd3 1 965 2.59 174 15.76 3 930 9.21 132 -26.28 74 nd3 1 831 2.76
- PhD 3 622 7.09 nd3 nd3 508 -1.76 3 nd3 934 7.42% 9 nd3 15 nd3 882 4.82
Other 1 nd3 nd3 nd3 nd3 nd3 nd3 nd3 nd3 nd3 nd3 nd3 nd3 nd3 nd3 nd3
Total 256 931 9.62 744 15.43 40 164 9.52 3 286 13.44 92 942 9.40 824 -23.84 99 24.00 34 908 11.71
¹ Post-school, pre-degree qualifications including college and technikon national certificates and diplomas. ² Higher education degree qualifications and post-graduate courses including BTech, Honours, Masters and PhD qualifications, and post-graduate diplomas. 3Data unavailable.
Source: HEMIS database

88
Table 2.12. Number of enrolments and % average annual growth in enrolment selected categories, 2000 – 2005
Life Sciences and Physical Sciences Mathematical Sciences
Physics Astronomy Atmospheric Sciences General Earth-Space Sciences All
2000 - 2005
% Av. Annual Growth 2000 - 2005
% Av. Annual Growth 2000 - 2005
% Av. Annual Growth 2000 - 2005
% Av. Annual Growth 2000 - 2005
% Av. Annual Growth
Intermediate Skill Level¹ 1 928 -0.84 nd3 nd3 10 nd3 2 nd3 10 046 -10.54
High Skill Level² 15 502 5.44 306 0.44 718 -20.25 662 0.43 63 685 2.12
Of which - Masters 993 6.62 16 -17.14 180 -15.55 16 nd3 2 192 9.50
- PhD 734 -1.13 31 24.00 75 -10.91 1 nd3 923 1.40
Other 98 nd3 nd3 nd3 nd3 nd3 nd3 nd3 319 nd3
Total 17 528 4.77 306 0.44 727 -20.33 664 0.05 74 049 0.69 ¹ Post-school, pre-degree qualifications including college and technikon national certificates and diplomas. ² Higher education degree qualifications and post-graduate courses including BTech, Honours, Masters and PhD qualifications, and post-graduate diplomas. 3Data unavailable.
Source: HEMIS database

89
Table 2.13. Number of enrolments and % average annual growth in enrolment in selected categories, 2000 – 2005, by gender
% Share of Total
Study Fields Gender 2000 - 2005
% Average Annual Growth 2000 2005
Engineering and Engineering Tech.
Female 54 343 13.72 17.81 22.29
Male 202 580 8.56 82.18 77.71 Engineering and Engineering Tech. (All) Unknown 8 -28.57 0.01 0.00
Female 134 15.71 20.75 21.10
Male 610 15.35 79.25 78.90
Aerospace & Aeronautical Unknown nd3 nd3 nd3 nd3
Female 8 889 14.07 19.10 24.52
Male 31 272 8.20 80.88 75.48
Civil Unknown 3 nd3 0.02 nd3
Female 394 9.75 10.74 8.78
Male 2 892 13.83 89.26 91.22
Computer Unknown nd3 nd3 nd3 nd3
Female 16 409 16.61 13.57 20.33
Male 76 531 7.85 86.43 79.67
Electrical Unknown 1 nd3 nd3 nd3
Female 57 -30.00 7.57 4.27
Male 768 -23.38 92.43 95.73
Engineering Science Unknown nd3 nd3 nd3 nd3
Female 27 nd3 nd3 nd3
Male 73 nd3 nd3 nd3
Instrumentation Unknown nd3 nd3 nd3 nd3
Female 3 700 17.83 8.89 12.69
Male 31 206 10.93 91.09 87.31
Mechanical Unknown 2 nd3 0.02 nd3 3Data unavailable.
Source: HEMIS database

90
2.14. Number of enrolments and % average annual growth in enrolment in selected categories, 2000 – 2005, by gender
% Share of Total
Study Fields Gender 2000 – 2005
% Average Annual Growth 2000 2005
Life Sciences and Physical Sciences
Female 110 9.48 29.65 47.02
Male 196 -5.20 70.35 52.98
Astronomy Unknown nd3 nd3 nd3 nd3
Female 319 -21.22 48.58 45.71
Male 409 -19.51 51.42 54.29
Atmospheric Sciences Unknown nd3 nd3 nd3 nd3
Female 303 2.44 48.71 54.91
Male 361 -2.53 51.29 45.09
General Earth-Space Sciences Unknown nd3 nd3 nd3 nd3
Female 7 008 5.58 37.88 39.48
Male 10 520 4.25 62.12 60.50
Physics Unknown 1 nd3 nd3 0.01
Mathematical Sciences
Female 29 461 1.25 38.16 39.25
Male 44 587 0.34 61.83 60.75
Mathematical Sciences (All) Unknown 1 nd3 0.01 nd3 3Data unavailable.
Source: HEMIS database
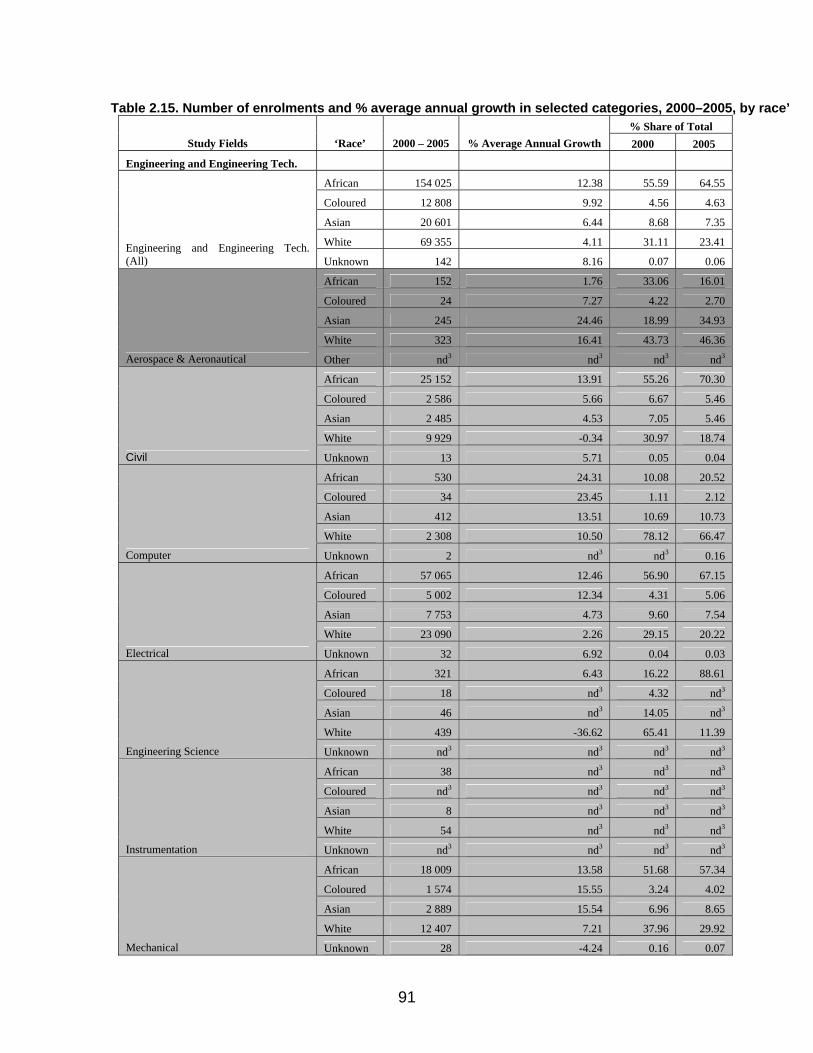
91
Table 2.15. Number of enrolments and % average annual growth in selected categories, 2000–2005, by race’ % Share of Total
Study Fields ‘Race’ 2000 – 2005 % Average Annual Growth 2000 2005 Engineering and Engineering Tech.
African 154 025 12.38 55.59 64.55 Coloured 12 808 9.92 4.56 4.63 Asian 20 601 6.44 8.68 7.35 White 69 355 4.11 31.11 23.41 Engineering and Engineering Tech.
(All) Unknown 142 8.16 0.07 0.06 African 152 1.76 33.06 16.01 Coloured 24 7.27 4.22 2.70 Asian 245 24.46 18.99 34.93 White 323 16.41 43.73 46.36
Aerospace & Aeronautical Other nd3 nd3 nd3 nd3 African 25 152 13.91 55.26 70.30 Coloured 2 586 5.66 6.67 5.46 Asian 2 485 4.53 7.05 5.46 White 9 929 -0.34 30.97 18.74
Civil Unknown 13 5.71 0.05 0.04 African 530 24.31 10.08 20.52 Coloured 34 23.45 1.11 2.12 Asian 412 13.51 10.69 10.73 White 2 308 10.50 78.12 66.47
Computer Unknown 2 nd3 nd3 0.16 African 57 065 12.46 56.90 67.15 Coloured 5 002 12.34 4.31 5.06 Asian 7 753 4.73 9.60 7.54 White 23 090 2.26 29.15 20.22
Electrical Unknown 32 6.92 0.04 0.03 African 321 6.43 16.22 88.61 Coloured 18 nd3 4.32 nd3 Asian 46 nd3 14.05 nd3 White 439 -36.62 65.41 11.39
Engineering Science Unknown nd3 nd3 nd3 nd3 African 38 nd3 nd3 nd3 Coloured nd3 nd3 nd3 nd3 Asian 8 nd3 nd3 nd3 White 54 nd3 nd3 nd3
Instrumentation Unknown nd3 nd3 nd3 nd3 African 18 009 13.58 51.68 57.34 Coloured 1 574 15.55 3.24 4.02 Asian 2 889 15.54 6.96 8.65 White 12 407 7.21 37.96 29.92
Mechanical Unknown 28 -4.24 0.16 0.07

92
3Data unavailable. Source: HEMIS database Table 2.16. Number of enrolments and % average annual growth in selected categories, 2000 – 2005, by ‘race’
% Share of Total
Study Fields ‘Race’
2000 – 2005
% Average Annual Growth 2000 2005
Life Sciences and Physical Sciences
African 47 13.93 9.29 18.81 Coloured 8 30.00 0.96 6.58 Asian 15 -10.00 9.62 5.64 White 236 -2.83 80.13 68.03
Astronomy Other 1 nd3 nd3 0.94 African 277 -7.69 22.31 46.37 Coloured 17 -28.57 4.13 2.11 Asian 49 -24.52 6.46 4.76 White 384 -25.19 67.10 46.76
Atmospheric Sciences Other nd3 nd3 nd3 nd3 African 431 1.10 53.95 56.86 Coloured 16 nd3 nd3 3.20 Asian 15 -7.59 3.67 2.50 White 201 -2.43 42.38 37.44
General Earth-Space Sciences Other nd3 nd3 nd3 nd3 African 9 663 7.18 53.13 60.11 Coloured 1 179 0.62 6.79 5.52 Asian 1 050 5.41 7.00 7.24 White 5 609 0.77 32.99 26.98
Physics Unknown 28 16.00 0.08 0.15
Mathematical Sciences African 37 001 1.71 47.82 50.34 Coloured 3 357 5.25 4.08 5.13 Asian 5 662 -0.96 8.08 7.44 White 27 393 -0.38 38.97 36.94
Mathematical Sciences (All) Unknown 636 -29.59 1.05 0.15 3Data unavailable.
Source: HEMIS database

93
Again, enrolments of PhD students were few and far between.
Figure 2.10. Life Sciences PhD Enrolments 2000-2005
0
5
10
15
20
25
2000 2001 2002 2003 2004 2005
Num
ber o
f PhD
Stu
dent
s
Astronomy
Atmospheric Sc.
General Earth-Space Sc.
Source: HEMIS database
Targeted initiatives in astrophysics and space science The National Astrophysics and Space Science Programme (NASSP) was initiated in 2003 as a response to the need to build human capacity in astrophysics and space science in South Africa and the region. These fields represent a global skills shortage. In 2007 there were only 60 astronomers working in South Africa, which is a significant improvement from the 36 in 2001 (Echo Magazine 2007). NASSP is a national Masters programme aimed at increasing the pool of students, particularly black students, with a Masters in Astrophysics and Space Science, and acts as a feeder programme for PhD programmes. NASSP does however have an honours programme, which also allows students specialising in other fields, such as physics and engineering, to move into astrophysics. Students also have the option of upgrading their Masters studies to PhD level. It is jointly run by nine universities, the three national astronomy facilities and the Karoo Array Telescope (KAT) Project. The 13 institutions in the NASSP consortium include Rhodes University (RU), University of KwaZulu-Natal (UKZN), North-West University (NWU), University of the Free State (UFS), University of Zululand (Zululand), University of South Africa (UNISA), University of the Western Cape (UWC), University of the Witwatersrand (UW), University of Cape Town (UCT), SAAO, HartRAO, HMO and KAT. NASSP is hosted at UCT. The NASSP curriculum focuses on astronomy, space physics and cosmology. Courses are taught by academics from the partner institutions and other international institutions. Students must complete the first semester of Masters studies at UCT and are allowed to complete their research thesis at any
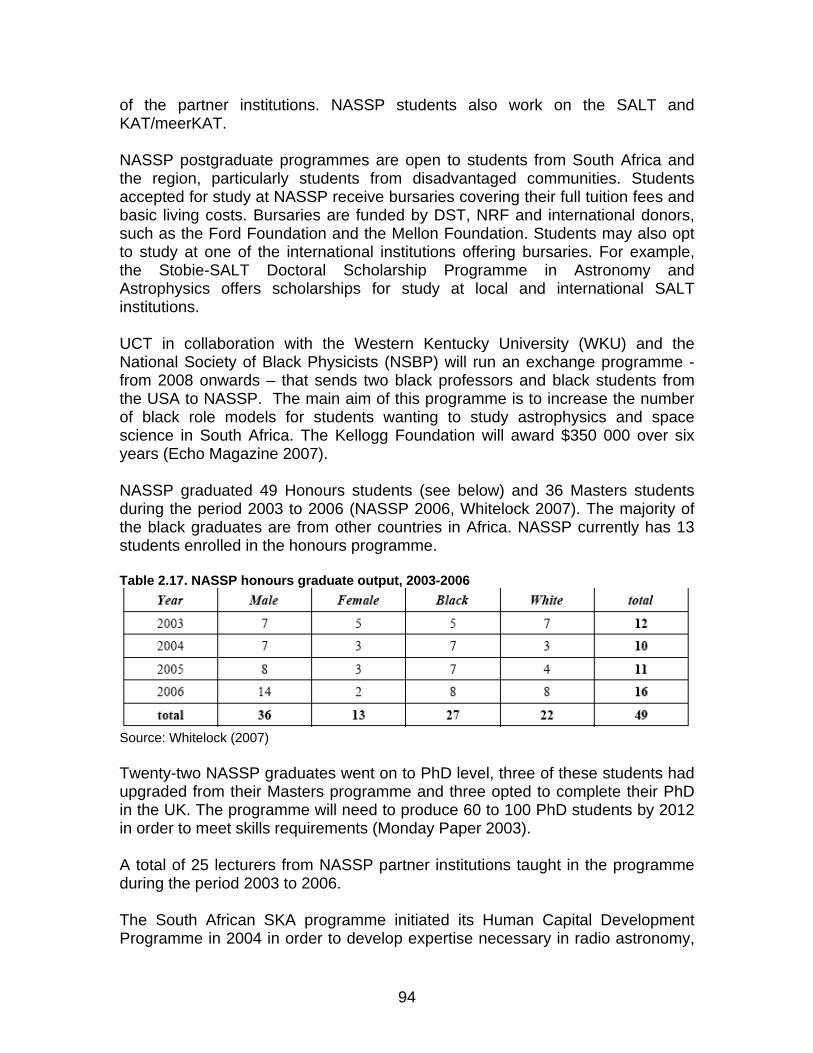
94
of the partner institutions. NASSP students also work on the SALT and KAT/meerKAT. NASSP postgraduate programmes are open to students from South Africa and the region, particularly students from disadvantaged communities. Students accepted for study at NASSP receive bursaries covering their full tuition fees and basic living costs. Bursaries are funded by DST, NRF and international donors, such as the Ford Foundation and the Mellon Foundation. Students may also opt to study at one of the international institutions offering bursaries. For example, the Stobie-SALT Doctoral Scholarship Programme in Astronomy and Astrophysics offers scholarships for study at local and international SALT institutions. UCT in collaboration with the Western Kentucky University (WKU) and the National Society of Black Physicists (NSBP) will run an exchange programme - from 2008 onwards – that sends two black professors and black students from the USA to NASSP. The main aim of this programme is to increase the number of black role models for students wanting to study astrophysics and space science in South Africa. The Kellogg Foundation will award $350 000 over six years (Echo Magazine 2007). NASSP graduated 49 Honours students (see below) and 36 Masters students during the period 2003 to 2006 (NASSP 2006, Whitelock 2007). The majority of the black graduates are from other countries in Africa. NASSP currently has 13 students enrolled in the honours programme. Table 2.17. NASSP honours graduate output, 2003-2006
Source: Whitelock (2007) Twenty-two NASSP graduates went on to PhD level, three of these students had upgraded from their Masters programme and three opted to complete their PhD in the UK. The programme will need to produce 60 to 100 PhD students by 2012 in order to meet skills requirements (Monday Paper 2003). A total of 25 lecturers from NASSP partner institutions taught in the programme during the period 2003 to 2006. The South African SKA programme initiated its Human Capital Development Programme in 2004 in order to develop expertise necessary in radio astronomy,

95
including radio astronomy, radio frequency engineering, software engineering and computing, digital signal processing, physics. In order to achieve this objective, the South African SKA programme has offered a number of bursaries to students in the NASSP programme. 52 bursaries have been awarded since 2004 (see below), and the programme plans to offer another 72 bursaries over the next few years. Table 2.18. Number of bursaries awarded by the South African SKA Human Capital Development Programme per academic year and academic level
Source: Cloete (2007)
Table 2.19. South African and non-South African bursars of the South African SKA Human Capital Development Programme at NASSP
Source: Cloete (2007)
South African universities also offer postgraduate training in other areas of space science. Stellenbosch University (SUN) collaborates with its spin-off company, SunSpace, in their training in satellite engineering. SUN offers a postgraduate diploma, a Masters degree and internships in satellite engineering. Students in these programmes work on developing satellite systems at SunSpace. Students receive training in space and ground applications. The postgraduate training and internship programme has funded 18 Masters, two Ph.D and four postgraduate fellowships thus far (Martinez 2007). Training in remote sensing is offered at UCT, University of Pretoria and University of Johannesburg at the undergraduate level; and at Meraka Institute

96
for ICT at the postgraduate level. The University of the Witwatersrand offers a postgraduate diploma in space policy and space law, focusing on the legal considerations of satellite communications.

97
3 CASE STUDIES
Introduction Human capital concerns affect both existing and future projects within space science and technology in South Africa. This is illustrated below through case studies of two flagship projects, namely SALT and MeerKAT.
SALT The South African Astronomical Observatory (SAAO) is the national facility for optical and infrared astronomy in South Africa and is the host institution of the Southern African Large Telescope (SALT). SALT is operated by SAAO on behalf of the SALT foundation, an international consortium of 13 institutions. The SAAO employs about 100 people and more than half of the skilled people employed at the SAAO are engineers and technicians rather than astronomers. The majority of the astronomers working at the SAAO are from overseas. Although there are about 30 staff members dedicated to the SALT facility, all of the staff members at the SAAO are involved in SALT to some extent. The major problems that SAAO has experienced in operating SALT are related to human resources. SAAO has experienced difficulty in getting people to live and work at the SALT facility in the remote Sutherland region; and in finding suitably qualified local software and optical engineers, and local astronomers. For example, a Polish optical engineer was brought in from abroad for the construction of SALT because South Africa lacks expertise in optical engineering. One solution for the problem experienced in retaining staff on-site at Sutherland is to have technical support staff live in Cape Town and spend about two weeks at Sutherland then one week in Cape Town, in the way that oil-rigs are run, but this is not a desirable solution and is very expensive. A loss of five minutes of observation at night can be costly considering that an observing night on SALT is valued at $20 000 (approximately R140 000), thus the presence of skilled technical staff on-site is essential. One option being considered in future, once sufficient data bandwidth exists between Cape Town and Sutherland, is for the observations to be remotely conducted by a SALT astronomer based in Cape Town. The instrument set-ups, observing schedule and data interrogation would then be remotely controlled, while a local operator would control the telescope. SAAO is collaborating with the other astronomy facilities in South Africa and the meerKAT team to solve the problem of the lack of local astronomers. Astronomy has been identified by the government as an area in which we have a strategic advantage by virtue of our geographical position, climate, and good infrastructure. The government has invested a significant amount of money and

98
brought a significant amount of money into this country to build astronomical facilities. The astronomical facilities in the region are all interlinked. The combination of HESS, which is a high energy gamma ray facility; SALT, which is an optical observatory; and SKA/KAT, which is a radio observatory; gives us broad wavelength coverage. They are all different aspects of understanding the universe. The astronomy community has set the objective to ensure that the facilities are not simply run for the benefit of the international partners. It is important that South Africa not only benefits from the incoming investment for building and operating international facilities, but also benefits from the cutting-edge research being done with the use of these facilities. South Africans should participate in cutting-edge research in astronomy. Thus far SAAO has used the model of bringing in experts from overseas to work at the astronomy facilities and train local people in astronomy. Efficient operation of astronomy facilities requires a combination of scientists, engineers and technicians. SAAO has run in-service training programmes for engineers and technicians for the past 15 years. The option of in-service training is not however possible for building local human capital in astronomy as a PhD qualification is necessary in order to work as an astronomer. The major problem in South Africa is that the current PhD graduate output and subsequent training is insufficient to meet the demand for developing a strong local astronomy community, which is necessary in order for South Africa to be internationally competitive in astronomy. The PhD graduate output has to increase by a factor of five or six in order to meet the requirement of 20 PhD graduates per year. The PhD students should also be willing to travel overseas as an important part of the training is to engage in technology transfer and exchange programmes. This would provide breadth in training and encourage the development of strong international networks for future collaboration. There are number of challenges to meeting the demand for PhD’s and thus building a strong local astronomy community. These challenges include:
o the insufficient number of students with sound undergraduate and postgraduate mathematics and physics qualifications;
o insufficient funds for offering competitive bursaries to meet that offered by engineering and physics programmes, and industry;
o the constraint of not being allowed to offer joint degree qualifications; o the constraints posed by the DoE’s funding model for universities that
encourages competition between universities (for students) and thus discourages the operation of inter-university programmes such as NASSP; and
o insufficient funds for offering internationally competitive salaries for recruiting experts from overseas to engage in technology transfer and build local human capital.
99
In addition to the challenges mentioned above, it is anticipated that there will be a demand from industry for PhD graduates in astronomy as there is in Europe and North America where 50% of the people with PhD’s in astronomy do not stay in astronomy. These students will go on to work in other industries, particularly the computing, aerospace and electronics industries and even financial institutions. This is true for all types of astronomy, radio, optical, theoretical, etc. The challenge is thus to make astronomy an attractive option. Currently, astronomers are paid salaries at the same level as academics, which is not competitive with industry locally and globally. For example, astronomers and physicists with mathematical modeling experience are in demand for work in the finance industry locally and abroad. There is a lack of black astronomers in South Africa. NASSP has experienced difficulty in recruiting suitably qualified black South African students as they are competing with the engineering,physics and other programmes for the same pool of students. One reason for the limited number of black students with sound mathematics and physics backgrounds is that the schooling system has failed to produce students with sound foundations for tertiary-level studies in mathematics and physics. Most of the black students in NASSP are from other African countries and many of the locally-recruited black students in the programme have failed to do sufficiently well in their honours year to progress the the next stage. Many black students also have the added pressure of having to support their families financially. It is thus important to offer bursaries that are competitive with industry. For example, the NRF bursaries range from R8000 to R20 000 per year, which is insufficient especially considering that university fees amount to around R24 000 and black university graduates can earn about R200 000 per year working in industry. If all goes well next year, NASSP will offer bursaries between R65 000 and R70 000 for honours and masters studies, and about R100 000 for PhD. These bursaries are not however competitive with other institutional programmes, for example, the CSIR is offering bursaries of more than R100 000 a year for science masters students and this programme has attracted a lot of the physics students - black students in particular. Even though the bursaries are not competitive enough, NASSP has been criticized for ‘overpaying’ the students at R65 000 because the standard NRF offers only R8000 per year for honours studies. NASSP initially struggled to get funding from government but government invested more in the past few years and the programme is now almost entirely funded by DST. It also has had good international funding from the Ford Foundation and the Mellon Foundation. The astronomy community plans to recruit people at the postdoctoral level to train PhD students so that the people at the senior level in their 40’s and 50’s can

100
have more time for research and supervising students’ research. DST’s initiative to increase the number of research chairs would have a positive impact. For example, UCT recruited an astronomer from Australia for a research chair. It is important to note that DST and the Department of Home Affairs play a key role in recruiting experts from overseas, and opportunities to recruit experts have been lost due to bureaucratic issues. Another major problem identified is that many of the historically black universities are not producing students with a sound foundation in mathematics and physics for postgraduate study in astrophysics and space science. NASSP has been receiving an increase in interest from students from historically black institutions and are thus planning to offer an extended honours programme that will start in 2008. Students will have the option of completing honours over two years (instead of one year) in order to get the necessary foundation for further studies. It is uncertain as to whether this strategy will be successful in producing more black students with a postgraduate qualification in astrophysics and space science. For postgraduate-level studies in subjects like mathematics and physics, a proper grounding at school and undergraduate level is very important. Next year NASSP will have two African American students, who are sponsored by the Kellogg Foundation, as part of the programme. The Americans want to participate in NASSP because they are concerned that they do not have enough African Americans in science. America is undergoing a change in demographics and is now becoming much more Hispanic and black, but the percentage of these population groups in science is minute. It will be beneficial for NASSP students to work with the African American students to exchange knowledge and form networks. The astronomy community has been trying to persuade the government, particularly in working with DST, to develop a sound human resources plan for astronomy in South Africa. It is suggested that the human resources plan involve DST, DoE and DoL. This long-term plan for ensuring the future of astronomy in South Africa would require adequate co-ordination between these departments. In addition to the problem of a lack of suitably qualified people, SAAO has also identified the current state of internet connectivity providing insufficient bandwidth for data transfer, as another problem. This would also be a problem for the meerKAT project if it is not fixed by the time meerKAT is in full operation. The government is working towards improving internet connectivity. SAAO reports that finding local suppliers of the various components of SALT has not been a problem. South Africa contributed one third of the total cost of SALT and two thirds of the total cost of SALT was spent in South Africa. Some of the components, like the optics, were brought in from overseas; but most of the components were manufactured by local suppliers, such as the building, dome, telescope structure and the complicated robotics for controlling the telescope's
101
pointing and tracking. Likewise for the software control, which is the heart of the telescope, was developed by an all South African team. The design of the SALT spherical aberration corrector, which was a redesign of the Hobby-Eberly Telescope (HET) in Texas, was done by one of SAAO’s astronomers and has now been used as the design basis for an upgrade of the HET.
MeerKAT In 2004, the meerKAT team was given the task to design and construct meerKAT, the prototype for the South African SKA telescope. South Africa had initially planned to only collaborate internationally on the SKA project, but later decided that it was necessary to develop a prototype for the SKA on South African soil to strengthen SA’s bid for the SKA. The decision to develop meerKAT was also indirectly driven by Australia. The main challenges that the meerKAT project leaders faced was that they were expected to conceptualise meerKAT, build a team and build a telescope in a short span of time (about five years). Constructing meerKAT from scratch over a period of five years is challenging considering that globally, (big science) radio astronomy technologies are built in gradual steps (starting with the subsystems) and money is sought incrementally throughout the project, and such technologies usually take 12 to 15 years to complete. The meerKAT project office is situated in Cape Town since the majority of the people working on the project come from Cape Town. The SKA SA bid office is in Johannesburg. The majority of the students recruited came from NASSP. Students also came from Rhodes, where SKA project scientist, Justin Jonas is stationed, and various other universities. The (engineering) team consists of 28 people and the number is growing to 34. Most of the team members came straight out of university and had no proper training in radio astronomy when they first started – because of the lack of skilled persons in South Africa. Only one person had some training in radio astronomy. Training was done in collaboration with universities and with various radio astronomy facilities worldwide. During the first six months the students were sent to the various radio astronomy telescopes globally - including the big array in New Mexico and the new radio astronomy telescope facilities - to learn the technological know-how. The peculiar thing about radio astronomy is that it is a completely open society globally. Knowledge is shared openly. The meerKAT team runs training programmes in collaboration with other astronomy facilities globally. The Human Capital Development programme was initiated towards the end of 2004. The meerKAT project office runs an internship programme and offers bursaries for postgraduate study. The programme is open to students nationally and internationally, particularly to students from countries that will host the

102
(‘outrigger’) arrays of the South African SKA. The meerKAT project currently has students from Mauritius and Madagascar. In order to get a sense of the skills requirements for the meeKAT, a manual of skills needs was compiled in 2004. This manual was based on the technology and science requirements of the meerKAT. The list of skills requirements is reviewed annually by the team prior to sending out the call for bursars. A total of 72 bursaries will be offered by meerKAT over the next few years. It is however expected that at least half of the 72 bursars will go on to work for industry. Already, two students who were on the bursary programme now work for The Monitor Group as consultants. Students who come through the programme leave the programme with good basic knowledge for work in industry. At the moment there is no set career path for students in radio astronomy in South Africa; but there will be by the end of 2009 when meerKAT starts producing data because of current efforts to build human capital. As part of the human capital development programme, there are about 17 people who assist with human capital development but are not actually part of the project. They are primarily from Rhodes and UCT. The meerKAT telescope is different from other telescopes because it will survey all the time and provide huge volumes of data that would have to be processed and analysed. [The data will probably be sent to centers of excellence. It is being debated internationally as to whether there will be one center of excellence or a center in each participating country.] We would need to have enough qualified people to analyse the information collected by the telescope. Once meerKAT is in operation, getting enough people is not foreseen to be a problem but there is a concern as to whether there would be enough people with the specific specialised radio astronomy skills required. Currently, there is a shortage of skills in radio astronomy and specialised skills within radio astronomy. For example, when the team advertised jobs in RF (radio frequency), they only received four applicants and none were considered suitable. There is also a lack of people with infrared and interferometer experience. The meerKAT team is trying to recruit people, nationally and internationally, with skills in these areas. Recently, an engineer with the required skills was recruited from India to work at the meerKAT office. He will be joining the team in February 2008. His main purpose is to build human capacity. Considering the dearth of expertise in radio astronomy in South Africa, the meerKAT team found that the best strategy for building human capacity in the short span of time available is to recruit experts from outside of South Africa to mentor students working on the project. Currently, the project requires qualified engineers with experience in radio astronomy (and interferometry in particular). Recruiting experts from overseas has, however, been challenging. The main reasons for problems in recruiting and retaining people from outside of South Africa include:
103
- The high crime rate or rather the perception of a high crime rate. - Very often spouses are not allowed to work in South Africa due to home
affairs regulations. Thus the experts end up leaving because their spouses are unhappy about not being allowed to work.
South Africa has a strong skills base in optical astronomy. Most of the astronomy graduates over the past few years are probably from the NASSP and 90% would have been trained in optical astronomy. SALT had a small bursary programme and most of the scientists were recruited from outside of the country. We also have a good skills grounding in mathematics, physics and engineering; which are essential for training in astronomy. Postgraduate training in radio astronomy is now offered as part of the NASSP modules, and at some of the other universities offer training in astronomy. Currently, training in radio astronomy is only being offered at the postgraduate level. Undergraduate training is being planned to commence next year. Universities are running short on mentors in radio astronomy. The meerKAT team is also trying to establish chairs in radio astronomy at universities. Roy Booth was one of the first international acquisitions. International expertise is also important for conducting reviews of the work produced by the team because the team is not experienced in radio astronomy and they are constructing cutting-edge technology. It is thus important to have their work reviewed regularly by international experts in order to constantly check what they are missing at the subsystem level and big project level. This is not necessarily the strategy that the team prefers. They would prefer to have more skilled engineers on-site. Engineers of the 45-year age group with experience in radio astronomy are sought. Globally, there are only about five people with the necessary expertise. This is exacerbated by the fact that the international SKA project has also started recruiting experts, drawing the best people into the SKA central team. Although South Africa may be losing key people to the international project, it is important to find a balance because we also want to get people into the international team who may be able to influence the bid. The meerKAT project leaders admit that although they have a gentleman’s agreement within the SKA community that they will not take people from each other, they cannot prevent people from leaving. They cannot prevent the SKA from advertising positions or people applying for jobs advertised by the SKA. Members of the meerKAT have not however indicated the desire to leave the team. Team members will eventually have the opportunity to work on the SKA and thus do not have to leave in order to be able to participate in the international teams. Other strategies to build human capacity are the meerKAT project’s internship programme and assisting the Hartebeeshoek Radio Astronomy Observatory (HartRAO) to build human capacity at the observatory. Once meerKAT has been completed by the project team, it will be handed over to the NRF or HartRAO. The meerKAT project plans to lend HartRAO money to start employing people
104
from next year onwards to build a bigger team. The internship programme offered by the meerKAT project will provide human capacity for operating the telescope in Cape Town. The telescope will be built in the Karoo but run from the Cape Town station. The only people on-site in the Karoo will be the security and those needing to do site maintenance. This ‘distance control’ is necessary as having too many people on-site would have an adverse effect on the telescope operations, and it is difficult to get people to work in the remote Karoo. The meerKAT project team also sub-contracts a lot of the engineering work. Most of the companies to which they sub-contract are traditionally in the defence industry. These companies have experienced financial constraints and constraints in terms of human capacity. They have thus begun to re-skill people for work on the new astronomy projects. The meerKAT project team decided early on that the best approach for constructing the meerKAT within the required time-frame would be a system engineering approach. They then appointed the sub-system manager. The team chose a few sub-systems to work on that could be used for the SKA. The strategy is to develop these sub-systems and give South African firms the advantage to compete for contracts for the SKA when the time comes. In this way, even if South Africa does not win the bid, the meerKAT team would still sell the prototype dish that they are in the process of developing. South African firms are also keen to work on meerKAT as it is a large-scale project. The international community signed an agreement that all that is developed for the project will be shared within the project. Whoever develops can declare the intellectual property rights. The meerKAT team collaborates with Australia in developing subsystems for the SKA project. South Africa’s strength is in software and Australia’s strengths are in astronomy and engineering. The South African team developed the next generation digital signal processing correlator. The team’s international collaborations are important for developing new subsystems. The correlator will probably be tested by India at its GMRT facility. India has the ideal radio astronomy technology for testing the correlator. The team also collaborates with the University of California, Berkley, in developing the digital processing systems. Berkley has the experience in and facilities for developing digital processing systems. The meerKAT team is not certain with regard to the number of people required for the project for the next few years as the project is still in the developmental stage and South Africa does not have experience in big science radio astronomy to build on. The operational model for the telescope is also different from other telescopes in that the telescope operation will be done from a distance because the SKA/meerKAT can only operate in remote areas.

105
It is estimated that about 30 to 40 people will be required to operate the control facility of the meerKAT in Cape Town.
Summary In short, SALT is a completed installation that has been operational for over a year. This is a success for South African endeavours in space technology in its own right. But South Africa will only be able to gain maximum mileage from the SALT, an international space technology collaboration, if it manages to marry the advantages of geographic location and the ability to operate and maintain the telescope with the sort of expertise required to design and implement scientific experiments on the installation. This is the key challenge for the South African Astronomical Observatory. By contrast, MeerKAT is a technology in the making. The prize for succeeding to design, develop, and build this telescope within the tight timeframe is twofold. First, it may convince the SKA Consortium to award South Africa the SKA contract. But second, even if Australia gets the final nod, the idea is that the substantial expertise built up throughout this process will help South African firms bid successfully on component and service contracts for the SKA wherever it will be set up. In both cases, overcoming human capital challenges is key.

106
4 RECOMMENDATIONS South Africa’s objectives in space science and technology are extremely ambitious. In short, the country wants to operate at the global technology frontier. This strategy is based on a combination of geographic and other site advantages for the location of major international collaborations in telescopes and residual capabilities in astronomy. But in order to be able to collaborate with the world’s leading space science institutions, South Africa needs to upgrade the depth of expertise and the volume of knowledge it commands in the field. Currently astronomers are few and far between and nowhere near the levels required to ensure that South Africa does not simply end up hosting world-class institutions without the requisite capabilities to exploit their scientific and technological potential. This implies two things. The first is that customized graduate programmes such as NASSP and MeerKAT’s bursary programmes be expanded. It is important that higher education institutions be given incentives to cooperate with these programmes instead of perceiving them as an encroachment upon their turf. The current financing model of higher education penalizes universities for students who “leave” their home university in order to study at a specialized, joint graduate programme elsewhere. Since in astronomy and related fields no single institution by itself has the critical mass to offer a full-range training programme, this practice is detrimental to setting up partnerships across universities and their partners. The second is that South Africa relies on outside skills for which there is global demand. Astronomy expertise is globally in shortage. Because of the country’s location-specific advantages, international experts are in principle available to come to South Africa, boost its local expertise, mentor junior colleagues, and generally strengthen the country’s claim to be a promising emerging space nation. Yet anecdotes of excellent people who were put off – and eventually lost to the country – by bureaucratic delays, obstructionism with respect to work permits for their spouses etc, abound. This must end. It requires for DST and DoHA to get their act together to ensure that South Africa does not shoot itself in the foot when it comes to attracting and retaining global talent without which its space ambitions are unlikely ever to become world class.

107
PART 3: BIOTECHNOLOGY*
*Acknowledgements are due Reinhard Hiller and Sipho Mdleleni for giving us insights into their respective companies.
108
1 SECTORAL PROFILE
Introduction Biotechnology is the “application of science and technology to living organisms, as well as parts, products and models thereof, to alter living or nonliving materials for the production of knowledge, goods, and services” (Van Beuzekom and Arundel 2006, 7). Relevant technologies include genetic, protein, cell, and tissue engineering, with applications in human and veterinary health, agriculture, industrial processing, and other fields.
Biotechnology in the world In 2003, some 11,500 firms were active in biotechnologies in the OECD member states, Shanghai, and South Africa, of which over 4,000 were core biotech companies. 27 per cent were located in the EU, followed by the US (19%), Japan (7%), and Korea (6%). South African firms accounted for about one per cent of the total. Bio-active employment in these firms was just under 290,000. The US led sales with $50bn (all at PPP rates), followed by Japan ($10bn), UK ($6bn), and Denmark ($4bn). By comparison, South African sales amounted to $123m. Approximately half the firms are active in health applications, followed by agro-food (19%), and industry-environmental applications (15%) (Van Beuzekom and Arundel 2006). In 2005, revenues of all publicly traded companies topped $63bn. The global industry raised $20bn from different sources. Three quarters of venture capital went to US firms. Biotechnology has yet to become profitable; to date the sector has always run up – albeit diminishing – losses. The collective fascination with biotechnology is thus not based on the delivery on its commercial prospects, but on the innovative technologies it employs. After the bubble in 2000, venture capital funds became more risk averse and directed their attention to later-stage, product-focused companies. At the same time there was a decline of early-stage deals between alliance partners. The industry reacted to this changing funding environment by accelerating product development in alliances and creating new business models. The implicit, longer-term problem for the industry as a whole is that there is now a funding gap for early-stage development. This is essentially due to a timing mismatch in the sense that venture capital funds typically aim to cash in on their investment before new products are sufficiently advanced in the pipeline. Solutions to this problem include increased Merger and Acquisition (M&A) activity, including big pharma companies that move back further in the pipeline to embrace basic research. Alliances in biotechnology grew from 45 in 1990 to 274
109
in 2003. This was most pronounced for alliances between US firms. But increasingly sophisticated knowledge assets in developing countries, especially in the Asia-Pacific region, along with higher regulatory burdens in the US and Europe, have led to considerable outsourcing of R&D there (cf Southern Comfort, Eastern Promise 2004). Overall the industry structure more and more consists of system integrators – such as large pharmaceutical firms – coordinating a networked knowledge production system large parts of which are outsourced (Ernst&Young 2006, cf. Hopkins et al. 2007). Policymakers all over the world have bestowed almost iconic status on biotechnology as a somehow “revolutionary” technology. But a careful examination of knowledge generation and application from the sciences to the clinic shows that the process of translating advances in biosciences to commercially viable technologies is a gradual and arduous process that takes (a long) time and plenty resources. Complementary innovations and very different organizational changes in drug discovery and development and in clinical practice have accompanied the expansion of biotechnologies into growing forms of applications. So biotechnology has developed together with traditional pharmaceutical activities, rather than revolutionizing the life sciences (Hopkins et al. 2007). Biotechnology is a knowledge-intensive activity. Patent applications have grown above average in the 1990s and early 2000s. The share of biotechnology patents in total patents is also on the rise. Some three out of four patents originate in the US or Europe (Van Beuzekom and Arundel 2006).
Biotechnology in Africa A review of biotechnology in Africa for the AU and NEPAD concluded not only that biotechnology was key to Africa’s development but also what it would take to promote existing, disparate initiatives to a higher level. It underlined the importance of regional economic integration bodies to anchor the mobilization, sharing, and use of existing scientific and technological capacities, including human and financial resources and physical infrastructure. More precisely, this would incorporate regional innovation communities – as physical and virtual clusters of people and organizations – where individuals and institutions share skills and expertise in the pursuit of common goals. Investment in human resources, especially in experts in molecular biology, biochemistry, and bioinformatics, would be needed to achieve larger capture of the biotechnological value chain on the continent (Juma and Serageldin 2007). Within Africa, South Africa has particular strengths in food and medical biotechnology. Sizeable proportions of yellow maize and cotton planted are genetically modified. The country has also developed an insect-resistant potato. The CSIR and the ARC are involved in an international consortium that aims to

110
improve the nutritional content of sorghum. In the animal sciences, the University of Pretoria and Onderstepoort Veterinary Institute, in conjunction with international partners, developed and launched a molecular diagnostic testing kit for tick-borne diseases found in livestock. Strengths in healthcare biotechnology include research on an HIV/AIDS vaccine and other poverty diseases. Considerable attention is being paid to the role of traditional medicines in modern healthcare. The Southern African Biosciences Network (SANBio) is an important interlocutor in these endeavours. South Africa also leads the exploitation of biotechnology in manufacturing, notably in the substitution of synthetic chemicals with biological alternatives. The AU/NEPAD report therefore recommended that Southern Africa be principally responsible for health biotechnology within the regional distribution of competences and concentrations across the African continent. Suggested priorities for R&D and innovation include:
• the development and testing of AIDS vaccines; • the development of transgenic plant-based platforms for the cost-effective
expression of specific molecules; • the exploration of affordable remedies for people living with HIV/AIDS; • the development of anti-malarial drugs from indigenous plants; • the combating of drug resistance in the malaria parasite; • the testing of efficacy of plants used in the traditional treatment of
tuberculosis (Juma and Serageldin 2007).
Biotechnology in South Africa
Background South Africa has a long tradition of first-generation biotechnology pursued by researchers in a number of public and private institutions. It is a highly biodiverse country with considerable indigenous medical knowledge and a diverse gene pool. The most recent information about the size of the sector, the National Biotech Survey, is from 2003 and thus somewhat outdated (eGoli 2003). But a successor to this assessment is only expected sometime in 2008. The 2003 survey identified 47 core and 59 non-core modern firms plus some 600 research groups organized around just under a thousand projects. Start-ups numbered about two every year. Most firms employ up to 50 people. Although a majority does not work with genetically modified organisms, firms do use modern technologies and develop new applications. Approximately one tenth operate at the technology frontier. Subsidaries of multinational pharma firms such as GSK, Pfizer, Merck, and Novartis are in the country, primarily to manufacture and distribute their products and undertake clinical trials as opposed to providing support to pre-clinical R&D. In descending order of importance, most
111
biotechnology is concerned with human health, followed by plant biotech, industrial applications, and food and beverages. Most activities reside in Gauteng, closely followed by the Western Cape, and KwaZulu-Natal as a distant third (eGoli 2003, Motari et al. 2004, Wolson 2007). There is a general consensus that on the whole the sector has not been very successful at commercialization. This is because some research has too little market focus, academics are rarely keen on commercialization, and R&D personnel are, as in many other areas, rather scarce (for details, see Klerck 2006). In addition IP policies lack clarity, the local market size is too small for many products to achieve viability, technology transfer mechanisms are few and far between, institutional arrangements both between researchers and institutions are suboptimal, and funding is insufficient. The entire sector is supported by only one dedicated venture fund, Bioventures (www.bioventures.co.za; eGoli 2003, Wolson 2007). But the local industry does have successes to show. Flagship projects include the South African Aids Vaccine Initiative (SAAVI) and the South Africa Malaria Initiative (SAMI). Researchers at SAAVI are working with six potential novel candidate vaccines and multiple HIV/AIDS vaccine trials. This includes work on a preventative vaccine against the HIV-1 C subtype, the dominant strain in Africa and Asia. Other results include the first genome sequenced in Africa, a kit for the early diagnosis of corridor disease, genetically enhanced cereals and fruit, a bioartificial liver support system, a unique bacterial cocktail for the bioleaching of gold from ore, and the Rhodes Biosure Process which cleans heavily polluted mine water (Cloete, Nel, and Theron 2006). In addition, the CSIR isolated an active ingredient with possible anti-obese properties from the Hoodia gordoni cactus whose commercial development is being pursued by Phytopharm (UK) and Pfizer (US) under license. Further research into indigenous knowledge is taking place at the Indigenous Knowledge Systems for Health (IKSH) unit at the Tygerberg Hospital in Cape Town, a research node of the Medical Research Council.
Policy Biotechnology is a key technology platform within South Africa’s national innovation system. It was given prominence in the National R&D Strategy (DST 2002). This derives from its acknowledged role in the knowledge economy more generally and its potential in addressing national priorities, especially in the area of human health. It is supported by a dedicated National Biotechnology Strategy (DST 2001) which is currently being reviewed, with a view to producing an updated version in 2008. The framework for the development of biotechnological activities laid out in the Strategy led to a number of strategic interventions. Prominent among them was
112
the formation of Biotechnology Regional Information Centres (BRICs), essentially cluster facilitation bodies, one of which was set up each in Gauteng (agribio), Western Cape, and KwaZulu-Natal (both human health), plus a national centre. The regional centres were expected to set up technology platforms and gain critical mass through agglomeration economies that would attract further funding (cf. Wolson 2007).
Institutions and regulatory framework DST implements the National Biotechnology Strategy. It funds the National Bioinformatics Network (NBN, www.nbn.ac.za) with the National Bioinformatics Institute at its centre at the University of the Western Cape, and the BRICs, namely Cape Biotech (Cape Town; www.capebiotech.co.za), Biotechnology Partnerships and Development (BioPAD, Johannesburg, www.biopad.org.za), the East Coast Biotechnology Consortium (EcoBio, operating under the name LIFElab, Durban, www.lifelab.co.za), as well as the national PlantBio (www.plantbio.co.za). Initial government funding to the BRICs amounted to R450m. The BRICs are also currently under review. In addition there are two incubators, namely eGoli Bio in Johannesburg (www.egolibio.co.za) and Acorn Technologies in Cape Town (www.acorn.org.za). The latter has recently joined forces with Cape Biotech. The remit of the Innovation Fund is to implement the R&D Strategy. The Department of Health runs the South African AIDS Vaccine Initiative (SAAVI) through the Medical Research Council (MRC), and – in conjunction with a group of healthcare companies, the Biologicals and Vaccines Institute of Southern Africa (BioVac). The Agricultural Research Council focuses on plant and animal research (www.arc.agric.za), while MINTEK (www.mintek.co.za) makes contributions in the mining field and the CSIR in a series of applications (www.csir.co.za). Bioprospecting and more generally access to and benefit sharing from biodiversity is regulated through the National Environmental Management: Biodiversity Act No.10 of 2004. It provides for compulsory government approval for bioprospecting agreements, including with overseas partners. A policy on indigenous knowledge systems yet awaits implementation.

113
2 THE DEMAND FOR SKILLS
Introduction Biotechnology is a small field in South Africa. It is therefore not surprising that estimates of the demand for skills are hard to come by. DST sponsors a website, www.biocareers.co.za, that claims to be the official job board for the industry. The website allows job seekers to post their resumes and firms to upload vacancy postings. At the time of writing, the site reported fewer than half a dozen job openings in the sector which almost certainly underreports the real demand for skills. There are no other dedicated job search engines in the country. In the absence of readily available information, estimates about the demand for skills must therefore be gleaned from generic vacancy posting sources and, as far as the general situation of the demand and supply match are concerned, directly from HR practitioners in firms.
The nature and magnitude of the demand for skills According to the Sunday Times vacancy database, the fields within which demand for biotechnologists is generated yielded annually between 800 and 2,200 vacancies between April 2004 and March 2007. This is the upper boundary of the total demand for people with biotech skills in that of course not all physicists, chemists, mathematicians and so on are necessarily biophysicists, biochemists, and so forth. In almost all subfields reported here, demand in 06/07 was higher than in 04/05. For example, for chemists, mathematicians, biologists, natural science technicians, and life science technicians, demand rose between three- and fivefold. So there is dynamic growth, albeit from a low base, that if these growth rates are sustained will over time translate into significantly larger numbers of vacancies.
Summary It is clear from the data that possible mismatches between demand and supply in biotechnology do not refer so much to sheer volumes of people but, if anything, to their exact competences or experience. Using a slightly different methodology, Walwyn (2003) arrives at the same conclusion. Only firm-level information can illustrate the extent to which this is a problem.
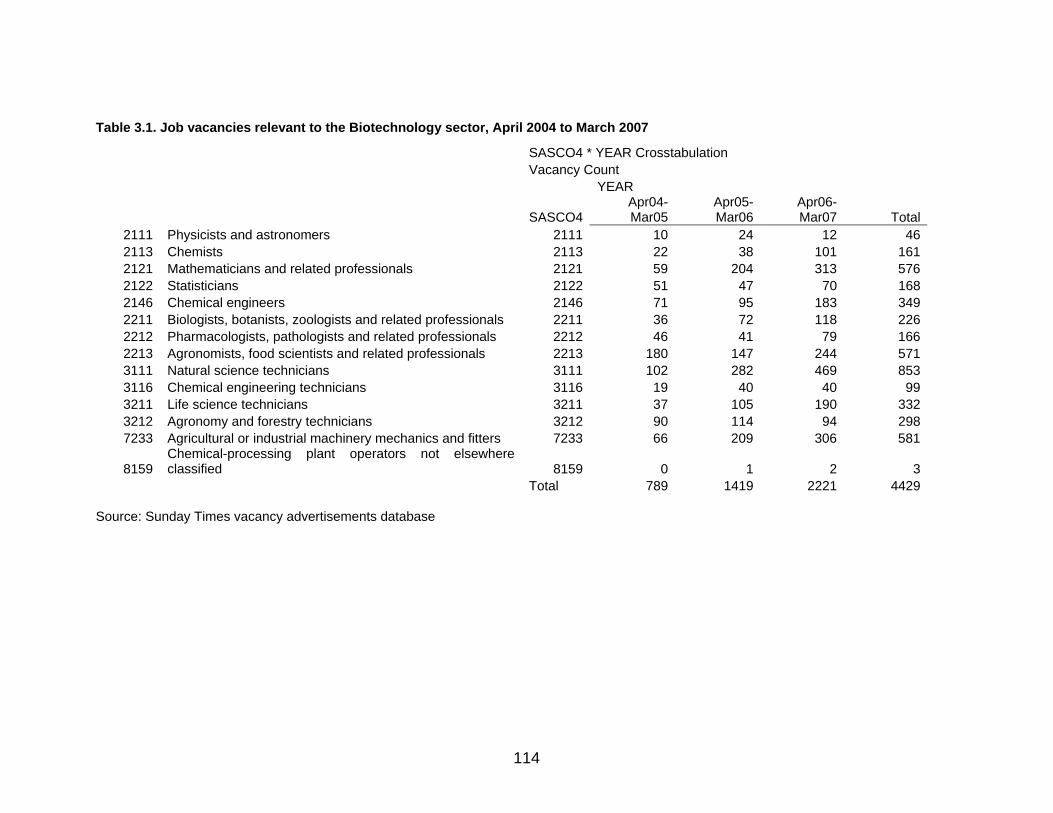
114
Table 3.1. Job vacancies relevant to the Biotechnology sector, April 2004 to March 2007
Source: Sunday Times vacancy advertisements database
SASCO4 * YEAR Crosstabulation Vacancy Count YEAR
SASCO4Apr04-Mar05
Apr05-Mar06
Apr06-Mar07 Total
2111 Physicists and astronomers 2111 10 24 12 462113 Chemists 2113 22 38 101 1612121 Mathematicians and related professionals 2121 59 204 313 5762122 Statisticians 2122 51 47 70 1682146 Chemical engineers 2146 71 95 183 3492211 Biologists, botanists, zoologists and related professionals 2211 36 72 118 2262212 Pharmacologists, pathologists and related professionals 2212 46 41 79 1662213 Agronomists, food scientists and related professionals 2213 180 147 244 5713111 Natural science technicians 3111 102 282 469 8533116 Chemical engineering technicians 3116 19 40 40 993211 Life science technicians 3211 37 105 190 3323212 Agronomy and forestry technicians 3212 90 114 94 2987233 Agricultural or industrial machinery mechanics and fitters 7233 66 209 306 581
8159 Chemical-processing plant operators not elsewhere classified 8159 0 1 2 3
Total 789 1419 2221 4429
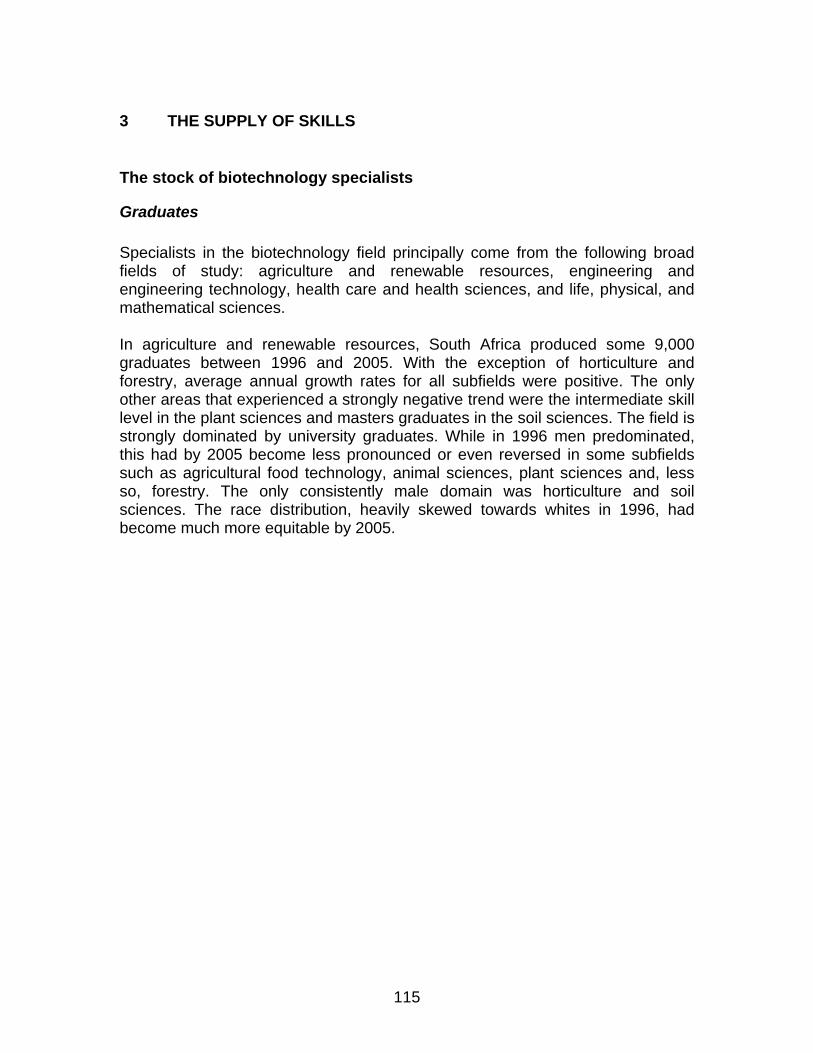
115
3 THE SUPPLY OF SKILLS
The stock of biotechnology specialists
Graduates Specialists in the biotechnology field principally come from the following broad fields of study: agriculture and renewable resources, engineering and engineering technology, health care and health sciences, and life, physical, and mathematical sciences. In agriculture and renewable resources, South Africa produced some 9,000 graduates between 1996 and 2005. With the exception of horticulture and forestry, average annual growth rates for all subfields were positive. The only other areas that experienced a strongly negative trend were the intermediate skill level in the plant sciences and masters graduates in the soil sciences. The field is strongly dominated by university graduates. While in 1996 men predominated, this had by 2005 become less pronounced or even reversed in some subfields such as agricultural food technology, animal sciences, plant sciences and, less so, forestry. The only consistently male domain was horticulture and soil sciences. The race distribution, heavily skewed towards whites in 1996, had become much more equitable by 2005.
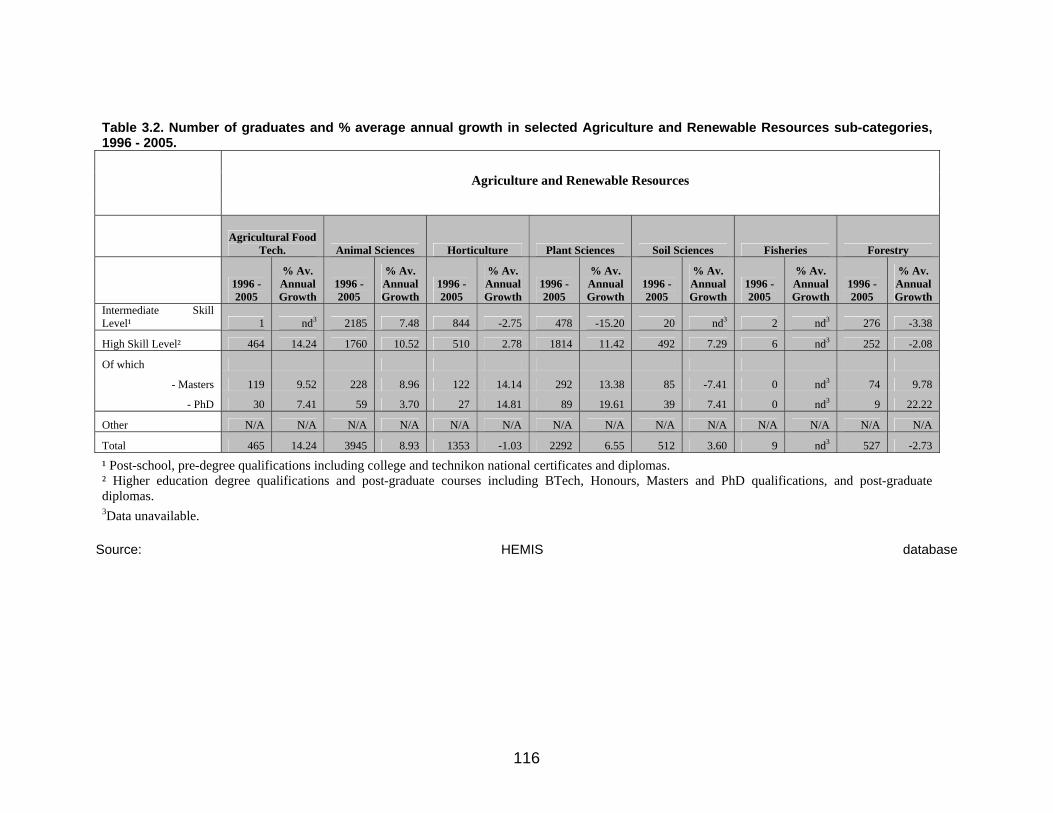
116
Table 3.2. Number of graduates and % average annual growth in selected Agriculture and Renewable Resources sub-categories, 1996 - 2005.
Agriculture and Renewable Resources
Agricultural Food
Tech. Animal Sciences Horticulture Plant Sciences Soil Sciences Fisheries Forestry
1996 - 2005
% Av. Annual Growth
1996 - 2005
% Av. Annual Growth
1996 - 2005
% Av. Annual Growth
1996 - 2005
% Av. Annual Growth
1996 - 2005
% Av. Annual Growth
1996 - 2005
% Av. Annual Growth
1996 - 2005
% Av. Annual Growth
Intermediate Skill Level¹ 1 nd3 2185 7.48 844 -2.75 478 -15.20 20 nd3 2 nd3 276 -3.38
High Skill Level² 464 14.24 1760 10.52 510 2.78 1814 11.42 492 7.29 6 nd3 252 -2.08
Of which
- Masters 119 9.52 228 8.96 122 14.14 292 13.38 85 -7.41 0 nd3 74 9.78
- PhD 30 7.41 59 3.70 27 14.81 89 19.61 39 7.41 0 nd3 9 22.22
Other N/A N/A N/A N/A N/A N/A N/A N/A N/A N/A N/A N/A N/A N/A
Total 465 14.24 3945 8.93 1353 -1.03 2292 6.55 512 3.60 9 nd3 527 -2.73
¹ Post-school, pre-degree qualifications including college and technikon national certificates and diplomas. ² Higher education degree qualifications and post-graduate courses including BTech, Honours, Masters and PhD qualifications, and post-graduate diplomas. 3Data unavailable.
Source: HEMIS database
117
Table 3.3. Number of graduates and % average annual growth in graduate output in selected categories, 1996 – 2005, by gender
% Share of Total
Study Fields Gender 1996 - 2005
% Average Annual Growth 1996 2005
Agriculture and Renewable Resources
Female 337 17.25 44.40 77.18
Agricultural Food Technology Male 128 6.77 55.60 22.82
Female 1530 12.15 30.26 44.06
Animal Sciences Male 2415 6.79 69.74 55.94
Female 499 -2.30 39.48 35.21
Horticulture Male 855 -0.28 60.52 64.79
Female 874 12.70 22.85 45.69
Plant Sciences Male 1417 2.83 77.15 54.31
Female 178 4.31 33.13 35.38
Soil Sciences Male 335 3.23 66.87 64.62
Female 5 nd3 nd3 nd3
Fisheries Male 4 nd3 nd3 nd3
Female 79 0.87 9.85 13.64
Forestry Male 448 -3.20 90.15 86.36 Source: HEMIS databse

118
Table 3.4. Number of graduates and % average annual growth in graduate output in selected categories, 1996 – 2005, by ‘race’
% Share of Total
Study Fields ‘Race’ 1996 – 2005
% Average Annual Growth 1996 2005
Ag. And Renewable Resources
African 130 21.12 4.07 35.09
Coloured 11 1.62 1.81 0.46
Asian 11 22.22 0.00 2.75
White 313 11.10 94.12 61.70
Agricultural Food Tech. Other N/A N/A N/A N/A
African 2368 14.67 32.37 67.52
Coloured 23 14.14 0.38 0.73
Asian 15 22.22 0.00 0.43
White 1539 0.97 67.25 31.32
Animal Sciences Other N/A N/A N/A N/A
African 379 13.50 8.74 39.30
Coloured 94 -12.24 11.03 3.51
Asian 17 22.22 0.00 1.43
White 863 -5.11 80.22 55.12
Horticulture Other 1 nd3 nd3 0.64
African 1030 10.47 36.68 55.62
Coloured 57 4.14 2.51 1.99
Asian 16 9.52 0.63 0.85
White 1188 2.61 60.18 41.53
Plant Sciences Other N/A N/A N/A N/A
African 229 10.96 21.82 46.35
Coloured 5 16.43 0.64 3.08
Asian 10 1.45 2.11 1.73
White 269 -1.19 75.44 48.85
Soil Sciences Other N/A N/A N/A N/A
African 5 nd3 nd3 nd3
Coloured 1 nd3 nd3 nd3
Asian 0 nd3 nd3 nd3
White 3 nd3 nd3 nd3
Fisheries Other N/A N/A N/A N/A
African 201 5.71 22.29 48.25
Coloured 21 -4.44 3.69 3.15
Asian 6 22.22 0.00 0.52
White 299 -7.26 74.02 48.08
Forestry Other N/A N/A N/A N/A 3Data unavailable.
Source: HEMIS database

119
In bioengineering and technology, chemical engineering and pharmaceutical sciences, some 11,000 students graduated between 1996 and 2005. Average annual growth rates are positive for all subfields and across skill bands. Table 3.5. Number of graduates and % average annual growth in graduate output in selected categories, 1996 – 2005.
Engineering and Engineering Tech. Health Care and Health
Sc.
Bio-Engineering and Tech. Chemical Pharmaceutical Sc.
1996 – 2005
% Av. Annual Growth 1996 – 2005
% Av. Annual Growth 1996 – 2005
% Av. Annual Growth
Intermediate Skill Level¹ 203 22.22 2137 2.2 116 nd3
High Skill Level² 33 22.22 3618 4.33 4998 5.08
Of which
- Masters 25 22.22 458 5.6 810 11.88
- PhD 6 nd3 126 2.67 83 3.92
Other 0 nd3 0 nd3 0 nd3
Total 236 22.22 5755 3.51 5114 4.26
¹ Post-school, pre-degree qualifications including college and technikon national certificates and diplomas. ² Higher education degree qualifications and post-graduate courses including Btech, Honours, Masters and PhD qualifications, and post-graduate diplomas. 3Data unavailable.
Source: HEMIS database Bioengineering and chemical engineering are dominated by men, although at least in the latter case less so than ten years ago. Woman predominate in the pharmaceutical sciences, a trend that actually strengthened over time. Table 3.6. Number of graduates and % average annual growth in graduate output in selected categories, 1996 – 2005, by gender
% Share of Total
Study Fields Gender 1996 - 2005
% Average Annual Growth 1996 2005
Engineering and Engineering Tech.
Female 62 22.22 0.00 17.65
Bio-Engineering and Tech. Male 173 22.22 0.00 82.35
Female 1 894 9.99 21.80 41.77
Chemical Male 3 861 0.26 78.20 58.23
Health Care and Health Sciences
Female 3494 6.06 62.11 73.73
Pharmaceutical Science Male 1620 0.24 37.89 26.27 Source: HEMIS database
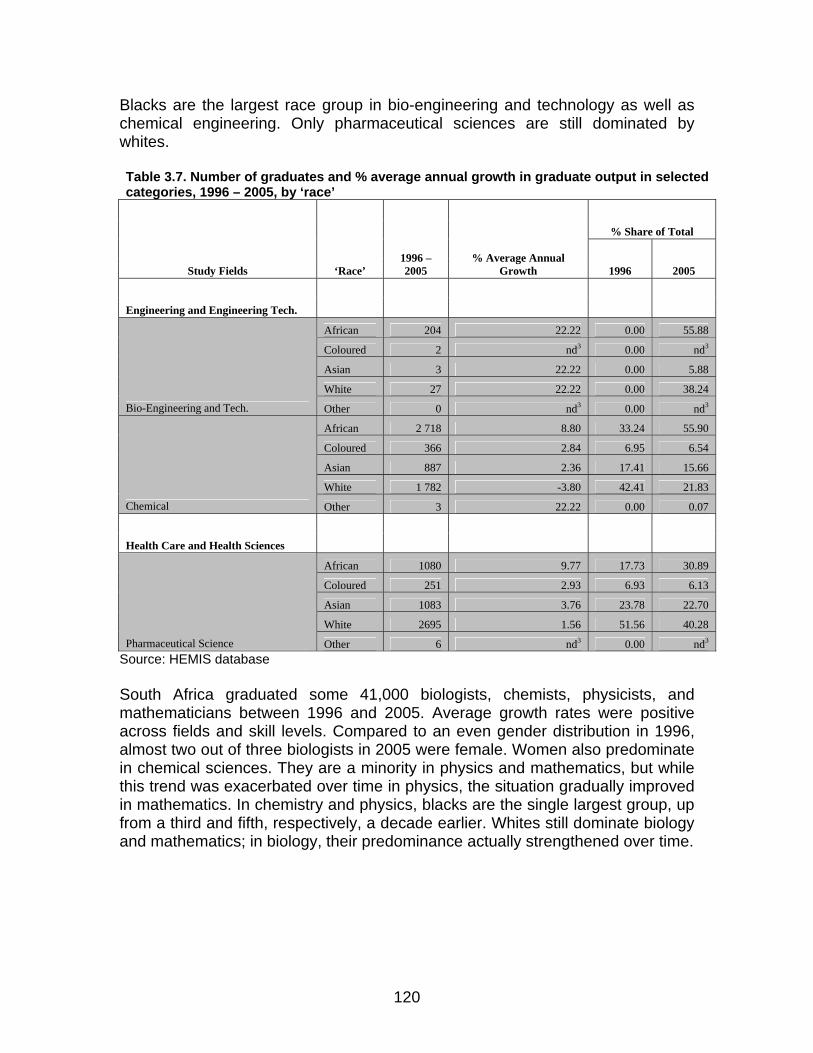
120
Blacks are the largest race group in bio-engineering and technology as well as chemical engineering. Only pharmaceutical sciences are still dominated by whites. Table 3.7. Number of graduates and % average annual growth in graduate output in selected categories, 1996 – 2005, by ‘race’
% Share of Total
Study Fields ‘Race’ 1996 – 2005
% Average Annual Growth 1996 2005
Engineering and Engineering Tech.
African 204 22.22 0.00 55.88
Coloured 2 nd3 0.00 nd3
Asian 3 22.22 0.00 5.88
White 27 22.22 0.00 38.24
Bio-Engineering and Tech. Other 0 nd3 0.00 nd3
African 2 718 8.80 33.24 55.90
Coloured 366 2.84 6.95 6.54
Asian 887 2.36 17.41 15.66
White 1 782 -3.80 42.41 21.83
Chemical Other 3 22.22 0.00 0.07
Health Care and Health Sciences
African 1080 9.77 17.73 30.89
Coloured 251 2.93 6.93 6.13
Asian 1083 3.76 23.78 22.70
White 2695 1.56 51.56 40.28
Pharmaceutical Science Other 6 nd3 0.00 nd3 Source: HEMIS database South Africa graduated some 41,000 biologists, chemists, physicists, and mathematicians between 1996 and 2005. Average growth rates were positive across fields and skill levels. Compared to an even gender distribution in 1996, almost two out of three biologists in 2005 were female. Women also predominate in chemical sciences. They are a minority in physics and mathematics, but while this trend was exacerbated over time in physics, the situation gradually improved in mathematics. In chemistry and physics, blacks are the single largest group, up from a third and fifth, respectively, a decade earlier. Whites still dominate biology and mathematics; in biology, their predominance actually strengthened over time.
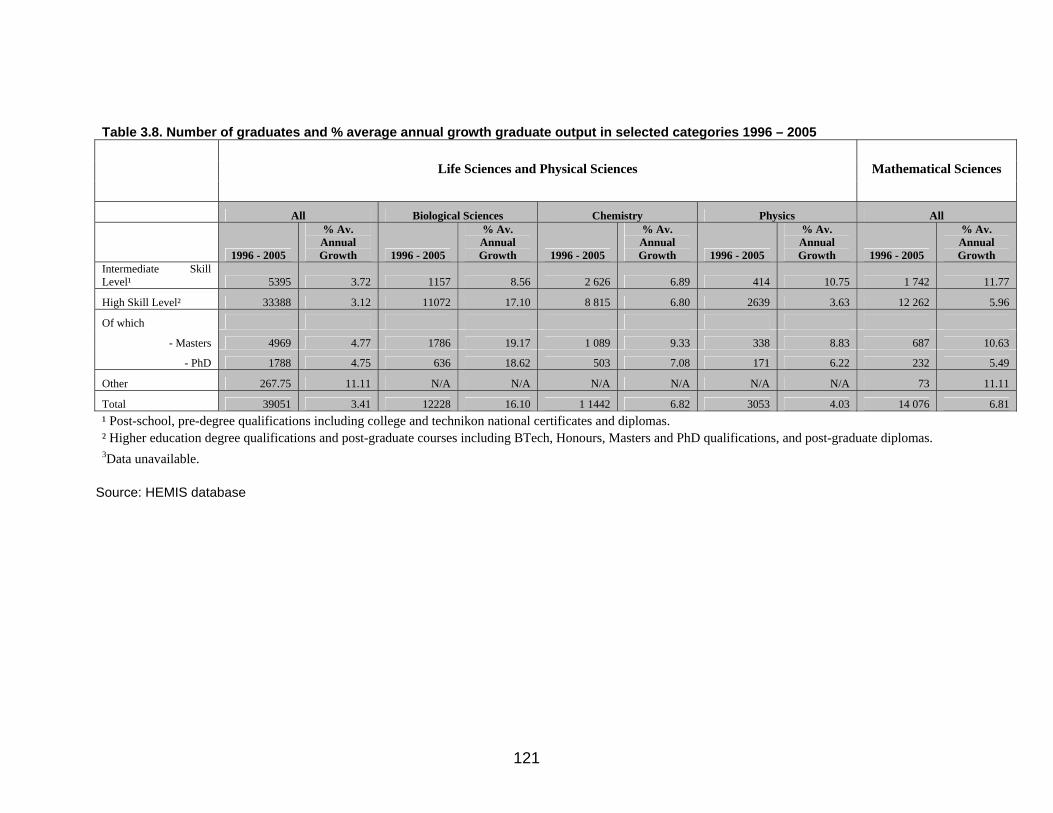
121
Table 3.8. Number of graduates and % average annual growth graduate output in selected categories 1996 – 2005
Life Sciences and Physical Sciences Mathematical Sciences
All Biological Sciences Chemistry Physics All
1996 - 2005
% Av. Annual Growth 1996 - 2005
% Av. Annual Growth 1996 - 2005
% Av. Annual Growth 1996 - 2005
% Av. Annual Growth 1996 - 2005
% Av. Annual Growth
Intermediate Skill Level¹ 5395 3.72 1157 8.56 2 626 6.89 414 10.75 1 742 11.77
High Skill Level² 33388 3.12 11072 17.10 8 815 6.80 2639 3.63 12 262 5.96
Of which - Masters 4969 4.77 1786 19.17 1 089 9.33 338 8.83 687 10.63
- PhD 1788 4.75 636 18.62 503 7.08 171 6.22 232 5.49
Other 267.75 11.11 N/A N/A N/A N/A N/A N/A 73 11.11
Total 39051 3.41 12228 16.10 1 1442 6.82 3053 4.03 14 076 6.81 ¹ Post-school, pre-degree qualifications including college and technikon national certificates and diplomas. ² Higher education degree qualifications and post-graduate courses including BTech, Honours, Masters and PhD qualifications, and post-graduate diplomas. 3Data unavailable.
Source: HEMIS database

122
Table 3.9. Number of graduates and % average annual growth in graduate output in selected categories, 1996 – 2005, by gender
% Share of Total
Study Fields Gender 1996 – 2005
% Average Annual Growth 1996 2005
Life Sciences and Physical Sciences
Female 21094 4.86 48.73 55.81
All Male 17957 1.78 51.27 44.19
Female 7546 17.05 51.26 62.22
Biological Sciences Male 4682 14.63 48.74 37.78
Female 6 395 8.80 47.02 57.59
Chemistry Male 5 047 4.51 52.98 42.41
Female 1 064 2.97 31.57 28.63
Physics Male 1 989 4.48 68.43 71.37
Mathematical Sciences
Female 5 840 9.41 33.22 43.55
Mathematical Sciences (All) Male 8 237 5.08 66.78 56.45 Source: HEMIS database

123
Table 3.10. Number of graduates and % average annual growth in graduate output in selected categories, 1996 – 2005, by ‘race’
% Share of Total
Study Fields ‘Race’ 1996 – 2005
% Average Annual Growth 1996 2005
Life Sciences and Physical Sciences
African 15317 9.44 25.37 46.15
Coloured 2448 0.13 6.92 5.14
Asian 3221 2.84 8.96 8.51
White 18035 -0.79 58.74 40.16
All Other 23 nd3 nd3 nd3
African 4116 14.92 42.63 34.65
Coloured 694 10.21 9.48 4.09
Asian 1172 17.28 8.91 11.37
White 6243 17.29 38.97 49.84
Biological Sciences Other 4 nd3 nd3 0.00
African 5 902 12.26 32.08 58.84
Coloured 738 8.04 5.73 6.48
Asian 943 4.06 8.07 6.19
White 3 859 0.08 54.13 28.49
Chemistry Other 1 nd3 nd3 nd3
African 1 378 12.86 19.53 50.72
Coloured 214 0.92 7.03 5.29
Asian 150 6.29 6.21 7.71
White 1 293 -2.76 67.23 36.29
Physics Other 17 nd3 0.00 nd3
Mathematical Sciences
African 5 592 12.90 21.25 42.51
Coloured 555 6.71 4.22 4.18
Asian 1 136 6.62 7.78 7.63
White 6 728 2.77 66.75 45.54
Mathematical Sciences (All) Other 65 11.11 nd3 0.14 3Data unavailable.
Source: HEMIS database
The pool of emerging biotechnology specialists
Enrolments Between 2000 and 2005, South African universities enrolled some 36,000 students in subfields of agriculture and renewable resources relevant for

124
biotechnology. Except for plant and soil sciences and forestry, enrolment rates increased year on year. Plant sciences appears to have a particular problem in replenishing intermediate skills, while soil sciences is growing short of PhD enrolments. Over the same period, enrolments in bio-relevant engineering and health care amounted to some 49,000 students, with positive growth for all fields and across skill levels. Finally, in the life, physical, and mathematical sciences, enrolments reached 191,000 students. It is clear from some of these fields, notably mathematics, that people who do study it are in for the long haul – while growth rates for intermediate skills are strongly negative, they are positive for the higher skill levels, especially masters. Except in agricultural food technology and pharmaceutical sciences (where women strengthened their predominance over time), soil sciences, bioengineering and technology, the gender distribution became more balanced. In terms of race, only in soil sciences did whites not reduce their share in the total contingent. In most fields, blacks have become the largest group.

125
Table 3.11. Number of enrolments and % average annual growth in enrolment in selected Agriculture and Renewable Resources sub-categories, 2000 – 2005
Agriculture and Renewable Recources
Agricultural Food
Tech. Animal Sciences Horticulture Plant Sciences Soil Sciences Fisheries Forestry
2000 – 2005
% Av. Annual Growth
2000 – 2005
% Av. Annual Growth
2000 – 2005
% Av. Annual Growth
2000 – 2005
% Av. Annual Growth
2000 – 2005
% Av. Annual Growth
2000 – 2005
% Av. Annual Growth
2000 – 2005
% Av. Annual Growth
Intermediate Skill Level¹ nd3 nd3 8999 14.67 4555 17.39 1848 -19.01 155 nd3 4 nd3 868 -3.02
High Skill Level² 1264 6.82 7681 -3.00 1818 -3.64 5975 5.05 2260 4.80 16 nd3 521 -0.31
Of which
- Masters 296 1.36 1093 6.59 400 2.52 1073 3.95 407 2.25 nd3 nd3 216 2.21
- PhD 145 3.64 323 4.36 171 14.34 543 12.86 190 -4.59 nd3 nd3 71 16.00
Other nd3 nd3 2 nd3 2 nd3 1 nd3 2 nd3 nd3 nd3 nd3 nd3
Total 1264 6.82 16682 6.36 6374 11.68 7824 -0.05 2417 -2.32 19 nd3 1389 -2.17
¹ Post-school, pre-degree qualifications including college and technikon national certificates and diplomas. ² Higher education degree qualifications and post-graduate courses including Btech, Honours, Masters and PhD qualifications, and post-graduate diplomas. 3Data unavailable.
Source: HEMIS database
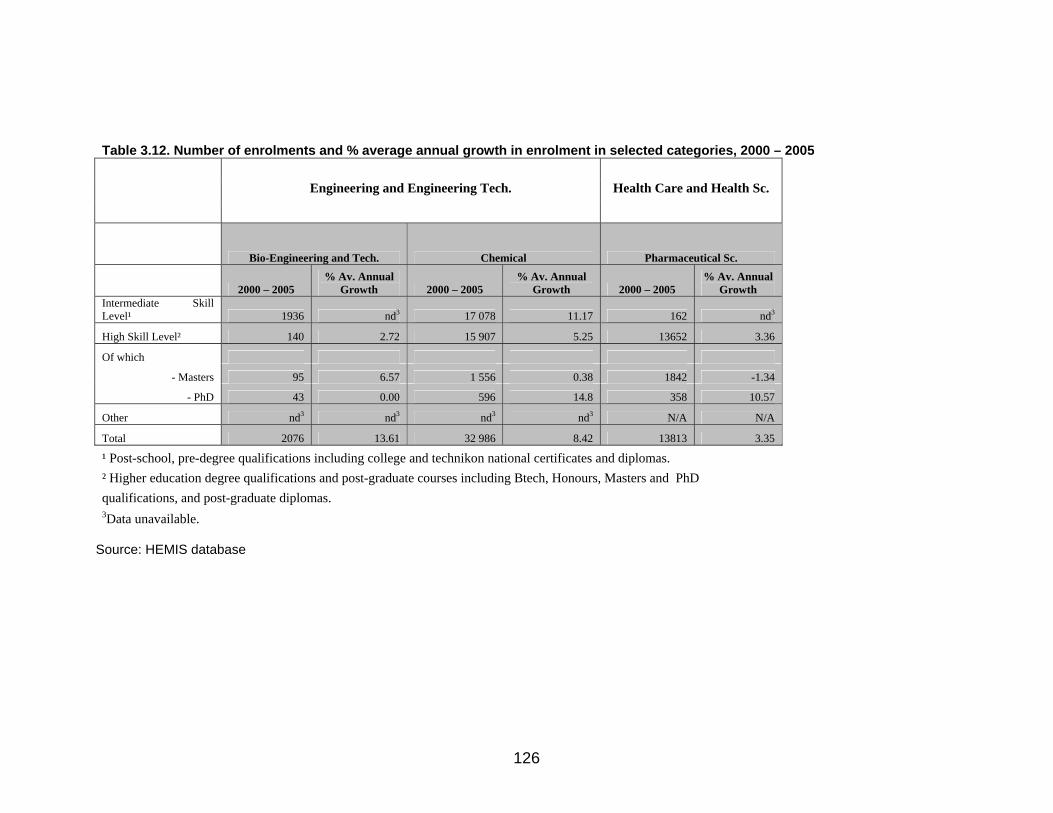
126
Table 3.12. Number of enrolments and % average annual growth in enrolment in selected categories, 2000 – 2005
Engineering and Engineering Tech. Health Care and Health Sc.
Bio-Engineering and Tech. Chemical Pharmaceutical Sc.
2000 – 2005 % Av. Annual
Growth 2000 – 2005 % Av. Annual
Growth 2000 – 2005 % Av. Annual
Growth Intermediate Skill Level¹ 1936 nd3 17 078 11.17 162 nd3
High Skill Level² 140 2.72 15 907 5.25 13652 3.36
Of which
- Masters 95 6.57 1 556 0.38 1842 -1.34
- PhD 43 0.00 596 14.8 358 10.57
Other nd3 nd3 nd3 nd3 N/A N/A
Total 2076 13.61 32 986 8.42 13813 3.35
¹ Post-school, pre-degree qualifications including college and technikon national certificates and diplomas. ² Higher education degree qualifications and post-graduate courses including Btech, Honours, Masters and PhD qualifications, and post-graduate diplomas. 3Data unavailable.
Source: HEMIS database

127
Table 3.13. Number of enrolments and % average annual growth in enrolment in selected categories 2000 – 2005
Life Sciences and Physical Sciences Mathematical Sciences
All Biological Sciences Chemistry Physics All
2000 – 2005
% Av. Annual Growth 2000 – 2005
% Av. Annual Growth 2000 – 2005
% Av. Annual Growth 2000 – 2005
% Av. Annual Growth 2000 – 2005
% Av. Annual Growth
Intermediate Skill Level¹ 22896 6.79 5337 8.77 13 199 5.30 1 928 -0.84 10 046 -10.54
High Skill Level² 112917 6.55 42367 7.70 38 835 5.48 15 502 5.44 63 685 2.12
Of which - Masters 14720 4.59 6420 2.53 3 251 3.13 993 6.62 2 192 9.50
- PhD 8284 2.14 3834 4.20 2 516 2.36 734 -1.13 923 1.40
Other 224 nd3 23.83 nd3 71 nd3 98 nd3 319 nd3
Total 136037 6.76 47728 7.88 52 105 5.57 17 528 4.77 74 049 0.69 ¹ Post-school, pre-degree qualifications including college and technikon national certificates and diplomas. ² Higher education degree qualifications and post-graduate courses including Btech, Honours, Masters and PhD qualifications, and post-graduate diplomas. 3Data unavailable.
Source: HEMIS database

128
Table 3.14. Number of enrolments and % average annual growth in enrolment in selected categories, 2000 – 2005, by gender
% Share of Total
Study Fields Gender 2000 – 2005
% Average Annual Growth 2000 2005
Agriculture and Renewable Resources
Female 931 7.89 71.70 75.77
Male 332 3.77 28.30 24.23
Agricultural Food Technology Unknown N/A N/A N/A N/A
Female 7065 8.38 39.36 43.70
Male 9617 4.91 60.64 56.30
Animal Sciences Unknown N/A N/A N/A N/A
Female 2505 11.79 41.19 41.44
Male 3870 11.60 58.81 58.56
Horticulture Unknown N/A N/A N/A N/A
Female 2975 2.44 37.28 42.23
Male 4849 -1.70 62.72 57.77
Plant Sciences Unknown N/A N/A N/A N/A
Female 778 -4.20 34.96 31.81
Male 1639 -1.37 65.04 68.19
Soil Sciences Unknown N/A N/A N/A N/A
Female 10 nd3 nd3 nd3
Male 9 nd3 nd3 nd3
Fisheries Unknown N/A N/A N/A N/A
Female 197 12.58 8.21 17.54
Male 1191 -4.30 91.79 82.46
Forestry Unknown N/A N/A N/A N/A
Engineering and Engineering Tech.
Female 550 11.96 35.42 32.31
Male 1526 14.43 64.58 67.69
Bio-Engineering and Tech. Unknown nd3 nd3 nd3 nd3
Female 12 833 9.5 36.03 38.14
Male 20 152 7.77 63.97 61.85
Chemical Unknown 1 nd3 nd3 0.01 3Data unavailable.
Source: HEMIS database
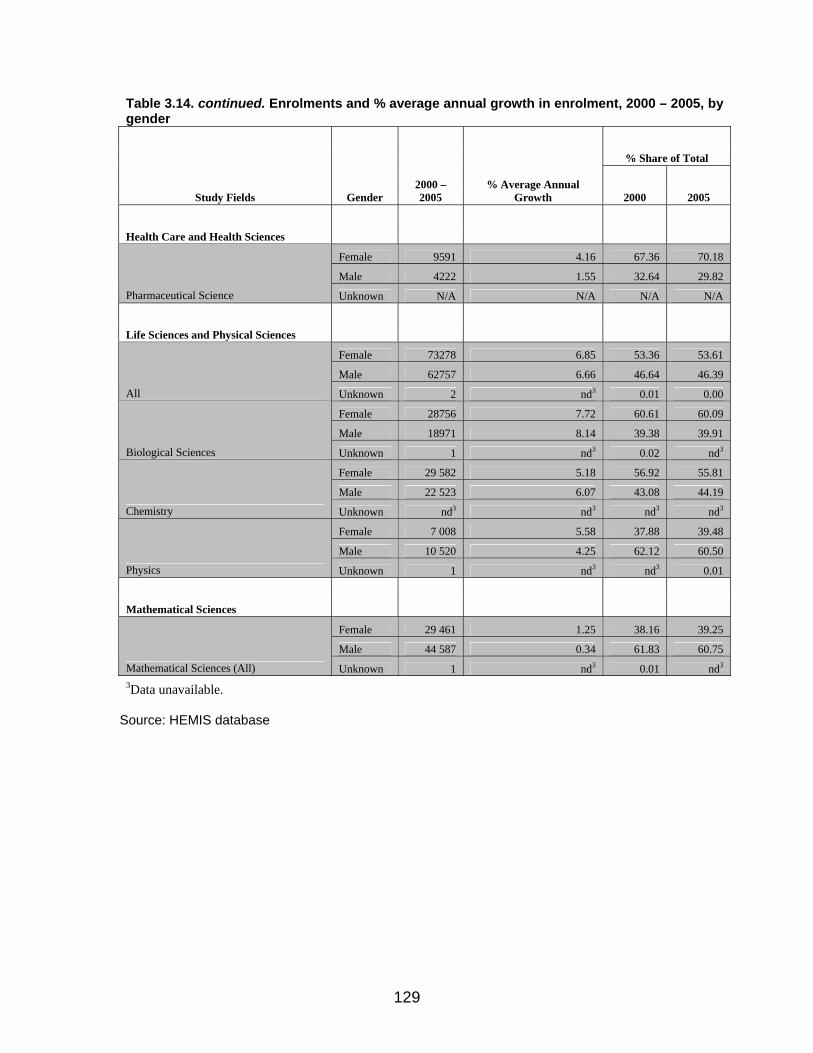
129
Table 3.14. continued. Enrolments and % average annual growth in enrolment, 2000 – 2005, by gender
% Share of Total
Study Fields Gender 2000 – 2005
% Average Annual Growth 2000 2005
Health Care and Health Sciences
Female 9591 4.16 67.36 70.18
Male 4222 1.55 32.64 29.82
Pharmaceutical Science Unknown N/A N/A N/A N/A
Life Sciences and Physical Sciences
Female 73278 6.85 53.36 53.61
Male 62757 6.66 46.64 46.39
All Unknown 2 nd3 0.01 0.00
Female 28756 7.72 60.61 60.09
Male 18971 8.14 39.38 39.91
Biological Sciences Unknown 1 nd3 0.02 nd3
Female 29 582 5.18 56.92 55.81
Male 22 523 6.07 43.08 44.19
Chemistry Unknown nd3 nd3 nd3 nd3
Female 7 008 5.58 37.88 39.48
Male 10 520 4.25 62.12 60.50
Physics Unknown 1 nd3 nd3 0.01
Mathematical Sciences
Female 29 461 1.25 38.16 39.25
Male 44 587 0.34 61.83 60.75
Mathematical Sciences (All) Unknown 1 nd3 0.01 nd3 3Data unavailable.
Source: HEMIS database

130
Table 3.15. Number of enrolments and % average annual growth in enrolment in selected categories, 2000 – 2005, by ‘race’
% Share of Total
Study Fields ‘Race’ 2000 – 2005
% Average Annual Growth 2000 2005
Ag. And Renewable Resources
African 550 8.12 41.84 44.75
Coloured 28 13.11 1.89 2.64
Asian 25 2.60 1.70 1.37
White 661 5.59 54.58 51.24
Agricultural Food Tech. Other nd3 nd3 nd3 nd3
African 11231 8.35 64.39 71.38
Coloured 233 12.46 0.80 1.10
Asian 72 1.06 0.51 0.39
White 5144 1.72 34.30 27.13
Animal Sciences Other 3 nd3 nd3 nd3
African 3281 13.32 48.16 52.75
Coloured 285 12.07 4.59 4.69
Asian 139 7.02 2.20 1.72
White 2659 9.84 44.91 40.68
Horticulture Other 10 13.33 0.15 0.16
African 4661 2.30 54.77 61.61
Coloured 194 -6.29 3.24 2.36
Asian 43 -0.78 0.77 0.74
White 2923 -3.21 41.23 35.20
Plant Sciences Other 3 nd3 nd3 0.09
African 1214 -3.74 52.02 48.42
Coloured 42 13.02 1.57 3.46
Asian 20 -8.19 0.92 0.68
White 1142 -1.48 45.49 47.44
Soil Sciences Other nd3 nd3 nd3 nd3
African 7 nd3 nd3 nd3
Coloured 2 nd3 nd3 nd3
Asian nd3 nd3 nd3 nd3
White 10 nd3 nd3 nd3
Fisheries Other nd3 nd3 nd3 nd3
African 767 1.20 46.91 55.52
Coloured 44 10.00 2.69 4.99
Asian 18 -15.59 1.27 0.62
White 560 -6.79 49.14 38.87
Forestry Other nd3 nd3 nd3 nd3 3Data unavailable.
Source: HEMIS database

131
Table 3.16. Number of enrolments and % average annual growth in enrolment in selected categories, 2000 – 2005, by ‘race’
% Share of Total
Study Fields ‘Race’ 2000 – 2005
% Average Annual Growth 2000 2005
Engineering and Engineering Tech.
African 1941 33.66 8.33 47.69
Coloured 14 5.71 6.25 4.10
Asian 5 0.00 4.17 2.05
White 114 2.41 81.25 45.13
Bio-Engineering and Tech. Other 2 nd3 nd3 1.03
African 22 623 10.55 62.16 69.59
Coloured 1 506 10.79 4.25 4.82
Asian 4 187 2.19 15.67 11.40
White 4 657 3.72 17.92 14.09
Chemical
Other 12 36.71 0.00 0.09
Health Care and Health Sciences
African 4288 10.66 22.06 32.20
Coloured 766 -0.32 5.84 4.86
Asian 3074 6.81 20.70 24.68
White 5670 -2.53 51.20 38.15
Pharmaceutical Science Other 16 -8.00 0.20 0.11 3Data unavailable.
Source: HEMIS database

132
Table 3.16 continued. Enrolments and % average annual growth in enrolment 2000 – 2005, by ‘race’
% Share of Total
Study Fields ‘Race’ 2000 – 2005
% Average Annual Growth 2000 2005
Life Sciences and Physical Sciences
African 71345 9.08 49.19 55.49
Coloured 8344 6.00 6.36 6.11
Asian 11223 8.78 8.17 9.07
White 44984 2.48 36.23 29.16
All Other 140 26.58 0.05 0.16
African 19867 9.78 39.27 43.39
Coloured 3139 4.69 7.19 6.10
Asian 4782 13.26 8.59 11.47
White 19884 5.07 44.87 38.83
Biological Sciences Other 56 23.84 0.08 0.21
African 32 227 6.31 59.85 62.16
Coloured 3 329 8.66 6.29 7.38
Asian 4 013 8.53 8.00 9.32
White 12 501 1.48 25.83 21.02
Chemistry Other 35 29.69 0.02 0.12
African 9 663 7.18 53.13 60.11
Coloured 1 179 0.62 6.79 5.52
Asian 1 050 5.41 7.00 7.24
White 5 609 0.77 32.99 26.98
Physics Other 28 16.00 0.08 0.15
Mathematical Sciences
African 37 001 1.71 47.82 50.34
Coloured 3 357 5.25 4.08 5.13
Asian 5 662 -0.96 8.08 7.44
White 27 393 -0.38 38.97 36.94
Mathematical Sciences (All) Other 636 -29.59 1.05 0.15 3Data unavailable.
Source: HEMIS database
Skills developments at the top end It is clear from the data that some subfields are better than others at enrolling and graduating specialists at the very high end. On the whole, however, growth rates of both enrolment and graduation are rather low. Notable exceptions include plant sciences, chemical engineering and technology, and biology. In the current decade, PhD output in maths has also gone up noticeably, albeit from a very low base.

133
Figure 3.1. Agriculture and Renewable Resources PhD Output 1996-2005
Agr. and Renewable Resources
0
5
10
15
20
25
30
35
1996 1997 1998 1999 2000 2001 2002 2003 2004 2005
Year
Num
ber o
f PhD
Gra
duat
es
Agr. Food Tech
Animal Sc
Horticulture
Plant Sc
Soil Sc
Forestry
Source: HEMIS database Figure 3.2. Agriculture and Renewable Resources PhD Enrolments 2000-2005
Agriculture and Renewable Resources
0
20
40
60
80
100
120
2000 2001 2002 2003 2004 2005
Num
ber o
f PhD
Enr
olm
ents
Agr. Food Tech
Animal Sc
Horticulture
Plant Sc
Soil Sc
Forestry
Source: HEMIS database

134
Figure 3.3. Engineering and Engineering Tech. PhD Output 1996-2005
Engineering and Eng. Tech.
02468
1012141618
1996
1997
1998
1999
2000
2001
2002
2003
2004
2005
Year
Num
ber o
f PhD
Gra
duat
es
Bio-eng and Tech
Chemical Eng and Tech
Source: HEMIS database Figure 3.4. Engineering and Engineering Tech. PhD Enrolments 2000-2005
Engineering and Eng. Tech.
0
20
40
60
80
100
120
140
160
2000 2001 2002 2003 2004 2005
Num
ber o
f PhD
Enr
olm
ents
Bio-eng and Tech
Chemical Eng and Tech
Source: HEMIS database

135
Figure 3.5. Pharmaceutical Sciences and Mathematical Sciences PhD Output 1996-2005
Pharmaceutical Sc. and Maths
0
5
10
15
20
25
30
35
1996 1997 1998 1999 2000 2001 2002 2003 2004 2005
Year
Num
ber o
f PhD
Gra
duat
es
Pharmaceutical Sc
Maths
Source: HEMIS database Figure 3.6. Pharmaceutical Sciences and Mathematical Sciences PhD Enrolments 2000-2005
Pharmaceutical Science and Maths
020406080
100120140160180200
2000 2001 2002 2003 2004 2005
Num
ber o
f PhD
Enr
olm
ents
Pharmaceutical Sc.
Maths
Source: HEMIS database
Summary: Is supply sufficient given the level of demand? There is no evidence that the available volume of human capital is a constraint on the biotechnology sector. The sector is simply too small to exhaust the pool of available graduates, be they those already on the labour market or those still in training. But it is possible to differentiate this a little across the broad fields examined here. In agricultural and life sciences, a rise in vacancies is

136
accompanied by a rise in both graduation and enrolment rates. The same is broadly true for chemical engineering. By contrast, in pharmaceutical sciences a rise in vacancies is accompanied by a substantial drop in enrolments and graduations. This does not as yet suggest mismatches because this information cannot possibly show whether there are enough jobs for all graduates. Hence, this may simply be a correction of an oversupply. Alternatively, if these trends continue, the pharmaceutical sector may be heading for supply constraints. Similar observations can be made for mathematical sciences. Figure 3.7. Skills supply and demand in Agriculture and Life Sciences, 2000-2006
Agriculture and Life Sciences
0
5000
10000
15000
20000
25000
30000
35000
40000
2000 2001 2002 2003 2004 2005 2006
Num
ber o
f Stu
dent
s/Va
canc
ies
Agr, & Life Sc. Enrolments
Agr.& Life Sc. Graduates
Agr. & Life Sc. Vacancies
Source: HEMIS database, Sunday Times vacancy advertisements database Figure 3.8. Skills supply and demand in Chemical Engineering and Engineering Tech., 2000-2006
Chemical Engineering and Eng. Tech.
0
1000
2000
3000
4000
5000
6000
7000
2000 2001 2002 2003 2004 2005 2006
Num
ber o
f Stu
dent
s/Va
canc
ies
Chem. Eng. & Eng. Tech.EnrolmentsChem. Eng. & Eng. Tech.GraduatesChem. Eng. & Eng. Tech.Vacancies
Source: HEMIS database, Sunday Times vacancy advertisements database

137
Figure 3.9. Skills supply and demand in Pharmaceutical Sciences, 2000-2006
Pharmaceutical Sciences
0
500
1000
1500
2000
2500
3000
2000 2001 2002 2003 2004 2005 2006
Num
ber o
f Stu
dent
s/Va
canc
ies
Pharmaceutical Sc.EnrolmentsPharmaceutical Sc.GraduatesPharmaceutical Sc.Vacancies
Source: HEMIS database, Sunday Times vacancy advertisements database
138
4 CASE STUDIES
Introduction Although biotechnology has been around in South Africa for a while, it is fair to say that especially in third-generation activities the sector is in its infancy. At the same time there is an expectation to grow the existing activities aggressively so as to create a globally competitive biotechnology sector in South Africa that is attuned with the country’s development objectives, especially in the life sciences. The two firms reviewed in what follows explicate these challenges. They are both active in third-generation biotechnology, albeit at different stages, and one of them is a start-up that virtually came from nowhere. The other has a history in South Africa’s health system and thus provides an illuminating contrast.
Biovac
History In the past, South Africa had vaccine manufacturing capacity through the State Vaccine Institute (SVI) in Cape Town and the South African Vaccine Producers (SAVP) in Johannesburg. Their vaccine platforms proved outdated and the two manufacturers ceased production in 2001. At this point the country had to import all its human vaccines. In order to retain residual vaccine manufacturing capacity, especially for Expanded Programmes for Immunisation (EPI), the government set up a public private partnership in 2003, involving among others a vaccine import and distribution company, international vaccine experts, and the Department of Health. The consortium was called Biovac. Its vision included not just the manufacturing but ultimately also R&D on new vaccines to be developed indigenously, especially for tropical diseases, including for export. This required meeting standards of the South African Medical Control Council, the World Health Organization, and the US Food&Drug Administration. To this end, Biovac aimed at executing technology and processes with a high degree of assurance of delivering a good quality product to international standards. It did so in a phased implementation programme where activities were initially limited to packaging and labeling, then manufacture, and finally in the future R&D and antigen manufacture.
Current activities Biovac has a staff complement of 62 people, 50% of whom work in core functions of the company, i.e. scientists engaged in R&D. In addition, there are quality
139
assurance people who also have a scientific background. Then there are production people whose background is in pharmaceutics. The other 50% are made up of support services such as marketing, sales, lab assistants. Finally, there is a small engineering department, with process, maintenance, and chemical engineers. New staff for R&D are primarily recruited from the universities and have masters or PhD degrees in microbiology or biochemistry. They would typically have a science background and some lab experience. These new staff need to be upskilled in order to translate their small-batch experience into the bulk requirements of Biovac’s manufacturing volume. Biovac of course complies with WHO good manufacturing practices that new graduates are normally not familiar with. In addition, Biovac recruits from other manufacturers of pharmaceuticals. However, as the only vaccine manufacturer in Southern Africa, Biovac is in a unique position in that vaccine manufacturing is a very specific competence. This means that even people with industry experience need to be upskilled because they will not have been exposed to vaccine manufacturing per se. Biovac has a strong partnership with Cuba, Bionet (Bangkok) and Biofarma (Indonesia) which is where skills transfer comes from. Biovac sends staff to Cuba and Indonesia for training and Cuban and Indonesian experts visit the manufacturing plant in PE on a regular basis. In addition, there is regular email and phone contact as the need arises. There are also staff exchange programmes with companies in Europe. This works in the context of licensing arrangements whereby Biovac manufactures and distributes – and, thus, gets local authorisation for – a vaccine developed elsewhere on which it then pays a royalty fee. Staff in the quality assurance department have similar degree profiles as the R&D contingent – albeit not necessarily to PhD level – but typically have industry experience from pharmaceutical companies such as Pfizer and others. For both R&D and quality assurance there are skills shortages in Cape Town. Qualified pharmacists for the production department are easy to find but they are not normally GMP (good manufacturing practices) compliant so that they need some upskilling as well. As far as engineers are concerned Biovac did not struggle in the past to find qualified people. But it is proving more difficult to renew its ranks, mainly because the majority of engineers seem not to be aware of the admittedly small biotech industry. Hence they opt for careers with big corporates such as Eskom, Telkom, or Sasol. The one critical engineering skill that is not at all available in South Africa is process engineers with vaccine manufacturing experience. They are therefore recruited from Europe. Biovac’s one African competitor in Africa,

140
Vacsera in Egypt, will likely do the same. In fact, Biovac’s process engineering position is currently vacant; its European partners are helping to identify a suitable candidate in Europe. Importantly, this is a (South) African problem and thus does not reflect a worldwide shortage of this particular skill. It is unlikely that Biovac can do much to address this problem at a national or regional level. This is because it is a relatively small company that hires maybe one or two new engineers per year. In the absence of other vaccine manufacturers, there is simply not enough demand for these particular skills. The idea is therefore to bring a European in for some three to five years and use him or her for skill transfer to the current contingent of engineering staff. The vaccine manufacturing expert – a skill that Biovac currently does not possess – is a true bottleneck on any potential expansion plans. For example, if biotechnological activity in the country were to triple, Biovac could live up to the challenge if it had a manufacturing expert who could then pass on knowledge to new graduates, provided sufficient outlays for new capital investment were available. The shortage of appropriate R&D skills is due to a number of reasons. One is that in the past there has been little regard for long-range succession planning by Biovac’s predecessor, the state vaccine institute. Another is that vaccine research and manufacturing is currently a marginal activity in the life sciences so that very few people – and this is especially true for new graduates – have any hands-on experience in this particular field. Solutions to this problem would seem to exist in two ways. One is that the universities expand their research and training programmes, and the other that Biovac intensifies its relationship with the universities. In this respect, Biovac is already engaged in graduate development through sponsoring one or two students per year that spend some time working in university labs before they then join the firm to complete their vaccine manufacturing training. The constraint on this kind of activity is that Biovac at the moment is not in expansion mode and therefore cannot take on more people. Lab assistants are matriculants who are trained in-house. In marketing, it is difficult to find sales personnel who have a background in pharmaceuticals which is a requirement for the job. In the past Biovac used to recruit primarily in the Western Cape – due to the fact that this is a small industry in which many people know each other so that relationship hiring was the norm – but for equity and other considerations it now casts its net nationally. The two biggest worries from an HR perspective are staff retention and succession planning. Staff retention is an issue because the small size of the industry and a reluctance to train in-house means that there is a premium on experienced people. This leads to poaching. Succession planning is currently not so important but will become critical one capacity expands so that enough people

141
can take responsibility for larger volumes and the managerial and production challenges that go with that. In sum, Biovac is not up against challenges that it would not be able to solve by itself. It is not bedevilled by some major malfunctioning of the labour market. What is true, however, that it is not being much helped by the Seta it belongs to, namely the CHIETA. This is because CHIETA’s attention is focused primarily on its big clients, such as Sasol, Shell, BP, and so on. There is very little attention to biotechnology in the Seta. At the very least, this suggests some incongruence between the importance bestowed upon biotechnology in the national R&D strategy, and support being made available to it in terms of the government’s main skill development vehicle.
The Centre for Proteomic & Genomic Research (CPGR) The Centre for Proteomic & Genomic Research (CPGR), is a not-for-profit Section 21 company that was set up in 2006 through a R20m grant provided by the Department of Science & Technology, by way of the Cape Biotech Trust and PlantBio. It is located on the premises of the IIDMM (Institute of Infectious Diseases and Molecular Medicine, UCT) in Cape Town from where it offers its services to the biotechnology community in the Western Cape, the rest of South Africa, and elsewhere. The main purpose of CPGR is to build a technology platform that puts advanced, cutting-edge biotechnological equipment and associated expertise at the disposal of South Africa’s nascent biotechnology sector. The CPGR was founded with a vision of establishing a modern, world-class, high throughput biology research facility that serves the needs of the life science and biotech communities in South Africa by providing state-of-the-art analytical services, technical expertise, project support and collaborative research capabilities in the genomics and proteomics sectors. Its current staff complement consists of seven people, all with at least a master’s degree in molecular biology or related fields. The majority of staff has been recruited in South Africa based on their respective critical expertise relevant to the individual technology platforms the CPGR is offering. The strategic rationale behind the CPGR is to make resources (equipment & expertise) available to the biotechnological research community that does not exist elsewhere in the country but that is at the same time critical to the international success of the sector. Since no academic research group or private sector player has the kind of resources to afford this kind of equipment single-handedly today, the CPGR therefore provides a kind of public good. Along with the project support and services the CPGR renders, it provides technology and skill transfer on its equipment, and advises on appropriate research methodologies and scientific strategies.

142
To date, the main users of the CPGR are academic research groups. This is because many firms in the biotech sector are so few and far between and under such cash-flow pressure that at least for the time being they largely cannot afford to do any proprietary research. In other words, research facilitated through the CPGR proper takes place almost exclusively in academic environments. This is a problem for the CPGR insofar academic users have limited resources to pay for the opportunities the CPGR offers, at least by international standards. Hence the CPGR substitutes its income through joint international grant applications – submitted to the Gates Foundation and other such funders – that complement its total project portfolio and thus allow it to work towards becoming self-sustainable while at the same time offering affordable services to the local community. Occasionally it is possible to leverage initial local research results into national or international project proposals so that local clients have an incentive to become engaged in larger, commercially oriented projects. The initial funding the CPGR received for its capital equipment is a non-refundable grant. However, the CPGR is expected to sustain itself after a short period of time and is in fact close to reaching this goal. Business is going well and the current staff complement is expected to double in the course of 2008. In addition, it plans to launch its first spin-off company in the foreseeable future. The CPGR consists of mixed staff from Europe and South Africa. The presence of Europeans does not necessarily indicate an absence of the particular skill they represent in the country, except perhaps at the level of executive director (both directors bring direct experience in running biotech companies in Europe as well as widely ramified international networks in the biotech sector, the latter being key to building successful business relationships quickly) where a certain culture of entrepreneurialism and risk-taking was imported from Vienna and Cambridge, respectively, that is to date relatively scarce in South Africa. The CPGR does not foresee major problems in finding the qualified staff it needs for expansion, unless when growing at too rapid a pace. Therefore, one of the key strategies of the CPGR is to empower its staff members to take on more managerial responsibilities in line with organizational growth, at the same time training new employees in operating the advanced technologies implemented at the CPGR. Moreover, senior staff is encouraged and mentored in developing their own entrepreneurial ideas and projects, having in mind that only a critical mass of activity will eventually boost the growth of the biotech sector in South Africa. Only in the area of bioinformatics has it been impossible to make an appointment in the last few months despite the vicinity of the National Bioinformatics Network (NBN). NBN’s shortcoming is that it, like much of the rest of the sector in the country, lacked access to some of the more advanced equipment that is
143
relatively common in other parts of the world and therefore does not have staff trained in certain areas. However, this is exactly one of the gaps the CPGR’s mandate it is to fill. In sum, therefore, it would not be accurate to say that the sector is plagued by a more or less severe human resource problem. Its resource problem is financial in the sense that there isn’t enough risk capital available both to allow firms and research groups to do more of the advanced research that it’ll take to grow the SA sector into an internationally competitive player, and to invest in the necessary hardware.
5 Recommendations Biotechnology in South Africa has a lot of ambitions and hopes invested in it. It is also, for the time being, a rather small sector. Most activities in the especially interesting and challenging third-generation dimension are being undertaken by the scientific community in the public sector. A few skills that are locally in demand are locally not available, but since there is no global shortage, this is not a problem as long as the foreign experts are allowed to work in the country. Graduates from the universities do not always have the requisite experience. However, this is true for all professions and thus not specific to biotechnology. The universities could improve this situation by enriching the curricula through biotechnology-relevant lab experience, but most upskilling will have to be done on the job through firms and research groups. The biggest challenge of the sector, however, is not to find the right people for the jobs but to find the right jobs for the people. It is simply not possible to detect critical skill shortages in an industry that employs so few people. Nor does it necessarily make sense for graduates to opt for a study of biotechnology unless the sector grows considerably. The question then is how the sector would grow beyond where it is today. International experience suggests that entrepreneurial dynamism is prominently behind the start-ups and spin-offs from established research groups. Therefore the one skill that appears to be lacking in the biotechnological community is the ability and willingness to take risk, replete with the motivation to run one’s own business instead of working in safer, corporate environments. Business acumen is certainly a skill that could be imparted in programmes of molecular or microbiology or biochemistry. Finally, it is important that foreigners in demand be given the opportunity to work in the country in order to avoid bottlenecks in skills that are simply not existent in the country.
144
REFERENCES Auf der Heide, Thomas and Steve Thomas. 2002. The PBMR Project: An Assessment of Its Economic Viability. South African Journal of Science 98 (January/February): 36-42. Biotechnology Industry Organization. 2007. Guide to Biotechnology 2007. www.bio.org. BNSC. 2006. Size and Health of the UK Space Industry 2006. Executive Summary. www.bnsc.gov.uk/assets/channels/resources/news/2006UKspaceSizeHealth.pdf. Brown, Frances. 2007. The Changing Face of Space. Space Policy, 23: 69. Buckley, David. 2007. The Southern African Large Telescope: An Example of a High-Tech African Project. Presentation at the 2nd African Leadership Conference on Space Science and Technology for Sustainable Development, Pretoria, South Africa. 2-5 October. http://www.space.gov.za/programme/index.php. Campbell, Keith. 2007. Radio telescope projects open new horizons for high-tech firm. Engineering News [online] 13 July, http://www.engineeringnews.co.za. CDE. 2007. The South African Skills Crisis: A Report from the Corporate Coalface. Occasional Paper no.12, Centre for Development and Enterprise, Johannesburg. Cloete, Kobus. 2007. The South African SKA/meerKAT Project. Presentation at the 2nd African Leadership Conference on Space Science and Technology for Sustainable Development, Pretoria, South Africa. 2-5 October. http://www.space.gov.za/programme/index.php. Cloete, Thomas E., Louis H. Nel, and Jacques Theron. 2006. Biotechnology in South Africa. TRENDS in Biotechnology 24, no.12: 557-62. Companies Still Hamstring by Skills Shortage. 2007. Business Report, 6 June. Davenport, Jade. 2005. Funding Required to Tackle Skills Shortage. Engineering News, 17 June. Davie, Kevin. 2007. Bell the Cat. Mail&Guardian (Business), 12-18 October, 1-2. Deane, Clement. 2006. “National Effort” Needed to Tackle Engineering Shortage. Engineering News, 15 September.
145
Department of Home Affairs. 2007. Press Release 25 May, Minister Nosiviwe Mapisa-Nqakula Announces New Quota Work Permits for Foreigners with Scarce and Critical Skills. Pretoria. DoL. 2006a. Master List Scarce and Critical Skills. Pretoria. DoL. 2006b. State of Skills in South Africa. Pretoria. DME. 2007. Nuclear Energy Policy and Strategy for the Republic of South Africa. Draft for Public Comment. www.dme.gov.za/pdfs/energy/nuclear/nuclear_energy_policy.pdf DST. 2001. National Biotechnology Strategy. www.dst.gov.za/programmes/biodiversity/biotechstratgey.pdf. DST. 2002. South Africa’s National Research and Development Strategy. www.dst.gov.za/legislation_policies/strategic_reps/sa_nat_rd_strat.pdf. DST. 2007. Innovation Towards a Knowledge-Based Economy. Ten-Year Plan for South Africa (2008 – 2018). www.nstf.org.za/minutes/plenary_minutes/10_YEAR_INNOVATION_PLAN14_AUGUST_2007.pdf. eGoli Bio. 2003. National Biotech Survey 2003. www.egolibio.co.za/pages/biotech_survey.pdf. Ernst&Young. 2006. Beyond Borders: The Global Biotechnology Report 2006. www.ey.com/beyondborders Euroconsult. 2006. World Prospects for Government Space Markets 2006/2007 Edition. http://euroconsult-ec.com/brochures/world-prospects-for-gov-space-markets-2007.pdf. Fisher-French, Maya. 2007. Desperately Seeking Talent. Mail&Guardian (MG News) 12-18 October, 3. Gaensler, B., and Lazio, Joseph. 2006. Science with the Square Kilometre Array: Uniqueness and Complementarity, October, SKA [Memo 88]. www.skatelescope.org/pages/memos. Geveden, Rex. 2006. The New Dynamics of Space. The Globalization of Space. NASA Legal Conference, Cocoa Beach, Florida, 25 April, Gibson, Roy. 2007. The History of International Space Programmes. Space Policy, 23: 155–158

146
Hall, Peter J. 2004. The International SKA Project: Industry Interactions Paper 1 – Background, and Collaborative Research and Development, 2 August, SKA [Memo 52]. www.skatelescope.org/pages/memos. Hall, Peter, and Kahn, Stephen. 2006. The International SKA Project: Industry Liaison Models and Policies, 28 July, EWG Industrial Liaison Task Force, SKA [Memo 80]. www.skatelescope.org/pages/memos. Hopkins, Michael M., Paul A. Martin, Paul Nightingale, Alison Kraft, and Surya Mahdi. 2007. The Myth of the Biotech Revolution: An Assessment of Technological, Clinical and Organisational Change. Research Policy 36: 566-89. IAEA. 2004. Managing Nuclear Knowledge: Strategies and Human Resource Development: Summary of an International Conference. www-pub.iaea.org/MTCD/publications/PDF/Pub1235 web.pdf. IAEA. 2007. Nuclear Technology Review. Vienna: International Atomic Energy Agency. Juma, Calestous, and Ismail Serageldin. 2007. Freedom to Innovate: Biotechnology in Africa’s Development. Report of the High-Level African Panel on Modern Biotechnology. Addis Ababa and Pretoria: African Union and New Partnership for Africa’s Development. Kasturirangan, K. 2007. Space technology for humanity: A profile for the coming 50 years. Space Policy, 23: 159–166. Klerck, Gilton. 2006. Biotechnology Research and Technology Networks: The Dynamics of Competition and Co-operation. In Working Partnerships in Higher Education, Industry and Innovation, ed Glenda Kruss, 14-50. Cape Town: HSRC Press. Kruss, Glenda. 2007a. To What Extent are Public Universities a Resource for Innovation in South Africa? U-Know 6, Paper 1, Report on Science-Industry Relationships in South Africa: Overview and Case Studies (D_TTC3). EU Commission, Framework 6, Priority 7 Kruss, Glenda. 2007b. What are the Conditions for Sustaining Competitive University Spin-off Firms in the ICT Sub-Sector in South Africa? U-Know 6, Paper 2, Report on Science-Industry Relationships in South Africa: Overview and Case Studies (D_TTC3). EU Commission, Framework 6, Priority 7 Madipeng, Thapelo. 2007. SAQA Responding to the Shortage of Welders in South Africa. SAQA Update 10, no.2: 4-6.

147
Mafu, Tonny. 2007. Skills Shortage Pits Regulators against Business for Staff. Business Report, 28 May. Manpower. 2007. 2007 Talent Shortage Survey Results. Martinez, Peter. 2007. Space Science & Technology in South Africa. An overview. Presentation at the 2nd African Leadership Conference on Space Science and Technology for Sustainable Development, Pretoria, South Africa. 2-5 October. http://www.space.gov.za/programme/index.php. Motari, Marion, Uyen Quach, Halla Thorsteinsdóttir, Douglas K. Martin, Abdullah S. Daar, and Peter A. Singer. 2004. South Africa – Blazing a Trail for African Biotechnology. Nature Biotechnology 22, Supplement: 37-41. NASA. 2007. National Aeronautics and Space Administration President’s FY 2007 Budget Request. www.nasa.org. NASSP. 2006. Report on Activities: 2003-2006, www.star.ac.za/news/nassp-report.pdf. National Advisory Council on Innovation. 2003. The Potential Impact of Skills Shortages on the Innovative Capacity of Major Capital Engineering Projects. Discussion Document, October. Nicholls. D.R. 2002. The Pebble Bed Nuclear Reactor. South African Journal of Science 98 (January/February): 31-5. NRF. 2006. Generic Key Performance Indicator Report 2005/2006, www.nrf.ac.za. NRF. 2007. Annual Report 2006/2007, www.nrf.ac.za. OECD/IEA. 2006. World Energy Outlook. Paris: OECD. Paterson, Andrew, Kruss, Glenda, Wildschut, Angelique. 2005. Support for Astronomy and the SKA Facility. Summary Report Commissioned by the SKA Bid Committee. South Africa: SKA Bid Committee and HSRC SA Faces Severe Skills Shortage. 2005. Mining Weekly, 16 December. Saleh, Joseph. H. 2005. Will we see a Regional or Global Duopoly in the Satellite Manufacturing Industry? The European Perspective. Space Policy, 21: 277-285. South African Council for Natural Scientific Professions. 2006. Annual Report 2005/2006.

148
South Africa’s Input Vital in Space Science Development. 2003. Monday Paper, 22, 24 February, www.news.uct.ac.za/print/mondaypaper/archives/?id=3544. Southern Comfort, Eastern Promise. 2004. The Economist, 9 December, www.economist.com. Space Today Online. 2000. Space Factoids: Lost Tidbits Recovered. http://www.spacetoday.org/History/SpaceFactoids/SpaceFactoids1.html The World Space Industry: Back in the Big Time. 2007. SatNews Daily, 14 February, http://www.satnews.com/stories2007/3976.htm. Thomas, Steve. 2005. The Economic Impact of the Proposed Demonstration Plant for the Pebble Bed Modular Reactor Design. August. Public Service International Research Unit, University of Greenwich [mimeo]. Thomas, Steve. 2007a. The South African Nuclear Power Programme: Submission to the Portfolio Committee on Environmental Affairs and Tourism. June, PSIRU, University of Greenwich [mimeo]. Thomas, Steve. 2007b. The Status of the Pebble Bed Modular Reactor Development Programme. April. PSIRU, University of Greenwich [mimeo]. Van Beuzekom, Brigitte, and Anthony Arundel. 2006. OECD Biotechnology Statistics – 2006. Paris: OECD. Van Wyk, Jo-Ansie. 2007. Overview of the Implementation Status of the Five United Nations (UN) Treaties on Outer Space in African Countries. Presentation at the 2nd African Leadership Conference on Space Science and Technology for Sustainable Development, Pretoria, South Africa. 2-5 October. http://www.space.gov.za/programme/index.php. Walwyn, David R. 2003. Biotechnologists. In Human Resources Development Review 2003, ed. Andre Kraak, 584-609. Cape Town: HSRC Press. What is SALT? (no date). http://www.salt.ac.za/fileadmin/files/about/salt-what_is_it.pdf. Whitelock, Patricia. 2007. Astrophysics in Southern Africa. http://arxiv.org/ftp/arxiv/papers/0707/0707.0921.pdf. WKU Faculty Member Helping South Africa Increase Number of Black Astronomers. 2007. Echo, August 22, www.wku.edu/echo/astronomy.htm.

149
Wolson, Rosemary A. 2007. The Role of Technology Transfer Offices in Building the South African Biotechnology Sector: An Assessment of Policies, Practices and Impact. Journal of Technology Transfer 32: 343-65.