human movement science - ucla | bionics...
TRANSCRIPT
Human Movement Science 32 (2013) 691–707
Contents lists available at SciVerse ScienceDirect
Human Movement Science
journal homepage: www.elsevier .com/locate/humov
Differences between elite, junior and non-rowersin kinematic and kinetic parameters duringergometer rowing
0167-9457/$ - see front matter � 2012 Elsevier B.V. All rights reserved.http://dx.doi.org/10.1016/j.humov.2012.11.006
⇑ Corresponding author. Tel.: +386 1 4768 355; fax: +386 1 4768 239.E-mail addresses: [email protected] (T. Cerne), [email protected] (R. Kamnik), bostjan.v
alpineon.si (B. Vesnicer), [email protected] (J. Zganec Gros), [email protected] (M. Munih).
Tomaz Cerne a, Roman Kamnik b,⇑, Boštjan Vesnicer a, Jerneja Zganec Gros a,Marko Munih b
a Alpineon d.o.o., Ulica Iga Grudna 15, Ljubljana, Sloveniab University of Ljubljana, Faculty of Electrical Engineering, Trzaška 25, Ljubljana, Slovenia
a r t i c l e i n f o
Article history:Available online 10 June 2013
PsycINFO classification:37202330
Keywords:RowingBiomechanicsLevel of expertise
a b s t r a c t
This paper presents an analysis of the rowing parameters of differ-ently skilled rowers. The study focuses on technique dependencyon stroke rate. Five elite, five junior and five non-rowers partici-pated, and the biomechanics of rowing on an ergometer was ana-lyzed at stroke rates of 20, 26 and 34 str/min. The results showthat elite rowers use a similar, consistent rowing technique at allstroke rates, the technique of junior rowers follows similar princi-ples, while the technique of non-rowers varies. Elite rowers’ strokelength, handle motion and body posture do not change with strokerate while the ratio of stroke phases, maximum forces, stroke workand joint loadings are constant at the same stroke rate but depen-dent on stroke rate. Junior rowers with stroke rate change also thestroke length. In non-rowers the differences can be observed in thehandle motion and body posture during the stroke, their strokelength changes with stroke rate while the ratio of stroke phasesstays constant. Although different movement execution is evidentand variable with stroke rate, non-rowers demonstrate a consistentpattern at the same stroke rate. On the basis of the results, the cru-cial parameters that differentiate elite, junior, and non-rowers areidentified.
� 2012 Elsevier B.V. All rights reserved.
esnicer@
692 T. Cerne et al. / Human Movement Science 32 (2013) 691–707
1. Introduction
Ergometer rowing is a complex motor skill. A rower must have a good command of technique, tim-ing, and power. Rowing ergometers can be found in most gyms and fitness centers, but many peoplewho use them have little or no instruction in rowing technique. Rowing is a cyclical movement likerunning or cycling. However, unlike cycling and running, the rowing stroke cycle is not an intuitiveact. Kazunori, Motoshi, Zavatsky, and Halliday (2004) showed that novices have some potentiallyimportant differences in technique and warned that faulty technique can lead to injuries. Injuries asa result of faulty technique include problems in the lower back, ribs, shoulder, wrist and knee(Rumball, Lebrun, Di Ciacca, & Orlando, 2005).
A novel approach for training both novice and elite rowers incorporates real-time feedback provid-ing quantitative information about rowing kinematic and kinetic parameters (Henry, Clark, McCabe, &Vanderby, 1995; MacFarlane, Edmond, & Walmsley, 1997).
Different instrumented measurement and training setups for assessing biomechanical parametersof ergometer rowing have been developed in the past. The system developed by Rosow (1991) enablesmeasurements of seat displacement, handle displacement, hip angle, force on handle and footstretcherforces and torques. The system developed by Pudlo, Pinti, and Lepoutre (2005) enables quantificationof internal forces and articular moments using the inverse dynamics method. Both of these systemsallow only offline data processing. The system of Hawkins (2000) provides offline information aboutthe rower’s joint kinematics, pulling force, and pulling power. The system developed by Page andHawkins (2003) displays rowers’ body movement in real-time in the form of two-dimensional stickfigure animation. Baca and Kornfeind (2008) have developed a system that provides real-time visualfeedback about pulling forces and coordination of double rowing on an ergometer. The system devel-oped by Fothergill (2010) provides real-time feedback on handle trajectory, handle force curve andeach foot’s force curve. Cerne, Kamnik, and Munih (2011) have developed an instrumented rowingergometer system that enables measurements of kinematic and kinetic parameters, calculation ofinternal forces and joint moments, and preparation of data for real-time feedback.
On the basis of acquired and available real-time data, we propose a training platform for learningrowing technique on an ergometer. The platform consists of a measurement module, a data processingmodule, a reference module and a module for feedback information. The measurement module pro-vides kinetic and kinematic data of the rower. The data are processed in the data processing modulethat calculates body joint loadings and provides quantification of biomechanical parameters. The es-sence of the reference module is a reference model of biomechanical parameters that describes properergometer rowing technique. The reference module evaluates processed data by comparison betweenreal-time data and reference data. Based on this assumption, a module for feedback information deter-mines the needed instructions and outputs graphical and audio information to the trainee rower.According to the feedback information the rower modifies movement towards proper ergometer row-ing technique.
For development of the reference model, a proper set and proper range of values of input variablesshould be found. A wide range of biomechanical parameters can be measured during ergometer row-ing. The question is which of those parameters are effective for feeding back and describing the rowingtechnique. Redgrave (1995) and Nolte (2005) described the basic biomechanical parameters that char-acterize ergometer rowing technique: the stroke length, the duration and ratio of the stroke phases,the forces of the stroke on the handle and foot stretcher, the power of the stroke, the trajectory ofthe handle motion, the body posture and the body joint loads. Some of those parameters are depen-dent on stroke rate. Kleshnev (2003) demonstrated that the ratio of the drive and recovery time ofstroke is dependent on stroke rate. McGregor, Bull, and Byng-Maddick (2004) investigated spinaland pelvic motion, and the force generated at the handle at three different stroke rates. They showedthat there is no change in the magnitude peak of spinal torque generated during different stroke rates,but a shift in the instant of occurrence was noticed. They also showed changes in pelvic rotation at thecatch and finish of the stroke.
T. Cerne et al. / Human Movement Science 32 (2013) 691–707 693
This paper addresses the search for rowing parameters that characterize the ergometer rowingtechnique. The goal of the study was to investigate the differences between elite, junior and non-row-ers in order to identify parameters that have the potential to be incorporated in the reference model,their range of values and consistency regarding stroke rate. With this objective, we analyzed techniqueof ergometer rowing of 5 elite rowers, 5 junior club rowers and 5 non-rowers. In the following section,the participants, apparatus, experimental protocol, variables, data processing and statistical analysesare presented. The third section outlines the results; conclusions are drawn in the fourth section.
2. Methods
2.1. Participants
Fifteen volunteers (male, Caucasian) participated in the study: (a) five elite rowers (age from 22 to38 years, mean = 30.4 years; height from 186 to 197 cm, mean = 191,6 cm; weight from 84 to 100 kg,mean = 89 kg), who are members of the National Rowing Team and holders of World Championshipmedals, (b) five junior rowers (age from 15 to 18 years, mean = 16.7; height from 179 to 188 cm,mean = 183 cm; weight from 75 to 100 kg, mean = 82.4 kg), who are training rowing in an organizedprogram on club level, and (c) five non-rowers (age from 25 to 32 years, mean = 28 years; height from171 to 188 cm, mean = 182,8 cm; weight from 76 to 100 kg, mean = 84,6 kg), who were introduced toa rowing ergometer for the first time. The non-rowers represented a group of people beginning rowingfor recreation without any basic teaching and professional supervision. All participants providedconsent.
2.2. Apparatus
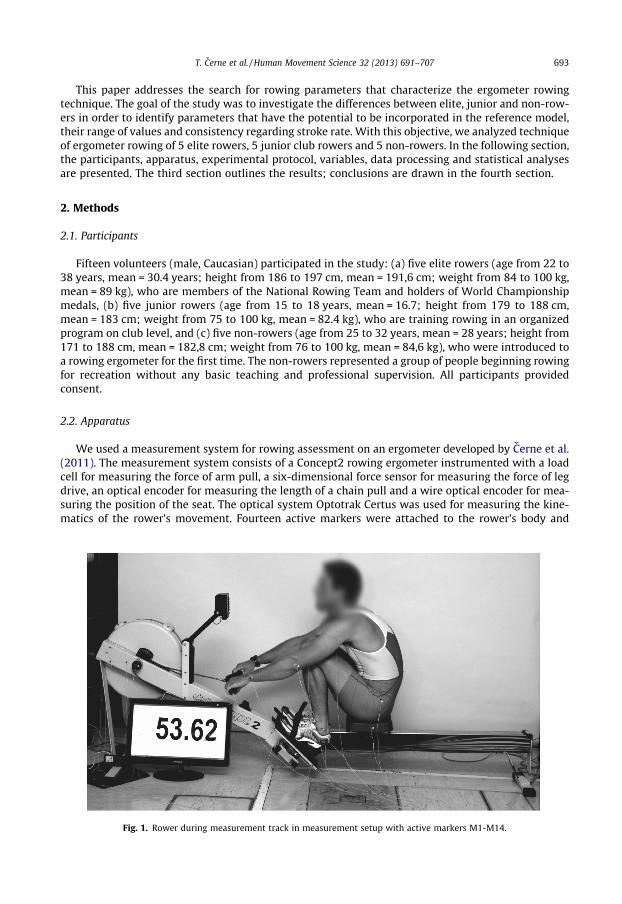
We used a measurement system for rowing assessment on an ergometer developed by Cerne et al.(2011). The measurement system consists of a Concept2 rowing ergometer instrumented with a loadcell for measuring the force of arm pull, a six-dimensional force sensor for measuring the force of legdrive, an optical encoder for measuring the length of a chain pull and a wire optical encoder for mea-suring the position of the seat. The optical system Optotrak Certus was used for measuring the kine-matics of the rower’s movement. Fourteen active markers were attached to the rower’s body and
Fig. 1. Rower during measurement track in measurement setup with active markers M1-M14.

694 T. Cerne et al. / Human Movement Science 32 (2013) 691–707
ergometer as shown in Fig. 1. A video camera was incorporated into measurement setup to visuallycapture the rower’s motion. To follow interaction forces and moment in the rowers’ body, joint load-ings were calculated according to the recursive Newton-Euler inverse dynamics approach for ankle,knee, hip, lumbosacral and shoulder joints (Sciavicco & Siciliano, 2001). The Newton-Euler inversedynamics approach determines the joint reaction for the distal segment which is in contact withthe environment and proceeds recursively toward the proximal segments. The forces and torques ofthe lower body segments were thus calculated consecutively from the foot to the reactions actingto the pelvis segment in the hip joints, while the forces and torques of the upper body segments werecalculated from the hands to the reactions acting to the pelvis segment in the LS joint (Cerne et al.,2011). In this way, all body joint loadings were determined without the need for measuring the seatreactions. Incorporation of seat reaction force measurement would enable the calculation of the LSjoint loadings from two different directions along upper and lower extremities thus providing moreaccurate information.
2.3. Experimental protocol
Each subject’s measurement test consisted of three types of activity; each had a defined stroke rateaccording to typical training procedure: an aerobic type activity at a rate of 20 strokes/minute, an aer-obic threshold activity at 26 strokes/minute and an anaerobic activity at 34 strokes/minute. Measure-ment test started after the steady state situation was reached at each stroke rate. Rowers rowed oneminute at a stoke rate of 20 strokes/minute, 30 seconds at 26 strokes/minute and 30 seconds at34 strokes/minute. The experiment was approved by the National Medical Ethical Committee.
2.4. Variables
We have assumed the symmetry of rowing on ergometer and studied rowing in sagittal plane alikein previous studies (Consiglieri & Pires, 2009; Hahn, Schwirtz, & Huber, 2005; Hase, Andrews, Zavatskyand Halliday, 2002; Hase, Kaya, Zavatsky, & Halliday, 2004; Hawkins, 2000; McGregor et al., 2003;Page & Hawkins, 2003).
Performances of three groups were compared to determine the parameters’ consistency. The fol-lowing variables were compared: stroke length, normalized stroke length, duration of stroke phasesand their ratio, peak handle pull force, peak foot reaction force, average handle pull force during drivephase, average foot reaction force during drive phase, and force ratios and the instant of occurrence,stroke work, handle motion trajectories, trunk inclination and joint torques.
The stroke length (l) was defined as the difference between the maximum and minimum length ofthe handle displacement. Normalized stroke length (lr) was calculated as the average stroke length di-vided by the height of the rower. The ratio of the stroke phases (r) was represented as the ratio be-tween the duration of the drive phase (td) and the recovery phase (tr), where the backward motionof the handle, away from the flywheel, represented the drive phase, while the recovery phase wasdetermined as the handle motion in the opposite direction. The peak handle pull force (fp,max) repre-sented the maximum value of force measured on the handle during a single stroke. The average handlepull force during the drive (fp,avg) was the average of force measured on the handle during a drivephase of the stroke. The ratio average to maximal handle pull force (fp,r) was calculated as the ratiobetween fp,avg and fp,max. The peak foot reaction force (fr,max) was the maximum absolute value ofthe measured force vector on the foot stretcher during a single stroke. The average foot reaction forceduring the drive (fr,avg) was the average absolute value of the measured force vector on the footstretcher during a drive phase of the stroke. The ratio average to maximal foot reaction force (fr,r)was calculated as the ratio between fr,avg and fr,max. Ratio of peak forces as a parameter describing row-ing style (fr,m) was determined as ratio between fp,max and fr,max, while ratio of average forces during thedrive (fr,a) was determined as ratio between fp,avg and fr,avg. The work of a stroke (A) was calculated asthe integral of handle pull force over handle displacement. Trunk inclination (u) was defined as theangle between trunk described by a vector from marker M10 to marker M11 and coronal plane.The handle motion trajectory was assessed directly from the measured position of marker attachedto the handle. The torque around the transversal direction (Mz) was analyzed as the most important

T. Cerne et al. / Human Movement Science 32 (2013) 691–707 695
parameter of joint loadings that contribute to movement in the sagittal plane. To enable better com-parison, data have been normalized to a longitudinal handle displacement. The beginning of the drivewas assigned to a value of �100, the end of the pull and the start of the recovery to value 0 and the endof the recovery to a value of 100. From torque parameter of maximal torque around the transversaldirection (Mz) and their instant of occurrence according to handle position (Mh) were calculated.
2.5. Data processing and statistical analyses
Data from ten consecutive strokes accomplished at each stroke rate from each participant were ac-quired for analysis. The Matlab software package (The MathWorks (Ver. 7.10), Natict, MA) was usedfor data processing. The start of a rowing stroke was defined as the start of the drive phase; therefore,the recovery phase covers the second half of the total rowing stroke.
Evaluation of motion performance was assessed by calculating the trajectory repeatability (RTp) fol-lowing the ISO 9283 standard (1998), which is used for evaluation of the industrial robots. Trajectoryrepeatability at a single point of trajectory (RTpi) is defined as the radius of a circle containing all mea-sured paths at this point. The trajectory repeatability for the whole trajectory (RTp) is defined as max-imum value of trajectory repeatabilities (RTpi).
Data from ten consecutive strokes at each stroke rate from each participant were averaged and ana-lyzed with SPSS (IBM (Ver. 17.0), Armonk, NY). As we were interested in the analysis of the stroke rateinfluence to listed variables in differently skilled groups, we first performed a one-way repeated-mea-sures ANOVA with three levels of stroke rate (20 str/min, 26 str/min, 34 str/min) for each variable.From this ANOVA, we extracted the partial eta-squared value (g2) and the p-value of the effect ofstroke rate on each variable for each group separately. The partial eta-squared represents the propor-tion of total variability attributable to the factor (in this case, stroke rate), excluding other factors fromthe total nonerror variation (Cohen, 1973) and can thus be thought of as the ‘size’ of the factor’s effect.Partial eta-squared has been previously used to study the size of the effect of task difficulty and sub-ject type on physiological and biomechanical parameters (Novak et al., 2010).
Since we were also interested in investigating the differences between the groups, we performed atwo-way mixed-design ANOVA with one within-subject factor (stroke rate) and one between-subjectsfactor (rower type). From this ANOVA, we extracted the partial eta-squared and the p-value of the ef-fect of rower type (elite, junior or non-rower) on each variable. In all cases, the threshold for signifi-cance was set at p = .05.
The variance-to-mean ratio (VMR) was used to evaluate the consistency of variables. A VMR below.05 was considered insignificant.
We performed a principal component analysis (PCA) in order to analyze variance between partic-ipating subjects. PCA was performed for the drive phase for signals of handle pull force, foot reactionforce and trunk inclination as the basic parameter of body posture. For proper comparison, all strokesignals were resampled to the same number of samples and forces were normalized with maximalforce. The principal components (i.e., eigenvectors) were found by the eigenvalue decomposition ofthe covariance matrix of all signals coming from all measured data from the elite rowers. After that,all signals were projected to the PCA subspace. For better comparison, the eigenvectors were scaledby the inverse of the square root of the corresponding eigenvalues.
3. Results and discussion
Means and standard deviations of the stroke length (l), normalized stroke length (ln), duration ofdrive phase (td), duration of recovery phase (tr), ratio of the stroke phases (r), peak foot reaction force(fr,max), average foot reaction force during the drive (fr,avg), ratio average to maximal foot reaction force(fr,r), peak handle pull force (fp,max), average handle pull force during the drive (fp,avg), ratio average tomaximal handle pull force (fp,r), force ratio of peak forces (fr,m), force ratio of average forces during thedrive (fr,a), work (A) and repeatability for the handle motion trajectory (RTp) are shown in Table 1 forelite rowers, in Table 2 for junior rowers, and in Table 3 for non-rowers. For each group of rowers alsogroup averages and standard deviations are presented.
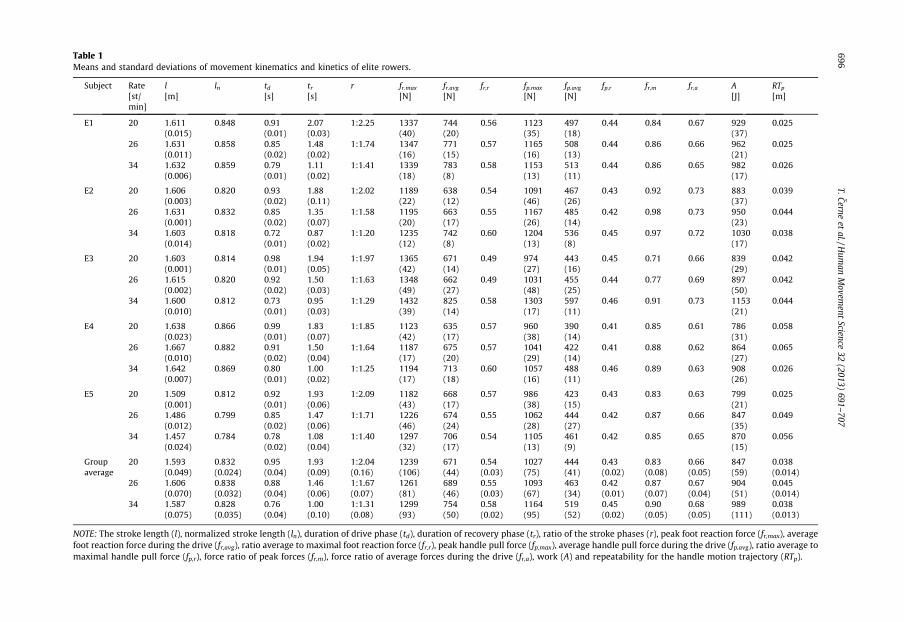
Table 1Means and standard deviations of movement kinematics and kinetics of elite rowers.
Subject Rate[st/min]
l[m]
ln td
[s]tr
[s]r fr.max
[N]fr.avg
[N]fr,r fp.max
[N]fp.avg
[N]fp,r fr,m fr,a A
[J]RTp
[m]
E1 20 1.611(0.015)
0.848 0.91(0.01)
2.07(0.03)
1:2.25 1337(40)
744(20)
0.56 1123(35)
497(18)
0.44 0.84 0.67 929(37)
0.025
26 1.631(0.011)
0.858 0.85(0.02)
1.48(0.02)
1:1.74 1347(16)
771(15)
0.57 1165(16)
508(13)
0.44 0.86 0.66 962(21)
0.025
34 1.632(0.006)
0.859 0.79(0.01)
1.11(0.02)
1:1.41 1339(18)
783(8)
0.58 1153(13)
513(11)
0.44 0.86 0.65 982(17)
0.026
E2 20 1.606(0.003)
0.820 0.93(0.02)
1.88(0.11)
1:2.02 1189(22)
638(12)
0.54 1091(46)
467(26)
0.43 0.92 0.73 883(37)
0.039
26 1.631(0.001)
0.832 0.85(0.02)
1.35(0.07)
1:1.58 1195(20)
663(17)
0.55 1167(26)
485(14)
0.42 0.98 0.73 950(23)
0.044
34 1.603(0.014)
0.818 0.72(0.01)
0.87(0.02)
1:1.20 1235(12)
742(8)
0.60 1204(13)
536(8)
0.45 0.97 0.72 1030(17)
0.038
E3 20 1.603(0.001)
0.814 0.98(0.01)
1.94(0.05)
1:1.97 1365(42)
671(14)
0.49 974(27)
443(16)
0.45 0.71 0.66 839(29)
0.042
26 1.615(0.002)
0.820 0.92(0.02)
1.50(0.03)
1:1.63 1348(49)
662(27)
0.49 1031(48)
455(25)
0.44 0.77 0.69 897(50)
0.042
34 1.600(0.010)
0.812 0.73(0.01)
0.95(0.03)
1:1.29 1432(39)
825(14)
0.58 1303(17)
597(11)
0.46 0.91 0.73 1153(21)
0.044
E4 20 1.638(0.023)
0.866 0.99(0.01)
1.83(0.07)
1:1.85 1123(42)
635(17)
0.57 960(38)
390(14)
0.41 0.85 0.61 786(31)
0.058
26 1.667(0.010)
0.882 0.91(0.02)
1.50(0.04)
1:1.64 1187(17)
675(20)
0.57 1041(29)
422(14)
0.41 0.88 0.62 864(27)
0.065
34 1.642(0.007)
0.869 0.80(0.01)
1.00(0.02)
1:1.25 1194(17)
713(18)
0.60 1057(16)
488(11)
0.46 0.89 0.63 908(26)
0.026
E5 20 1.509(0.001)
0.812 0.92(0.01)
1.93(0.06)
1:2.09 1182(43)
668(17)
0.57 986(38)
423(15)
0.43 0.83 0.63 799(21)
0.025
26 1.486(0.012)
0.799 0.85(0.02)
1.47(0.06)
1:1.71 1226(46)
674(24)
0.55 1062(28)
444(27)
0.42 0.87 0.66 847(35)
0.049
34 1.457(0.024)
0.784 0.78(0.02)
1.08(0.04)
1:1.40 1297(32)
706(17)
0.54 1105(13)
461(9)
0.42 0.85 0.65 870(15)
0.056
Groupaverage
20 1.593(0.049)
0.832(0.024)
0.95(0.04)
1.93(0.09)
1:2.04(0.16)
1239(106)
671(44)
0.54(0.03)
1027(75)
444(41)
0.43(0.02)
0.83(0.08)
0.66(0.05)
847(59)
0.038(0.014)
26 1.606(0.070)
0.838(0.032)
0.88(0.04)
1.46(0.06)
1:1.67(0.07)
1261(81)
689(46)
0.55(0.03)
1093(67)
463(34)
0.42(0.01)
0.87(0.07)
0.67(0.04)
904(51)
0.045(0.014)
34 1.587(0.075)
0.828(0.035)
0.76(0.04)
1.00(0.10)
1:1.31(0.08)
1299(93)
754(50)
0.58(0.02)
1164(95)
519(52)
0.45(0.02)
0.90(0.05)
0.68(0.05)
989(111)
0.038(0.013)
NOTE: The stroke length (l), normalized stroke length (ln), duration of drive phase (td), duration of recovery phase (tr), ratio of the stroke phases (r), peak foot reaction force (fr,max), averagefoot reaction force during the drive (fr,avg), ratio average to maximal foot reaction force (fr,r), peak handle pull force (fp,max), average handle pull force during the drive (fp,avg), ratio average tomaximal handle pull force (fp,r), force ratio of peak forces (fr,m), force ratio of average forces during the drive (fr,a), work (A) and repeatability for the handle motion trajectory (RTp).
696T.Cerne
etal./H
uman
Movem
entScience
32(2013)
691–707
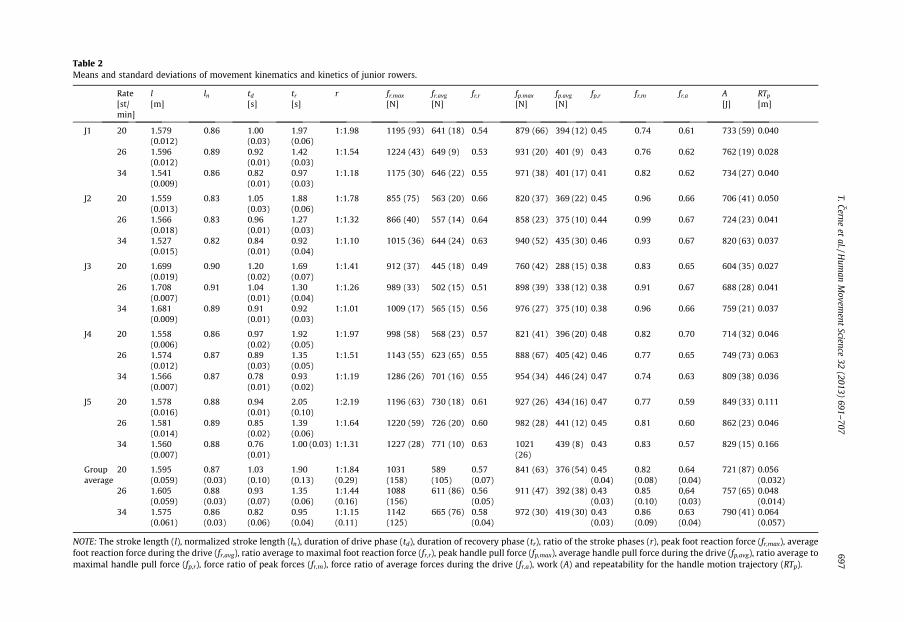
Table 2Means and standard deviations of movement kinematics and kinetics of junior rowers.
Rate[st/min]
l[m]
ln td
[s]tr
[s]r fr.max
[N]fr.avg
[N]fr,r fp.max
[N]fp.avg
[N]fp,r fr,m fr,a A
[J]RTp
[m]
J1 20 1.579(0.012)
0.86 1.00(0.03)
1.97(0.06)
1:1.98 1195 (93) 641 (18) 0.54 879 (66) 394 (12) 0.45 0.74 0.61 733 (59) 0.040
26 1.596(0.012)
0.89 0.92(0.01)
1.42(0.03)
1:1.54 1224 (43) 649 (9) 0.53 931 (20) 401 (9) 0.43 0.76 0.62 762 (19) 0.028
34 1.541(0.009)
0.86 0.82(0.01)
0.97(0.03)
1:1.18 1175 (30) 646 (22) 0.55 971 (38) 401 (17) 0.41 0.82 0.62 734 (27) 0.040
J2 20 1.559(0.013)
0.83 1.05(0.03)
1.88(0.06)
1:1.78 855 (75) 563 (20) 0.66 820 (37) 369 (22) 0.45 0.96 0.66 706 (41) 0.050
26 1.566(0.018)
0.83 0.96(0.01)
1.27(0.03)
1:1.32 866 (40) 557 (14) 0.64 858 (23) 375 (10) 0.44 0.99 0.67 724 (23) 0.041
34 1.527(0.015)
0.82 0.84(0.01)
0.92(0.04)
1:1.10 1015 (36) 644 (24) 0.63 940 (52) 435 (30) 0.46 0.93 0.67 820 (63) 0.037
J3 20 1.699(0.019)
0.90 1.20(0.02)
1.69(0.07)
1:1.41 912 (37) 445 (18) 0.49 760 (42) 288 (15) 0.38 0.83 0.65 604 (35) 0.027
26 1.708(0.007)
0.91 1.04(0.01)
1.30(0.04)
1:1.26 989 (33) 502 (15) 0.51 898 (39) 338 (12) 0.38 0.91 0.67 688 (28) 0.041
34 1.681(0.009)
0.89 0.91(0.01)
0.92(0.03)
1:1.01 1009 (17) 565 (15) 0.56 976 (27) 375 (10) 0.38 0.96 0.66 759 (21) 0.037
J4 20 1.558(0.006)
0.86 0.97(0.02)
1.92(0.05)
1:1.97 998 (58) 568 (23) 0.57 821 (41) 396 (20) 0.48 0.82 0.70 714 (32) 0.046
26 1.574(0.012)
0.87 0.89(0.03)
1.35(0.05)
1:1.51 1143 (55) 623 (65) 0.55 888 (67) 405 (42) 0.46 0.77 0.65 749 (73) 0.063
34 1.566(0.007)
0.87 0.78(0.01)
0.93(0.02)
1:1.19 1286 (26) 701 (16) 0.55 954 (34) 446 (24) 0.47 0.74 0.63 809 (38) 0.036
J5 20 1.578(0.016)
0.88 0.94(0.01)
2.05(0.10)
1:2.19 1196 (63) 730 (18) 0.61 927 (26) 434 (16) 0.47 0.77 0.59 849 (33) 0.111
26 1.581(0.014)
0.89 0.85(0.02)
1.39(0.06)
1:1.64 1220 (59) 726 (20) 0.60 982 (28) 441 (12) 0.45 0.81 0.60 862 (23) 0.046
34 1.560(0.007)
0.88 0.76(0.01)
1.00 (0.03) 1:1.31 1227 (28) 771 (10) 0.63 1021(26)
439 (8) 0.43 0.83 0.57 829 (15) 0.166
Groupaverage
20 1.595(0.059)
0.87(0.03)
1.03(0.10)
1.90(0.13)
1:1.84(0.29)
1031(158)
589(105)
0.57(0.07)
841 (63) 376 (54) 0.45(0.04)
0.82(0.08)
0.64(0.04)
721 (87) 0.056(0.032)
26 1.605(0.059)
0.88(0.03)
0.93(0.07)
1.35(0.06)
1:1.44(0.16)
1088(156)
611 (86) 0.56(0.05)
911 (47) 392 (38) 0.43(0.03)
0.85(0.10)
0,64(0.03)
757 (65) 0.048(0.014)
34 1.575(0.061)
0.86(0.03)
0.82(0.06)
0.95(0.04)
1:1.15(0.11)
1142(125)
665 (76) 0.58(0.04)
972 (30) 419 (30) 0.43(0.03)
0.86(0.09)
0.63(0.04)
790 (41) 0.064(0.057)
NOTE: The stroke length (l), normalized stroke length (ln), duration of drive phase (td), duration of recovery phase (tr), ratio of the stroke phases (r), peak foot reaction force (fr,max), averagefoot reaction force during the drive (fr,avg), ratio average to maximal foot reaction force (fr,r), peak handle pull force (fp,max), average handle pull force during the drive (fp,avg), ratio average tomaximal handle pull force (fp,r), force ratio of peak forces (fr,m), force ratio of average forces during the drive (fr,a), work (A) and repeatability for the handle motion trajectory (RTp).
T.Cerneet
al./Hum
anM
ovement
Science32
(2013)691–
707697
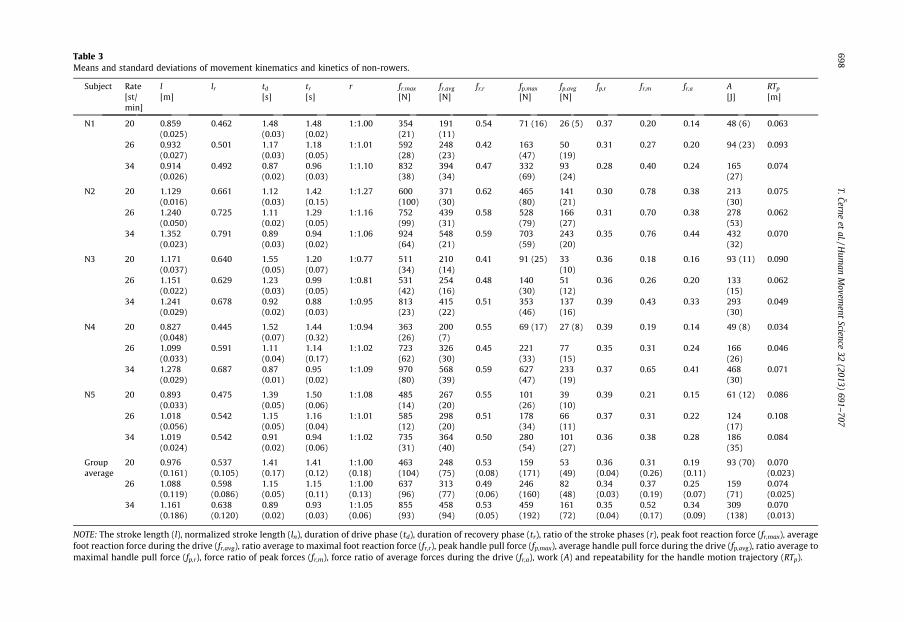
Table 3Means and standard deviations of movement kinematics and kinetics of non-rowers.
Subject Rate[st/min]
l[m]
lr td
[s]tr
[s]r fr.max
[N]fr.avg
[N]fr,r fp.max
[N]fp.avg
[N]fp,r fr,m fr,a A
[J]RTp
[m]
N1 20 0.859(0.025)
0.462 1.48(0.03)
1.48(0.02)
1:1.00 354(21)
191(11)
0.54 71 (16) 26 (5) 0.37 0.20 0.14 48 (6) 0.063
26 0.932(0.027)
0.501 1.17(0.03)
1.18(0.05)
1:1.01 592(28)
248(23)
0.42 163(47)
50(19)
0.31 0.27 0.20 94 (23) 0.093
34 0.914(0.026)
0.492 0.87(0.02)
0.96(0.03)
1:1.10 832(38)
394(34)
0.47 332(69)
93(24)
0.28 0.40 0.24 165(27)
0.074
N2 20 1.129(0.016)
0.661 1.12(0.03)
1.42(0.15)
1:1.27 600(100)
371(30)
0.62 465(80)
141(21)
0.30 0.78 0.38 213(30)
0.075
26 1.240(0.050)
0.725 1.11(0.02)
1.29(0.05)
1:1.16 752(99)
439(31)
0.58 528(79)
166(27)
0.31 0.70 0.38 278(53)
0.062
34 1.352(0.023)
0.791 0.89(0.03)
0.94(0.02)
1:1.06 924(64)
548(21)
0.59 703(59)
243(20)
0.35 0.76 0.44 432(32)
0.070
N3 20 1.171(0.037)
0.640 1.55(0.05)
1.20(0.07)
1:0.77 511(34)
210(14)
0.41 91 (25) 33(10)
0.36 0.18 0.16 93 (11) 0.090
26 1.151(0.022)
0.629 1.23(0.03)
0.99(0.05)
1:0.81 531(42)
254(16)
0.48 140(30)
51(12)
0.36 0.26 0.20 133(15)
0.062
34 1.241(0.029)
0.678 0.92(0.02)
0.88(0.03)
1:0.95 813(23)
415(22)
0.51 353(46)
137(16)
0.39 0.43 0.33 293(30)
0.049
N4 20 0.827(0.048)
0.445 1.52(0.07)
1.44(0.32)
1:0.94 363(26)
200(7)
0.55 69 (17) 27 (8) 0.39 0.19 0.14 49 (8) 0.034
26 1.099(0.033)
0.591 1.11(0.04)
1.14(0.17)
1:1.02 723(62)
326(30)
0.45 221(33)
77(15)
0.35 0.31 0.24 166(26)
0.046
34 1.278(0.029)
0.687 0.87(0.01)
0.95(0.02)
1:1.09 970(80)
568(39)
0.59 627(47)
233(19)
0.37 0.65 0.41 468(30)
0.071
N5 20 0.893(0.033)
0.475 1.39(0.05)
1.50(0.06)
1:1.08 485(14)
267(20)
0.55 101(26)
39(10)
0.39 0.21 0.15 61 (12) 0.086
26 1.018(0.056)
0.542 1.15(0.05)
1.16(0.04)
1:1.01 585(12)
298(20)
0.51 178(34)
66(11)
0.37 0.31 0.22 124(17)
0.108
34 1.019(0.024)
0.542 0.91(0.02)
0.94(0.06)
1:1.02 735(31)
364(40)
0.50 280(54)
101(27)
0.36 0.38 0.28 186(35)
0.084
Groupaverage
20 0.976(0.161)
0.537(0.105)
1.41(0.17)
1.41(0.12)
1:1.00(0.18)
463(104)
248(75)
0.53(0.08)
159(171)
53(49)
0.36(0.04)
0.31(0.26)
0.19(0.11)
93 (70) 0.070(0.023)
26 1.088(0.119)
0.598(0.086)
1.15(0.05)
1.15(0.11)
1:1.00(0.13)
637(96)
313(77)
0.49(0.06)
246(160)
82(48)
0.34(0.03)
0.37(0.19)
0.25(0.07)
159(71)
0.074(0.025)
34 1.161(0.186)
0.638(0.120)
0.89(0.02)
0.93(0.03)
1:1.05(0.06)
855(93)
458(94)
0.53(0.05)
459(192)
161(72)
0.35(0.04)
0.52(0.17)
0.34(0.09)
309(138)
0.070(0.013)
NOTE: The stroke length (l), normalized stroke length (ln), duration of drive phase (td), duration of recovery phase (tr), ratio of the stroke phases (r), peak foot reaction force (fr,max), averagefoot reaction force during the drive (fr,avg), ratio average to maximal foot reaction force (fr,r), peak handle pull force (fp,max), average handle pull force during the drive (fp,avg), ratio average tomaximal handle pull force (fp,r), force ratio of peak forces (fr,m), force ratio of average forces during the drive (fr,a), work (A) and repeatability for the handle motion trajectory (RTp).
698T.Cerne
etal./H
uman
Movem
entScience
32(2013)
691–707

Table 4Partial eta-squared obtained using analysis of variance for different parameters.
Ln r A RTp us uf Mz_k Mh_k Mz_ls Mh_ls
Elite 0.33 0.99⁄ 0.65⁄ 0.53 0.58 0.69⁄ 0.36 0.77⁄ 0.57 0.04Junior 0.70⁄ 0.94⁄ 0.44 0.11 0.07 0.03 0.14 0.23 0.53 0.78⁄
Non-rower 0.60⁄ 0.08 0.79⁄ 0.03 0.14 0.10 0.84⁄ 0.03 0.75⁄ 0.72⁄
Type E-N 0.78⁄ 0.92⁄ 0.97⁄ 0.57⁄ 0.70⁄ 0.37 0.70⁄ 0.01 0.93⁄ 0.47⁄
Type E-J 0.34 0.31 0.68⁄ 0.07 0.05 0.20 0.07⁄ 0.00 0.78⁄ 0.16Type E-J-N 0.84⁄ 0.83⁄ 0.96⁄ 0.29 0.53⁄ 0.48⁄ 0.70⁄ 0.01 0.91⁄ 0.35
fr,max fr,avg fr,r fp,max fp,avg fp,r fr,m fr,a
Elite 0.62⁄ 0.69⁄ 0.52 0.58 0.60 0.56 0.43 0.20Junior 0.45 0.69⁄ 0.24 0.86⁄ 0.60 0.33 0.15 0.11Non-rower 0.87⁄ 0.85⁄ 0.27 0.83⁄ 0.80⁄ 0.16 0.66⁄ 0.79⁄
Type E-N 0.95⁄ 0.93⁄ 0.23 0.93⁄ 0.95⁄ 0.80⁄ 0.76⁄ 0.93⁄
Type E-J 0.42⁄ 0.32 0.04 0.80⁄ 0.55⁄ 0.01 0.03 0.17Type E-J-N 0.89⁄ 0.87⁄ 0.24 0.93⁄ 0.95⁄ 0.72⁄ 0.78⁄ 0.93⁄
NOTE: The first row represents the effect of stroke rate on various variables for elite rowers, the second row represents the effectof stroke rate on various variables for junior rowers, and the third row represents the effect of stroke rate on various variablesfor non-rowers. The fourth, fifth, and sixth rows describe the impact of rower type on listed variables. Asterisk representssignificant effect with p < .05.
T. Cerne et al. / Human Movement Science 32 (2013) 691–707 699
Results for one-way repeated-measures ANOVA with three levels of stroke rate and two-waymixed-design ANOVA with one within-subject factor (stroke rate) and one between-subjects factor(rower type) are presented in Table 4. A two-way mixed-design ANOVA was performed separatelyfor rower types elites and non-rowers (Rower type E-N), elites and junior rowers (Rower type E-J),and elites, junior rowers, and non-rowers (Rower type E-J-N). The first three rows describe the influ-ence of the stroke rate on the listed variables. An asterisk means that there is at least a 95% confidencethat the differences in variables are not random, but are a consequence of the changes in stroke rate.The numbers represent the size of the effect of the stroke rate, where g2 > .7 presents major stroke rateeffect. The fourth, fifth, and sixth rows describe the impact of rower type on listed variables. An aster-isk means that there is at least a 95% confidence that differences in variables are not random, but are aconsequence of rower type. This means that the variable can be used for identification between rowertypes and characterizes the distinction in ergometer rowing technique. A higher number describesgreater distinction.
3.1. Stroke length
As can be seen from the Table 1, the pattern of stroke length in elite rowers is extremely consistentthrough different stroke rates, with an average standard deviation (SD) of less than 1 cm. Only in sub-ject E5 the stroke length shortens with increasing stroke rate. Normalized stroke length is used forintercomparison of subjects. The average normalized stroke length of elite rowers at all stroke ratesis 0.83 (SD = .03). Value VMR = .04 is considered insignificant. The stroke length of junior rowers varieswith stroke rate (see Table 2). All subjects lengthen stroke length at stroke rate 26 str/min and shortenit at stroke rate 34 str/min. All subjects, except J4, row with the shortest stroke length at stroke rate34 str/min. The average normalized stroke length of junior rowers is 0.87 (SD = .03) and longer thenelites’. Value VMR = .03 is considered insignificant. The stroke length of non-rowers varies even moreconsiderably (see Table 3). The normalized stroke length is smaller than that of elite and junior rowersand increases with increasing stroke rate (0.54 (SD = .10) at 20 str/min, 0.60 (SD = .09) at 26 str/min,0.64 (SD = .12) at 34 str/min). Video analysis has shown that the shorter stroke length is a consequenceof smaller trunk inclination and knee flexion at the beginning of the drive, and shortening the stroke atthe finish of the drive phase, as non-rowers do not pull the handle to the abdomen due to their lack oftechnique knowledge. The average SD of strokes at the same rate is less than 3 cm, meaning that non-rowers row with a fairly constant stroke length at a certain stroke rate. On this basis we can conclude

700 T. Cerne et al. / Human Movement Science 32 (2013) 691–707
that the stroke length of elite rowers is consistent and not dependent on the stroke rate (p = .21) whilethe stroke length of junior rowers and non-rowers is consistent only within the same stroke rate. Ju-nior rowers first lengthen and then shorten stroke length with increasing stroke rate (p = .03), andnon-rowers lengthens it with increasing stroke rate (p = .04).
3.2. Duration of stroke phases
The results from Tables 1 and 2 show that the elite and junior rowers perform a fast drive and aslow recovery during a single stroke, so the ratio between the drive and recovery phase durations de-creases with increasing stroke rate (p < .01). This means that the recovery duration has more influenceon the stroke rate than drive duration. The ratio of junior rowers is on average 10% lower than inelites’. This is correlated with applied forces; stronger rowers spend less time in the drive phase.Non-rowers achieve a lower ratio (around 1:1), which does not change significantly (p = .60) withincreasing stroke rate (see Table 4). This means that they spend equal time for both phases. We canconclude that the ratio of stroke phases of elite and junior rowers is constant at the same stroke ratebut dependent on the stroke rate.
3.3. Forces
From the Table 1 it is evident that the value of peak foot reaction force fr,max of elite rowers lies be-tween 1123 and 1432 N and the value of average foot reaction force during the drive phase fr,avg be-tween 635 and 825 N. The results show that the average fr,max at stroke rate 34 str/min is 4.7% higherthan that at stroke rate 20 str/min, while average fr,avg is 12.4% higher. It is a small increase, but can benoticed as a trend (fr,max: p = .02, fr,avg: p = .03). The value of the force ratio fr,r varies between subjectsfrom 0.49 (E3 at 20 and 26 str/min) to 0.60 (E2 and E4 at 30 str/min); however it increases with strokerate at all elite subjects, with the exception of subject E5. The results show that the average VMR offr,avg and fr,max within the same stroke rate is 0.02 and can be considered insignificant.
The value of the peak handle pull force fp,max of elite rowers is between 960 and 1107 N and thevalue of average handle pull force during the drive phase fp,avg is between 390 and 597 N. It can be seenfrom the results that the average fp,max at stroke rate 34 str/min is 11.8% higher than that at stroke rate20 str/min, while average fp,avg is 16.9% higher. The trend of increasing fp,max and fp,avg with increasingstroke rate is evident in all elite rowers (fr,max: p = .07, fr,avg: p = .06). The value of the force ratio fp,r var-ies between subjects from 0.41 (E4 at 20 and 26 str/min) to 0.46 (E3 and E4 at 34 str/min); however itremains the same at subject E1. Subjects E2, E3 and E5 perform with lower ratio at stroke rate 26 str/min than at stroke rate 20 str/min; subjects E2, E3 and E4 increase the ratio at stroke rate 34 str/min.The results show that the average VMR of fp,avg and fp,max within the same stroke rate is 0.03 and can beconsidered insignificant.
The force ratio of peak forces fr,m and force ratio of average forces during the drive phase fr,a varybetween elite rowers. The fr,m of subject E1 stays constant at different stroke rates, it changes signif-icantly in subject E3. The fr,a of subjects E1 and E2 decrease with increasing stroke rate, while the fr,a ofother elite subjects increase. This indicates slight differences in technique amongst elite rowers andcould be the subject of further research.
Regarding Table 2, the value of peak foot reaction force fr,max of junior rowers lies between 855 and1286 N and are on average 14.2% smaller than elites’. It can be seen from the results that the averagefr,max at stroke rate 26 str/min is 5.5% and at stroke rate 34 str/min 10.8% higher than that at stroke rate20 str/min. Trend of higher fr,max is present in all the junior rowers, except J1, who has achieved thelowest fr,max at stroke rate 34 str/min. The value of average foot reaction force during the drive phasefr,avg of juniors lies between 445 and 771 N and are on average 11.8% smaller than elites’. The fr,avg in-creases with stroke rate at subjects J2, J3, and J4, while varies at J1 and J5. The results show that theaverage VMR of fr,max within the same stroke rate is 0.04 and 0.03 of fr,avg, what can be consideredinsignificant. The value of the force ratio fr,r varies between subjects from 0.49 (J3 at 20 str/min) to0.66 (J2 at 20 str/min); however there is no noticeable distinction from elite rowers in these values.
The value of the peak handle pull force fp,max of junior rowers lies between 760 and 1021 N and areon average 17.1% smaller than elites’. It can be seen from the results that the average fp,max at stroke
Longitudinal handle position [m]
20 str/min 26 str/min 34 str/min
Longitudinal handle position [m] Longitudinal handle position [m]
Han
dle
pull
forc
e [N
]
0
200
400
600
800
1000
1200
0.5 1 1.5 2
0
200
400
600
800
1000
1200
0.5 1 1.5 2 0.5 1 1.5 2
0
200
400
600
800
1000
1200
Fig. 2. Handle pull force during a single stroke at different stroke rates: elite rower E5 (left), junior rower J1 (central) and non-rower N4 (right).
T. Cerne et al. / Human Movement Science 32 (2013) 691–707 701
rate 26 str/min is 8.3% and at stroke rate 34 str/min is 15.86% higher than that at stroke rate 20 str/min. This trend of increasing fp,max with increasing stroke rate is evident in all the junior rowers(p < .01). The value of average handle pull force during the drive phase fp,avg of juniors lies between288 and 446 N and are on average 16.6% smaller than elites’. The fp,avg increases with stroke rate atall junior subjects, except J5 (p = .07). The results show that the average VMR of fp,max and fp,avg withinthe same stroke rate are 0.04 and can be considered insignificant. The value of the force ratio fp,r variesbetween subjects from 0.38 (J3 at all stroke rates) to 0.47 (J4 at 34 str/min, J5 at 20 str/min); howeverthere is no noticeable distinction from elite rowers in these values.
The force ratio of peak forces fr,m and force ratio of average forces during the drive phase fr,a varybetween junior rowers inconsistently. While the fr,m of subjects J1, J3 and J5 increase with stroke rate,it lowers in subject J4. The fr,a of subjects J1, J2 and J3 stays constant at different stroke rates, butchanges significantly in subject J4.
The forces produced by non-rowers are significantly lower than the forces of the elite and juniorrowers. The most obvious difference occurs at a rate of 20 str/min, where non-rowers (except subjectN2) hardly produce any force on the handle. The fp,max, fr,max, fp,avg, and fr,avg increase considerably withincreasing stroke rate. The fr,max of subject N4 increases by 2.6 times and fp,max tenfold. The fr,avg in-crease on average for 26% at stroke rate 26 str/min and 85% at stroke rate 34 str/min, while fp,avg al-most double at 26 str/min and triple at 34 str/min. At the stroke rate of 34 str/min, non-rowersdevelop around 2/3 of the elite rowers’ foot reaction forces, but they are obviously not able to transferthis force to the handle, where their force is only around 1/3 of the elites’. Exceptions are evident insubjects N2 and N4, who could develop around 1/2 fp,max of elite rowers. The force ratios of non-rowersvary and are lower than elites’, with the exception of the fr,r, which do not differentiate from the eliteand junior rowers.
Fig. 2 shows the dependency of handle pull force on longitudinal handle position of a single strokeat different stroke rates. The results are presented for one typical rower from each group. Typical han-dle pull force rapidly increases during the drive, reaches its maximum value, and then declines overtime. The forces during the recovery phase are minimal. The handle pull force trajectories in the leftpart of Fig. 2 show how subject E5 increases the force peak, while the force profiles remain similar.There is less time for each stroke at a higher stroke rate, so the force profile is completed faster. Thisfinding is not consistent with the findings of McGregor et al. (2004), who observed a trend of reductionof the peak pulling force and changes in shape of the force curves during increasing stroke rate. Theforce trajectories presented in central part of Fig. 2 show how subject J1 increases the force peakand changes the force profile with increasing stroke rate. The force profile from junior rower J1 alsodiffers from force profile of elite rower E5. The force trajectories presented in right part of Fig. 2 showhow non-rower N4 changes the force profile with increasing stroke rate.
On the basis of force analysis we can conclude that the peaks of the handle pull forces of elite andjunior rowers are constant at the same stroke rate, but increase slightly with increasing stroke rate.

y[m
]
20 str/min 26 str/min 34 str/min
0.5 1 1.5 2
0.4
0.6
0.8
0.5 1 1.5 2
0.4
0.6
0.8
x [m] x [m]x [m]0.5 1 1.5 2
0.4
0.6
0.8
Fig. 3. Handle motion trajectories during a single stroke at different stroke rates: elite rower E5 (left), junior rower J1 (central)and non-rower N4 (right).
20 str/min 26 str/min 34 str/min20 str/min 26 str/min 34 str/min
beginning of the drive:end of the drive:
E1 E2 E3 E4 E5Rower
J1 J2 J3 J4 J5 N1 N2 N3 N4 N5
Angl
e [d
egre
es]
Ante
rior
Post
erio
r
0
-40
-20
0
20
40
60
Fig. 4. Trunk inclination at the instant of start and finish of drive phase.
702 T. Cerne et al. / Human Movement Science 32 (2013) 691–707
The force ratio depends on the technique of the rower. It is also evident that elite rowers do not changetheir force profile regarding the handle position, while junior rowers change it. The peak forces of ju-nior rowers are smaller than the peak forces of elite rowers, and the peak forces of non-rowers are sig-nificantly smaller than the peak forces of junior rowers and increase significantly (p < .01) withincreasing stroke rate.
3.4. Work
The work performed during a single stroke is smaller for junior rowers than for elite rowers, andmuch smaller for non-rowers than for junior rowers. Work increases with increase of the stroke ratefrom 20 to 34 str/min in all subjects elite rowers and non-rowers (p < .05). In junior rowers work de-creased in subjects J1 and J5 at stroke rate 34 str/min regarding the stroke rate 26 str/min. The in-crease of work at stroke rate 34 str/min regarding work at stroke rate 20 str/min was assessed as5% for subject E1, 9% for subject E4, 13% for subject J4, about 16% for subjects E2 and E4 and J2,25% for subject J3, 37% for subject E3, while there was no increase for subject J1 and 2% decreasefor subject J5. If we consider the relative increase of work, it can be seen from Tables 1 and 3 thatit is much higher in non-rowers. For example, subject N2 did twice as much work at the stroke rate
T. Cerne et al. / Human Movement Science 32 (2013) 691–707 703
of 34 str/min than at the stroke rate of 20 str/min, subjects N1, N3 and N5 did about three times morework, and subject N4 did more than nine times more work. Changing the stroke rate shows a differ-ence in work with increased stroke rate, work stays consistent in all rowers at the same stroke rate.The VMR of elite rowers is around VMR = .03, and of junior rowers around VMR = .05, and can be con-sidered insignificant. The VMR is higher in non-rowers, on average VMR = .14. We conclude that workstays constant within the same stroke rate, and increases at elite and non-rowers with increasedstroke rate, while at junior rowers has different patterns.
3.5. Handle motion
Fig. 3 shows the handle motion trajectories presented in the sagittal plane (x represents the hori-zontal direction, y represents the vertical) for the same stroke examples presented in Fig. 2. The handleof elite rower follows the upper part of motion trajectory towards the backward position (increasingx). During the recovery phase, the handle of elite rowers then decrease x by following the lower part ofthe trajectory in Fig. 3 until the start of the next stroke. As can be observed from Fig. 3 and statisticalresults from Table 4, there are no variations observed in the handle motion of the elites (p = .73), juniorrowers (p = .53) at various stroke rates and between these two groups (p = .44). The transition of thehandle motion to the recovery phase starts with an abrupt push downward, simulating the lifting ofthe oars from the water, followed by a horizontal return to the initial position as preparation for thenew stroke. The handle motion trajectories of the non-rowers are more variable at different strokes;there is no circular motion which is typical of elite rowers. Fig. 3 also evidently shows the shorterstroke length of non-rowers. The calculated parameter RTp in (Tables 1–3) presents quantitativeassessment of handle motion repeatability. It can be seen from the results that handle motion repeat-ability of elite and junior rowers is similar, while in non-rowers the handle trajectories are dispersedtwice as much. We can conclude that there are no variations in the handle motion of the elite and ju-nior rowers at various stroke rates, while the handle motion trajectories of non-rowers demonstratetheir lack of technique.
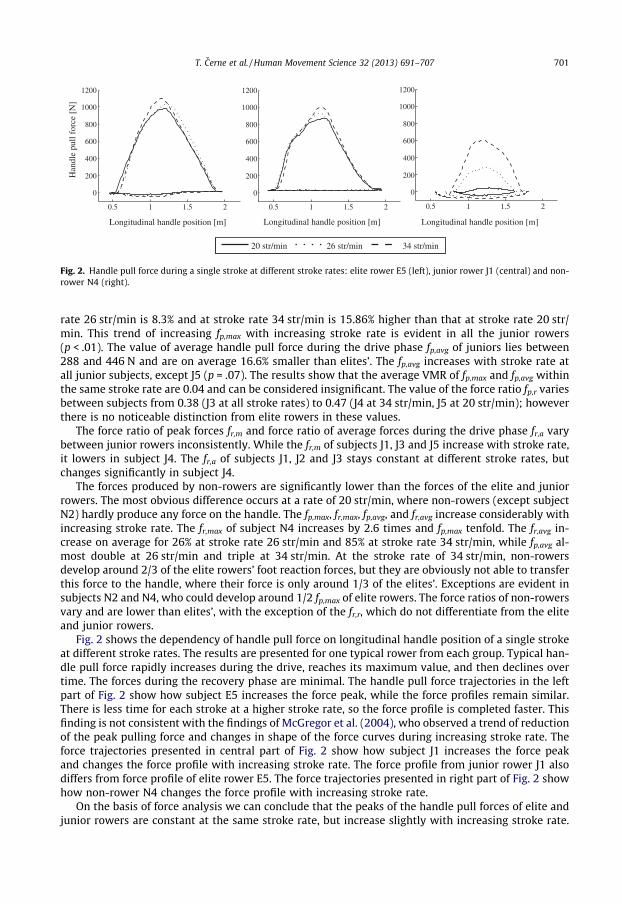
3.6. Trunk inclination
Trunk inclination is the most important parameter of body posture during the stroke (Lamb, 1989;Nolte, 2005). We examined the angle of trunk inclination at the beginning and end of the drive phase.Fig. 4 shows the angle of trunk inclination for all analyzed strokes at the instant of the beginning and
Fig. 5. The instant of peak torque at knee joint (left) and the instant of peak torque at LS joint (right) regarding handle position.
704 T. Cerne et al. / Human Movement Science 32 (2013) 691–707
end of the drive phase for elite, junior, and non-rowers. The averaged measured values are representedby symbols together with standard deviation bar. As can be seen, the average trunk inclination angleof elite rowers is �34.29� (SD = 3.90�) at the start of the drive and 38.93� (SD = 4.27�) at the end. Juniorrowers have similar trunk inclination as elite rowers, with the exception of subject J2, who leans lessforward at the beginning of drive phase, and subject J4, who leans less backward at the end of thedrive phase. The average trunk inclination angle of junior rowers is �31.60� (SD = 8.31�) at the startof the drive and 43.96� (SD = 6.62�) at the end. Non-rowers lean significantly less than elite rowers.Comparable to elites, only subject N2 leans backwards more at the end of the drive. The average trunkinclination angle of non-rowers is �19.37� (SD = 8.15�) at the start of drive and 18.90� (SD = 18.73�) atthe end of the drive. There is no evident difference regarding stroke rates (p > .05), except in the angleat the end of the drive phase of elite rowers (p = .02); however, we cannot observe any pattern instroke dependency. We can conclude that the trunk inclination angle at the beginning and end ofthe drive phase of elite, junior and non-rowers stays constant with changing stroke rate. Elite and ju-nior rowers have similar range of trunk motion, while non-rowers demonstrate smaller motion range.
3.7. Body joint loadings
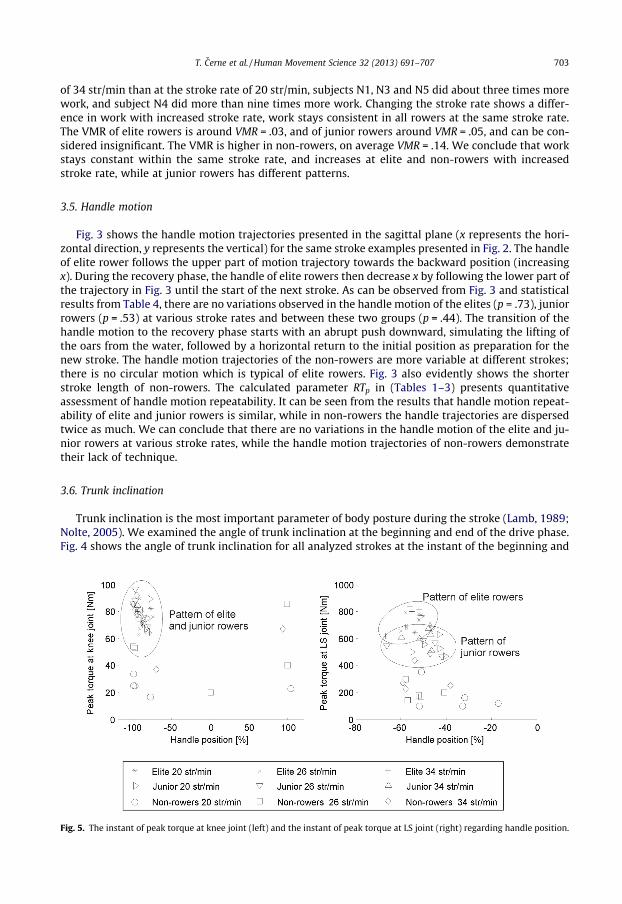
From Newton-Euler inverse dynamics analysis results we investigated the loadings in knee andlumbosacral (LS) joints in detail. The knee joint transmits the foot reaction force along the lowerextremities of the body while the LS joint is where lower back pain and injuries occur most frequently.Fig. 5 shows the maximal values of torque in the knee joint (left) and LS joint (right) against its occur-rence depending on handle position and stroke rate for all participating subjects.
Since the elite and junior rowers produce a larger force, their joint loadings are higher than those ofnon-rowers, as shown in Fig. 5. It is evident that all elite and junior rowers have a similar pattern ofthe instant of peak value occurrence, concentrated around �89% (SD = 7% for elite rowers, SD = 8% forjunior rowers) of handle position during a single stroke. Occurrences of peak values of non-rowers arescattered. The average value of peak torque at the knee joint of elite rowers is 74 Nm (SD = 8 Nm) at20 str/min, 74 Nm (SD = 10 Nm) at 26 str/min and 82 Nm (SD = 8 Nm) at 34 str/min. The average valueof peak torque at the knee joint of junior rowers is 79 Nm (SD = 8 Nm) at 20 str/min, 83 Nm(SD = 11 Nm) at 26 str/min and 81 Nm (SD = 17 Nm) at 34 str/min. The average value of peak torqueat the knee joint of non-rowers increases from 25 Nm (SD = 6 Nm) at 20 str/min, over 51 Nm(SD = 24 Nm) at 26 str/min, to 72 Nm (SD = 22 Nm) at 34 str/min.
Since the elite and junior rowers produce a larger force, their LS joint loadings are larger than thoseof non-rowers. Fig. 5 shows that all the elite rowers have a similar pattern regarding the instant ofpeak torque value occurrence, concentrated around �55% (SD = 5%) of handle position during a singlestroke and junior rowers around �48% (SD = 7%). The instants of peak value of non-rowers are morescattered, but occur all in the drive phase. The average value of peak torque at LS joint of elite rowers
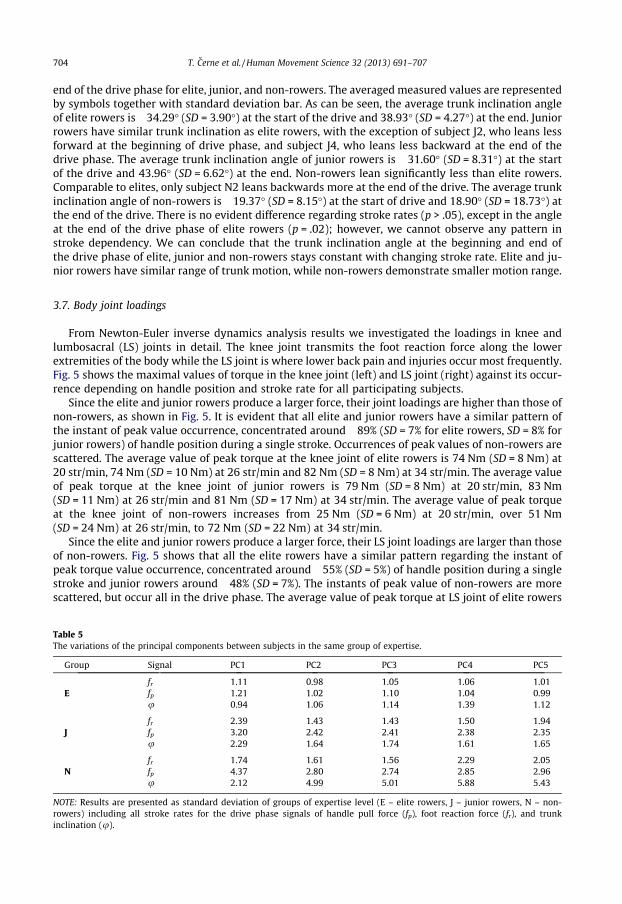
Table 5The variations of the principal components between subjects in the same group of expertise.
Group Signal PC1 PC2 PC3 PC4 PC5
fr 1.11 0.98 1.05 1.06 1.01E fp 1.21 1.02 1.10 1.04 0.99
u 0.94 1.06 1.14 1.39 1.12
fr 2.39 1.43 1.43 1.50 1.94J fp 3.20 2.42 2.41 2.38 2.35
u 2.29 1.64 1.74 1.61 1.65
fr 1.74 1.61 1.56 2.29 2.05N fp 4.37 2.80 2.74 2.85 2.96
u 2.12 4.99 5.01 5.88 5.43
NOTE: Results are presented as standard deviation of groups of expertise level (E – elite rowers, J – junior rowers, N – non-rowers) including all stroke rates for the drive phase signals of handle pull force (fp), foot reaction force (fr), and trunkinclination (u).
-10 -5 0 5
-10
-5
0
5
Handle pull force
-10 -5 0 5
-10
-5
0
5
Foot reaction force
-10 -5 0 5
-10
-5
0
5
Trunk inclination
Elite Junior Non-rowers
pattern of elite pattern of elite pattern of elite
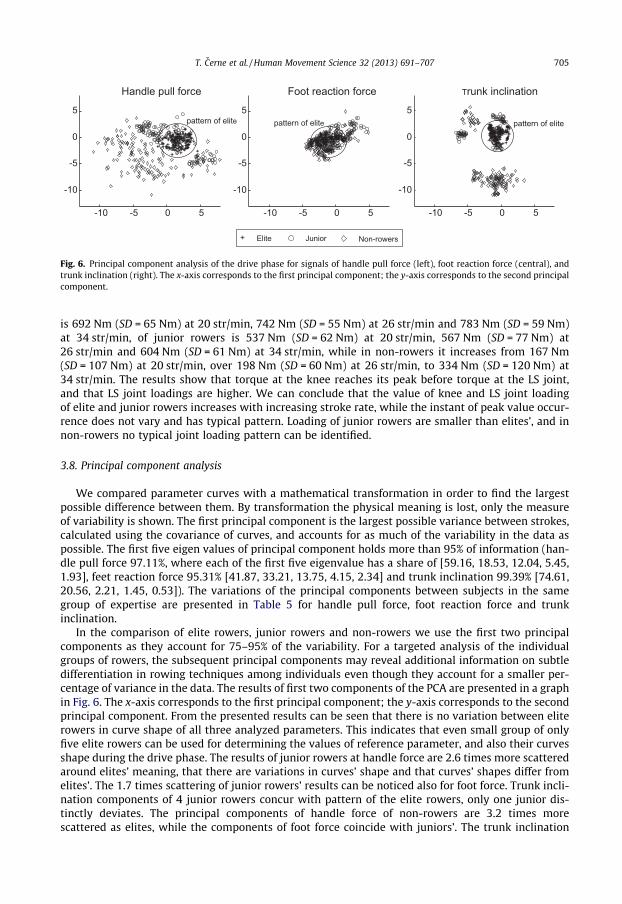
Fig. 6. Principal component analysis of the drive phase for signals of handle pull force (left), foot reaction force (central), andtrunk inclination (right). The x-axis corresponds to the first principal component; the y-axis corresponds to the second principalcomponent.
T. Cerne et al. / Human Movement Science 32 (2013) 691–707 705
is 692 Nm (SD = 65 Nm) at 20 str/min, 742 Nm (SD = 55 Nm) at 26 str/min and 783 Nm (SD = 59 Nm)at 34 str/min, of junior rowers is 537 Nm (SD = 62 Nm) at 20 str/min, 567 Nm (SD = 77 Nm) at26 str/min and 604 Nm (SD = 61 Nm) at 34 str/min, while in non-rowers it increases from 167 Nm(SD = 107 Nm) at 20 str/min, over 198 Nm (SD = 60 Nm) at 26 str/min, to 334 Nm (SD = 120 Nm) at34 str/min. The results show that torque at the knee reaches its peak before torque at the LS joint,and that LS joint loadings are higher. We can conclude that the value of knee and LS joint loadingof elite and junior rowers increases with increasing stroke rate, while the instant of peak value occur-rence does not vary and has typical pattern. Loading of junior rowers are smaller than elites’, and innon-rowers no typical joint loading pattern can be identified.
3.8. Principal component analysis
We compared parameter curves with a mathematical transformation in order to find the largestpossible difference between them. By transformation the physical meaning is lost, only the measureof variability is shown. The first principal component is the largest possible variance between strokes,calculated using the covariance of curves, and accounts for as much of the variability in the data aspossible. The first five eigen values of principal component holds more than 95% of information (han-dle pull force 97.11%, where each of the first five eigenvalue has a share of [59.16, 18.53, 12.04, 5.45,1.93], feet reaction force 95.31% [41.87, 33.21, 13.75, 4.15, 2.34] and trunk inclination 99.39% [74.61,20.56, 2.21, 1.45, 0.53]). The variations of the principal components between subjects in the samegroup of expertise are presented in Table 5 for handle pull force, foot reaction force and trunkinclination.
In the comparison of elite rowers, junior rowers and non-rowers we use the first two principalcomponents as they account for 75–95% of the variability. For a targeted analysis of the individualgroups of rowers, the subsequent principal components may reveal additional information on subtledifferentiation in rowing techniques among individuals even though they account for a smaller per-centage of variance in the data. The results of first two components of the PCA are presented in a graphin Fig. 6. The x-axis corresponds to the first principal component; the y-axis corresponds to the secondprincipal component. From the presented results can be seen that there is no variation between eliterowers in curve shape of all three analyzed parameters. This indicates that even small group of onlyfive elite rowers can be used for determining the values of reference parameter, and also their curvesshape during the drive phase. The results of junior rowers at handle force are 2.6 times more scatteredaround elites’ meaning, that there are variations in curves’ shape and that curves’ shapes differ fromelites’. The 1.7 times scattering of junior rowers’ results can be noticed also for foot force. Trunk incli-nation components of 4 junior rowers concur with pattern of the elite rowers, only one junior dis-tinctly deviates. The principal components of handle force of non-rowers are 3.2 times morescattered as elites, while the components of foot force coincide with juniors’. The trunk inclination
706 T. Cerne et al. / Human Movement Science 32 (2013) 691–707
of non-rowers shows clusters of components, where clusters correspond to subjects. This means thatnon-rowers row with consistent pattern, but this pattern deviates from the pattern of elite rowers.
4. Conclusions
In the paper, biomechanical parameters were analyzed for ergometer rowing. Three groups of dif-ferently skilled rowers were compared regarding their technique and stroke rate dependency.
The results show noticeable distinctions between the elite, junior, and non-rowers. It was demon-strated that the elite rowers use a similar and consistent rowing technique at all stroke rates, tech-nique of junior rowers use in general the similar principles, but has some deviations, while thetechnique of non-rowers varies. The handle motion and trunk inclination angle at the beginning ofthe drive phase of elite and junior rowers are constant, and are not dependent on the stroke rate.The stroke length of elite rowers is constant and not dependent on the stroke rate, while junior rowerschange stroke length with stroke rate. The ratio of stroke phases, maximum forces, stroke work andjoint loadings of elite and junior rowers are constant at the same stroke rate but dependent on thestroke rate.
Our analysis revealed that the technique of elite rowers is very consistent regardless of stroke rate.With the assumption that elite rowers row properly, the differences in the parameters can be used asdescriptors of irregularities in ergometer rowing technique that lead to poor performance. Junior row-ers differentiate from elite rowers in parameters that are linked with their strength and consecutivelywith intensity of rowing: peak and average foot reaction force, peak and average handle pull force,work, knee, and LS-joint torque, where values of junior rowers are lower than elites’. The juniors’ han-dle pull force profile, which is the rowing driving force, evidently distinguish from the elites’.
The technique of non-rowers’ vary significantly. The length of a stroke, the handle pull force andthe foot reaction force are smaller, while the differences are evident in the handle motion trajectoryand body posture during the stroke. Although the stroke length of non-rowers lengthens with increas-ing stroke rate, it is constant at the same stroke rate. Non-rowers do not change the ratio of strokephases. Peak and average forces and work increase more with increasing stroke rate. Although non-rowers show lack of technique, and change it at different stroke rates, they have good consistencyat the same stroke rate.
In this study, only male subjects of limited age range participated. The results acquired on this spe-cific group and the conclusions drawn may not generalize well to both genders and all ages.
The main disadvantage of our study is considering the trunk as a single lever. Simplification im-posed by a single segment trunk model causes an error in trunk inclination and LS joint loading assess-ment. We estimated error in LS joint loading using data from junior rowers, where position of LS jointwas measured with an additional marker and trunk represented as a body with two segments. Error isestimated to be less than 3% of maximal torque value around the transversal direction. More impor-tantly, the simplification imposed by a single segment trunk model loses information of flexionthrough the spine. This information is crucial for proper postural guidance and proper postural controlthroughout training. A new sensory system which ensures replication and is practical for utilization isin development and will be used in a training platform in the future. A wearable system of inertialmeasurement units that are placed at several places on the trunk will also capture information abouttrunk inclination and flexion throughout the spine. In this study, a single segment trunk assumptionwas employed only to search for patterns, and existence of differences in trunk inclination and LS jointloadings between differently skilled rowers. Another disadvantage of our study is usage of Newton-Euler inverse dynamics for calculating body joint loadings, which does not take into considerationforces on the seat. A method that would take into consideration simultaneously all contact forceswould estimate the forces at the joints, especially at the LS joint, more accurately.
On the basis of the identified parameters that are stroke rate dependent (duration of stroke phases,peak and average foot reaction force, peak and average handle pull force, work, peak knee and LS jointloadings), parameters that are consistent regardless stroke rate (stroke length, handle motion, trunkinclination angle, handle pull force profile, the instant of occurrence of peak knee and LS joint load-ings), and classify rowers’ skill, we thus propose an ergometer rowing system which would track
T. Cerne et al. / Human Movement Science 32 (2013) 691–707 707
the identified classifying biomechanical parameters. After accomplished stroke cycle the systemwould calculate the stroke parameters, compare them with pre-recorded reference values of elite row-ers, and advice the user for improvements. Further research will focus on investigating which typesand means of feedback achieve improved technique and decreased injury on an ergometer. Presenta-tion of virtual mirror, graphs, parameters’ values, text and sound instructions, and sound effects willbe considered keeping in mind the effectiveness of information transfer (Tzetzis, Mantis, Zachopoulou,& Kioumourtzoglou, 1999).
Acknowledgments
The authors would like to thank Andrej Barbiš, the test subjects, Rowing Club Bled, and RowingClub Ljubljanica, Slovenia for their cooperation in experimental data acquisition.
The authors acknowledge the Republic of Slovenia Ministry of Higher Education, Science and Tech-nology Grant ‘‘Motion Analysis and Synthesis in Man and Machine’’ (P2-0228C).
The research work of the first author is partly financed by the European Union, European SocialFund, the framework of the Operational Programme for Human Resources Development for the Period2007–2013.
References
Baca, A., & Kornfeind, P. (2008). A feedback system for coordination training in double rowing. The Engineering of Sport, 7,659–668.
Cerne, T., Kamnik, R., & Munih, M. (2011). The measurement setup for real-time biomechanical analysis of rowing on anergometer. Measurement, 44, 1819–1827.
Cohen, J. (1973). Eta-squared and partial eta-squared in fixed factor ANOVA designs. Educational and Psychological Measurement,33, 107–112.
Consiglieri, L., & Pires, E. B. (2009). An analytical model for the ergometer rowing: Inverse multibody dynamics analysis.Computer Methods in Biomechanical and Biomedical Engineering, 12, 469–479.
Fothergill, S. (2010). Examining the effect of real-time visual feedback on the quality of rowing technique. Procedia Engineering,2, 3083–3088.
Hahn, D., Schwirtz, A., & Huber, A. (2005). Anthropometric standardisation of multiarticular leg extension movements: Atheoretical study. Isokinetics and Exercise Science, 13(2), 95–101.
Hase, K., Andrews, B. J., Zavatsky, A. B., & Halliday, S. E. (2002). Biomechanics of Rowing. JJSME Internationl Journal Series C, 45,1082–1092.
Hase, K., Kaya, M., Zavatsky, A. B., & Halliday, S. E. (2004). Musculoskeletal loads in ergometer rowing. Journal of AppliedBiomechanics, 20, 317–323.
Hawkins, D. (2000). A new instrumentation system for training rowers. Journal of Biomechanics, 33, 241–245.Henry, J. C., Clark, R. R., McCabe, R. P., & Vanderby, R. (1995). An evaluation of instrumented tank rowing for objective
assessment of rowing performance. Journal of Sports Sciences, 13, 199–206.Kazunori, H., Motoshi, K., Zavatsky, A. B., & Halliday, S. E. (2004). Musculoskeletal loads in ergometer rowing. Journal of Applied
Biomechanics, 20, 317–323.Kleshnev, V. (2003). Q&A. Rowing Biomechanics Newsletter, 3, 1.Lamb, D. H. (1989). A kinematic comparison of ergometer and on-water rowing. American Journal of Sports Medicine, 17,
367–373.MacFarlane, D., Edmond, I., & Walmsley, A. (1997). Instrumentation of an ergometer to monitor the reliability of rowing
performance. Journal of Sports Sciences, 15, 167–173.McGregor, A. H., Bull, A. M., & Byng-Maddick, R. (2004). A comparison of rowing technique at different stroke rates: A
description of sequencing, force production and kinematics. International Journal of Sports Medicine, 25, 465–470.Nolte, V. (2005). Rowing faster. Champaign, USA: Human Kinetics Publishers.Novak, D., Ziherl, J., Olenšek, A., Milavec, M., Podobnik, J., Mihelj, M., et al (2010). Psychophysiological responses to robotic
rehabilitation tasks in stroke. IEEE Transactions in Neural Systems and Rehabilitation Engineering, 18, 351–361.Page, P., & Hawkins, D. (2003). A real-time biomechanical feedback system for training rowers. Sports Engineering, 6, 67–79.Pudlo, P., Pinti, A., & Lepoutre, F. (2005). Experimental laboratory apparatus to analyze kinematics and 3D kinetics in rowing.
Sports Engineering, 8, 39–46.Redgrave, S. (1995). Complete book of rowing. Saint Cloud, GB: Partridge Press.Rosow, E. (1991). A comparative study of rowing biomechanics. Proceedings of the 17th Annual Northeast Bioengineering
Conference (pp. 271–272). USA.Rumball, J. S., Lebrun, C. M., Di Ciacca, S. R., & Orlando, K. (2005). Rowing injuries. Sports Medicine, 35, 537–555.Sciavicco, L., & Siciliano, B. (2001). Modelling and control of robot manipulators. Springer.Tzetzis, G., Mantis, K., Zachopoulou, E., & Kioumourtzoglou, E. (1999). The effect of modeling and verbal feedback on skill
learning. Journal of Human Movement Studies, 36, 137–151.