human performance evaluation of light vehicle brake assist
TRANSCRIPT
DOT HS 811 251 April 2010
Human Performance Evaluation of Light Vehicle Brake Assist Systems: Final Report

DISCLAIMER
This publication is distributed by the U.S. Department of Transportation, National Highway Traffic Safety Administration, in the interest of information exchange. The opinions, findings, and conclusions expressed in this publication are those of the authors and not necessarily those of the Department of Transportation or the National Highway Traffic Safety Administration. The United States Government assumes no liability for its contents or use thereof. If trade names, manufacturers’ names, or specific products are mentioned, it is because they are considered es-sential to the object of the publication and should not be construed as an endorsement. The United States Government does not endorse products or manufacturers.

REPORT DOCUMENTATION PAGE Form Approved OMB No. 0704-0188
1. AGENCY USE ONLY (Leave blank) 2. REPORT DATE
April 2010
3. REPORT TYPE AND DATES COVERED
Draft Final Report
May 2006 – April 2009
4. TITLE AND SUBTITLE Human Performance Evaluation of Light Vehicle Brake Assist Systems: Final Report
5. FUNDING NUMBERS
DTNH22-05-D-01019, Task Order # 8 6. AUTHOR(S)
Gregory M. Fitch, Myra Blanco, Justin F. Morgan, Jeanne C. Rice, Amy Wharton, Walter W. Wierwille, and Richard J. Hanowski.
7. PERFORMING ORGANIZATION NAME(S) AND ADDRESS(ES) Center for Truck and Bus Safety Virginia Tech Transportation Institute 3500 Transportation Research Plaza (0536) Blacksburg, VA 24061
8. PERFORMING ORGANIZATION REPORT NUMBER
9. SPONSORING/MONITORING AGENCY NAME(S) AND ADDRESS(ES) U.S. Department of Transportation National Highway Traffic Safety Administration 1200 New Jersey Avenue, SE Washington, DC 20590
10. SPONSORING/MONITORING AGENCY REPORT NUMBER
DOT HS 811 251
11. SUPPLEMENTARY NOTES This project was managed by Dr. Paul Rau of the National Highway Traffic Safety Administration.
12a. DISTRIBUTION/AVAILABILITY STATEMENT Document is available to the public from the National Technical Information Service www.ntis.gov
12b. DISTRIBUTION CODE
13. ABSTRACT (Maximum 200 words) The Brake Assist System (BAS) is a safety feature that supplements drivers’ inadequate braking force during panic braking maneuvers upon the detection of a rapid brake pedal application. This report presents an evaluation of drivers’ panic braking performance using BAS. Two vehicles with electronic BASs were selected: a 2006 Mercedes-Benz R350 and a 2007 Volvo S80. Sixty-four participants, balanced for age and gender, drove one of the instrumented vehicles at 45 mph and stopped at an unexpected barricade. Following debriefing, drivers performed another braking maneuver at the barricade, were shown how to perform a hard stop, and performed hard-braking maneuvers in which BAS was either enabled or disabled. Twenty-eight percent of drivers activated BAS subsequent to the demonstration. In the most conservative analysis, where the effect of BAS activation was isolated from driver panic-braking variability, it was found that BAS-active stopping distances were on average 1.43 ft (s.e. = 1.19 ft) shorter than BAS-disabled stopping distances. Yet, two drivers, who differed in age, sex, and vehicle driven, exhibited reductions in stopping distance exceeding 10 ft. Overall, the as-tested BAS has potential safety benefit that could be accrued from reduced stopping distance, but were not realized in this evaluation. Moreover, BAS implementations that do not completely rely on the driver may offer greater safety benefits. 14. SUBJECT TERMS Braking, Human Performance, Panic Braking, Emergency Braking, Brake Assist, Driver Assistance
15. NUMBER OF PAGES
279
16. PRICE CODE
17. SECURITY CLASSIFICATION OF REPORT
Unclassified
18. SECURITY CLASSIFICATION OF THIS PAGE
Unclassified
19. SECURITY CLASSIFICATION OF ABSTRACT
20. LIMITATION OF ABSTRACT
NSN 7540-01-280-5500 Standard Form 298 (rev. 2-89) Prescribed by ANSI Std. 239-18, 298-102
i

EXECUTIVE SUMMARY
INTRODUCTION
When performing a panic-braking maneuver, drivers have been shown to apply the brakes faster and more vigorously than normal in an attempt to stop the vehicle as quickly as possible (Hara, Ohta, Yamamoto, & Yoshida, 1998). Yet, many drivers fail to engage the vehicle’s maximum braking potential (Breuer, Faulhaber, Frank, & Gleissner, 2007). The Brake Assist System (BAS) safety feature addresses this human physical limitation by supplementing drivers’ braking input upon the detection of a rapid and sizeable brake pedal application.
This report presents a comprehensive evaluation of human braking performance with light vehicle BASs. The research presented in this report is the culmination of automotive industry insight, objective characterization tests of BASs, and an evaluation of human braking performance with BASs. The project tasks and their obtained findings are summarized below.
LITERATURE REVIEW
A literature review was performed to develop an understanding of BAS. Since its inception in 1996, BAS has taken many forms. Newer BASs are electronically activated, and include vacuum-booster BASs, anti-lock brake system (ABS)-based BASs, and hydraulic servo BASs. Older, less expensive, BASs are mechanically activated, and include vacuum-booster BASs and emergency valve BASs. A list of vehicles that offer BAS was prepared by searching automotive original equipment manufacturer (OEM) and automotive consumer websites, and by contacting dealerships. Furthermore, in surveying OEMs and Tier 1 suppliers, it was found that the technology was migrating towards electronically activated BASs. Therefore, two vehicles that had electronic BASs were selected for the evaluation: a 2006 Mercedes-Benz R350 that had a vacuum-booster based BAS, and a 2007 Volvo S80 that had an ABS-pump-based BAS.
BAS CHARACTERIZATION AND PRELIMINARY BRAKING TESTS
Since little was known about each vehicle’s BAS, the next step of this research effort was to take the vehicles to the Vehicle Research Test Center (VRTC) in East Liberty, Ohio to have their BAS characterized. The characterization tests consisted of applying consistent brake pedal input via a mechanical brake controller and observing whether changes in stopping distance arose when BAS activated. These tests identified the BAS activation threshold, which is the minimum brake pedal displacement, application rate, and force necessary to activate BAS. The characterization tests showed that BAS activation in the Mercedes-Benz R350 produced stopping distances that were 20.2 ft shorter than stopping distances produced when BAS was disabled (when the brake pedal input approached the BAS activation threshold). In contrast, when the brake pedal controller applied maximum brake pedal input, BAS-active stops in the Mercedes-Benz R350 were 0.1 ft shorter than BAS-disabled stops. The results indicate that the benefits offered by the Mercedes-Benz R350 BAS are dependent on what baseline pedal input drivers apply. An activation threshold in the Volvo S80 was not found because its BAS could not be activated with the brake controller. However, a VRTC expert driver repeatedly activated the Volvo S80’s BAS. It was found, after examining the driver’s hard brake pedal input, that marginal variations were the difference between BAS activation and no activation. BAS
ii

activation, as well as ABS, was obtained by the data acquisitions system from each of vehicle’s network (information obtained with OEM’s technical assistance).
The results of these tests led to a concern that the high activation threshold would prevent participants from activating BAS in the human braking performance study. This concern was addressed by performing preliminary tests at VTTI. It was found that human subjects could activate BAS in either test vehicle; however, this occurred only after they were shown how to press the brake pedal in a manner sufficient to activate BAS. Based on these findings, the experimental design of the human performance evaluation portion of the study incorporated a hard-braking maneuver demonstration after the initial surprise braking trials. This demonstration helped ensure that drivers knew what was expected of them in the subsequent repeated braking trials.
HUMAN PERFORMANCE EVALUATION
Panic braking was operationally defined as a braking maneuver in which ABS activated and the vehicle came to a complete stop. Sixty-four participants, balanced for age and gender, drove one of two instrumented test vehicles down a closed-course test track at 45 mph. Participants had a vehicle familiarization period that included over 20 minutes of driving as well as several different braking maneuvers; these included normal braking similar to that performed at a stop sign as well as a higher deceleration stop. The higher deceleration braking maneuver was performed as a ruse, where the experimenter asked the participant to quickly stop as they passed a turnaround to perform a calibration. For the actual experiment, drivers were unknowingly presented with an inflatable barricade that spanned the entire road. Eleven drivers stopped the vehicle in response to the barricade. Once drivers consented to continue the experiment, a series of braking maneuvers were performed, including stopping at the inflatable barricade a second time, and performing numerous hard-braking maneuvers in response to an auditory alarm after learning how to perform panic-braking maneuvers. Drivers’ panic-braking performance was measured and the effect of BAS activation on vehicle stopping distance was evaluated using numerous approaches.
BAS was first evaluated by comparing the mean corrected stopping distance produced by ABS-active stops to the mean corrected stopping distance produced when both ABS and BAS activated. Because none of the drivers activated BAS when braking at the unexpected barricade, the data from these trials could not be used to evaluate BAS. When considering the panic-braking maneuvers performed to the anticipated barricade, the three BAS-active panic-braking maneuvers performed in the Volvo S80 were on average 11.98 ft shorter than the three BAS-inactive panic braking maneuvers performed in the Volvo S80. This difference was not found to be statistically significant (p = 0.2752). Drivers did not activate the Mercedes-Benz R350’s BAS when braking at the anticipated barricade. When considering the panic-braking maneuvers performed in the repeated braking session, the four BAS-active panic braking maneuvers performed in the Mercedes-Benz R350 were on average 4.61 ft shorter than the 25 BAS-inactive panic braking maneuvers performed in the Mercedes-Benz R350. This difference was found to be statistically significant (p = 0.0079). The 17 BAS-active panic-braking maneuvers performed in the Volvo S80 were on average 1.51 ft shorter than the 61 BAS-inactive panic-braking maneuvers performed in the Volvo S80. This difference was not statistically significant (p = 0.4209). Although not all findings were statistically significant, because the mean stopping
iii

distance differences were all in the same direction, there appears to be a trend that BAS activation reduces panic-braking stopping distance.
A potential criticism of the previous approach is that panic-braking performance varies across drivers. To isolate the effect of BAS on driver panic-braking performance, drivers’ individual differences should be controlled. The second approach accomplished this by only considering drivers that activated BAS in the repeated braking session and by comparing the stopping distances they produced when BAS activated to the stopping distances they produced when BAS was disabled. Here, the mean BAS-active stopping distance produced in the Mercedes-Benz R350 was 5.92 ft shorter than the mean BAS-disabled stopping distance produced in the Mercedes-Benz R350. This difference was not statistically significant (p = 0.5). The mean BAS-active stopping distance produced in the Volvo S80 was 0.61 ft shorter than the mean BAS-disabled stopping distance produced in the Volvo S80. This difference was also not statistically significant (p = 0.8311). Again, although these differences were not statistically significant, because all of the mean stopping distance differences were in the same direction, there appears to be a trend that BAS activation reduces panic-braking stopping distance. Furthermore, it is worth pointing out that one Mercedes-Benz R350 driver and one Volvo S80 driver (who differed in age and gender) exhibited reductions in stopping distance exceeding 10 ft when BAS activated. Table 1 summarizes the corrected stopping distance results by BAS activation.
Table 1. Summary of Corrected Stopping Distances by BAS Activation
Condition 2006 Mercedes-Benz
R350 2007 Volvo S80 Overall
Unexpected Stop
BAS Inactive NA NA NA
BAS Active NA NA NA
Difference NA NA NA
Anticipated Stop
BAS Inactive NA 94.97 ft (n=3) 94.97 ft (n=3)
BAS Active NA 82.98 ft (n=3) 82.98 ft (n=3)
Difference NA 11.98 (p = 0.2752) 11.98 (p = 0.2752)
Repeated Braking Session
BAS Inactive or Disabled
71.86 ft (n=25) 74.56 ft (n=61) 73.78 ft (n=86)
BAS Active 67.25 ft (n=4) 73.05 ft (n=17) 71.94 ft (n=21)
Difference 4.61 (p = 0.0079) 1.51 ft (p = 0.4209) 1.84 ft (p = 0.2095)
Repeated Braking Session
(For just those Drivers that
Activated BAS)
BAS Disabled 72.04 ft (n=2) 73.33 ft (n=11) 73.13 ft (n=13)
BAS Active 66.12 ft (n=2) 72.72 ft (n=11) 71.70 ft (n=13)
Difference 5.92 ft (p = 0.5) 0.61 ft (p = 0.8311) 1.43 ft (p = 0.6848)
iv

When drawing conclusions from these results, the reader should consider the few drivers that activated BAS in this study. None of the drivers activated BAS when braking at the unexpected barricade. Only three older male drivers activated BAS when braking at the anticipated barricade in the Volvo S80. After drivers were instructed on how to perform panic-braking maneuvers and repeatedly performed hard-braking maneuvers, 4 drivers activated BAS in the Mercedes-Benz R350, while 14 drivers activated BAS in the Volvo S80. When just considering the 18 drivers that activated BAS in the repeated braking session, three drivers were older females (17 percent), two drivers were older males (11 percent), five drivers were younger females (5 percent), and eight drivers were younger males (44 percent). Here, younger drivers were found to be more likely to activate BAS than older drivers (p = 0.0593), while male drivers were not found to be more likely to activate BAS than female drivers (p = 0.6374). Table 2 summarizes which drivers activated BAS.
Table 2. Drivers that Activated BAS in the Repeated Braking Session
Female Male Total
Older 3 (17%) 2 (11%) 5 (28%)
Younger 5 (28%) 8 (44%) 13 (72%)
Total 8 (45%) 10 (55%) 18 (100%)
The panic-braking maneuvers performed in the repeated braking session were analyzed to investigate whether BAS equally supports older and younger drivers. Older drivers’ mean stopping distance when BAS activated was 4.06 ft shorter than their mean stopping distance when BAS was inactive. However, this difference was not statistically significant (p = 0.0938). The mean BAS-active stopping distance that younger drivers produced was 0.59 ft shorter than the mean BAS-inactive stopping distance they produced. This difference was also not statistically significant (p = 0.8591). When just considering the drivers that activated BAS in the repeated braking session, the mean BAS-active stopping distance produced by the two older drivers was 5.44 ft shorter than the mean BAS-disabled stopping distance they produced. This difference was not statistically significant (p = 0.5000). Similarly, the mean BAS-active stopping distance produced by the 11 younger drivers was 0.70 ft shorter than the mean BAS-disabled stopping distance they produced. This difference was also not statistically significant (p = 0.1671).
The panic-braking maneuvers performed in the repeated braking session were also analyzed to investigate whether BAS equally supports female and male drivers. It was found that the mean BAS-active stopping distance produced by female drivers was 1.60 ft shorter than the mean BAS-inactive stopping distance they produced. This difference was not statistically significant (p = 0.3851). The mean BAS-active stopping distance produced by male drivers was 1.93 ft shorter than the mean BAS-inactive stopping distance they produced. This difference was also not statistically significant (p = 0.4828). When just considering the drivers that activated BAS in the repeated braking session, the mean BAS-active stopping distance produced by five female drivers was 1.38 ft shorter than the mean BAS-disabled stopping distance they produced. This difference was not statistically significant (p = 0.6250). Similarly, the mean BAS-active
v

stopping distance produced by the eight male drivers was 1.46 ft shorter than the mean BAS-disabled stopping distance they produced. This difference was also not statistically significant (p = 0.4642). An analysis of drivers’ questionnaire responses indicated that they could not detect when BAS activated. A Signal Detection Theory (SDT) analysis also exemplified that drivers were not sensitive to the perception of BAS activation. Despite these findings, drivers indicated that they liked BAS and would purchase a vehicle that came equipped with it. However, these favorable ratings may be attributed to the allure of the safety feature, and not necessarily from experiencing greater decelerations and shorter stopping distances when it activated.
CONCLUSIONS
The BAS safety feature requires drivers to press the brake pedal in a specific manner for it to activate. The human performance evaluation of light vehicle BASs investigated the percentage of drivers that activated BAS, as well as what reductions in stopping distance those drivers experienced when it activated. It was found that none of the drivers activated BAS when braking at the unexpected barricade, three drivers activated BAS when braking at the anticipated barricade, and 28 percent of drivers activated BAS after they were shown how to perform panic-braking maneuvers. This suggests that BAS would benefit the 28 percent of drivers capable of physically pressing the brake pedal in a manner that activates BAS. Furthermore, after isolating the effect of BAS activation from driver variability in panic-braking performance, BAS-active stopping distances were found to be 1.43 ft (s.e. = 1.19 ft) shorter than BAS-disabled stopping distances. However, this difference was not statistically significant. Two drivers (who differed in age, sex, and vehicle driven) did exhibit reductions in stopping distance exceeding 10 ft when BAS activated. Overall, the as-tested BAS has potential safety benefit that could be accrued from reduced stopping distance, but were not realized in this evaluation.
The BAS objective of helping drivers achieve a vehicle’s maximum braking potential during panic-braking maneuvers is practical and important. However, the as-tested BAS completely relies on the driver. This is because it is dependent on human input to activate. A vehicle travelling at 45 mph will travel 99 ft from the point a driver perceives a crash threat to the point that a braking response is initiated (assuming a brake-response time of 1.5 s). This distance can be exacerbated if the driver is not looking forward at the time the crash threat develops. Several automobile OEMs have addressed this issue by developing BASs that recognize crash threats and automatically supplement the driver’s braking performance when needed. Systems, such as the Mercedes-Benz Brake Assist PLUS with PRE-SAFE brake (Breuer, et al., 2007), the Volvo Collision Warning System with brake support, the Honda Collision Mitigation Brake System, the Toyota Pre-Crash Safety system, and General Motors’ Vehicle-to-Vehicle technology, that continuously scan the forward roadway, assess crash threat, alert the driver, activate the necessary deceleration upon braking input, or engage the vehicle’s brakes when a collision becomes unavoidable, stand to significantly reduce stopping distance compared to systems that depend upon a driver response to activate. Future research should explore the benefits and potential unintended consequences provided by these advanced BASs to drivers’ panic-braking performance.
vi

GLOSSARY OF ACRONYMS
AASHTO American Association of State Highway and Transportation Officials ABS Anti-Lock Brake System ANOVA Analysis of Variance BAS Brake Assist System BRT Brake Response Time CAN Controller Area Network DAS Data Acquisition System DGPS Differential Global Positioning System DOT United States Department of Transportation EBA Electronic Brake Assist ECU Electronic Control Unit ESC Electronic Stability Control FHWA Federal Highway Administration GPS Global Positioning System GVWR Gross Vehicle Weight Rating IRB Institutional Review Board ITE Institute of Transportation Engineers ITS Intelligent Transportation Systems LED Light Emitting Diode MES Maneuver Entrance Speed NADS National Advanced Driving Simulator NHTSA National Highway Traffic Safety Administration OEM Original Equipment Manufacturer QA Quality Assurance RQ Research Question SAE Society of Automotive Engineers SDT Signal Detection Theory SMC Fluid Pressure Shut-off Valve SRC Inlet Valve TOM Task Order Manager TRC Transportation Research Center, Inc. TTC Time to Collision VDA Vehicle Dynamics Area VDOT Virginia Department of Transportation VRTC NHTSA Vehicle Research Test Center VTTI Virginia Tech Transportation Institute
vii

TABLE OF CONTENTS
EXECUTIVE SUMMARY ........................................................................................................................................II
INTRODUCTION ......................................................................................................................................................... II LITERATURE REVIEW ............................................................................................................................................... II BAS CHARACTERIZATION AND PRELIMINARY BRAKING TESTS ............................................................................... II HUMAN PERFORMANCE EVALUATION ..................................................................................................................... III CONCLUSIONS ......................................................................................................................................................... VI
GLOSSARY OF ACRONYMS .............................................................................................................................. VII
LIST OF FIGURES................................................................................................................................................. XII
LIST OF TABLES ................................................................................................................................................. XIX
CHAPTER 1. INTRODUCTION ............................................................................................................................... 1
CHAPTER 2. RESEARCH QUESTIONS AND OPERATIONAL DEFINITIONS.............................................2
RESEARCH QUESTIONS .............................................................................................................................................. 2 The Brake Assist Effect......................................................................................................................................... 2 Role of Expectancy............................................................................................................................................... 2 Driver Panic-braking Performance ..................................................................................................................... 2
OPERATIONAL DEFINITIONS ...................................................................................................................................... 3
CHAPTER 3. LITERATURE REVIEW................................................................................................................... 4
IDENTIFYING PANIC-BRAKING ................................................................................................................................... 4 HOW DOES BRAKE ASSIST WORK? ...........................................................................................................................6 TYPES OF BRAKE ASSIST ........................................................................................................................................... 6
Electronic Brake Assist Systems........................................................................................................................... 7 Mechanical Brake Assist Systems ...................................................................................................................... 11 Brake Assist Timing and Force .......................................................................................................................... 11
DOES BRAKE ASSIST REALLY HELP? ......................................................................................................................14 THE EVALUATION OF BRAKE ASSIST SYSTEMS .......................................................................................................15
Panic versus Best-Effort Braking ...................................................................................................................... 15 Unexpected versus Anticipated Braking ............................................................................................................ 16 Braking Maneuvers ............................................................................................................................................ 17 Braking Surfaces ................................................................................................................................................ 18 Braking Initial Speeds ........................................................................................................................................ 19 Vehicle Weight ................................................................................................................................................... 19 Adhesion Coefficient .......................................................................................................................................... 20 Drag and Wind ................................................................................................................................................... 20 Road Slope ......................................................................................................................................................... 20 Vehicle Suspension Stiffness .............................................................................................................................. 20 Gender................................................................................................................................................................ 21 Age ..................................................................................................................................................................... 21 Braking Study Dependent Variables .................................................................................................................. 22 Existing Stopping Distance Protocol ................................................................................................................. 24
OEM, OEM SUPPLIERS, AND USDOT INPUT ..........................................................................................................24 The Future of Brake Assist System ..................................................................................................................... 24 Deactivating Brake Assist System ...................................................................................................................... 25 Adaptive Thresholds........................................................................................................................................... 25 Relationship to Driver Input .............................................................................................................................. 25 Minimum Conditions .......................................................................................................................................... 25
SUMMARY ............................................................................................................................................................... 26
viii

CHAPTER 4. BAS CHARACTERIZATION AND PRELIMINARY BRAKING TESTS ................................27
METHODS ................................................................................................................................................................ 27 Test Vehicles ...................................................................................................................................................... 27
MERCEDES-BENZ R350 RESULTS ...........................................................................................................................32 Brake Pedal Displacement Magnitude Threshold .............................................................................................. 32 Brake Pedal Application Rate Threshold ........................................................................................................... 33 Brake Pedal Force Threshold ............................................................................................................................ 35 Evaluation of BAS Effectiveness ........................................................................................................................ 38
VOLVO S80 RESULTS .............................................................................................................................................. 42 BAS Activation Threshold .................................................................................................................................. 42
SUMMARY ............................................................................................................................................................... 46 PRELIMINARY HUMAN BRAKING TESTS ..................................................................................................................47 SUMMARY ............................................................................................................................................................... 48
CHAPTER 5. HUMAN BRAKING PERFORMANCE EVALUATION .............................................................49
INTRODUCTION ........................................................................................................................................................ 49 METHODS ................................................................................................................................................................ 49
Participants ........................................................................................................................................................ 49 Instrumentation .................................................................................................................................................. 49 Virginia Smart Road .......................................................................................................................................... 51
EXPERIMENTAL DESIGN .......................................................................................................................................... 52 Independent Variables ....................................................................................................................................... 52 Dependent Variables.......................................................................................................................................... 53 Procedure ........................................................................................................................................................... 60
RESULTS .................................................................................................................................................................. 64 The Brake Assist Effect....................................................................................................................................... 65 Role of Expectancy........................................................................................................................................... 100 Driver Panic-braking Performance ................................................................................................................. 104
CHAPTER 6. DISCUSSION .................................................................................................................................. 116
THE BRAKE ASSIST EFFECT ................................................................................................................................... 116 DRIVER PANIC-BRAKING PERFORMANCE AND THE ROLE OF EXPECTANCY...........................................................119
CHAPTER 7. CONCLUSIONS ............................................................................................................................. 123
RECOMMENDATIONS ............................................................................................................................................. 123 FUTURE RESEARCH ............................................................................................................................................... 124 LESSONS LEARNED ................................................................................................................................................ 124
APPENDIX A. AUTOMOTIVE MANUFACTURER AND TIER 1 SUPPLIER SURVEY RESPONSES....126
INTRODUCTION ...................................................................................................................................................... 126 INTERVIEW FINDINGS ............................................................................................................................................ 126
BAS Operational Mechanism ........................................................................................................................... 126 Ability to Purposefully Disable BAS ................................................................................................................ 126 Cues to BAS Activation .................................................................................................................................... 127 BAS Actuation Method ..................................................................................................................................... 127 BAS Activation Conditions ............................................................................................................................... 128 BAS Deactivation Prior to a Complete Stop .................................................................................................... 128 BAS Packet ID Reporting ................................................................................................................................. 128 Packet ID-Based Disabling of BAS .................................................................................................................. 129 BAS Driver Adaptation .................................................................................................................................... 129 Target Population for BAS ............................................................................................................................... 130
SUMMARY ............................................................................................................................................................. 130
APPENDIX B. LIST OF VEHICLES OFFERING BAS ..................................................................................... 131
APPENDIX C. TIRE WEAR.................................................................................................................................. 133
ix

APPENDIX D. MANUFACTURER PROVIDED DESCRIPTION OF THE HEITZ BRAKE CONTROLLER ........................................................................................................................................ 135
INTENT ............................................................................................................................................................ 135 MODES OF OPERATION ............................................................................................................................... 135 COMPONENTS ............................................................................................................................................... 135 MECHANIZATION .......................................................................................................................................... 136 EXTERNAL CONNECTOR .............................................................................................................................. 136 USB MODULE................................................................................................................................................. 136 CAPABILITIES AND SCALING ...................................................................................................................... 136 INSTALLED WEIGHTS ................................................................................................................................... 137 POWER REQUIREMENT................................................................................................................................ 138 SAFETY CONSIDERATION ............................................................................................................................ 138
APPENDIX E. THE VIRGINIA SMART ROAD ................................................................................................ 139
WEATHER-MAKING CAPABILITY...........................................................................................................................139 VARIABLE LIGHTING TEST BED.............................................................................................................................139 PAVEMENT MARKINGS .......................................................................................................................................... 140 ON-SITE DATA ACQUISITION AND ROAD WEATHER INFORMATION SYSTEMS.......................................................140 DIFFERENTIAL GPS SYSTEM ................................................................................................................................. 141 ROAD ACCESS AND SURVEILLANCE ......................................................................................................................141 RESEARCH BUILDING AT THE SMART ROAD ..........................................................................................................142 CONTROL ROOM .................................................................................................................................................... 142 GARAGES ............................................................................................................................................................... 143 LABORATORIES ...................................................................................................................................................... 143 VEHICLE FLEET ..................................................................................................................................................... 143 VEHICLE INSTRUMENTATION ................................................................................................................................. 144
APPENDIX F. LOAD CELL.................................................................................................................................. 146
APPENDIX G. PARTICIPANT SCREENING FORM .......................................................................................147
APPENDIX H. STATEMENT OF INFORMED CONSENT..............................................................................155
APPENDIX I. VIRGINIA TECH IRB APPROVAL ........................................................................................... 161
APPENDIX J. PRE-PARTICIPATION SCREENING ....................................................................................... 162
VISUAL ACUITY TEST PROTOCOL AND SCRIPT ......................................................................................................162 HEARING LEVEL TEST PROTOCOL AND SCRIPT .....................................................................................................165 PROTOCOL FOR MEASURING WEIGHT AND HEIGHT...............................................................................................169
APPENDIX K. INFORMATION SHEET ............................................................................................................. 170
APPENDIX L. QUESTIONNAIRES..................................................................................................................... 172
SURPRISE BRAKING QUESTIONNAIRE ....................................................................................................................172 ANTICIPATED BRAKING QUESTIONNAIRE ..............................................................................................................176 BARRICADE FOLLOW-UP QUESTIONNAIRE.............................................................................................................179 REPEATED BRAKING QUESTIONNAIRE...................................................................................................................180 POST-BRAKING QUESTIONNAIRE...........................................................................................................................183
APPENDIX M. LIBRARY OF BRAKING MANEUVERS PERFORMED TO THE UNANTICIPATED BARRICADE ........................................................................................................................................................... 188
INTRODUCTION ...................................................................................................................................................... 188 DRIVERS WHO HAD A PANIC-BRAKING MANEUVER TO THE UNEXPECTED BRAKING MANEUVER ............................189
Driver 44 Panic-braking Maneuver to the Unexpected Barricade .................................................................. 189 Driver 47 Panic-Braking Maneuver to the Unexpected Barricade.................................................................. 190 Driver 53 Panic-Braking Maneuver to the Unexpected Barricade.................................................................. 191 Driver 57 Panic Braking Maneuver to the Unexpected Barricade .................................................................. 192
DRIVERS WHO DID NOT HAVE A PANIC BRAKING MANEUVER TO THE UNEXPECTED BARRICADE.............................193
x

Driver 9 Braking Maneuver to the Unexpected Barricade .............................................................................. 193 Driver 11 Braking Maneuver to the Unexpected Barricade ............................................................................ 194 Driver 19 Braking Maneuver to the Unexpected Barricade ............................................................................ 195 Driver 23 Braking Maneuver to the Unexpected Barricade ............................................................................ 196 Driver 25 Braking Maneuver to the Unexpected Barricade ............................................................................ 197 Driver 29 Braking Maneuver to the Unexpected Barricade ............................................................................ 198 Driver 59 Braking Maneuver to the Unexpected Barricade ............................................................................ 199
APPENDIX N. LIBRARY OF BRAKING MANEUVERS PERFORMED TO THE ANTICIPATED BARRICADE ........................................................................................................................................................... 200
INTRODUCTION ...................................................................................................................................................... 200 DRIVERS PANIC BRAKING MANEUVERS WITH A BAS ACTIVATION TO THE ANTICIPATED BARRICADE...............201
Driver 43 Panic Braking Maneuver to the Anticipated Barricade .................................................................. 201 Driver 48 Panic Braking Maneuver to the Anticipated Braking Maneuver.....................................................203
DRIVERS PANINC BRAKING MANEUVERS WITHOUT A BAS ACTIVATION TO THE ANTICIPATED BARRICADE.............204 Driver 58 Panic Braking Maneuver to the Anticipated Braking Maneuver.....................................................204 Driver 65 Panic Braking Maneuver to the Anticipated Braking Maneuver.....................................................205 Driver 69 Panic Braking Maneuver to the Anticipated Braking Maneuver.....................................................206
APPENDIX O. LIBRARY OF BRAKING MANEUVERS FOR DRIVERS THAT ACTIVATED BAS AT SOME POINT IN THE REPEATED BRAKING SESSION...............................................................................207
INTRODUCTION ...................................................................................................................................................... 207 Driver 10 Repeated Braking Session ............................................................................................................... 208 Driver 21 Repeated Braking Session ............................................................................................................... 211 Driver 26 Repeated Braking Session ............................................................................................................... 214 Driver 29 Repeated Braking Session ............................................................................................................... 217 Driver 43 Repeated Braking Session ............................................................................................................... 220 Driver 49 Repeated Braking Session ............................................................................................................... 223 Driver 50 Repeated Braking Session ............................................................................................................... 226 Driver 52 Repeated Braking Session ............................................................................................................... 229 Driver 55 Repeated Braking Session ............................................................................................................... 232 Driver 58 Repeated Braking Session ............................................................................................................... 235 Driver 62 Repeated Braking Session ............................................................................................................... 238 Driver 63 Repeated Braking Session ............................................................................................................... 241 Driver 64 Repeated Braking Session ............................................................................................................... 244 Driver 65 Repeated Braking Session ............................................................................................................... 247 Driver 70 Repeated Braking Session ............................................................................................................... 250
ACKNOWLEDGEMENTS .................................................................................................................................... 253
REFERENCES ........................................................................................................................................................ 254
xi

LIST OF FIGURES
Figure 1. Pedal Effort Plotted Against Time (Adapted from Yoshida et al., 1998) ...................... 4
Figure 2. Pedal Effort Plotted against Time during Panic and Normal Braking (Adapted from
Figure 3. Pressure Control during Panic Braking (Adapted from Hara, Ohta, Yamamoto, &
Figure 4. Diagram Illustrating how Vacuum Booster BAS and Other Braking Elements are
Figure 6. Components of Pump-motor-applied BAS (from Hara, Ohta, Yamamoto, &
Figure 7. Hydraulic Servo Brake (Accumulated Pressure Applied) BAS (from Yoshida et al.,
Figure 8. Timing of BAS Activation by Driver Brake Pedal Input (Adapted from Hara, Ohta,
Figure 9. Illustration of how the Regulation of Intake Fluid Depends on the Master Cylinder
Figure 14. Corrected Stopping Distance by Brake Pedal Displacement Magnitude for Tests
Figure 15. Corrected Stopping Distance by Brake Pedal Application Rate for Tests Performed
Figure 16. Corrected Stopping Distance by Brake Pedal Force Magnitude for Tests
Figure 17. Corrected Stopping Distance by Brake Pedal Application Rate (Holding Brake
Figure 19. Plot of Brake Pedal Displacement Magnitude (in) versus Time (s) at Activation Threshold for Two Stops (one with BAS Activated, the other with BAS Disabled) using the
Figure 20. Four Stops Performed by a VRTC Professional Driver. BAS Activated for Two
Hara, Ohta, Yamamoto, & Yoshida, 1998) .................................................................................... 5
Yoshida, 1998)................................................................................................................................ 6
Connected (from Yoshida et al., 1998) ........................................................................................... 7
Figure 5. Components of Vacuum Booster BAS (From Yoshida et al., 1998) ............................. 8
Yoshida, 1998)................................................................................................................................ 9
1998) ............................................................................................................................................. 10
Yamamoto, & Yoshida, 1998) ...................................................................................................... 12
Pressure at the Start of Braking (Adapted from Hara, Ohta, Yamamoto, & Yoshida, 1998) ....... 14
Figure 10. The 2006 Mercedes-Benz R350 ................................................................................. 28
Figure 11. The 2007 Volvo S80................................................................................................... 29
Figure 12. Brake Controller Mounted to the Driver Seat and Brake Pedal ................................. 30
Figure 13. Position of Fifth Wheel on the Mercedes-Benz R350 ................................................. 31
Performed at 45 mph ..................................................................................................................... 33
at 45 mph....................................................................................................................................... 34
Performed at 45 mph ..................................................................................................................... 36
Pedal Force Magnitude at 50 percent) at 45 mph ......................................................................... 37
Figure 18. Operational Envelope for the Mercedes-Benz BAS .................................................... 40
Mercedes-Benz R350 .................................................................................................................... 41
Stops; All Stops have Similar Braking Profiles and Initial Speeds. ............................................. 42
Figure 21. Brake Application Rate for the Four Stops over the First 0.09 s ................................ 43
xii

Figure 22. Four Stops Performed by a Human Driver (Stops 1 – 4). BAS Activated for Stops 3 and 4. Two Stops Performed by Mechanical Brake Controller (Stops 5 and 6) ....................... 44
Figure 36. Average Stopping Distance by BAS Activation. All BAS Activations in the
Figure 38. Average Corrected Stopping Distances for all BAS-Active Stops and BAS-
Figure 39. Corrected Stopping Distances for BAS-Active and BAS-Disabled Braking
Figure 40. Average Corrected Stopping Distance by BAS Activation Status for only Drivers
Figure 41. Driver 10, an Older Male Driving the Mercedes-Benz R350, had a Corrected
Figure 42. Driver 10, an Older Male driving the Mercedes-Benz R350, had a Corrected
Figure 43. Driver 65, a Younger Female, Driving the Volvo S80 had a Corrected Stopping
Figure 44. Driver 65, a Younger Female, Driving the Volvo S80, had a Corrected Stopping
Figure 23. The brake application rate over the first 0.22 s for all six stops. ................................. 45
Figure 24.The brake application rate for Stops 3 and 6 over the first 0.03 s. ............................... 46
Figure 25. Data Acquisition System Mounted in the Trunk of the Volvo S80 ........................... 50
Figure 26. Multiplex View from Vehicle Cameras ...................................................................... 51
Figure 27. Diagram of the Virginia Smart Road ........................................................................... 52
Figure 28. Fifth Wheel and Hitch Setup on the Volvo S80 .......................................................... 54
Figure 29. Diagram Showing Measurement Locations on Brake Pedal Pad ................................ 54
Figure 30. Plot of Predicted Values for Pedal Travel in Percent and Inches ............................... 56
Figure 31. Brake Pedal Displacement First Inflection Point ....................................................... 57
Figure 32. Maximum Brake Pedal Displacement ........................................................................ 58
Figure 33. Brake Pedal Modulation Example.............................................................................. 59
Figure 34. Location of Crossbow Inertial Measurement System in Mercedes-Benz R350 ......... 60
Figure 35. Inflatable Barricade use for Unexpected Braking Maneuver ...................................... 63
Anticipated Braking Maneuver Occurred using the Volvo S80 ................................................... 72
Figure 37. Corrected Stopping Distances for BAS-Active and BAS-Inactive Stops .................. 73
Inactive Stops in which ABS Activated in the Repeated Braking Session ................................... 78
Maneuvers Produced by Drivers that Activated BAS During the Repeated Braking Session ..... 80
that Activated BAS in the Repeated Braking Session .................................................................. 81
Stopping Distance of 63.41 ft. in the R2 Braking Maneuver ........................................................ 82
Stopping Distance of 73.98 ft. in the R3 Braking Maneuver ........................................................ 83
Distance of 72.93 ft. in the R1 Braking Maneuver ....................................................................... 84
Distance of 83.10 ft. in the R3 Braking Maneuver ....................................................................... 85
Figure 45. Corrected Stopping Distance by BAS Activation in the Mercedes-Benz R350 ........ 87
Figure 46. Corrected Stopping Distance by BAS Activation in the Volvo S80 ........................... 88
Figure 47. Mean Corrected Stopping Distances by BAS Activation ............................................ 89
xiii

Figure 48. Maximum Brake Pedal Force for Drivers Assigned to the Mercedes-Benz R350 ..... 91
Figure 50. Distribution of Brake Pedal Forces for Drivers Completing a Stop at an
Figure 51. Distribution of Brake Pedal Forces for Drivers Completing a Stop at an
Figure 52. Stages of Human Information Processing Relevant to Normal Braking
Figure 57. All-weather testing equipment with experimental lighting test bed installed on the
Figure 72. Driver 44, an older male driving the Volvo S80, activated ABS 2.35 seconds into
Figure 73. Driver 47, an older male driving the Volvo S80, activated ABS 1.7 seconds into
Figure 74. Driver 53, a younger female driving the Volvo S80, activated ABS 1.15 seconds
Figure 49. Maximum Brake Pedal Force for Drivers Assigned to the Volvo S80 ...................... 92
Unexpected Barricade................................................................................................................. 103
Anticipated Barricade ................................................................................................................. 103
Performance ................................................................................................................................ 120
Figure 53. Stages of Human Information Processing Relevant to Panic-Braking Performance 121
Figure 54. Mercedes Benz R350 tire wear over the course of the study .................................... 133
Figure 55. Volvo S80 tire wear over the course of the study ..................................................... 134
Figure 56. Fog, rain, and snow equipment installed on the Smart Road. .................................. 139
Smart Road.................................................................................................................................. 140
Figure 58. Bunker with DAS and weather station installed on the Smart Road. ....................... 141
Figure 59. Gate that restricts access to the Smart Road. ............................................................ 142
Figure 60. Smart Road control room and dispatcher monitoring research. ............................... 143
Figure 61. VTTI’s vehicle fleet on the Smart Road bridge. ...................................................... 144
Figure 62. Load Cell used in the study ....................................................................................... 146
Figure 63. Visual Acuity Chart Positioning................................................................................ 162
Figure 64. Audiometer ................................................................................................................ 165
Figure 65. Response Button........................................................................................................ 165
Figure 66. Headphones ............................................................................................................... 165
Figure 67. Ports ........................................................................................................................... 165
Figure 68. Power Cord Port ........................................................................................................ 165
Figure 69. Power Switch ............................................................................................................. 166
Figure 70. Keypad....................................................................................................................... 166
Figure 71. Braking Maneuver Library Legend ........................................................................... 188
the panic-braking maneuver. ....................................................................................................... 189
the panic-braking maneuver. ....................................................................................................... 190
into the panic-braking maneuver. ............................................................................................... 191
xiv

Figure 75. Driver 57, a younger male driving the Volvo S80, activated ABS 1.9 seconds into the panic braking maneuver. ....................................................................................................... 192
Figure 76. Driver 9, an older male driving the Mercedes-Benz R350, did not activate ABS in the braking maneuver. ................................................................................................................. 193
Figure 77. Driver 11, an older male driving the Mercedes-Benz R350, did not activate ABS in the braking maneuver. ................................................................................................................. 194
Figure 78. Driver 19, a younger female driving the Mercedes-Benz R350, did not activate ABS in the braking maneuver. .................................................................................................... 195
Figure 79. Driver 23, a younger female driving the Mercedes-Benz R350, did not activate ABS in the braking maneuver. .................................................................................................... 196
Figure 80. Driver 25, a younger male driving the Mercedes-Benz R350, did not activate ABS in the braking maneuver. ............................................................................................................. 197
Figure 81. Driver 29, a younger male driving the Mercedes-Benz R350, did not activate ABS in the braking maneuver. ............................................................................................................. 198
Figure 82. Driver 59, a younger male driving the Mercedes-Benz R350, did not activate ABS in the braking maneuver. ............................................................................................................. 199
Figure 83. Braking Maneuver Library Legend ........................................................................... 200
Figure 84. Driver 43, an older male driving the Volvo S80, activated BAS 0.1 second into the anticipated braking maneuver. .................................................................................................... 201
Figure 85. Driver 44, an older male driving the Volvo S80, activated BAS 0.1 second into the anticipated braking maneuver. .................................................................................................... 202
Figure 86. Driver 48, an older male driving the Volvo S80, activated BAS 0.1 second into the anticipated braking maneuver. .................................................................................................... 203
Figure 87. Driver 58, a younger male driving the Volvo S80, did not activate BAS during the anticipated braking maneuver. .................................................................................................... 204
Figure 88. Driver 65, a younger female driving the Volvo S80, did not activate BAS during the anticipated braking maneuver. .............................................................................................. 205
Figure 89. Driver 69, an older male driving the Volvo S80, did not activate BAS during the anticipated braking maneuver. .................................................................................................... 206
Figure 90. Braking Maneuver Library Legend ........................................................................... 207
Figure 91. Brake pedal displacement over the first 4 seconds of the R1 panic braking maneuver for Driver 10, an older male driving the Mercedes-Benz R350 ................................. 208
Figure 92. Brake pedal displacement over the first 4 seconds of the R2 panic braking maneuver for Driver 10, an older male driving the Mercedes-Benz R350 ................................. 209
Figure 93. Brake pedal displacement over the first 4 seconds of the R3 panic braking maneuver for Driver 10, an older male driving the Mercedes-Benz R350 ................................. 210
Figure 94. Brake pedal displacement over the first 3.5 seconds of the R1 panic braking maneuver for Driver 21, a younger female driving the Volvo S80 ............................................ 211
xv

Figure 95. Brake pedal displacement over the first 3.5 seconds of the R2 panic braking maneuver for Driver 21, a younger female driving the Volvo S80 ............................................ 212
Figure 96. Brake pedal displacement over the first 4 seconds of the R3 panic braking maneuver for Driver 21, a younger female driving the Volvo S80 ............................................ 213
Figure 97. Brake pedal displacement over the first 4 seconds of the R1 panic braking maneuver for Driver 26, a younger male driving the Mercedes-Benz R350 .............................. 214
Figure 98. Brake pedal displacement over the first 4 seconds of the R2 panic braking maneuver for Driver 26, a younger male driving the Mercedes-Benz R350 .............................. 215
Figure 99. Brake pedal displacement over the first 4 seconds of the R3 panic braking maneuver for Driver 26, a younger male driving the Mercedes-Benz R350 .............................. 216
Figure 100. Brake pedal displacement over the first 3.5 seconds of the R1 panic braking maneuver for Driver 29, a younger male driving the Mercedes-Benz R350 .............................. 217
Figure 101. Brake pedal displacement over the first 3.5 seconds of the R2 panic braking maneuver for Driver 29, a younger male driving the Mercedes-Benz R350 .............................. 218
Figure 102. Brake pedal displacement over the first 3.5 seconds of the R3 panic braking maneuver for Driver 29, a younger male driving the Mercedes-Benz R350 .............................. 219
Figure 103. Brake pedal displacement over the first 4 seconds of the R1 panic braking maneuver for Driver 43, a older male driving the Volvo S80 .................................................... 220
Figure 104. Brake pedal displacement over the first 4 seconds of the R2 panic braking maneuver for Driver 43, a older male driving the Volvo S80 .................................................... 221
Figure 105. Brake pedal displacement over the first 4 seconds of the R3 panic braking maneuver for Driver 43, an older male driving the Volvo S80 .................................................. 222
Figure 106. Brake pedal displacement over the first 3.5 seconds of the R1 panic braking maneuver for Driver 49, a younger male driving the Volvo S80 ............................................... 223
Figure 107. Brake pedal displacement over the first 3.5 seconds of the R2 panic braking maneuver for Driver 49, a younger male driving the Volvo S80 ............................................... 224
Figure 108. Brake pedal displacement over the first 3.5 seconds of the R3 panic braking maneuver for Driver 49, a younger male driving the Volvo S80 ............................................... 225
Figure 109. Brake pedal displacement over the first 3.5 seconds of the R1 panic braking maneuver for Driver 50, a younger female driving the Volvo S80 ............................................ 226
Figure 110. Brake pedal displacement over the first 3 seconds of the R2 panic braking maneuver for Driver 50, a younger female driving the Volvo S80 ............................................ 227
Figure 111. Brake pedal displacement over the first 3.5 seconds of the R3 panic braking maneuver for Driver 50, a younger female driving the Volvo S80 ............................................ 228
Figure 112. Brake pedal displacement over the first 3.5 seconds of the R1 panic braking maneuver for Driver 52, a younger female driving the Volvo S80 ............................................ 229
Figure 113. Brake pedal displacement over the first 3.5 seconds of the R2 panic braking maneuver for Driver 52, a younger female driving the Volvo S80 ............................................ 230
xvi

Figure 114. Brake pedal displacement over the first 3 seconds of the R3 panic braking maneuver for Driver 52, a younger female driving the Volvo S80 ............................................ 231
Figure 115. Brake pedal displacement over the first 3.5 seconds of the R1 panic braking maneuver for Driver 55, a younger female driving the Volvo S80 ............................................ 232
Figure 116. Brake pedal displacement over the first 3 seconds of the R2 panic braking maneuver for Driver 55, a younger female driving the Volvo S80 ............................................ 233
Figure 117. Brake pedal displacement over the first 4 seconds of the R3 panic braking maneuver for Driver 55, a younger female driving the Volvo S80 ............................................ 234
Figure 118. Brake pedal displacement over the first 2.5 seconds of the R1 panic braking maneuver for Driver 58, a younger male driving the Volvo S80 ............................................... 235
Figure 119. Brake pedal displacement over the first 3.5 seconds of the R2 panic braking maneuver for Driver 58, a younger male driving the Volvo S80 ............................................... 236
Figure 120. Brake pedal displacement over the first 3 seconds of the R3 panic braking maneuver for Driver 58, a younger male driving the Volvo S80 ............................................... 237
Figure 121. Brake pedal displacement over the first 3.5 seconds of the R1 panic braking maneuver for Driver 62, a younger male driving the Volvo S80 ............................................... 238
Figure 122. Brake pedal displacement over the first 3.5 seconds of the R2 panic braking maneuver for Driver 62, a younger male driving the Volvo S80 ............................................... 239
Figure 123. Brake pedal displacement over the first 3.5 seconds of the R3 panic braking maneuver for Driver 62, a younger male driving the Volvo S80 ............................................... 240
Figure 124. Brake pedal displacement over the first 5 seconds of the R1 panic braking maneuver for Driver 63, a younger male driving the Volvo S80 ............................................... 241
Figure 125. Brake pedal displacement over the first 3 seconds of the R2 panic braking maneuver for Driver 63, a younger male driving the Volvo S80 ............................................... 242
Figure 126. Brake pedal displacement over the first 2.5 seconds of the R3 panic braking maneuver for Driver 63, a younger male driving the Volvo S80 ............................................... 243
Figure 127. Brake pedal displacement over the first 3.5 seconds of the R1 panic braking maneuver for Driver 64, a younger male driving the Volvo S80 ............................................... 244
Figure 128. Brake pedal displacement over the first 3.5 seconds of the R2 panic braking maneuver for Driver 64, a younger male driving the Volvo S80 ............................................... 245
Figure 129. Brake pedal displacement over the first 3.5 seconds of the R3 panic braking maneuver for Driver 64, a younger male driving the Volvo S80 ............................................... 246
Figure 130. Brake pedal displacement over the first 3.5 seconds of the R1 panic braking maneuver for Driver 65, a younger female driving the Volvo S80 ............................................ 247
Figure 131. Brake pedal displacement over the first 3.5 seconds of the R2 panic braking maneuver for Driver 65, a younger female driving the Volvo S80 ............................................ 248
Figure 132. Brake pedal displacement over the first 3.5 seconds of the R3 panic braking maneuver for Driver 65, a younger female driving the Volvo S80 ............................................ 249
xvii

Figure 133. Brake pedal displacement over the first 3.5 seconds of the R1 panic braking maneuver for Driver 70, an older female driving the Volvo S80 ............................................... 250
Figure 134. Brake pedal displacement over the first 3 seconds of the R2 panic braking maneuver for Driver 70, an older female driving the Volvo S80 ............................................... 251
Figure 135. Brake pedal displacement over the first 3 seconds of the R3 panic braking maneuver for Driver 70, an older female driving the Volvo S80 ............................................... 252
xviii

LIST OF TABLES
Table 1. Summary of Corrected Stopping Distances by BAS Activation .................................... iv
Table 3. Corrected Stopping Distances Produced for Specified Brake Pedal Displacement
Table 4. Corrected Stopping Distances Produced for Specified Brake Pedal Displacement
Table 6. Corrected Stopping Distances Produced for Specified Brake Application Rates
Table 7. Corrected Stopping Distances Produced from 45 mph at the Mercedes-Benz R350
Table 8. Corrected Stopping Distances Produced from 45 mph at the Mercedes-Benz R350
Table 9. Corrected Stopping Distances Produced by the Mercedes-Benz R350 from 45 mph
Table 10. Corrected Stopping Distances Produced by the Mercedes-Benz R350 from 45 mph
Table 22. Drivers that Activated BAS in the Repeated Braking Session Collapsed Across
Table 23. Corrected Stopping Distances for BAS-Active and BAS-Disabled Braking
Table 2. Drivers that Activated BAS in the Repeated Braking Session ........................................ v
Magnitudes.................................................................................................................................... 32
Magnitudes.................................................................................................................................... 34
Table 5. Corrected Stopping Distances Produced for Specified Brake Pedal Force Magnitudes 35
(Holding Brake Pedal Force at 50 Percent) at 45 mph ................................................................. 37
BAS Activation Threshold with BAS Enabled............................................................................. 38
BAS Activation Threshold with BAS Disabled............................................................................ 38
Using Maximum Brake Controller Input and BAS Enabled ........................................................ 39
Using Maximum Brake Controller Input and BAS Disabled ....................................................... 39
Table 11. Corrected Stopping Distances for the Volvo S80 Braking Maneuvers ....................... 43
Table 12. Corrected Stopping Distances for the Volvo S80 Braking Maneuvers ....................... 44
Table 13. Driver 1 BAS Activation Tests Using the Volvo S80 .................................................. 47
Table 14. Driver 2 BAS Activation Test Using the Volvo S80 .................................................... 47
Table 15. Driver 3 BAS Activation Tests Using the Mercedes-Benz R350 ................................. 48
Table 16. Driver 4 BAS Activation Tests Using the Mercedes-Benz R350 ................................. 48
Table 17. Mercedes-Benz R350 Pedal Travel Measurements ...................................................... 55
Table 18. Volvo S80 Pedal Travel Measurements ........................................................................ 55
Table 19. Drivers Who Stopped to Surprise Barricade ................................................................ 65
Table 20. Drivers Who Stopped at the Anticipated Barricade ..................................................... 69
Table 21. Corrected Stopping Distances Observed in the Repeated Braking Session ................. 74
Vehicle .......................................................................................................................................... 77
Maneuvers Produced by Drivers that Activated BAS during the Repeated Braking Session ...... 79
Table 24. Corrected Stopping Distances by BAS Activation for the Mercedes-Benz R350 ........ 90
Table 25. Corrected Stopping Distances by BAS Activation for the S80 ................................... 90
xix

Table 26. Corrected Stopping Distances for BAS-Active and BAS-Disabled Braking Maneuvers Produced by Female Drivers that Activated BAS during the Repeated Braking Session .......................................................................................................................................... 94
Table 27. Corrected Stopping Distances for BAS-Active and BAS-Disabled Braking Maneuvers Produced by Male Drivers that Activated BAS during the Repeated Braking
Table 28. Corrected Stopping Distances for BAS-Active and BAS-Disabled Braking Maneuvers Produced by Older Drivers that Activated BAS during the Repeated Braking
Table 29. Corrected Stopping Distances for BAS-Active and BAS-Disabled Braking Maneuvers Produced by Younger Drivers that Activated BAS during the Repeated Braking
Table 31. Driver Identification of BAS Activation Performance by Vehicle, Includes Only
Table 35. Comparison of Drivers who Stopped at the Unexpected Barricade to Drivers who
Table 36. Comparison of Drivers that Stopped in Both the Unexpected and Anticipated
Table 39. Modulation Scores for Drivers that Stopped in R1, R2, and R3 Using the Mercedes-
Table 40. Modulation Scores for Drivers that Stopped in R1, R2, and R3 Using the Volvo S80114
Session .......................................................................................................................................... 94
Session .......................................................................................................................................... 95
Session .......................................................................................................................................... 96
Table 30. Driver Performance in Identifying BAS-Active Stops ................................................. 97
Drivers Performing BAS-Activated Panic Braking ...................................................................... 98
Table 32. Subjective Ranking of BAS Effectiveness Over Last Two Trials ................................ 99
Table 33. Overall Subjective Rating of BAS................................................................................ 99
Table 34. Frequencies of Driver Responses ............................................................................... 100
Stopped at the Anticipated Barricade ......................................................................................... 101
Barricade Stops ........................................................................................................................... 102
Table 37. Modulation Scores for those Drivers that Stopped to the Unexpected Barricade ...... 112
Table 38. Modulation Scores for those Drivers that Stopped at the Anticipated Barricade ....... 113
Benz R350................................................................................................................................... 113
Table 41. Modulation Scores by Test Vehicle Used................................................................... 114
Table 42. BAS Operational Mechanism ..................................................................................... 126
Table 43. Ability to Disable BAS by Operational Mechanism .................................................. 127
Table 44. Cues to BAS Activation.............................................................................................. 127
Table 45. BAS Actuation Style................................................................................................... 127
Table 46. Conditions Required for BAS Activation................................................................... 128
Table 47. Conditions Deactivating BAS Following Activation ................................................. 128
Table 48. BAS Packet ID Reporting Status ................................................................................ 129
Table 49. Ability to Disable BAS with PID ............................................................................... 129
xx

Table 50. BAS Driver Adaptation .............................................................................................. 129
Table 51. Target Population for BAS Assistance ....................................................................... 130
Table 52. Vehicle offering BAS ................................................................................................. 131
Table 53. Capabilities and Scaling.............................................................................................. 137
Table 54. Step Input Force Response with Output Blocked....................................................... 137
Table 55. Weight of the Components ......................................................................................... 137
xxi

CHAPTER 1. INTRODUCTION
The Brake Assist System (BAS) is a safety feature that supplements driver’s brake pedal effort during panic-braking maneuvers. BAS was co-developed by TRW and Daimler-Benz in the 1990s. Starting in 1997, BAS has been a standard feature on Mercedes-Benz vehicles. BAS was developed after simulator research demonstrated that many drivers fail to engage a vehicle’s maximum braking potential during panic stops. In particular, inexperienced drivers do not apply sufficient braking effort (i.e., brake pedal force) in emergency situations (Breuer, et al., 2007; Feigel & Schonlau, 1999; Sorniotti, 2006; Yoshida, 1998). Therefore, in addition to the proper engineering of the braking system, accounting for driver limitations in brake pedal application represents an additional approach for reducing the vehicle’s stopping distance.
The objective of this study was to evaluate how drivers perform avoidance maneuvers when using BAS-equipped vehicles. The human performance experimental methods described in this document were developed to determine how driving a vehicle equipped with an anti-lock brake system (ABS) compares to driving a vehicle equipped with both ABS and BAS during panic braking.
This study focused on driver performance. As such, BAS was evaluated from the user’s perspective, not that of the underlying mechanics or electronics. Since various types of BAS were available at the time of the study (such as mechanical or electronic BAS), it was considered possible that that braking performance could vary depending on the BAS type. To ensure that this study was relevant to future BAS designs, the opinions of original equipment manufacturers (OEM) and other experts on BAS trends were used to select the most appropriate system(s) for this study.
This final report includes seven chapters. Following this introduction, Chapter 2 presents the research questions of interest and the operational definitions used. As part of this research effort, the relevant literature was examined. Chapter 3 is an overview of the relevant literature on braking research. Before conducting the data collection for the study, a preliminary braking test was performed to evaluate the BAS. Chapter 4 presents the results of the BAS characterization and preliminary braking tests that were performed before the human performance evaluation experiment design was finalized. Chapter 5 presents the experimental design, methods, and results as they pertain to each of the research questions. The methods for this research effort took into consideration the knowledge gained from the literature review, expert opinion, preliminary braking test, and previous research performed at the Virginia Tech Transportation Institute (VTTI). Chapters 6 and 7 present the discussion and conclusions, respectively.
1

CHAPTER 2. RESEARCH QUESTIONS AND OPERATIONAL DEFINITIONS
RESEARCH QUESTIONS
This project addressed 13 research questions. They are listed and functionally grouped below.
The Brake Assist Effect
1. Overall, does BAS affect panic-braking stopping distance? 2. Do both BASs equally affect stopping distance? 3. Does BAS equally assist males and females? 4. Does BAS equally assist older and younger drivers? 5. Are drivers aware of the BAS activating? 6. Do drivers like the BAS?
Role of Expectancy
7. To what degree does expectancy affect panic-braking stopping distance? 8. Do drivers apply harder brake pedal force during unexpected braking maneuvers than
during anticipated braking maneuvers?
Driver Panic-braking Performance
9. Do male drivers apply the brakes with forces and displacements similar to female drivers?
10. Do older or experienced drivers apply the brakes with forces and displacements similar to younger or less experienced drivers?
11. What initial pedal travel speed and displacement are characteristic of panic-braking maneuvers?
12. Can brake pedal displacement alone be used to identify panic braking? 13. Do drivers modulate their braking during panic-braking maneuvers?
2

OPERATIONAL DEFINITIONS
The following operational definitions are provided as a reference.
Anticipated Braking Maneuver
BAS
BAS-Active Stop
BAS-Disabled Stop
BAS-Inactive Stop
Brake Pedal Application Rate
Brake Pedal Displacement
Brake Pedal Force
Brake Pedal Modulation
Corrected Stopping Distance
Panic Braking Maneuver
Repeated Braking Session
Unexpected Braking Maneuver
The braking maneuver drivers performed when the inflatable barricade deployment was known ahead of time.
Brake Assist System. A safety feature that supplements drivers’ braking upon detection of a rapid and vigorous brake pedal application.
A braking maneuver in which BAS activated.
A braking maneuver in which BAS cannot be activated by the driver because it is disabled.
A braking maneuver in which BAS was enabled, but did not activate.
A measure of how fast the driver presses on the brake pedal during the onset of braking.
How far the driver presses the brake pedal down during a braking maneuver.
The force the driver applies with his/her foot on the brake pedal.
The degree to which drivers ease up on, or increase the displacement of, the brake pedal after the initial brake pedal displacement is performed in a braking maneuver.
The distance travelled by the test vehicle from the point the driver’s foot touches the brake pedal to the point where the fifth-wheel measuring device stops incrementing (produces three consistent readouts in a row).
A braking maneuver in which ABS activates.
A series of three braking maneuvers in which drivers vigorously pressed the brake pedal in response to an auditory alarm in attempt to stop the vehicle as fast as possible.
The braking maneuver drivers performed in response to an inflatable barricade being unexpectedly deployed across the road.
3

CHAPTER 3. LITERATURE REVIEW
IDENTIFYING PANIC-BRAKING
Hara, Ohta, Yamamoto, and Yoshida (1998) and Yoshida et al. (1998) cite research conducted internally at Toyota Motor Corporation in which the braking performance of 82 drivers, sampled from a wide range of age groups (18 to 70 years old, both male and female), was investigated in response to a surprise event. Participants were told to drive a test vehicle at 31 mph (50 km/h) along a mock city and suburban test track for 30 minutes. While on their way to the instructed destination (approximately 15 minutes into the drive), a surprise barricade protruded in front of the car at a time-to-collision (TTC) of 2 s. The opposite lane was configured to appear closed for construction. This prevented the participants from swerving in response to the surprise event. The purpose of the scenario was to observe panic-braking behavior. It was found that 47 percent of the drivers failed to apply sufficient brake pedal effort (brake pedal force) to engage ABS or produce wheel skid. Figure 1 plots pedal effort versus time for one representative experienced driver and one representative inexperienced driver. Yoshida et al. (1998) distinguish between sufficient and insufficient pedal effort, while Hara et al. (1998) describe the same data in terms of driver experience (Figure 2). Figure 2 also plots pedal effort for normal braking events by driver experience.
Figure 1. Pedal Effort Plotted Against Time (Adapted from Yoshida et al., 1998)
4

Figure 2. Pedal Effort Plotted against Time during Panic and Normal Braking (Adapted from Hara, Ohta, Yamamoto, & Yoshida, 1998)
Hara et al. (1998) highlight three key findings from this research (which correspond to the three number designations in Figure 2):
1) There was a significant difference in the initial brake pedal application rate between normal and panic-braking situations. Additionally, the initial brake pedal application rate (within the first 0.05 s of the stop) was the same for the experienced driver who could generate sufficient braking effort and the inexperienced driver who could not.
2) The initial pedal effort generated by the inexperienced driver was less than what the experienced driver generated. In fact, the maximum pedal effort realized by the inexperienced driver was less than one-third of that generated by the experienced driver.
3) The braking effort generated by the inexperienced driver decreased throughout the braking maneuver (after 0.6 s).
Hara et al. (1998) state that these findings are representative of drivers of various ages and genders. Consequently, the research suggests that panic braking can be identified from the initial brake pedal application rate. Further testing showed that brake pedal displacement (the distance the brake pedal travels, also referred to as stroke in the literature) must also be considered because, in highway driving, a rapid initial brake pedal application rate frequently occurs in non-panic-braking scenarios. Fortunately, these non-panic-braking maneuvers are distinguishable from panic stops by their shorter pedal displacements.
5

HOW DOES BRAKE ASSIST WORK?
With the understanding that panic braking can be identified, two brake improvement strategies are possible. One is to apply maximum braking upon detection of panic braking, while the other is to apply maximum braking and modulate the amount of braking relative to the driver’s brake pedal input. It should be emphasized that although brake force is reduced when the driver’s brake pedal input is reduced in the braking maneuver, the instantaneous brake force for a given brake pedal input remains amplified. While the maximum braking option benefits inexperienced drivers who are unaccustomed to applying sufficient braking force, the unchanging application of maximum braking may annoy experienced drivers who modulate their braking input to control their vehicle. For this reason, Toyota elected to adopt the second strategy since it retains the pedal feel associated with comfortable and well proportioned braking that drivers are accustomed to (Feigel & Schonlau, 1999; Hara, et al., 1998).
Figure 3 shows how BAS allows drivers to maintain control of the braking operation while supplementing braking effectiveness. Note that the change in brake effectiveness (brake fluid pressure at the wheel cylinders) at each stage of the braking operation is modulated relative to driver brake input (master cylinder pressure).
Figure 3. Pressure Control during Panic Braking (Adapted from Hara, Ohta, Yamamoto, & Yoshida, 1998)
TYPES OF BRAKE ASSIST
There are various BAS designs. One predominant classifier is whether they are electronic or mechanical. Toyota has published technical papers on three types of electronic BAS: 1) vacuum
6

booster, 2) pump-motor-applied, and 3) hydraulic servo (accumulated pressure applied) (Yoshida, 1998). Continental Teves, the supplier to Mercedes-Benz, has also published papers on their electronic and mechanical vacuum booster BAS (Feigel & Schonlau, 1999). Unfortunately, automobile manufacturers have only sparsely published technical papers describing the BAS functionality, effectiveness, and methods used to evaluate driver performance. The following section summarizes the BASs that have been reported in the public domain.
Electronic Brake Assist Systems
Vacuum Booster Brake Assist
The vacuum booster BAS is a modification of the vehicle’s existing brake booster (Figure 4). Brake boosters are devices that increase the ratio of braking force to pedal force. The brake booster accomplishes this by utilizing pressure differences between two pneumatic chambers to generate a large force on the vehicle’s hydraulic brake system. Specifically, the constant pressure chamber (on the master cylinder side) and the transformation chamber (on the brake pedal side), as shown in Figure 5, are separated by a diaphragm and both are kept under vacuum pressure when the booster is inactive. When the driver steps on the brake pedal, air (which is at a higher atmospheric pressure than the partial vacuum) is let into the transformation chamber. The pressure differential causes the diaphragm to slide in order to reduce the volume of the constant pressure chamber and equalize the pressure on either side. The diaphragm connects to the output rod, which in turn leads to an increase in pressure of the brake fluid in the brake lines (Yoshida, 1998).
Figure 4. Diagram Illustrating how Vacuum Booster BAS and Other Braking Elements are Connected (from Yoshida et al., 1998)
7

Figure 5. Components of Vacuum Booster BAS (From Yoshida et al., 1998)
The vacuum booster BAS leverages this concept to generate high braking forces during panic braking. An auxiliary transformation chamber is placed on the constant-pressure-chamber side of the booster and is separated from it by a sub-plate (Figure 5). When panic braking is detected by the ABS and BAS/electronic control unit (ECU), a solenoid valve connected to the auxiliary chamber opens, allowing air to enter the auxiliary chamber. The result is an extra force on the output rod. Here, panic braking is detected by comparing brake pedal travel speed and pedal stroke to adaptable thresholds (Feigel & Schonlau, 1999). A feature of this booster design is that it allows the driver to modulate the vehicle’s deceleration by using the generic portion of the booster system while achieving amplified braking with the auxiliary booster (Yoshida, 1998). Note that the constant pressure chamber depicted in Figure 5 is actually a vacuum chamber.
Pump-Motor-Applied Brake Assist
The pump-motor-applied BAS boosts braking performance by using the vehicle’s existing motor-controlled ABS pump (Yoshida, 1998). Upon detection of panic braking, brake effectiveness is increased by energizing (rotating) the ABS pump, closing the fluid-pressure shut-off valve (SMC) and opening the inlet valve (SRC) to take in brake fluid from the master reservoir (Figure 6). Brake fluid pressure is increased at a constant rate while the inlet valve is open, as depicted in area 1 of Figure 3. When the driver maintains brake pedal effort, both the shut-off and inlet valves are closed, preventing further intake of brake fluid from the reservoir
8

and maintaining the achieved system-assisted braking force. This stage is shown in area 2 of Figure 3. The ABS pump continues to rotate throughout the cycle in case the driver presses the brake again after it is released. An advantage of this system is its flexibility in modulating the pressure at each caliper. To facilitate controlled braking, when the brake pedal force is reduced by the driver, the shut-off valve is opened while the inlet valve is kept closed. The opened shut-off valve allows brake fluid to return to the master cylinder, reducing the system-assisted braking force. Controlled braking in which braking effectiveness is reduced as the driver releases the brake pedal, is achieved by two control actions. First, the rate at which brake pressure drops is determined by the speed with which the brake pedal is released. Second, the amount of brake pressure that drops is determined by how far the brake pedal moves when released. By controlling the rate and amount of reduced braking, the system attempts to reflect the driver’s braking intentions. It is important to note that since inexperienced drivers tend to reduce their brake pedal effort during panic stops, the BAS incorporates an insensitive zone to slow the decrease in assisted braking force when foot pressure on the brake pedal is slowly reduced. These functions are shown in areas 3 and 4 in Figure 3. If the driver increases brake pedal force again (as shown in area 5 of Figure 3), the rate with which assisted braking returns is determined by the speed of brake pedal depression while the amount of assisted braking is determined by the magnitude of brake pedal depression (Yoshida, 1998).
Figure 6. Components of Pump-motor-applied BAS (from Hara, Ohta, Yamamoto, & Yoshida, 1998)
9

Hydraulic Servo (Accumulated Pressure Applied) Brake Assist
The hydraulic servo BAS supplements braking force by using accumulated fluid pressure that exists in the hydraulic servo brake system accumulator (Figure 7). It appears that the hydraulic servo BAS uses a brake fluid pressure sensor in lieu of pedal travel speed and pedal stroke to assess panic braking. During panic braking, there is an uncommonly large rise in the brake pressure gradient. When the fluid pressure sensor output exceeds a control threshold value, the accumulator fluid pressure is fed into the booster by opening the accumulator fluid pressure cutoff valve (STR solenoid), the regular fluid pressure cutoff valve (SA3 solenoid), and the fluid pressure change-over valve (SA1 solenoid). This system also allows for the modulation of pressure at each caliper, but detail on how this is accomplished is not provided (Yoshida, 1998).
Figure 7. Hydraulic Servo Brake (Accumulated Pressure Applied) BAS (from Yoshida et al., 1998)
Advantages of Electronic Brake Assist
An advantage of electronic BAS is the parameterization of activation criteria. The panic-braking thresholds can adapt to different basic vehicle versions and changing operating conditions, such as vehicle speed and driver braking behavior (Feigel & Schonlau, 1999). Tailoring BAS to the vehicle and driver takes full advantage of what the technology offers.
10

Mechanical Brake Assist Systems
Vacuum Booster Brake Assist
Mechanical BAS are challenged with the identification of a mechanically detectable state variable that is characteristic of panic braking. Feigel and Schonlau (1999) cite measurements taken at Continental Teves of brake boosters to show that a positive linear relationship between actuation speed and valve stroke exists. As a result, they conclude that valve stroke (which is directly related to brake pedal displacement) can be compared with a critical valve stroke representative of panic braking. When the critical valve stroke is surpassed, a locking mechanism is engaged and initiates the system-assisted vacuum boost by allowing atmospheric pressure to enter the booster. The locking mechanism functions by switching the area ratio between the annular surface of the control housing (which is exposed to the booster force) with the annular surface of the valve piston (which is exposed to the driver-applied force). When this occurs, the pressure acts on a smaller valve piston area. The end result is that the mechanism bears against the valve piston during normal braking, but it bears against the BAS control housing when critical relative movement is exceeded, thus activating the BAS (Feigel & Schonlau, 1999).
Emergency Valve Assistance
Sorniotti (2006) describes mechanical BASs (which are referred to as emergency valve assistance) that boost the force applied by the reaction disk to the master cylinder. This is accomplished by switching the plunger surface area (which is used during regular braking) with a smaller surface area via a mechanical linkage during panic braking. The switch is made based on a brake pedal displacement threshold. The underlying assumption here is that panic braking can be distinguished from normal braking solely by the distance the brake pedal travels. The emergency valve assistance systems differ from vacuum booster BASs in that the linkage is housed outside of the brake booster.
Advantages of Mechanical Brake Assist
The main advantage of mechanical BASs is their significant reduction in cost. A second advantage is that they take up less space than electronic BASs (Feigel & Schonlau, 1999). Their less expensive and more modular design has allowed mechanical BAS to be included in the economy sedan automotive market. A third advantage is that, compared to the pump-based electronic systems, mechanical BASs have faster response times. Since ABS/electronic stability control (ESC) pumps associated with electronic BAS usually have low volume displacements and flow rates, a few tenths of a second may be required for the calipers to attain the required maximum pressure (Sorniotti, 2006). As a result, pump performance for the pump-based systems need to be engineered to provide the appropriate response (Sorniotti, 2006). The disadvantage of the less expensive mechanical version, however, is the inability of the threshold to adapt to changes in vehicle speed and driver behavior (Yoshida, 1998).
Brake Assist Timing and Force
The point at which the BAS activates will determine how natural it feels to the driver. Poor timing may potentially affect driver acceptance. Initiating BAS too early after the detection of a panic stop results in the system failing to achieve its intended effect (area 1 in Figure 8). On the
11

other hand, initiating BAS too late results in bumpy and uncomfortable deceleration (area 2 in Figure 8). To compensate, BAS is initiated when the master cylinder fluid pressure gradient, which is controlled by the brake pedal application rate, has decreased to a certain level (area 3 in Figure 8) (Hara, et al., 1998).
Figure 8. Timing of BAS Activation by Driver Brake Pedal Input (Adapted from Hara, Ohta, Yamamoto, & Yoshida, 1998)
A second consideration for natural braking is the amount of additional braking force generated. Hara et al. (1998) present an equation for the intake time from the brake fluid reservoir necessary to generate a specified amount of additional braking force. Here, the BAS being considered is an ABS-pump-based system.
T = Q / K x P x G [EQ1]
where
Q = the amount of brake fluid necessary for an increase in the unit fluid pressure in the
12

wheel cylinder (cc/MPa) K = delivery capacity of the ABS pump (cc/s) P = the fluid pressure of the wheel cylinder necessary to increase the unit
deceleration as determined by the vehicle specification (MPa/m/s2) G = specified system-assisted deceleration (m/s2) It should be noted that Hara et al. (1998) use an initial braking deceleration of 3–4 m/s2, which can best be described as being determined by an experimenter’s perception of an appropriate initial braking response. On a side note, the Institute of Transportation Engineers’ (ITE) Traffic Engineering Handbook states that decelerations up to 3.0 m/s2 are reasonably comfortable for passenger car occupants (Traffic Engineering Handbook, 1992), while the American Association of State Highway and Transportation Officials (AASHTO) states that the minimum acceptable deceleration on dry pavement is 2.5 m/s2 (AASHTO, 2001).
To ensure that drivers find the amount of brake assist acceptable, the amount of boost is reduced when brake pedal effort is high. This is accomplished by a subsystem that reduces the brake fluid intake volume as the master cylinder fluid pressure at the start of control increases. Figure 9 shows how BAS regulates the amount of intake fluid by master cylinder pressure at the start of control (Hara, et al., 1998).
13

Figure 9. Illustration of how the Regulation of Intake Fluid Depends on the Master Cylinder Pressure at the Start of Braking (Adapted from Hara, Ohta, Yamamoto, &
Yoshida, 1998)
DOES BRAKE ASSIST REALLY HELP?
Page, Foret-Bruno, and Cuny (2005) estimated the relative risk of being involved in a BAS-pertinent crash for a vehicle outfitted with BAS versus a vehicle without BAS. This was accomplished using three steps. First, light vehicles involved in injurious crashes in France from January 2000 to June 2004 (in which the existence of BAS could be determined by the vehicles’ make and model alone) were identified. The Renault Laguna and Peugeot 406 were the only two vehicles that allowed comparison of BAS-equipped and non-BAS-equipped vehicles. Specifically, the Laguna 1, which was produced in the late 1990s and early 2000s, does not have BAS, but the Laguna 2, which was produced starting in January 2001, has BAS as a standard feature. For the Peugeot 406, BAS became a standard feature in 2000. In the second step, 34 collision situations that could be subdivided into ESP-pertinent, BAS-pertinent, ESP- and BAS-pertinent, and neither ESP- nor BAS-pertinent were identified. (ESP pertinent had to be included since the Laguna 2 also had ESP as a standard feature.) At the same time, this meant that all ESP-pertinent accident situations had to be removed from the analysis to prevent confounding. The researchers mentioned that this tremendously reduced the sample size. The final sample consisted of 917 collision situations: 713 being BAS pertinent and 204 being non-BAS pertinent.
14

The third step involved the calculation of the adjusted odds ratio, which gives the relative risk of being involved in a BAS-pertinent accident for a vehicle outfitted with BAS versus a car not fitted with BAS divided by the relative risk of being involved in a non-BAS-pertinent accident for a vehicle outfitted with BAS versus a vehicle without BAS. This analysis focused solely on fatal or injurious crashes. The odds ratio was calculated to be 19 percent, yet the confidence intervals were set at [0.48; 1.38] owing to the small sample size. As a result, the estimated 19 percent reduction in collisions involving the Renault Laguna or Peugeot 406 was not shown to be significant. The researchers reflect that their calculations relied on the following assumptions: 1) that drivers did not adapt their braking behavior to the BAS feature, 2) that their breakdown of collisions into BAS-pertinent and non-BAS-pertinent situations was correct, and 3) that other safety systems did not confound the adjusted odds ratio.
Breuer et al. (Breuer, et al., 2007) report that statistical analyses of German crash data indicate that BAS-equipped vehicles were involved in fewer severe crashes involving pedestrians as well as fewer rear end collisions than were non-BAS-equipped vehicles. The crash data consist of an anonymous sample of traffic crashes registered by the German police (e.g., 2.25 million crashes recorded in 2005). Since 1999, Daimler annually obtains these anonymous samples that contain 50 percent of all crashes with a certain severity (fine, injury) from the respective previous two years. Data attributes include accident type, year of the vehicle registration, vehicle category, model information for vehicles of Daimler AG brands only, and classes of weight-to-power ratio for other brand models. Each sample consists of more than 500,000 cases. The percentage of severe crashes (involving fatalities or severe injuries) for all crashes involving pedestrians was calculated for vehicles registered between 1995 and 1997 versus vehicles registered between 1998 and 2000. Breuer et al. report that this percentage remains constant for competitors‘ vehicles but decreases by 13 percent for newer Mercedes-Benz vehicles which were all fitted with BAS as a standard feature. Furthermore, the rate of rear-end collisions caused per 10,000 newly registered vehicles was calculated for vehicles registered in 1996-1997 which were involved in a crash in 1998 or 1999 and compared to the rate for vehicles registered 1997-1998 which were involved in a crash in 1999 or 2000. Whereas this rate remains constant for the other brands, it shows an 8 percent reduction for Mercedes-Benz passenger cars which is mainly attributed to the presence of BAS in Mercedes-Benz cars registered in 1997-1998 (BAS was made standard in 1997).
THE EVALUATION OF BRAKE ASSIST SYSTEMS
The evaluation of light vehicle BAS is a challenge because of the critical nature of the braking maneuver it is intended to support. Fortunately, there is an existing body of research on human braking performance with ABS that can be considered. Thus, test procedures used in these studies are reviewed.
Panic versus Best-Effort Braking
BAS is designed to help drivers perform panic-braking maneuvers. What defines a panic-braking maneuver, however, is not clear in the literature. Various definitions have been adopted by researchers in the past. Nevertheless, examination of previous studies involving panic braking should shed light on an appropriate definition.
15

The literature differentiates between panic- and best-effort braking. Forkenbrock, Flick, and Garrott (1999a) evaluated light vehicle ABS brakes on a test track by having one driver perform both panic and best-effort stops. For the panic stop, one driver was instructed to apply a rapid force of over 667 N (150 lbs) to the brake pedal. The braking maneuver was repeated three times with the ABS activated and three times with it disabled. On the other hand, the best-effort stop required the driver to modulate the brake pedal force as necessary to achieve the shortest possible stopping distance under vehicle and lane position control. It should be noted that best-effort stops were only performed with the ABS disabled. Each braking maneuver in this study was anticipated by the driver. Stopping distance was the primary performance measure.
Kiefer, LeBlanc, and Flannagan (2005) examined drivers’ last-second braking under a wide range of vehicle-to-vehicle kinematic conditions. Drivers were instructed to perform last-second braking maneuvers to a stationary surrogate vehicle using normal and hard braking. Normal braking required the drivers to maintain their speed and apply what they considered normal braking intensity at the last possible moment to avoid a collision. Hard braking required the drivers to maintain their speed and apply what they considered hard-braking intensity at the last possible moment to avoid a collision. It appears that the hard-braking maneuver utilized in this study is comparable to the panic-stop braking maneuver described in Forkenbrock, Flick, and Garrott (1999a). Both were conducted in response to anticipated events.
From this, the literature begins to identify panic braking as bringing the vehicle to a stop as fast as possible. It is imperative that this type of maneuver be performed in the evaluation of BAS. However, it is unclear whether panic braking necessitates a surprise stimulus, or whether it can be performed in response to an anticipated event.
Unexpected versus Anticipated Braking
There are instances in the braking literature that consider panic braking as a response to non-surprise events. For example, Kiefer, LeBlanc, and Flannagan (2005) asked drivers to perform hard-braking maneuvers to an anticipated stationary surrogate vehicle. Forkenbrock, Flick, and Garrott (1999a) had a test driver initiate panic braking at their own will. In contrast, there is research that investigates panic braking by using a surprise event. In related work to Forkenbrock, Flick, and Garrott (1999a), Mazzae, Baldwin, and McGehee (1999) as well as Mazzae, Barickman, Baldwin, and Forkenbrock (1999) evaluated ABS panic stops on a test track and in the National Advanced Driving Simulator (NADS) at the University of Iowa by using a surprise intersection incursion event. Driver braking behavior was measured in response to a vehicle darting out perpendicularly toward the participant’s vehicle until its front bumper was centered in the participant’s lane in the intersection. The incursion was timed to occur with a time-to-intersection of 2.5 or 3.0 s.
The terminology used to describe panic braking also varies throughout the literature. Hancock, Lesch, and Simmons (2003) had participants perform a “crucial driving maneuver” on a closed test track, which involved participants driving 40 km/h (20 mph) and stopping as fast as possible at a traffic light that changed immediately from green to red under the control of an on-road experimenter. For this task, participants were also asked to stop before the mock intersection stop bar. Here the crucial driving maneuver performed in response to a surprise event is comparable to panic braking.
16

Fambro, Koppa, Picha, and Fitzpatrick (2000) compared “emergency” braking performance to anticipated and unexpected stops. They observed that participants brake in response to a counted-down signal as well as to a randomly activated signal when traveling at both 40 mph (65 km/h) and 56 mph (90 km/h). No significant differences in stopping distance between the unexpected and anticipated events were found. In the second part of their study, they had drivers brake to a 3-ft-high fabric barricade spanning both lanes of the highway that unexpectedly appeared in the driver’s path with a 2.5- TTC at 56 mph. They found that drivers’ stopping distances were 25 percent shorter for the unexpected fabric barricade when compared to those in response to the anticipated signal. The researchers hypothesize that the drivers were likely willing to brake harder because of the hazardous appearance of the barricade. This study suggests that braking behavior is as much dependent on the type of stimulus (and the subsequent cost of not braking) as it is on the driver’s expectation that it will occur.
The methodologies in the BAS literature reviewed earlier used a surprise event to initiate panic braking (Hara, et al., 1998; Yoshida, 1998). Yet the same research also states that BAS can help drivers incapable of applying the forces necessary to engage maximum braking. This physical limitation should then exist even when the braking maneuver is anticipated. Therefore, investigating both unexpected and anticipated braking maneuvers is a logical consideration in the investigation of light vehicle BAS. Creating scenarios that allow participants to safely initiate unexpected and anticipated panic-braking maneuvers is very important. To provide background on the formulation of these test methods, a review of the factors considered in previous braking studies is presented next.
Braking Maneuvers
The type of braking maneuver performed may affect a vehicle’s stopping distance. Straight-line braking performance may differ from braking performance when turning because of changes in tire forces and tire loading. To account for these changes, several investigations have used various types of braking maneuvers.
In their evaluation of light vehicle ABS braking systems, Forkenbrock, Flick, and Garrott (1999a) used four braking maneuvers: 1) straight line stop, 2) curve, 3) J-turn (which is a straight line stop followed by a turning maneuver), and 4) a single lane change. All stopping lanes were 12 ft (3.7 m) wide and marked with cones spaced 20 ft (6.1 m) apart. The test matrix incorporated a partial factorial design that allowed only direct comparisons between straight line and curve stops on a wet Jennite surface (wet Jennite is a trade name for a coal tar emulsion asphalt sealer). The shortest stopping distances for lightly and fully loaded vehicles performing straight line stops were 57.7 ft (17.6 m) and 87.3 ft (26.6 m), respectively. The shortest stopping distances for lightly and fully loaded vehicles braking in a curve were longer, 62.0 ft (18.9 m) and 106.3 ft (32.4 m), respectively. Both braking maneuvers were performed at 40 mph (64 km/h) by one expert driver who had 17 years of experience.
Strickland and Dagg (1998) report ABS braking performance evaluations conducted by the Royal Canadian Mounted Police in British Columbia during the temperate month of June. They used an airbase runway with asphalt that was dry, free of any contaminants, and in “good repair.” Four braking maneuvers were performed. The first was a straight line stop. The second maneuver required the driver to apply the brakes and then turn the steering wheel 180 degrees.
17

The third maneuver differed from the second in that the driver turned the steering wheel 270 degrees. For the fourth maneuver, two traffic lanes 3.6 m wide were set up. The driver drove down the right lane and was instructed to apply the brakes and steer into the left lane to come to a stop. Although stopping distances were reported, they were not statistically analyzed.
In their investigation of driver stopping distances with and without ABS brakes, Fambro, Koppa, Picha, and Fitzpatrick (2000) did not find significant differences in braking performance between tangent (straight line) and curve stops. Nine participants, who were Texas Transportation Institute employees, performed the braking maneuvers at 40 mph (65 km/h) and 56 mph (90 km/h). Three of the drivers were experts and were also tested at 68 mph (110 km/h).
The braking studies that investigated concurrent braking and turning maneuvers all had extremely large test areas with mock lanes placed in the middle. The extra area on either side helped participants stay safe if the vehicle veered out of control. An important lesson to be learned from these investigations is that large test areas are a good way to maintain participant safety when they are asked to perform concurrent braking and turning maneuvers.
Braking Surfaces
A vehicle in motion possesses kinetic energy. To bring the vehicle to a stop, all of its longitudinal kinetic energy must be dissipated in some form. Two avenues for kinetic energy to transform into heat energy are the friction supplied by the brakes against the motor or drums and the friction between the tires and the road. The friction between the tires and the road depends on the tire/road interface coefficient of friction, which is approximately 0.6–0.8 on dry roads (AASHTO, 2001). This means that a 100-lb (45.36-kg) object would require a pulling force of 60–80 lbs (267–356 N) to drag it down the road. Since the coefficient of friction differs across surfaces, the surface on which the braking maneuver is performed affects the vehicle’s stopping distance. In particular, wet, snowy, or icy pavements may create much lower coefficients of friction.
Forkenbrock, Flick, and Garrott (1999a) used nine test surfaces in their evaluation of ABS brakes. The first two were dry or wet asphalt. The second two were dry or wet polished concrete. Their intent was for the polished concrete to resemble a heavily worn road; this was created by troweling and polishing the concrete surface with a floor polisher. The fifth surface was a wet epoxy, which was an asphalt pad covered with a coating typically used on factory floors. The sixth surface was wet Jennite, a coal tar emulsion asphalt sealer. The seventh surface was a grass surface consisting of fescue grown on a clay-based soil. The grass was approximately 3.0 in (7.6 cm) high. The eighth surface was loose gravel comprised of #617 crushed limestone with dust. The gravel base was approximately 2.0 in (5.1 cm) deep. The ninth surface was an epoxy/sand surface combination that was used to investigate changing coefficients of friction. This study determined that stopping distances for vehicles equipped with ABS were longer on wet surfaces compared to dry surfaces, an important and revealing finding.
Braking on surfaces with low friction is potentially dangerous. Consequently, participants used in such studies are typically expert drivers or at least drivers with special knowledge. For instance, Fambro, Koppa, Picha, and Fitzpatrick (2000) limited their participant pool to Texas Transportation Institute employees who were considered expert drivers. An additional
18
precaution is to use large test areas that allow for situations where the vehicle may skid out of control. Participant safety needs to be carefully considered when evaluating braking on wet surfaces, or where the friction is limited by other factors.
Braking Initial Speeds
Clearly, a vehicle’s initial speed is a major factor in how long it takes to come to a complete stop. The faster a vehicle travels, the more kinetic energy it possesses. In evaluating BAS’s ability to reduce stopping distance, high initial speeds may need to be used in order to observe differences in stopping distances. However, participants are at greater risk as initial speeds are increased. To help determine what speeds are safe to use for the evaluation of BAS, this section lists the initial speeds used in past braking studies.
Strickland and Dagg (1998) used three initial speeds in their investigation of ABS systems. Drivers were instructed to attain test speeds of 25 mph (40 km/h), 31 mph (50 km/h) and 44 mph (70 km/h).
Fambro, Koppa, Picha, and Fitzpatrick (2000) had Texas Transportation Institute employees perform braking maneuvers at 40 mph (65 km/h) and 56 mph (90 km/h), while three expert drivers braked at 110 km/h (68 mph).
Forkenbrock, Flick, and Garrott (1999a) tested braking performance of one expert driver with 17 years experience. Straight line stops were conducted on various surfaces at 25 mph (40 km/h), 30 mph (48 km/h), 35 mph (56 km/h), 40 mph (65 km/h), 50 mph (80 km/h), and 60 mph (97 km/h), while curve stops were performed at 40 mph (65 km/h) and 50 mph (80 km/h). The lane change and J-turn braking maneuvers were performed at 50 mph (80 km/h).
For anticipated braking to a stationary surrogate vehicle, Kiefer, LeBlanc, and Flannagan (2005) had participants drive at initial speeds of 30 and 60 mph (48 and 97 km/h). For the conditions in which participants performed anticipated braking to a slower lead vehicle, the following initial speeds (in mph) were used by the participant vehicle and surrogate, respectively: 30/20, 30/10, 60/50, 60/30, and 60/15 (in km/h: 48/32, 48/16, 97/80, 97/48, and 97/24, respectively). For the unexpected deceleration of the surrogate vehicle condition, participants drove at 30 mph (48 km/h) and 60 mph (97 km/h).
Mazzae, Barickman, Baldwin, and Forkenbrock (1999) evaluated driver panic braking with and without ABS on wet and dry pavement by having participants brake at a surrogate vehicle that protruded 6 ft (1.8 m) into the participant’s lane in the intersection at a TTC of 2.5 or 3.0 s. Participants were asked to drive at 45 mph (72 km/h) on dry pavement and 35 mph (56 km/h) on wet Jennite.
From this review it is apparent that high initial vehicle speeds were used in order to observe large braking distances. However, trained drivers tend to be used for these conditions. For the evaluation of light vehicle BAS, consideration for participant safety will need to be balanced with the need for acceptably high initial speed.
Vehicle Weight
Another factor that affects a vehicle’s stopping distance is its weight. The heavier a vehicle, the longer it takes to come to a complete stop, unless all components of the vehicle are scaled
19

upward in proportion to the weight. Under ordinary conditions, loading a vehicle will cause stopping distance to increase somewhat. Forkenbrock, Flick, and Garrott (1999a) used two loading conditions in their ABS brake study. The lightly loaded condition was defined as the vehicle weight with a full tank of fuel plus the test driver and instrumentation, while the heavier condition was the gross vehicle weight rating (GVWR). GVWR involves loading the vehicle to the maximum vehicle weight recommended by the manufacturer. This was done by ballasting the test vehicle with sand bags and distributing them such that the axle weights were in proportion to the gross axle weight ratings. Most of the results reported by the researchers were at GVWR. It should be noted, however, that light vehicles are ordinarily under light loading conditions. Only occasionally are they loaded near or about the GVRW.
Adhesion Coefficient
A simple model of the coefficient of friction assumes that the coefficient is constant as a function of speed (once the tire is not rotating). However, this model is only an approximation. The amount of tire/road adhesion decreases as the vehicle’s speed increases (Delaigue & Eskandarian, 2005). Specifically, a variation in speed of 1 m/s equates to a reduction of 0.0045– 0.0047 in the static coefficient of friction (for dry asphalt pavement in good tread).
Drag and Wind
A vehicle’s aerodynamics will to some extent affect its stopping distance owing to the drag forces that are generated as air moves past the vehicle. Similarly, wind can also influence a vehicle’s deceleration but is dependent on direction. As a result, consideration for the vehicle’s shape as well as wind speed and direction during the test must be considered in any stopping distance investigation.
Road Slope
The slope of the road is another factor to consider because slope causes a force component of the gravity vector to appear in the deceleration. On uphill slopes, this component reduces stopping distance and, on downhill slopes, it increases stopping distance. It also causes the vehicle’s weight to transfer across the tires. This transfer affects the adhesion forces applied to the tires from the road and, ultimately, a vehicle’s stopping capability. The effects can be significant if the brakes of the down-slope wheels are loaded beyond their capacity or the up-slope wheels are unloaded to the point that the tire/road surface dynamics are altered (Delaigue & Eskandarian, 2005).
Vehicle Suspension Stiffness
A vehicle’s suspension affects the degree to which its weight transfers longitudinally toward the front axle during braking. Tighter suspension systems transfer less weight to the front tires compared to loose suspension systems during braking. The loading of the front brakes beyond their capacity is less likely to occur, thus allowing a vehicle to stop more efficiently (Delaigue & Eskandarian, 2005).
20

The factors affecting a vehicle’s stopping distance that have been considered thus far have been vehicle and environment related. Driver-related factors affecting stopping distance are reviewed next.
Gender
In general, there are no significant differences in panic-braking behavior between males and females. In their investigation of driver crash-avoidance behavior with ABS in a surprise intersection incursion event in the NADS, Mazzae, Baldwin, and McGehee (1999) controlled for gender by testing 60 males and 60 females between the ages of 25 and 55 years. They found no significant differences in average maximum brake pedal force. Males applied a force of 93 lbs (413 N), while females applied a force of 86 lbs (382 N). Additionally, of the eight participants who drove completely off the road to avoid the intersection incursion, five were males and three were females. However, the presence of ABS was shown to significantly reduce the number of crashes for females (23 percent of females crashed with ABS while 50 percent crashed with conventional brakes). Differences in crash rates for males were not significant (40 percent of males crashed with ABS while 35 percent crashed with conventional brakes). There were no significant gender effects for evasive steering behavior, either. Males averaged 154 degrees in the avoidance steering magnitude, while females averaged 142 degrees. The average steering rate for males was 573 degrees per second while females averaged 454 degrees per second.
Mazzae, Barickman, Baldwin, and Forkenbrock’s (1999) on-road version of the same evaluation recruited participants between the ages of 25 and 55 years. Researchers recruited 192 participants for the dry pavement study and 53 for the wet Jennite study. Gender was balanced, and they did not find significant gender effects. Males, however, were characterized by higher braking inputs than females. On dry pavement, the average maximum braking force was 66 lbs (294 N) for males and 61 lbs (271 N) for females. On wet Jennite, the average maximum braking force was 74 lbs (329 N) for males and 62 lbs (276 N) for females.
Kiefer, LeBlanc, and Flannagan (2005) found very few significant gender effects in their investigation of driver last-second braking behavior for a surrogate lead vehicle. Gender effects were found in 6 of 17 possible kinematic conditions. Three involved anticipated braking to a lead vehicle, two involved anticipated braking to a stationary vehicle, and one involved anticipated braking to a slower lead vehicle. The effects were relatively small in magnitude, with the largest difference in mean required deceleration being 0.03 g. Kiefer, LeBlanc, and Flannagan (2005) report that males were slightly more aggressive in their brake onset compared to females.
Age
Kiefer, LeBlanc, and Flannagan (2005) found very few significant effects for age in their investigation of driver last-second braking behavior for a surrogate lead vehicle. Only 2 of 17 possible main effects were found for age, and these effects were relatively small in magnitude. For the anticipated braking for a stationary lead vehicle from an initial speed of 30 mph (48 km/h), younger, middle, and older drivers braked at 0.20 g, 0.18 g, and 0.16 g, respectively. For the anticipated braking for a stationary lead vehicle from an initial speed of 60 mph (97 km/h), younger, middle, and older drivers braked at 0.39 g, 0.37 g, and 0.35 g, respectively.
21

Braking Study Dependent Variables
Stopping Distance
Stopping distance is a primary measure of a braking system’s effectiveness (Fambro, et al., 2000; Forkenbrock, Flick, & Garrott, 1999b; Hancock, et al., 2003; Kiefer, et al., 2005; Mazzae, 1999; Mazzae, et al., 1999; Yoshida, 1998). However, drivers vary their brake application when performing multiple stopping attempts with the same vehicle under the same braking conditions. As a result, the braking studies reviewed have reported the minimum stopping distance (best performance) observed. A distinction should be made here that the purpose of these tests has been to evaluate the performance of the braking system and not the drivers’ ability to use the braking system. For human performance evaluation of BAS, the mean and standard error of stopping distances should be reported to describe the range of observed braking behavior, while minimum stopping distances could be reported to facilitate comparisons with other braking studies. To measure stopping distance, Strickland and Dagg (1998) used a bumper gun mounted to the rear bumper of the test vehicle. Total stopping distance was measured by having the gun activate as soon as the brakes were applied. Other techniques for measuring stopping distance include a fifth wheel attached to the vehicle’s rear bumper (Forkenbrock, et al., 1999b). In this case, the wheel’s zero-point mark is triggered by brake-light activation.
Average Maximum Brake Pedal Force
Brake pedal force has been used to indicate the effort drivers exert during braking maneuvers. Mazzae, Baldwin, and McGehee (1999) report that the overall average maximum brake pedal forces during an on-road panic maneuver were 64 lbs (285 N) and 68 lbs (302 N) for their dry and wet pavement studies, respectively. The greatest brake pedal force recorded on dry pavement was 188 lbs (836 N), while it was 240 lbs (1,068 N) on wet pavement. The overall average maximum brake pedal force with ABS was 65 lbs (289 N), while it was 62 lbs (276 N) when participants used conventional brakes. In comparison, the average maximum brake pedal force on wet pavement was 72 lbs (320 N) with ABS and 59 lbs (262 N) with conventional brakes. None of these differences were statistically significant.
Mazzae, Barickman, Baldwin, and Forkenbrock’s (1999) NADS study found that overall maximum brake pedal force was 400 N (90 lbs). The highest brake pedal force generated was 1,237 N (278 lbs). The average maximum brake pedal force for the ABS condition was 383 N (86 lbs), while it was 436 N (98 lbs) for conventional brakes. When participants drove at 55 mph (89 km/h), the average maximum brake pedal force was 98 lbs (436 N), while it was 82 lbs (365 N) when participants drove at 45 mph (72 km/h). The average maximum brake pedal force was 86 lbs (383 N) for females and 93 lbs (414 N) for males. None of these maximum brake pedal force differences were statistically significant.
These studies suggest that there are no practical differences in brake pedal force with respect to certain driver, vehicle, and environmental factors. However, driver brake force is expected to play a role in BAS panic-braking scenarios. Fambro, Koppa, Picha, and Fitzpatrick (2000) report that many of their participants did not completely stomp on the brakes during the entire braking maneuver at an unexpected fabric barricade. They report that participants only did so when they thought they might strike the obstacle. This modulation of pedal force may translate into larger differences in stopping distance when BAS is provided.
22

Average Maximum Deceleration
It is possible that drivers modulate their braking throughout the braking maneuver. The peak deceleration is thus used to describe the braking magnitude. Fambro, Koppa, Picha, and Fitzpatrick (2000) report the average maximum deceleration that participants achieved while performing braking maneuvers. The researchers also equate these maximum values to the constant deceleration required to perform the stop. This averages out differences in brake application timing across participants.
Brake Pedal Application Rate and Displacement
In the investigation of driver braking behavior, brake pedal application speed and displacement are reported by Hara et al. (1998) and Yoshida et al. (1998), as reviewed earlier in this document. They also present the brake pedal force profile over time during the braking maneuver. These measures can be used to describe how drivers modulate their braking throughout the maneuver.
Steering Input
In panic-braking studies, steering input is often measured since it is sometimes a viable evasive maneuver. Steering input was measured by Mazzae, Baldwin, and McGehee (1999) and Mazzae, Barickman, Baldwin, and Forkenbrock (1999). They report the average magnitude of avoidance steering input (in degrees) as well as the average maximum steering input rate (as degrees per second), as previously reviewed in this document. In another study, Kiefer, LeBlanc, and Flannagan (2005) report last-second steering onset during normal and hard-braking maneuvers. They found that last-second steering onset is highly dependent on the kinematic conditions.
Number of Road Departures
Mazzae, Baldwin, and McGehee (1999) and Mazzae, Barickman, Baldwin, and Forkenbrock (1999) report the number of road departures that occurred after a surprise intersection incursion event. It should be clarified that, while Mazzae, Barickman, Baldwin, and Forkenbrock (1999) had participants safely perform panic-braking maneuvers in a driving simulator, the test area used in Mazzae, Baldwin, and McGehee (1999) consisted of a 1,800 by 1,200-ft, 50-acre flat asphalt surface that had sufficient space to allow the test vehicles to safely veer out of the lane. It is important to recognize that incorporating road departures as a measure requires extreme caution for participant safety.
Brake Response Time
In their investigation of the distraction effects of cell phone use during a crucial driving maneuver, Hancock, Lesch, and Simmons (2003) compared driver brake response times while using a cell phone to baseline braking maneuvers. Brake response time is a common dependent variable in braking studies, yet it is usually measured to assess limitations in driver cognition. Since BAS activates after the driver applies the brakes, analyzing brake response time is not an appropriate measure in the evaluation of BAS. However, measurement of brake response time can be used to assess the degree of hesitation drivers experience in unexpected braking conditions, which are likely to be used in testing BAS.
23

Existing Stopping Distance Protocol
SAE published a standard that specifies a protocol for measuring a vehicle’s stopping distance (Society of Automotive Engineers, 1993). Although the standard focuses on the machine side of human-machine interaction between a driver and the braking system, it does provide useful insight for the human performance evaluation of light vehicle BAS.
The protocol states that the driver must first attain a speed sufficiently above the desired initial stopping speed. This speed is not to exceed the desired initial stopping speed by more than 8 km/h (5 mph). When the driver is ready to perform the braking maneuver, the driver is to release the throttle and allow the vehicle to coast. Once the vehicle decelerates to the desired initial stopping speed, the driver is to apply the brakes at the desired rate to any required limit(s) and maintain braking at the desired limit(s) until the motor vehicle reaches a full stop. The limit(s) can be determined by the specific conditions and may be wheel skid, pedal force, deceleration, pressure, brake control movement, vehicle control, lane boundaries, or a combination of these. The stopping distance, actual initial vehicle stopping speed, wind velocity, wind direction, road grade (if other than level), vehicle direction, road surface data, vehicle data, and test conditions are to be recorded. A fifth-wheel device should be used to monitor the vehicle’s speed and to make an instrumented recording of actual initial stopping speed. The protocol specifies that the error must not exceed ±0.5 mph (±0.8 km/h) or ±0.5 percent of the actual speed, whichever is greater. The protocol suggests that the fifth-wheel distance meter can be triggered by a contact or travel switch that detects brake pedal movement within the first 0.125 in (3.2 mm) that its center, tip of the brake treadle, or the tip of the brake control handle travels (i.e., initial movement). The protocol specifies that the total instrumentation system delay shall not exceed 0.020 s. Additionally, the distance-measuring instrumentation error cannot exceed ±0.5 ft (±0.15 m) or ±1 percent of actual distance, whichever is greater.
OEM, OEM SUPPLIERS, AND USDOT INPUT
OEMs and OEM Tier 1 suppliers were surveyed using a list of questions that the literature review failed to answer. The input provided has helped define the current capabilities of BAS. This section synthesizes the information collected from the survey. The questionnaire and responses are presented in Appendix A.
The Future of Brake Assist System
An issue revealed by the survey is that BASs vary in their suitability for mass production. Certain configurations are more likely to be incorporated into future product lines compared to others. An example would be the ABS-pump-based BAS that leverages the ABS components already in the vehicle. Such system configurations might be more attractive to produce compared to vacuum booster systems because they require less production and lower installation costs. For the same reasons, producing accumulator-based BASs might be desirable as ESC becomes standard. Survey respondents commonly indicated that their companies were pursuing electronic BAS. It is foreseeable that as ABS and ESC propagate into the market, the need for mechanically based BASs will decrease.
24

Deactivating Brake Assist System
To facilitate a controlled comparison between BAS and baseline stops, the factors identified in the literature review need to be consistent across test conditions. There is thus a significant interest in being able to easily deactivate a vehicle’s BAS. OEM supplier communications have indicated that mechanical BASs cannot be disengaged. However, this system type is more common as an option compared to electronic BASs. Thus, the possibility of using two vehicles, one with mechanical BAS and the other without it, should not be discounted. It should be mentioned that confounding factors such as brake pad and tire wear could still exist under this arrangement. In contrast, it has been indicated by some OEMs that electronic BASs can be deactivated. Further discussion on how this can be accomplished is currently in progress. The major advantage of the ability to activate and deactivate BAS is that all vehicle test parameters other than BAS would remain the same, thereby providing statistical control over potential confounding factors.
Adaptive Thresholds
Another issue that stands to have major implications for the evaluation of BAS is adaptive BAS thresholds. An understanding of whether BAS adjusts its activation threshold based on vehicle speed, or even learned driver behavior, needs to be attained. In a phone conversation, Garrick Forkenbrock from NHTSA’s Vehicle Research and Test Center (VRTC) in East Liberty, Ohio indicated that the contribution of the BAS installed in a 2003 Ford Expedition evaluated by NHTSA degraded over repeated testing of hard-braking maneuvers owing to the technology adapting its threshold to the test conditions (Forkenbrock, 2006). Continental Teves’s electronic BAS are described in Feigel and Schonlau (1999) as having adaptive thresholds based on vehicle speed. Yet there are OEMs that have indicated that their electronic BAS is non-adaptive. For these systems, the largest problem is that the activation threshold must be set conservatively. This can affect whether or not drivers engage BAS during the test conditions.
Relationship to Driver Input
Discrepancies between BAS also appear to exist regarding whether the amount of boost is proportional to driver brake pedal input. Some OEMs have indicated that their booster-based systems (both electronic and mechanical) fully engage maximum boost once the threshold is surpassed, while others reduce the amount of boost if the driver reduces pedal input beyond a certain insensitive zone. This facet of BAS is a part of the activation algorithm, which is typically kept proprietary.
Minimum Conditions
There are minimum conditions that need to be met before BAS activates. These conditions vary across OEMs. For example, some BASs require the vehicle to be traveling above 9 mph (15 km/h) and the brake pressure to be higher than 580 psi (40 bar) before the boost engages. In addition, activation may vary slightly between vehicle models. Again, such information is a part of the activation algorithm and is kept proprietary.
25

SUMMARY
BAS is a relatively unpublicized safety feature that has propagated into the automotive market, particularly in Europe. The reviewed literature has helped define BAS, the market it is designed for, the types of BASs, how they operate, and their respective advantages. The methodologies used in other braking studies were synthesized according to the factors that affect stopping distance performance. This extensive list shows that there are a multitude of factors that need to be considered in BAS investigations to avoid confounded effects. Additionally, through surveys, OEM and Tier 1 respondents provided key insight on the BAS technology that is unavailable in the public domain.
26
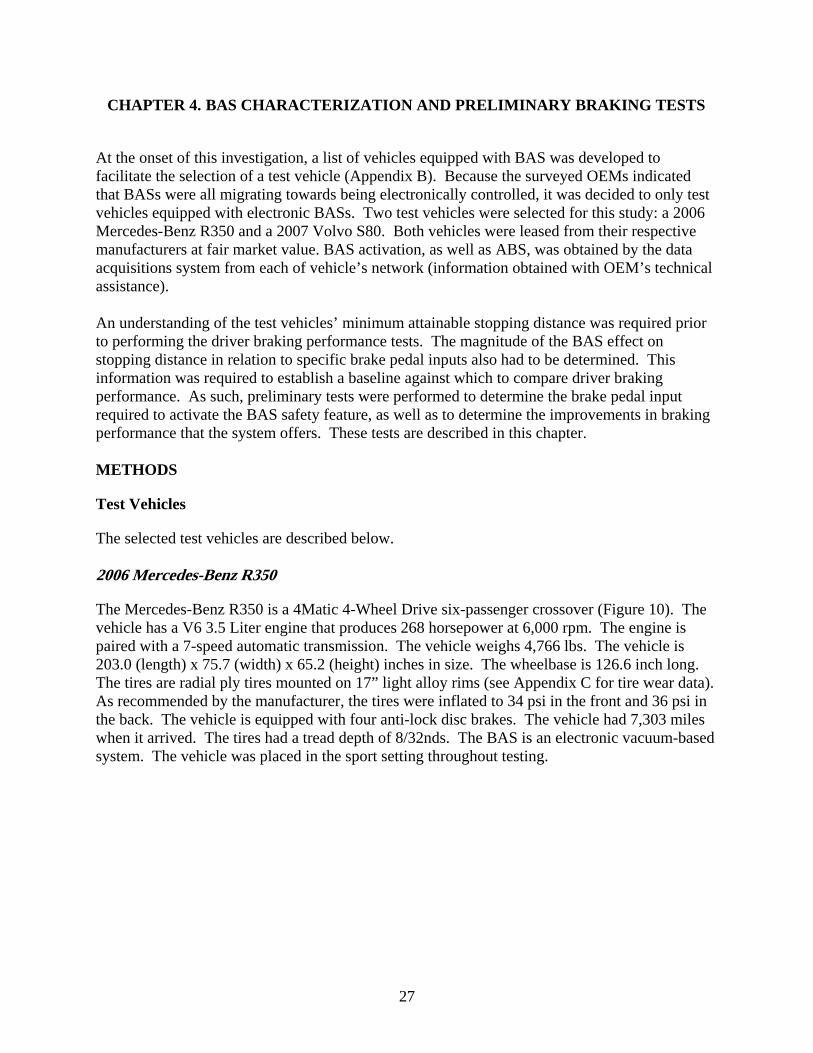
CHAPTER 4. BAS CHARACTERIZATION AND PRELIMINARY BRAKING TESTS
At the onset of this investigation, a list of vehicles equipped with BAS was developed to facilitate the selection of a test vehicle (Appendix B). Because the surveyed OEMs indicated that BASs were all migrating towards being electronically controlled, it was decided to only test vehicles equipped with electronic BASs. Two test vehicles were selected for this study: a 2006 Mercedes-Benz R350 and a 2007 Volvo S80. Both vehicles were leased from their respective manufacturers at fair market value. BAS activation, as well as ABS, was obtained by the data acquisitions system from each of vehicle’s network (information obtained with OEM’s technical assistance).
An understanding of the test vehicles’ minimum attainable stopping distance was required prior to performing the driver braking performance tests. The magnitude of the BAS effect on stopping distance in relation to specific brake pedal inputs also had to be determined. This information was required to establish a baseline against which to compare driver braking performance. As such, preliminary tests were performed to determine the brake pedal input required to activate the BAS safety feature, as well as to determine the improvements in braking performance that the system offers. These tests are described in this chapter.
METHODS
Test Vehicles
The selected test vehicles are described below.
2006 Mercedes-Benz R350
The Mercedes-Benz R350 is a 4Matic 4-Wheel Drive six-passenger crossover (Figure 10). The vehicle has a V6 3.5 Liter engine that produces 268 horsepower at 6,000 rpm. The engine is paired with a 7-speed automatic transmission. The vehicle weighs 4,766 lbs. The vehicle is 203.0 (length) x 75.7 (width) x 65.2 (height) inches in size. The wheelbase is 126.6 inch long. The tires are radial ply tires mounted on 17” light alloy rims (see Appendix C for tire wear data). As recommended by the manufacturer, the tires were inflated to 34 psi in the front and 36 psi in the back. The vehicle is equipped with four anti-lock disc brakes. The vehicle had 7,303 miles when it arrived. The tires had a tread depth of 8/32nds. The BAS is an electronic vacuum-based system. The vehicle was placed in the sport setting throughout testing.
27

Figure 10. The 2006 Mercedes-Benz R350
2007 Volvo S80
The Volvo S80 is an All-Wheel Drive four-passenger sedan (Figure 11). The vehicle has a V8 4.4 Liter engine that produces 311 horsepower at 6,000 rpm. The engine is paired with a six-speed Geartronic automatic transmission. The vehicle is equipped with four anti-lock disc brakes. The vehicle weighs 3,825 lbs. It is 191.0 (length) x 73.3 (width) x 58.8 (height) in. The wheelbase is 111.6 inch long. The tires are radial ply tires mounted on 17” allow rims (see Appendix C for tire wear data). As recommended by the manufacturer, the tires were inflated to 35 psi in the front and back. The vehicle had 5,323 miles when it arrived. The tires had a tread depth of 8/32nds. The BAS is an electronic ABS-pump-based system. The vehicle was placed in the sport setting throughout testing.
28
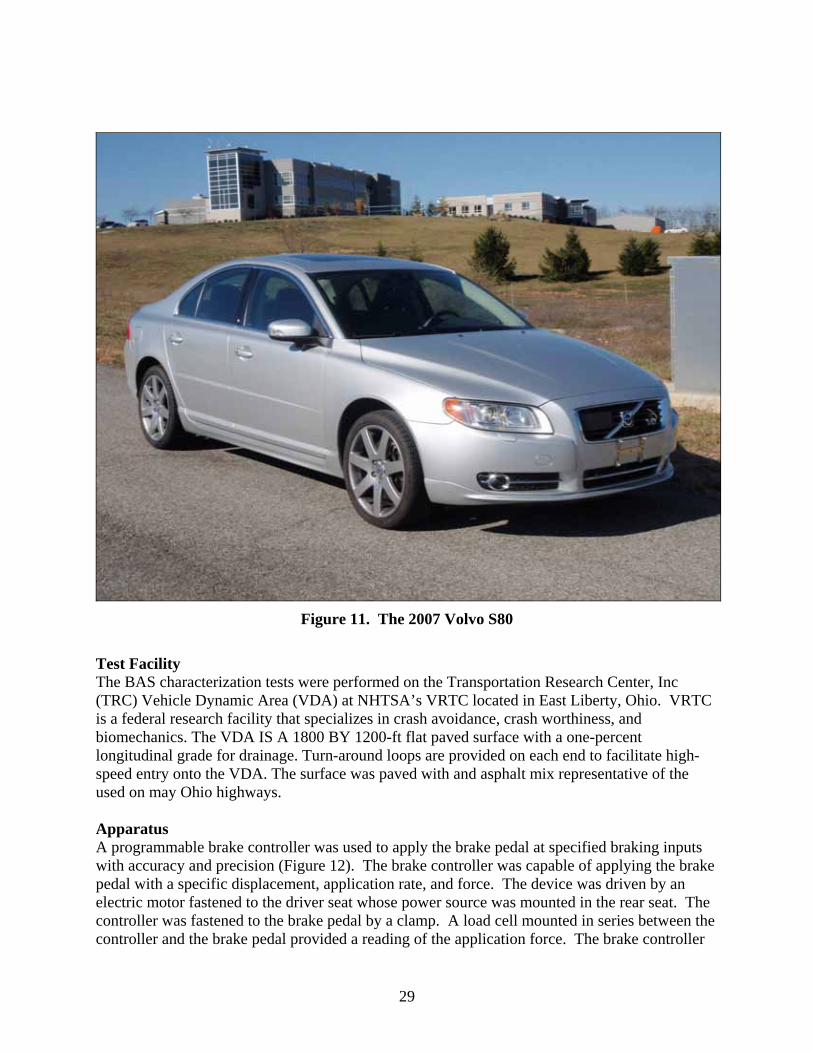
Figure 11. The 2007 Volvo S80
Test Facility The BAS characterization tests were performed on the Transportation Research Center, Inc (TRC) Vehicle Dynamic Area (VDA) at NHTSA’s VRTC located in East Liberty, Ohio. VRTC is a federal research facility that specializes in crash avoidance, crash worthiness, and biomechanics. The VDA IS A 1800 BY 1200-ft flat paved surface with a one-percent longitudinal grade for drainage. Turn-around loops are provided on each end to facilitate high-speed entry onto the VDA. The surface was paved with and asphalt mix representative of the used on may Ohio highways.
Apparatus A programmable brake controller was used to apply the brake pedal at specified braking inputs with accuracy and precision (Figure 12). The brake controller was capable of applying the brake pedal with a specific displacement, application rate, and force. The device was driven by an electric motor fastened to the driver seat whose power source was mounted in the rear seat. The controller was fastened to the brake pedal by a clamp. A load cell mounted in series between the controller and the brake pedal provided a reading of the application force. The brake controller
29

actuator was mounted on vehicle’s console. More information about the brake controller is presented in Appendix D.
Figure 12. Brake Controller Mounted to the Driver Seat and Brake Pedal
The vehicles were instrumented with both VRTC and VTTI data acquisition systems (DAS). VRTC’s DAS consisted of an analog system whose channels were sampled at 200 Hz. VTTI’s DAS differed in that data were read directly off the car area network (CAN) at 20 Hz. This allowed observation of whether BAS activated, when it activated, and how long it was activated for.
Procedure The braking tests consisted of straight line stops performed at 45 mph. A total of 184 stops were performed with the Mercedes-Benz R350 and 165 stops were performed with the Volvo S80. Following SAE J299, a test driver accelerated the vehicle to a speed above the target maneuver entrance speed (MES), released the throttle, and allowed the vehicle to coast down to the target MES (Society of Automotive Engineers, 1993). The driver then triggered the brake controller once the vehicle reached the target MES. The vehicle’s stopping distance was recorded using a fifth wheel mounted to the rear of the vehicle (Figure 13). Since there were often small differences between the target and actual MES, the recorded stopping distances were normalized
30

using the following equation, which is recommended in SAE J299 (Society of Automotive Engineers, 1993).
2vtargets' sactual2vactual
[EQ2]
s' corrected stopping distance
vtarget target maneuver entrance speedwhere
vactual actual maneuver entrance speed
sactual actual stopping distance
Figure 13. Position of Fifth Wheel on the Mercedes-Benz R350
The test procedure involved the following steps. First, the minimum brake pedal displacement magnitude required to activate BAS (termed displacement magnitude threshold) was determined. Secondly, tests to determine the minimum brake pedal application rate to activate BAS (termed application rate threshold) were performed while the displacement magnitude was held at
31

threshold. Thirdly, tests to determine the minimum brake pedal force to activate BAS (termed the force threshold) were performed. The application rate threshold when force was held at threshold was also investigated. Fourthly, multiple stops at the combined displacement magnitude and application rate threshold were performed, with both BAS enabled and disabled. Finally, multiple stops with the brake controller’s displacement and application rate set to maximum were performed with BAS enabled and disabled. The produced stopping distances were recorded. The procedures involved in these steps, as well as the results, are presented below.
MERCEDES-BENZ R350 RESULTS
Brake Pedal Displacement Magnitude Threshold
Tests to determine the brake pedal displacement magnitude threshold were performed first. During these tests, the brake controller was used to command constant pedal displacement for the duration of the braking maneuver. The amount of force applied to the brake pedal was automatically modulated (as necessary) by the brake controller to accomplish this. For these tests, the brake pedal application rate was held at the brake controller’s maximum capability, which was approximately 30 in/s. Braking maneuvers were performed with the displacement magnitude ranging from the maximum capability of the brake controller (approximately 5 in) to 5 percent of what it was capable of producing. Braking maneuvers were performed while the displacement magnitude was adjusted in steps of 10 percent of its maximum capability. The produced stopping distances are presented in Table 3.
Table 3. Corrected Stopping Distances Produced for Specified Brake Pedal Displacement Magnitudes
Vehicle Displacement
Magnitude (%)
Application Rate (%)
Target MES
MES Corrected Stopping
Distance (ft)
BAS Activated
2006 MB R350 30 99 45 45.0 355.6 No 2006 MB R350 40 99 45 45.4 191.4 No 2006 MB R350 50 99 45 45.1 127.8 No 2006 MB R350 60 99 45 45.1 80.3 Yes 2006 MB R350 70 99 45 45.3 76.9 Yes 2006 MB R350 80 99 45 45.2 75.7 Yes 2006 MB R350 90 99 45 45.5 74.0 Yes 2006 MB R350 99 99 45 45.2 75.2 Yes
Figure 14 shows the plateau in braking performance observed when BAS activated. BAS activation was confirmed by the presence of a BAS packet identifier on the vehicle network. A displacement magnitude threshold of 59 percent was determined through this procedure.
32

Figure 14. Corrected Stopping Distance by Brake Pedal Displacement Magnitude for Tests Performed at 45 mph
Brake Pedal Application Rate Threshold
Tests to determine the brake pedal application rate threshold were performed once the displacement magnitude threshold was identified. In a similar fashion to the previous suite of tests, the commanded brake pedal displacement was held constant and the application rate was varied from 99 percent to 5 percent of the controller’s capability (30 in/s). The stopping distances yielded from these tests are shown in Table 4. An application rate threshold of 60 percent was determined through this procedure. Figure 15 shows the plateau in braking performance when BAS activated.
33

Table 4. Corrected Stopping Distances Produced for Specified Brake Pedal Displacement Magnitudes
Vehicle Displacement
Magnitude (%)
Application Rate (%)
Target MES
MES Corrected Stopping
Distance (ft)
BAS Activated
2006 MB R350 59 5 45 45.1 153.9 No 2006 MB R350 59 10 45 45.3 125.8 No 2006 MB R350 59 20 45 45.0 112.0 No 2006 MB R350 59 30 45 44.9 105.3 No 2006 MB R350 59 40 45 45.2 98.4 No 2006 MB R350 59 50 45 45.0 95.1 No 2006 MB R350 59 60 45 45.1 79.2 Yes 2006 MB R350 59 70 45 45.1 78.1 Yes 2006 MB R350 59 80 45 44.4 78.6 Yes 2006 MB R350 59 90 45 45.2 77.6 Yes 2006 MB R350 59 99 45 45.1 79.2 Yes
Figure 15. Corrected Stopping Distance by Brake Pedal Application Rate for Tests Performed at 45 mph
34
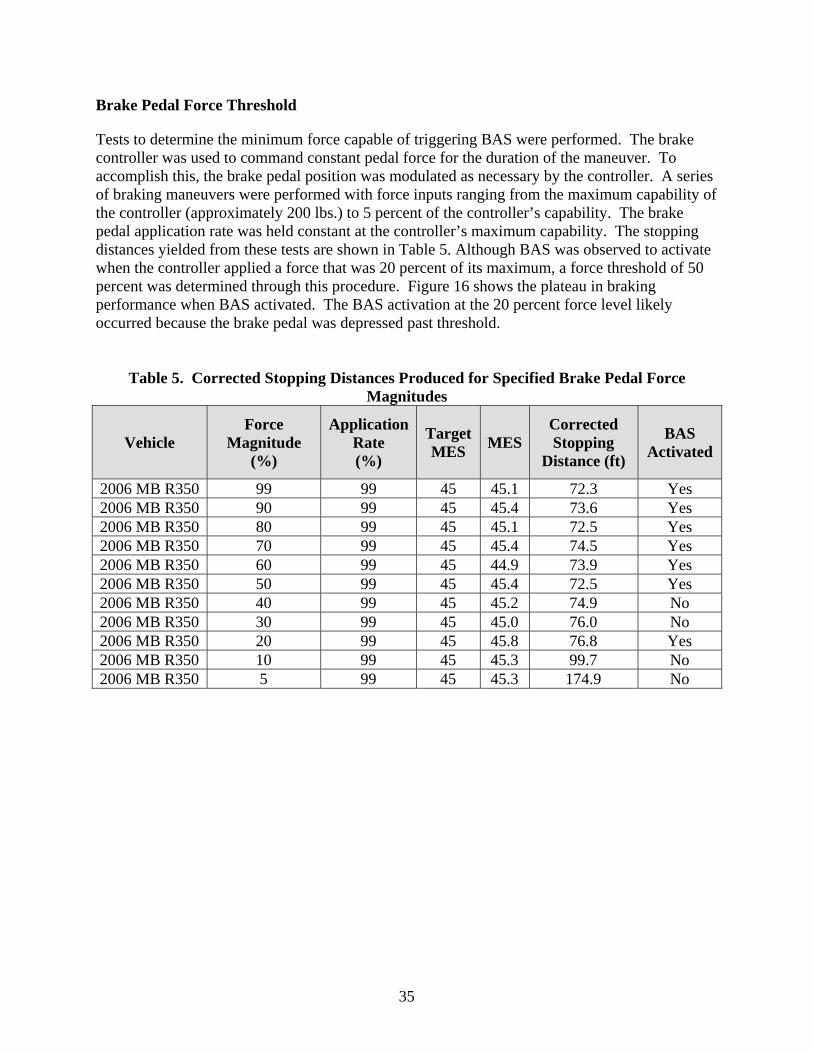
Brake Pedal Force Threshold
Tests to determine the minimum force capable of triggering BAS were performed. The brake controller was used to command constant pedal force for the duration of the maneuver. To accomplish this, the brake pedal position was modulated as necessary by the controller. A series of braking maneuvers were performed with force inputs ranging from the maximum capability of the controller (approximately 200 lbs.) to 5 percent of the controller’s capability. The brake pedal application rate was held constant at the controller’s maximum capability. The stopping distances yielded from these tests are shown in Table 5. Although BAS was observed to activate when the controller applied a force that was 20 percent of its maximum, a force threshold of 50 percent was determined through this procedure. Figure 16 shows the plateau in braking performance when BAS activated. The BAS activation at the 20 percent force level likely occurred because the brake pedal was depressed past threshold.
Table 5. Corrected Stopping Distances Produced for Specified Brake Pedal Force Magnitudes
Vehicle Force
Magnitude (%)
Application Rate (%)
Target MES
MES Corrected Stopping
Distance (ft)
BAS Activated
2006 MB R350 99 99 45 45.1 72.3 Yes 2006 MB R350 90 99 45 45.4 73.6 Yes 2006 MB R350 80 99 45 45.1 72.5 Yes 2006 MB R350 70 99 45 45.4 74.5 Yes 2006 MB R350 60 99 45 44.9 73.9 Yes 2006 MB R350 50 99 45 45.4 72.5 Yes 2006 MB R350 40 99 45 45.2 74.9 No 2006 MB R350 30 99 45 45.0 76.0 No 2006 MB R350 20 99 45 45.8 76.8 Yes 2006 MB R350 10 99 45 45.3 99.7 No 2006 MB R350 5 99 45 45.3 174.9 No
35
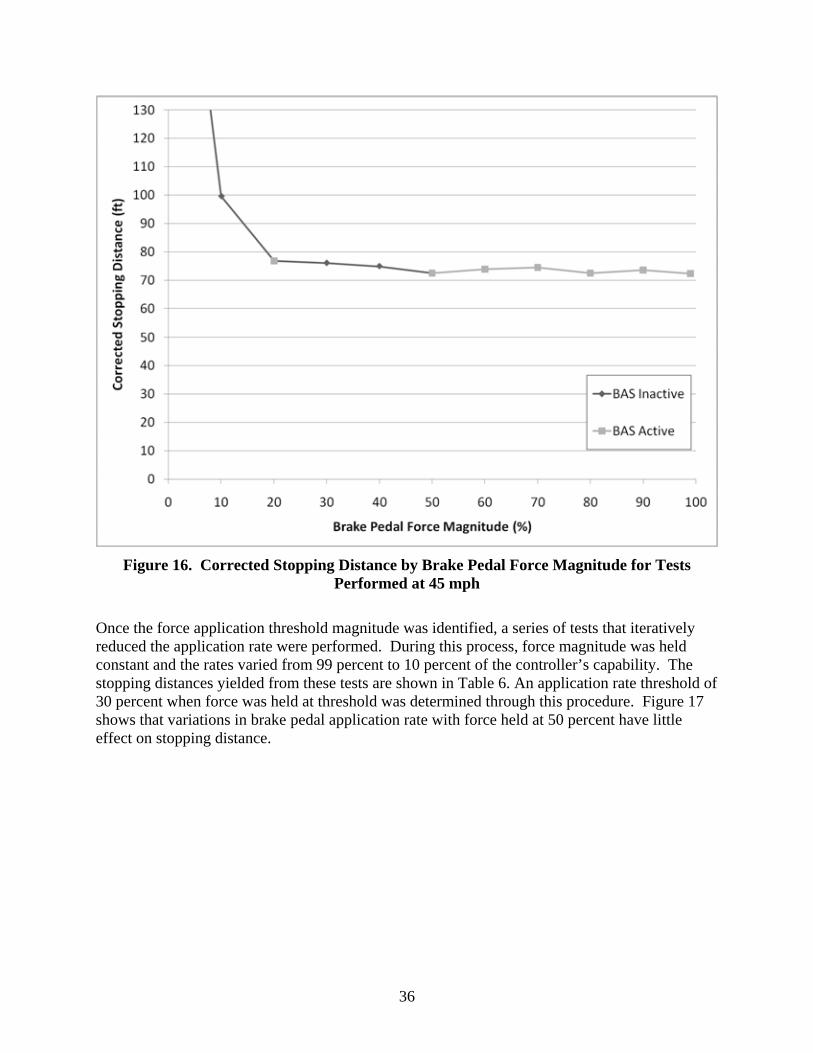
Figure 16. Corrected Stopping Distance by Brake Pedal Force Magnitude for Tests Performed at 45 mph
Once the force application threshold magnitude was identified, a series of tests that iteratively reduced the application rate were performed. During this process, force magnitude was held constant and the rates varied from 99 percent to 10 percent of the controller’s capability. The stopping distances yielded from these tests are shown in Table 6. An application rate threshold of 30 percent when force was held at threshold was determined through this procedure. Figure 17 shows that variations in brake pedal application rate with force held at 50 percent have little effect on stopping distance.
36

Table 6. Corrected Stopping Distances Produced for Specified Brake Application Rates (Holding Brake Pedal Force at 50 Percent) at 45 mph
Vehicle Force
Magnitude (%)
Application Rate (%)
Target MES
MES Corrected Stopping
Distance (ft)
BA Activated
2006 MB R350 50 99 45 44.7 74.4 Yes 2006 MB R350 50 90 45 44.8 71.2 Yes 2006 MB R350 50 80 45 45.4 74.8 Yes 2006 MB R350 50 70 45 45.5 73.1 Yes 2006 MB R350 50 60 45 45.2 72.9 Yes 2006 MB R350 50 50 45 45.1 73.1 Yes 2006 MB R350 50 40 45 45.4 73.8 Yes 2006 MB R350 50 30 45 45.2 73.7 Yes 2006 MB R350 50 20 45 45.4 73.6 No 2006 MB R350 50 10 45 45.1 75.1 No
Figure 17. Corrected Stopping Distance by Brake Pedal Application Rate (Holding Brake Pedal Force Magnitude at 50 percent) at 45 mph
37
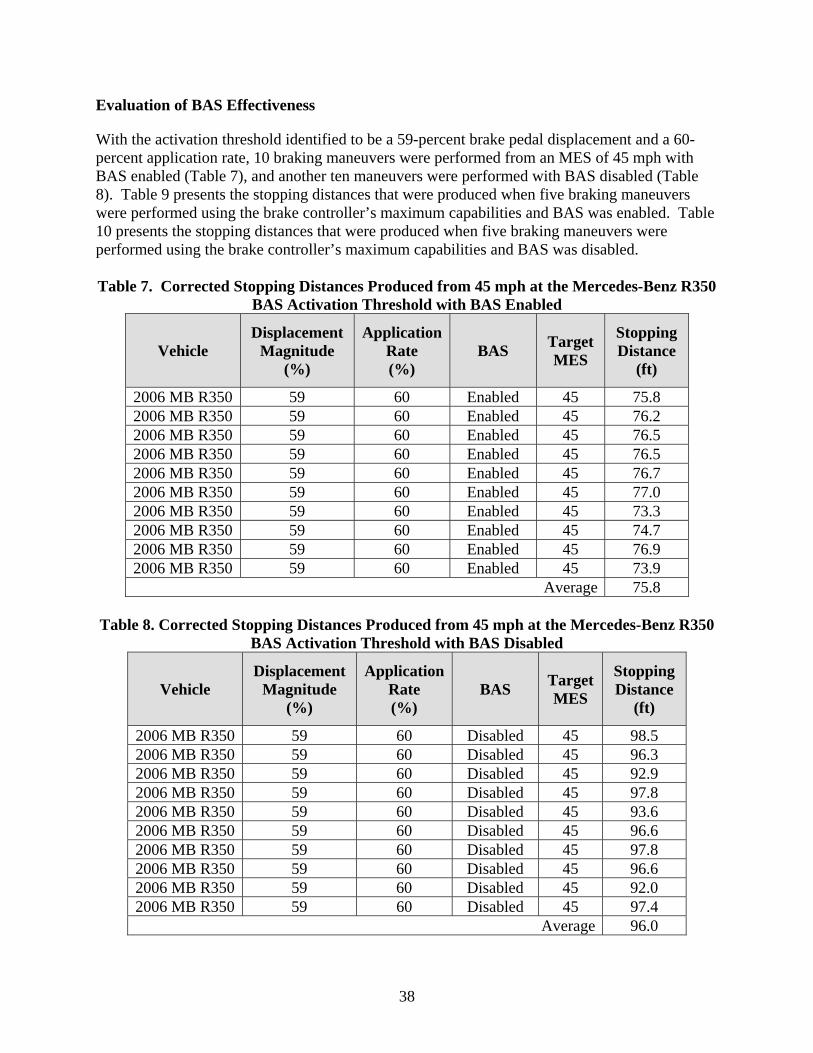
Evaluation of BAS Effectiveness
With the activation threshold identified to be a 59-percent brake pedal displacement and a 60percent application rate, 10 braking maneuvers were performed from an MES of 45 mph with BAS enabled (Table 7), and another ten maneuvers were performed with BAS disabled (Table 8). Table 9 presents the stopping distances that were produced when five braking maneuvers were performed using the brake controller’s maximum capabilities and BAS was enabled. Table 10 presents the stopping distances that were produced when five braking maneuvers were performed using the brake controller’s maximum capabilities and BAS was disabled.
Table 7. Corrected Stopping Distances Produced from 45 mph at the Mercedes-Benz R350 BAS Activation Threshold with BAS Enabled
Vehicle Displacement
Magnitude (%)
Application Rate (%)
BAS Target MES
Stopping Distance
(ft)
2006 MB R350 59 60 Enabled 45 75.8 2006 MB R350 59 60 Enabled 45 76.2 2006 MB R350 59 60 Enabled 45 76.5 2006 MB R350 59 60 Enabled 45 76.5 2006 MB R350 59 60 Enabled 45 76.7 2006 MB R350 59 60 Enabled 45 77.0 2006 MB R350 59 60 Enabled 45 73.3 2006 MB R350 59 60 Enabled 45 74.7 2006 MB R350 59 60 Enabled 45 76.9 2006 MB R350 59 60 Enabled 45 73.9
Average 75.8
Table 8. Corrected Stopping Distances Produced from 45 mph at the Mercedes-Benz R350 BAS Activation Threshold with BAS Disabled
Vehicle Displacement
Magnitude (%)
Application Rate (%)
BAS Target MES
Stopping Distance
(ft)
2006 MB R350 59 60 Disabled 45 98.5 2006 MB R350 59 60 Disabled 45 96.3 2006 MB R350 59 60 Disabled 45 92.9 2006 MB R350 59 60 Disabled 45 97.8 2006 MB R350 59 60 Disabled 45 93.6 2006 MB R350 59 60 Disabled 45 96.6 2006 MB R350 59 60 Disabled 45 97.8 2006 MB R350 59 60 Disabled 45 96.6 2006 MB R350 59 60 Disabled 45 92.0 2006 MB R350 59 60 Disabled 45 97.4
Average 96.0
38

Table 9. Corrected Stopping Distances Produced by the Mercedes-Benz R350 from 45 mph Using Maximum Brake Controller Input and BAS Enabled
Vehicle Displacement
Magnitude (%)
Application Rate (%)
BAS Target MES
Stopping Distance
(ft)
2006 MB R350 99 99 Enabled 45 73.1 2006 MB R350 99 99 Enabled 45 73.2 2006 MB R350 99 99 Enabled 45 73.8 2006 MB R350 99 99 Enabled 45 73.8 2006 MB R350 99 99 Enabled 45 72.6
Average 73.3
Table 10. Corrected Stopping Distances Produced by the Mercedes-Benz R350 from 45 mph Using Maximum Brake Controller Input and BAS Disabled
Vehicle Displacement
Magnitude (%)
Application Rate (%)
BAS Target MES
Stopping Distance
(ft)
2006 MB R350 99 99 Disabled 45 73.7 2006 MB R350 99 99 Disabled 45 73.7 2006 MB R350 99 99 Disabled 45 73.0 2006 MB R350 99 99 Disabled 45 74.7 2006 MB R350 99 99 Disabled 45 71.9
Average 73.4
Figure 18 presents the operational envelope of the Mercedes-Benz R350 BAS. The “BAS Active” and “BAS Inactive” stopping distance data were produced when the brake pedal was applied with a 99-percent application rate. The “BAS Disabled” stopping distance data were produced when the brake pedal was applied with a 60-percent application rate. It can be seen that at threshold brake pedal input, BAS activation produced a 20.2-ft improvement in stopping distance. However, BAS activation only produced a 0.1-ft improvement in stopping distance when the brake controller input was at its maximum. The improvement in stopping distance offered by BAS is thus highly dependent on the maximum braking capabilities of the driver. Drivers that are unable to displace the brake pedal all the way down, but can move it at least 59 percent of the way, stand to benefit from BAS the most.
39

Figure 18. Operational Envelope for the Mercedes-Benz BAS
Figure 19 plots the brake pedal displacement magnitude (as determined using a brake pedal string pot) and brake pedal force over the course of two braking maneuvers, one with BAS activated and the other with BAS disabled. The solid black and grey lines show the brake pedal displacement for the BAS-active and BAS-disabled stops, respectively. The dashed black and grey lines show the brake pedal force for the BAS-active and BAS-disabled stops, respectively. The braking input was commanded at the displacement magnitude and application rate threshold (59-percent displacement magnitude and 60-percent application rate) for both stops. It can be seen that the observed brake pedal displacement and pedal force were markedly different between the two stops despite equivalent input from the brake controller. With respect to displacement magnitude, it appears that BAS activation pulls the brake pedal further down than the brake controller commands (as noted by the cresting in the solid black line). When BAS is disabled, the brake pedal displacement remains flat over the course of the maneuver (as shown by the solid grey line). This finding corresponds with a decrease in brake pedal force recorded when BAS is activated (as shown by the dashed black line). When BAS is not activated, the brake pedal force does not deplete (as shown by the dashed grey line).
40

Figure 19. Plot of Brake Pedal Displacement Magnitude (in) versus Time (s) at Activation Threshold for Two Stops (one with BAS Activated, the other with BAS Disabled) using the
Mercedes-Benz R350
41

VOLVO S80 RESULTS
BAS Activation Threshold
In testing the Volvo S80, it was discovered that the brake controller was unable to generate the necessary brake pedal input to activate BAS. However, braking maneuvers performed by a VRTC professional driver were found to activate BAS. Figure 20 shows the brake pedal displacement profile for four braking maneuvers performed by the driver. BAS activated in two of the maneuvers. The produced stopping distances are shown in Table 11. Please note that the magnitude of the application rate for these stops is not accurate because the arc length of the brake pedal was not computed. Instead, these graphs are provided to show the relative differences between the four stops. It can be seen that all four stops had similar braking profiles and stopping distances.
Figure 20. Four Stops Performed by a VRTC Professional Driver. BAS Activated for Two Stops; All Stops have Similar Braking Profiles and Initial Speeds.
42

Table 11. Corrected Stopping Distances for the Volvo S80 Braking Maneuvers Maneuver BAS Activation Stopping Distance (ft)
Stop 1 No 70.8 Stop 2 No 72.7 Stop 3 Yes 71.0 Stop 4 Yes 72.6
Closer inspection of the braking profiles over the first 0.09 s reveals marginal differences in the brake pedal application rate between the four stops (Figure 21). What can be seen, however, is that the stops where BAS activated have higher brake application rates during the first 0.03 s (the slope for Stop 2 is lower than Stop 3). This marginal difference may be why BAS was not activated for Stop 2 and it was for Stop 3.
Figure 21. Brake Application Rate for the Four Stops over the First 0.09 s
Figure 22 shows the same four stops presented above along with two stops that were performed by the mechanical brake controller. Table 12 shows the achieved stopping distances. Stop 5 is the controller’s maximum displacement stop, while Stop 6 is the controller’s maximum force stop. Again, it can be seen that the braking profiles are all very similar in the initial application rate. Stop 5 yielded the shortest stopping distance of the group.
43

Figure 22. Four Stops Performed by a Human Driver (Stops 1 – 4). BAS Activated for Stops 3 and 4. Two Stops Performed by Mechanical Brake Controller (Stops 5 and 6)
Table 12. Corrected Stopping Distances for the Volvo S80 Braking Maneuvers Maneuver BAS Activation Stopping Distance (ft)
Stop 1 – Driver No 70.8 Stop 2 – Driver No 72.7 Stop 3 – Driver Yes 71.0 Stop 4 – Driver Yes 72.6
Stop 5 – Controller No 69.8 Stop 6 – Controller No 71.8
Figure 23 shows the application rate over the first 0.22 s for all six stops. It can be seen that marginal differences exist between them.
44

Figure 23. The brake application rate over the first 0.22 s for all six stops.
Figure 24 highlights the application rate for Stop 3 and Stop 6 over the first 0.03 s. Again, it can be seen that human driver is slightly faster than the brake controller. However, both application rates are fast.
45

Figure 24. The brake application rate for Stops 3 and 6 over the first 0.03 s.
SUMMARY
The BAS characterization tests revealed that the BAS activation threshold is dependent on the brake pedal displacement, activation rate, and force. An activation threshold was identified in the Mercedes-Benz R350. At threshold braking, BAS activation was found to produce a 20-ft improvement in stopping distance, while it produced a 0.1-ft improvement at maximum braking. This finding suggests that the benefits offered by BAS are dependent on the driver’s baseline braking performance. Unfortunately, a BAS activation threshold was not identified in the Volvo S80. Nevertheless, BAS activations generated by a professional driver revealed that slight differences in the brake pedal application rate were the difference between BAS activation and non-activation.
After completing the BAS characterization tests, there was a concern that normal drivers may not be able to activate BAS in the test vehicles. Thus, a pilot study that investigated whether normal drivers could activate BAS was performed.
46

PRELIMINARY HUMAN BRAKING TESTS
Both vehicles were returned to VTTI and a pilot study was performed at VTTI facilities to evaluate the potential for BAS being activated by a normal driver. Four drivers were asked to press the brake pedal as fast as possible upon hearing an auditory alarm while travelling at 45 mph. Two participants drove the Volvo S80, while the other two participants drove the Mercedes-Benz R350. Two stops were performed in this manner and BAS activation was monitored. All four drivers failed to activate BAS. As such, the participants were asked to sit in the passenger seat while the researcher demonstrated a hard-braking maneuver from 45 mph and activated BAS. Participants were then asked to mimic the demonstrated braking maneuver. Participants drove the test vehicle at 45 mph and performed two more stops. Three of the four participants activated BAS after the demonstration. Table 13, Table 14, Table 15, and Table 16 present which drivers activated BAS and when.
Table 13. Driver 1 BAS Activation Tests Using the Volvo S80
Driver Age Gender Stop BAS Activation Status
1 28 M 1 BAS-Inactive
1 28 M 2 BAS-Inactive
Demonstration
1 28 M 3 BAS-Active
1 28 M 4 BAS-Active
Table 14. Driver 2 BAS Activation Test Using the Volvo S80
Driver Age Gender Stop BAS Activation Status
2 22 M 1 BAS-Inactive
2 22 M 2 BAS-Inactive
Demonstration
2 22 M 3 BAS-Active
2 22 M 4 BAS-Inactive
47

Table 15. Driver 3 BAS Activation Tests Using the Mercedes-Benz R350
Driver Age Gender Stop BAS Activation Status
3 24 F 1 BAS-Inactive
3 24 F 2 BAS-Inactive
Demonstration
3 24 F 3 BAS-Inactive
3 24 F 4 BAS-Inactive
Table 16. Driver 4 BAS Activation Tests Using the Mercedes-Benz R350
Driver Age Gender Stop BAS Activation Status
4 20 F 1 BAS-Inactive
4 20 F 2 BAS-Inactive
Demonstration
4 20 F 3 BAS-Inactive
4 20 F 4 BAS-Active
SUMMARY
None of the four drivers activated BAS when they were instructed to press the brake pedal as fast as possible. However, three drivers were able to activate BAS after experiencing a demonstration of a BAS-active stop. This suggests that drivers are physically capable of activating BAS, they just need to be shown how to perform hard deceleration with a vehicle that is not their own. An evaluation of human braking performance with light vehicle BASs should therefore include a component that shows drivers how to press the brake pedal in order to assess whether they are physically capable of activating BAS.
48

CHAPTER 5. HUMAN BRAKING PERFORMANCE EVALUATION
INTRODUCTION
This chapter presents the methods used to evaluate human braking performed with light vehicle BASs. The results as they pertain to the research questions listed in Chapter 3 are reported.
METHODS
Participants
Sixty-four participants, balanced for age and gender, took part in the study. Participants were equally selected from two age groups: a younger age group consisting of drivers between the ages of 18 and 25 years old, and an older age group consisting of drivers 65 years old and older. Participants had to have a minimum visual acuity of 20/40 and had to be able to hear 500 Hz, 1 kHz, and 2 kHz tones evoked no more than 50 dB with their best ear. Participants were also screened for lingering effects of neck/spine injuries/pain, heart/cardiovascular conditions, history of a stroke, brain tumors, head injuries, and motion sickness. Participants also could not take part if they had a recent occurrence of a respiratory disorder, dizziness, vertigo, or other balance problems, inner ear problems, migraine and tension headaches, epileptic seizures, diabetes, advanced osteoporosis, eye injuries or retinal detachment. They were asked to wear closed-toe shoes for the experiment so that their footwear did not hinder their braking performance.
Instrumentation
Data Acquisition System (DAS)
The DAS used for this study is the result of almost two decades of development by VTTI. The DAS is a highly flexible and modular central data collection device which has been used in a number of naturalistic driving studies (Blanco, Hickman, Klauer, & Hanowski, 2006). It is based on a microcomputer which receives, processes, and stores data for sensors positioned throughout the vehicle. Data were recorded at 20 Hz. The DAS unit was mounted in the trunk of the automobile, in a position which allowed access to the removable hard drive which was used to store the collected data (Figure 25). The DAS has an interface to the experimental vehicle CAN, which allows for the monitoring and recording of the status of several facets of vehicle operation. This capability was used to record ABS and BAS activation.
49

Figure 25. Data Acquisition System Mounted in the Trunk of the Volvo S80
Audio and Video Recording
Four cameras were mounted inside each experimental vehicle. These cameras provided views of the driver, forward roadway, steering wheel and dashboard, and the pedals (Figure 26). Additionally, a microphone was inconspicuously mounted on the dashboard to record audio from inside the vehicle.
50

Figure 26. Multiplex View from Vehicle Cameras
Virginia Smart Road
This experiment was conducted on the Virginia Smart Road (Figure 27). The Virginia Smart Road is a closed-course test track that was designed to facilitate research on Intelligent Transportation Systems (ITS), human factors and transportation safety, and road surface properties. The road is built to Virginia Department of Transportation (VDOT) and Federal Highway Administration (FHWA)standards. To ensure participant safety when conducting experiments, the Smart Road restricts public access and is monitored through video surveillance 24 hours a day, 7 days per week. The road is outfitted with a wireless network that ties into the research building’s data network. This network may be used for data transfer between the vehicle, the research building, and infrastructure within the road. Differential global positioning system (GPS) corrections are broadcast from the research building to the road. Experimental vehicles are equipped with portable GPS units that, when combined with the differential GPS corrections, allow for extremely accurate (on the order of ±1.5 cm) on-road vehicle positioning. A full listing of all Smart Road capabilities and uses is provided in Appendix E.
51

Figure 27. Diagram of the Virginia Smart Road
EXPERIMENTAL DESIGN
The experimental design used to evaluate BAS consisted of comparing the observed corrected stopping distances by BAS activation, the test vehicles used, drivers’ age, drivers’ gender, as well as drivers’ expectancy to the barricade. The independent and dependant variables are explained in further detail below.
Independent Variables
The following independent variables were analyzed in this study.
BAS Activation (BAS Active, BAS Inactive)
The BAS Activation independent variable had two levels, BAS Active and BAS Inactive. It is important to remember that participants cannot be forced to activate BAS. BAS can only be enabled. As such, participants were exposed to conditions that were believed to motivate them to press the brake pedal in a way that would activate BAS. The trials in which BAS was enabled and activated were assigned to the BAS Active level. Trials where BAS did not activate from insufficient brake pedal input were assigned to the BAS Inactive level. BAS activation was a
52

between-subjects variable. However, BAS was disabled in certain test scenarios. As such, the BAS Activation measure was also treated as a within-subject variable for some analyses. The two levels used for these statistical tests were BAS Active and BAS Disabled.
Vehicle (2006 Mercedes-Benz R350, 2007 Volvo S80)
The test vehicle was a between-subjects variable. The two vehicles in this study were used to explore how different BAS technologies supplement drivers’ panic-braking performance. Participants were randomly assigned to each test vehicle for this study.
Age (Older, Younger)
Age was a between-subjects variable. It was evaluated at two levels: older drivers aged 65 years old and above, and younger drivers aged 18 to 25 years old. Age was investigated to see whether BAS equally supported younger and older drivers.
Gender (Female, Male)
Gender was also a between-subjects variable. It was included to investigate whether BAS equally supported male and female drivers.
Expectancy (Unexpected, Anticipated)
Braking performance to an unexpectedly inflated barricade was compared to the braking performance exhibited when the barricade was anticipated. Here, expectancy was used as a within-subjects variable for these tests.
Dependent Variables
The following measures were analyzed to characterize drivers’ braking performance.
Corrected Stopping Distance
The stopping distance yielded by each braking maneuver was normalized using the same approach recommended in SAE J299 (Society of Automotive Engineers, 1993) and used in the BAS characterization tests. Stopping distance was measured on each vehicle with a Link Engineering Nucleus NC-8 fifth-wheel system (Figure 28). This system consists of a single 26inch aluminum wheel with a tube-filled Kevlar tire. The wheel and tire are supported by a stainless steel arm which connects to the vehicle’s receiver hitch. Contact between the ground and tire is maintained by a spring system which ensures a 30 lb wheel to ground force. The speed range of the NC-8 is 0 to 80 mph. The NC-8 encoder provides 214 pulses per revolution and was connected to the vehicle’s DAS to facilitate data recording.
53

Figure 28. Fifth Wheel and Hitch Setup on the Volvo S80
Brake Pedal Displacement
Brake pedal displacement refers to how far the driver pressed on the brake pedal. A regression equation was developed in order to determine the pedal travel, in inches, of the two experimental vehicles’ brake pedals. The experimental vehicle’s DAS used this equation to convert the percent travel of the vehicle (reported via the vehicle’s CAN) into a value reported along with other DAS recorded variables. The distances from the pedal’s pivot point to the top and bottom of the brake pedal’s pad were obtained for each vehicle (Figure 29). Using an angle-gauge (a device with a range of 180 degrees and a resolution of 0.1 degrees), it was determined that each pedal’s travel was approximately circular. Corresponding angle measurements were taken at a variety of points along the pedal’s range of travel. Corresponding values for the pedal travel in percent were obtained for each measurement (Table 17 and Table 18).
Figure 29. Diagram Showing Measurement Locations on Brake Pedal Pad
54

Table 17. Mercedes-Benz R350 Pedal Travel Measurements Percent Travel
(degrees)
Pedal Angle
(degrees)
Top Pedal Travel
(in)
Bottom Pedal Travel
(in) Notes
0.34 60.0 -- -- Measured at zero loading 11.22 61.5 0.2 0.2 22.27 63.6 0.2 0.5 32.47 65.4 0.5 0.7 45.56 67.1 0.7 0.9 68.16 70.9 1.1 1.4
Note. Length from pivot to top of pedal is 11.5 in. Length from pivot to bottom of pedal is 14.34 in.
Table 18. Volvo S80 Pedal Travel Measurements Percent Travel
(degrees)
Pedal Angle
(degrees)
Top Pedal Travel
(in)
Bottom Pedal Travel
(in) Notes
14.50 53.5 -- -- Measured at zero loading 19.60 54.2 0.1 0.1 22.80 55.3 0.2 0.2 26.50 56.2 0.3 0.3 30.50 57.1 0.4 0.5 32.40 57.5 0.4 0.5 36.00 58.6 0.5 0.6 41.79 60.0 0.7 0.8 44.00 60.9 0.8 0.9 46.00 61.3 0.8 1.0 50.00 63.8 1.1 1.3
Note. Length from pivot to top of pedal is 12.125 in. Length from pivot to bottom of pedal is 14.4375 in.
From the recorded distances between the pivot point and the top and bottom edge of the pedal’s pad, the arithmetic mean was used to obtain a measure of the center of the pad. This value was used to determine the circumference of the circle describing the pedal’s travel. Using the circumference and angle measurement obtained at each point, the pedal travel distance was obtained in inches. This calculated value was used, along with the percent travel, to form a regression equation. This equation used percent travel (x, in the equations below) to determine the pedal’s travel distance in inches (y, in the equations below). The predicted range of the two pedals is given in Figure 30.
Volvo S80 y = 0.06x - 1.06, R2 = 0.980 [EQ3]
Mercedes-Benz R350 y = 0.04x – 0.02, R2 = 0.998 [EQ4]
55

Figure 30. Plot of Predicted Values for Pedal Travel in Percent and Inches
Brake Pedal Application Rate
The brake pedal application rate refers to the rate in which drivers pressed the brake pedal at the onset of the braking maneuver. It was measured by dividing the brake pedal displacement achieved in the first 0.05 s of the maneuver by 0.05 s. The brake pedal application rate was reported in in/s.
Brake Pedal Displacement of First Inflection Point
The brake pedal displacement first inflection point represents the initial pedal displacement exhibited in a panic-braking maneuver. It was measured as the point at which the brake pedal displacement starts to go back down after the initial braking onset. Figure 31 illustrates where the first inflection point occurs. The circle denotes the first inflection point. The grey area of the data series denotes the pedal displacement from the first inflection point to the last inflection point (where drivers begin to take their foot off the brake pedal after the vehicle has stopped).
56

Figure 31. Brake Pedal Displacement First Inflection Point
Maximum Brake Pedal Displacement
The maximum brake pedal displacement is the furthest distance the driver moves the brake pedal over the course of the braking maneuver. Figure 32 illustrates the highest point of the brake pedal displacement with a circle.
57
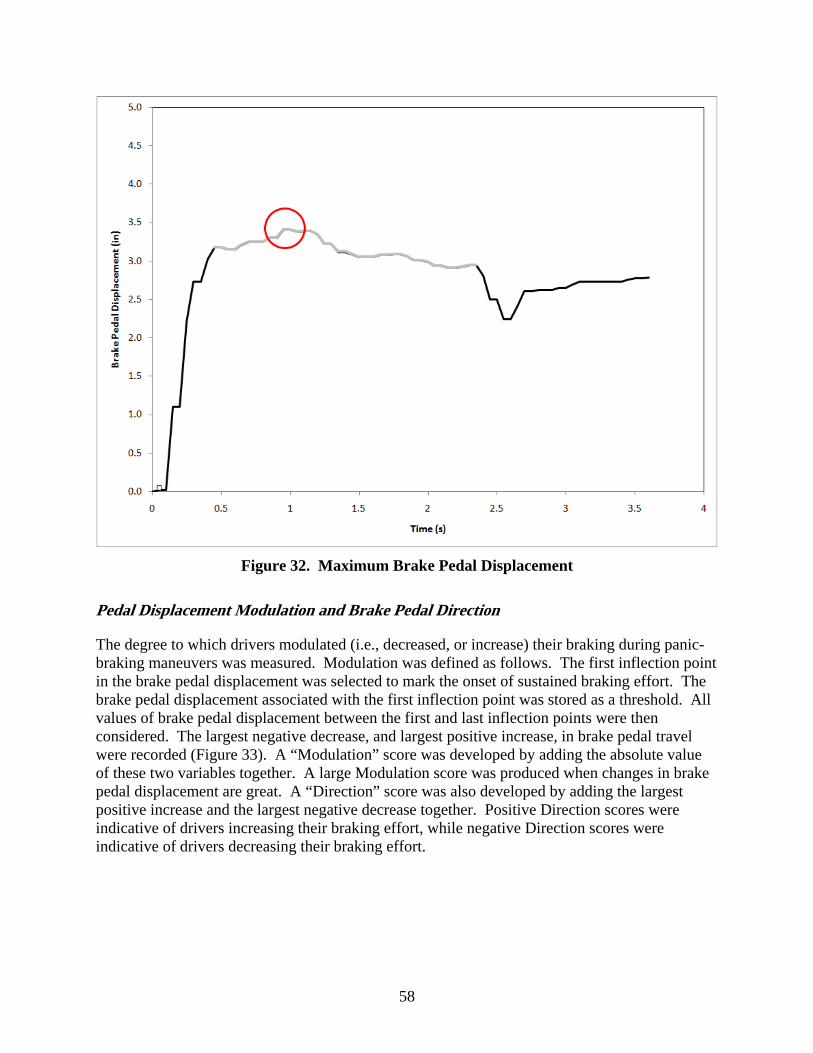
Figure 32. Maximum Brake Pedal Displacement
Pedal Displacement Modulation and Brake Pedal Direction
The degree to which drivers modulated (i.e., decreased, or increase) their braking during panic-braking maneuvers was measured. Modulation was defined as follows. The first inflection point in the brake pedal displacement was selected to mark the onset of sustained braking effort. The brake pedal displacement associated with the first inflection point was stored as a threshold. All values of brake pedal displacement between the first and last inflection points were then considered. The largest negative decrease, and largest positive increase, in brake pedal travel were recorded (Figure 33). A “Modulation” score was developed by adding the absolute value of these two variables together. A large Modulation score was produced when changes in brake pedal displacement are great. A “Direction” score was also developed by adding the largest positive increase and the largest negative decrease together. Positive Direction scores were indicative of drivers increasing their braking effort, while negative Direction scores were indicative of drivers decreasing their braking effort.
58
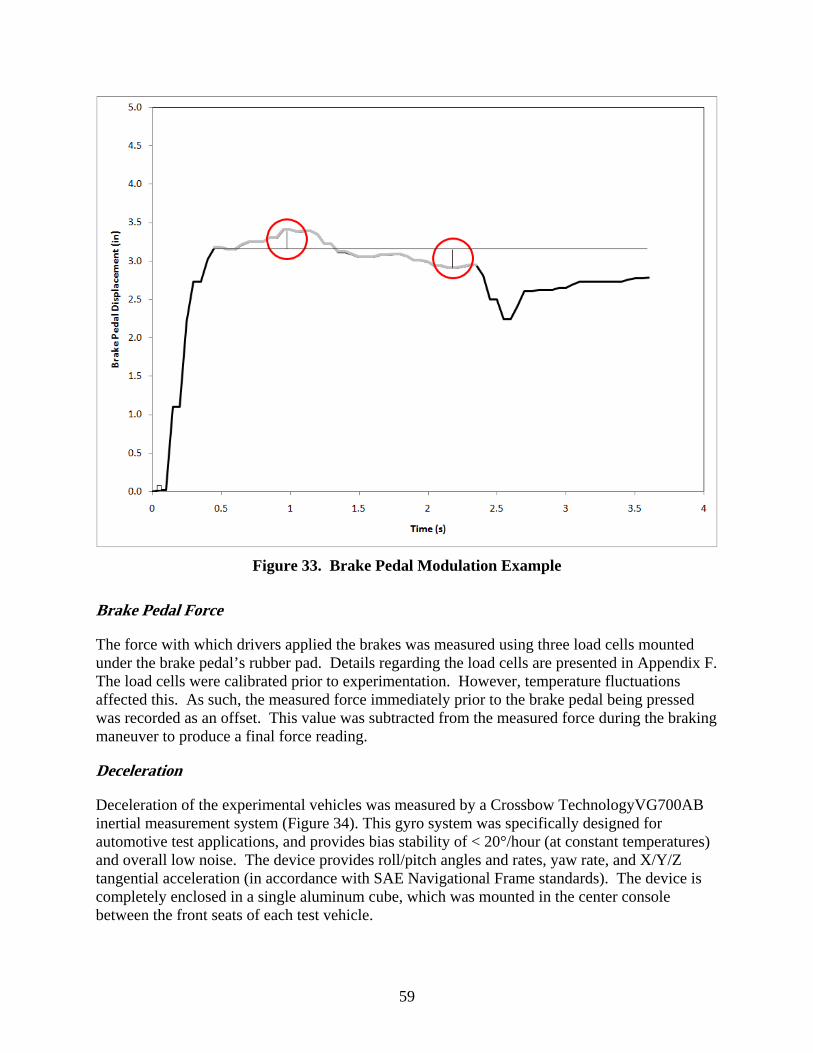
Figure 33. Brake Pedal Modulation Example
Brake Pedal Force
The force with which drivers applied the brakes was measured using three load cells mounted under the brake pedal’s rubber pad. Details regarding the load cells are presented in Appendix F. The load cells were calibrated prior to experimentation. However, temperature fluctuations affected this. As such, the measured force immediately prior to the brake pedal being pressed was recorded as an offset. This value was subtracted from the measured force during the braking maneuver to produce a final force reading.
Deceleration
Deceleration of the experimental vehicles was measured by a Crossbow TechnologyVG700AB inertial measurement system (Figure 34). This gyro system was specifically designed for automotive test applications, and provides bias stability of < 20°/hour (at constant temperatures) and overall low noise. The device provides roll/pitch angles and rates, yaw rate, and X/Y/Z tangential acceleration (in accordance with SAE Navigational Frame standards). The device is completely enclosed in a single aluminum cube, which was mounted in the center console between the front seats of each test vehicle.
59

Figure 34. Location of Crossbow Inertial Measurement System in Mercedes-Benz R350
Brake Response Time (BRT)
The elapsed time from the barricade receiving a command to launch to drivers beginning to press the brake pedal was measured as drivers’ BRT. This provided a measure of how quick drivers were at responding to the crash threat.
Procedure
Participant Recruitment
Participant safety was a crucial aspect in the BAS study. Once solicited over the phone (Appendix G), participants were given the Informed Consent Form (via e-mail or telephone) before being scheduled to participate in the study. This was done to make sure participants were aware of the potential risks involved with the BAS study. Although participants were not explicitly told that they were partaking in a braking experiment, they were given the following information:
60

“Some studies at VTTI involve an unanticipated event. You may or may not encounter such an event during this study. Please be aware that equipment failure, changes in the test track, stray or wild animals entering the road, and weather changes may require you to respond accordingly. The appropriate response may or may not involve rapid deceleration.”
The Informed Consent Form also outlined the potential risks the participant may be exposed to while volunteering for the study, as well as the precautions the researchers took to ensure their safety. The Informed Consent Form is presented in Appendix H. The full board approval provided by the Virginia Tech Institutional Review Board (IRB) is presented in Appendix I.
Participant Screening
Upon arriving at VTTI, participants re-read and signed the Informed Consent Form. They were given an informal hearing test with an Earscan audiometer. Since a portion of the study involved braking to an auditory alarm, participants had to detect 500 Hz, 1 kHz and 2 kHz tones at or less than 50 dB with their best ear in order to participate. Participants were allowed to wear a hearing aid during this test. Participants also completed a Snellen vision test and had to have a visual acuity of 20/40 or better with or without correction to participate. Participants’ height and weight were measured. Participants were then seated in the test vehicle where they were asked to adjust the seat and mirrors to their liking and to fasten their seat belt. The experimenter then sat in the back seat on the passenger side and instructed participants to drive out to the Virginia Smart Road. The pre-participation screening protocol is provided in Appendix J.
Vehicle Familiarization
It was important to allow participants to become familiar with the test vehicle prior to exposing them to the unexpected braking event. This was accomplished by having participants perform a haptic (touch) stimuli detection task for 25 minutes while they drove at 45 mph. The apparatus used for this task was developed in a previous study conducted at VTTI. The task involved participants counting aloud when a Light Emitting Diode (LED) mounted on the front dash illuminated. The LED was mounted such that participants could see it in their periphery while they monitored the forward roadway. While illuminated, a non-sliding 0.75” thick cushion which participants sat on vibrated. Vibrations under participants’ left leg signaled them to look left, while vibrations under their right leg signaled them to look right. As a vibration was generated, an LED mounted on the left or right B-pillars illuminated. Participants indicated when these LEDs illuminated. Participants said the word “Left” aloud if the left LED was lit, and they said the word “Right” aloud if the right LED was lit. After responding, all LEDs were turned off and the experiment proceeded to the next trial. Five trials were performed per lap, which resulted in the alerts being presented roughly every 30 s (trials were not performed while the vehicle traveled over bridges or through turns).
To encourage participants to keep their foot on the throttle prior to the unexpected braking event, colored cones were placed around the Smart Road to provide guidance regarding speed control. Participants were instructed to reach 45 mph by the time they passed a green cone placed near the entrance of the Smart Road, and not to decelerate until they passed an orange cone placed at the end of the Smart Road. It should be noted that the Smart Road has a 3-percent grade to it.
61
This allowed drivers to reasonably keep their foot on the throttle all the time as they drove up the road prior to the unexpected braking event.
There was a concern that the surprise braking event would be the first braking maneuver drivers performed with the unfamiliar vehicle. To address this concern, a ruse was set up that asked participants to quickly stop the vehicle during the 25-minute familiarization stage. As the participants drove down the Smart Road on their first lap, the experimenter exclaimed “Oh wait, please stop here! I forgot to start recording.” Although participants did not perform an emergency braking maneuver, they did quickly bring the vehicle to a stop. This maneuver also served to warm the brakes up for the unexpected braking event.
Unexpected Braking at the Barricade
After the haptic stimuli detection task was completed, the experimenter asked participants to drive up the road as they normally would during everyday driving. This took about 3 minutes. At the top of the road, a nylon barricade was inflated unbeknownst to the drivers (Figure 35). The barricade appeared when the TTC was 2.5 s. It should be noted that because delays occurred in wirelessly sending launch commands to the barricade from the vehicle, and from the barricade inflating before it popped out of the road, the 2.5-second TTC was achieved by sending the launch command once the TTC dropped below 3.0 s. The TTC was set to be short enough to instigate an emergency braking response (longer TTCs would provide too much time and fail to encourage rapid decelerations), and long enough to allow those drivers that pressed the brakes fast and hard to stop before the barricade. The 2.5-second TTC was selected from referencing previous braking study literature (Forkenbrock, et al., 1999a; Mazzae, 1999; Mazzae, et al., 1999) and from initial pilot testing.
62

Figure 35. Inflatable Barricade use for Unexpected Braking Maneuver
After the participants were exposed to the inflatable barricade, the researcher apologized for not revealing the additional purpose of the study. The participants were asked to park the test vehicle in front of the Smart Road exit. Participants were given an information sheet (Appendix K), which was also read to them, that explained the braking study, that additional braking tests were planned, and that they were free to end the experiment if desired. All participants agreed to continue. Participants completed a questionnaire regarding the unexpected braking maneuver (Appendix L).
Anticipated Braking at the Barricade
Participants were then asked to drive around the Smart Road and brake a second time at the inflatable barricade. Although participants knew the barricade would inflate, they did not know when this would occur. Participants completed a questionnaire regarding this anticipated braking maneuver. The same TTC was used for this trial.
63

Repeated Braking Session
The experimenter then explained that the barricade would no longer inflate for the next portion of the experiment. Instead, participants were to brake as fast as possible when they heard an auditory alarm. Two orange cones were placed on either side of the line where the barricade had inflated. Participants were asked to stop before these cones. The alarm was generated using a 1.9-second TTC. This encouraged participants to quickly, and forcefully, press on the brakes.
Participants were trained for this portion of the experiment as follows. First, the experimenter sat in the driver seat and showed the participants, who stood outside the vehicle, how they should press the brake pedal. The experimenter demonstrated pedal depression three times while the vehicle was stationary. Next, the experimenter obtained the participants’ consent to demonstrate how to decelerate the vehicle from 45 mph upon hearing the alarm. The participants sat in the passenger seat while the experimenter drove the vehicle at 45 mph back up towards the area where the barricade had inflated. An auditory alarm was generated and the experimenter quickly pressed the brakes in a manner that activated brake assist. The vehicle was then parked and a mandatory 10-minute break was provided to participants. Food and water were given as participants took a walk around the vehicle. During this time, an on-road experimenter disabled brake assist if the experimental order called for it (half the participants performed the auditory alarm braking tests with brake assist enabled first, while the other half had brake assist disabled first). The experimenter mentioned to the participants that the on-road experimenter was saving the data so that suspicion would not be raised. In resuming the experiment, the participants sat in the driver seat. The experimenter stood outside the stationary vehicle and asked the participants to practice pressing the brake pedal in the manner that was demonstrated to them. The experimenter provided feedback if the driver was not pressing the brake pedal fast enough. The experimenter than sat in the back seat and the dynamic testing resumed.
Participants drove up the Smart Road at 45 mph where they decelerated the vehicle in response to the auditory alarm in the same location as the previous braking maneuvers. This was done two times. A second mandatory break was then provided while the on-road experimenter enabled, or disabled, brake assist depending on the order. Participants completed a questionnaire during this break. One final stop to the auditory alarm was then performed. Participants completed another questionnaire. Once completed, participants were asked to press the brake pedal as hard as possible with the vehicle in park. This was done three times and allowed for the measurement of their maximum braking force. The Brake Assist safety feature was then explained to the participants and they were asked if they were aware of any assisted braking by the vehicle throughout the experiment. Participants then drove the vehicle back to VTTI where they were paid $20 an hour for their time.
RESULTS
The results of the BAS evaluation are presented in this section. The collected measures were compared across drivers using Krustal-Wallis tests, a non-parametric equivalent to a one-way analysis of variance (ANOVA). When specific measures were compared within each driver, Wilcoxon signed-ranks tests, the non-parametric equivalent to a paired t-test, were performed.
64

The Brake Assist Effect
Research Question 1. Overall, does BAS affect panic-braking stopping distance?
Research question 1 set out to investigate the effect of BAS on panic-braking stopping distance. Panic braking was operationally defined as a braking maneuver in which ABS activated and the vehicle came to a complete stop. Recall that all braking maneuvers in this study were performed on dry pavement. A Krustal-Wallis test also showed that ABS-active stops had significantly higher decelerations than ABS-inactive stops (H(1) = 6.7194, p = 0.0095). The approach involved comparing the corrected stopping distances for panic-braking maneuvers in which BAS activated to the corrected stopping distances of panic-braking maneuvers in which BAS did not activate.
Unexpected Braking at the Barricade
The first braking maneuver consisted of stopping at an unexpectedly inflated barricade that spanned the road. Eleven of the 64 drivers (17 percent) came to a complete stop (Table 19). Seven drivers drove the Mercedes-Benz R350, while four drivers drove the Volvo S80. The other drivers did not stop, either because they crashed from taking too long to press the brake pedal or they decided to drive through the barricade. Six drivers avoided a collision with the barricade. One was an older male driving the Mercedes-Benz R350, two were younger females (one drove the Mercedes-Benz R350, while the other drove the Volvo S80), and three were younger males (two drove the Mercedes-Benz R350, while the third driver drove the Volvo S80). All four S80 drivers activated ABS during the stop, while none of the R350 drivers activated ABS. None of the drivers activated BAS. The effect of BAS on drivers’ braking performance was thus investigated using the data produced from the subsequent braking maneuvers. The stopping distance for these drivers, displayed as a function of pedal displacement and ABS activations, is provided in Appendix M.
Table 19. Drivers Who Stopped to Surprise Barricade
Vehicle Driver Gender Age Stopped Collision
with Barricade
ABS BAS Stopping Distance
R350 1 Female Older No Yes No No .
R350 2 Female Older No Yes No No .
R350 3 Female Older No Yes No No .
R350 4 Female Older No Yes No No .
R350 5 Female Older No Yes No No .
R350 6 Female Older No Yes No No .
R350 7 Female Older No Yes No No .
65

Vehicle Driver Gender Age Stopped Collision
with Barricade
ABS BAS Stopping Distance
R350 8 Female Older No Yes No No .
R350 9 Male Older Yes Yes No No 112.69
R350 10 Male Older No Yes No No .
R350 11 Male Older Yes No No No 109.13
R350 12 Male Older No Yes No No .
R350 13 Male Older No Yes No No .
R350 15 Male Older No Yes No No .
R350 16 Male Older No Yes No No .
R350 45 Male Older No Yes No No .
R350 46 Male Older No Yes No No .
R350 17 Female Younger No Yes No No .
R350 19 Female Younger Yes Yes No No 135.70
R350 20 Female Younger No Yes No No .
R350 23 Female Younger Yes No No No 107.09
R350 24 Female Younger No Yes No No .
R350 30 Female Younger No Yes No No .
R350 51 Female Younger No Yes No No .
R350 67 Female Younger No Yes No No .
R350 25 Male Younger Yes No No No 93.19
R350 26 Male Younger No Yes No No .
R350 28 Male Younger No Yes No No .
R350 29 Male Younger Yes Yes No No 98.21
R350 31 Male Younger No Yes No No .
66

Vehicle Driver Gender Age Stopped Collision
with Barricade
ABS BAS Stopping Distance
R350 32 Male Younger No Yes No No .
R350 59 Male Younger Yes No No No 99.25
R350 68 Male Younger No Yes No No .
S80 33 Female Older No Yes No No .
S80 34 Female Older No Yes No No .
S80 35 Female Older No Yes No No .
S80 36 Female Older No Yes No No .
S80 38 Female Older No Yes No No .
S80 39 Female Older No Yes No No .
S80 40 Female Older No Yes No No .
S80 70 Female Older No Yes No No .
S80 41 Male Older No Yes No No .
S80 42 Male Older No Yes No No .
S80 43 Male Older No Yes No No .
S80 44 Male Older Yes Yes Yes No 131.55
S80 47 Male Older Yes Yes Yes No 133.03
S80 48 Male Older No Yes No No .
S80 69 Male Older No Yes No No .
S80 21 Female Younger No Yes No No .
S80 50 Female Younger No Yes No No .
S80 52 Female Younger No Yes No No .
S80 53 Female Younger Yes No Yes No 107.66
S80 54 Female Younger No Yes No No NA
67

Vehicle Driver Gender Age Stopped Collision
with Barricade
ABS BAS Stopping Distance
S80 55 Female Younger No Yes No No .
S80 56 Female Younger No Yes No No .
S80 65 Female Younger No Yes No No .
S80 49 Male Younger No Yes No No .
S80 57 Male Younger Yes No Yes No 123.01
S80 58 Male Younger No Yes No No .
S80 60 Male Younger No Yes No No .
S80 61 Male Younger No Yes No No .
S80 62 Male Younger No Yes No No .
S80 63 Male Younger No Yes No No .
S80 64 Male Younger No Yes No No .
Anticipated Braking at the Barricade
The second braking maneuver consisted of drivers performing another stop at the inflatable barricade. Drivers were aware that the barricade would inflate; however, they did not know when this would occur. The barricade failed to launch at the specified TTC for driver 54. Not considering this driver, 58 of the 63 eligible drivers (92 percent) came to a complete stop (Table 20). All Mercedes-Benz R350 drivers came to a complete stop, while five Volvo S80 drivers did not stop (three drivers were older females and two drivers were younger females). Of the drivers that stopped, three drivers (5 percent) collided with the barricade (all were driving the Volvo S80). All 33 R350 drivers failed to activate ABS and BAS. However, seven Volvo S80 drivers activated ABS (11 percent of eligible drivers). All seven drivers stopped before the barricade. Three of these seven drivers activated BAS (5 percent of eligible drivers). All three BAS activations were generated by older male drivers. It should be noted that ABS and BAS activation were unknown for one Volvo S80 driver owing to a data collection failure. The stopping distance for these drivers, displayed as a function of pedal displacement and ABS and BAS activations, is provided in Appendix N.
68

Table 20. Drivers Who Stopped at the Anticipated Barricade
Vehicle Driver Gender Age Stopped Collision
with Barricade
ABS BAS Stopping Distance
R350 1 Female Older Yes No No No 126.15
R350 2 Female Older Yes No No No 109.97
R350 3 Female Older Yes No No No .
R350 4 Female Older Yes No No No 106.15
R350 5 Female Older Yes No No No 78.21
R350 6 Female Older Yes No No No .
R350 7 Female Older Yes No No No 116.05
R350 8 Female Older Yes No No No 106.09
R350 9 Male Older Yes No No No 121.17
R350 10 Male Older Yes No No No 91.71
R350 11 Male Older Yes No No No 107.57
R350 12 Male Older Yes No No No 96.09
R350 13 Male Older Yes No No No 114.42
R350 15 Male Older Yes No No No 103.24
R350 16 Male Older Yes No No No 111.93
R350 45 Male Older Yes No No No 72.80
R350 46 Male Older Yes No No No 112.97
R350 17 Female Younger Yes No No No 119.06
R350 19 Female Younger Yes No No No 123.41
R350 20 Female Younger Yes No No No 117.43
R350 23 Female Younger Yes No No No 97.47
R350 24 Female Younger Yes No No No 130.46
R350 30 Female Younger Yes No No No .
69

Vehicle Driver Gender Age Stopped Collision
with Barricade
ABS BAS Stopping Distance
R350 51 Female Younger Yes No No No 87.74
R350 67 Female Younger Yes No No No 122.62
R350 25 Male Younger Yes No No No 93.45
R350 26 Male Younger Yes No No No 110.79
R350 28 Male Younger Yes No No No 105.42
R350 29 Male Younger Yes No No No 129.56
R350 31 Male Younger Yes No No No 107.52
R350 32 Male Younger Yes No No No 91.74
R350 59 Male Younger Yes No No No 132.65
R350 68 Male Younger Yes No No No 122.62
S80 33 Female Older No Yes No No .
S80 34 Female Older Yes No No No 135.85
S80 35 Female Older Yes No No No 113.27
S80 36 Female Older No Yes No No .
S80 38 Female Older Yes Yes No No 106.83
S80 39 Female Older Yes Yes No No 109.77
S80 40 Female Older Yes No No No 105.14
S80 70 Female Older Yes No No No 108.13
S80 41 Male Older Yes No No No 93.12
S80 42 Male Older Yes No No No 100.92
S80 43 Male Older Yes No Yes Yes 97.00
S80 44 Male Older Yes No Yes Yes 74.87
S80 47 Male Older Yes No No No 97.93
70

Vehicle Driver Gender Age Stopped Collision
with Barricade
ABS BAS Stopping Distance
S80 48 Male Older Yes No Yes Yes 77.09
S80 69 Male Older Yes No Yes No 90.77
S80 21 Female Younger No Yes No No .
S80 50 Female Younger No Yes No No .
S80 52 Female Younger No Yes No No .
S80 53 Female Younger Yes No No No 133.12
S80 54 Female Younger Yes No NA NA .
S80 55 Female Younger Yes No Yes No .
S80 56 Female Younger Yes Yes No No 90.92
S80 65 Female Younger Yes No Yes No 100.95
S80 49 Male Younger Yes No No No 107.08
S80 57 Male Younger No Yes No No .
S80 58 Male Younger Yes No Yes No 93.19
S80 60 Male Younger Yes No No No 104.42
S80 61 Male Younger Yes No No No 174.26
S80 62 Male Younger Yes No No No 110.64
S80 63 Male Younger Yes No No No 119.45
S80 64 Male Younger Yes No No No 102.95
Figure 36 presents the average stopping distance by BAS activation for just the panic-braking maneuvers (ABS-active stops) performed in response to the anticipated barricade. The average stopping distance for BAS-inactive stops was 94.97 ft (s.e. = 3.07 ft, n = 3, minimum = 90.77 ft, maximum = 100.95 ft), while the average BAS-active stopping distance was 82.98 ft (s.e. = 7.04 ft, n = 3, minimum = 74.87 ft, maximum = 97.00 ft). A Krustal-Wallis test, which is a nonparametric equivalent of a one-way ANOVA, did not find this 11.98-ft difference to be statistically significant (H(1) = 1.1905, p = 0.2752). Since the Krustal-Wallis test compares the ranks of the observed stopping distances for BAS-active and BAS-inactive stops, Figure 37 shows the rank-ordered stopping distances.
71

Figure 36. Average Stopping Distance by BAS Activation. All BAS Activations in the Anticipated Braking Maneuver Occurred using the Volvo S80
72
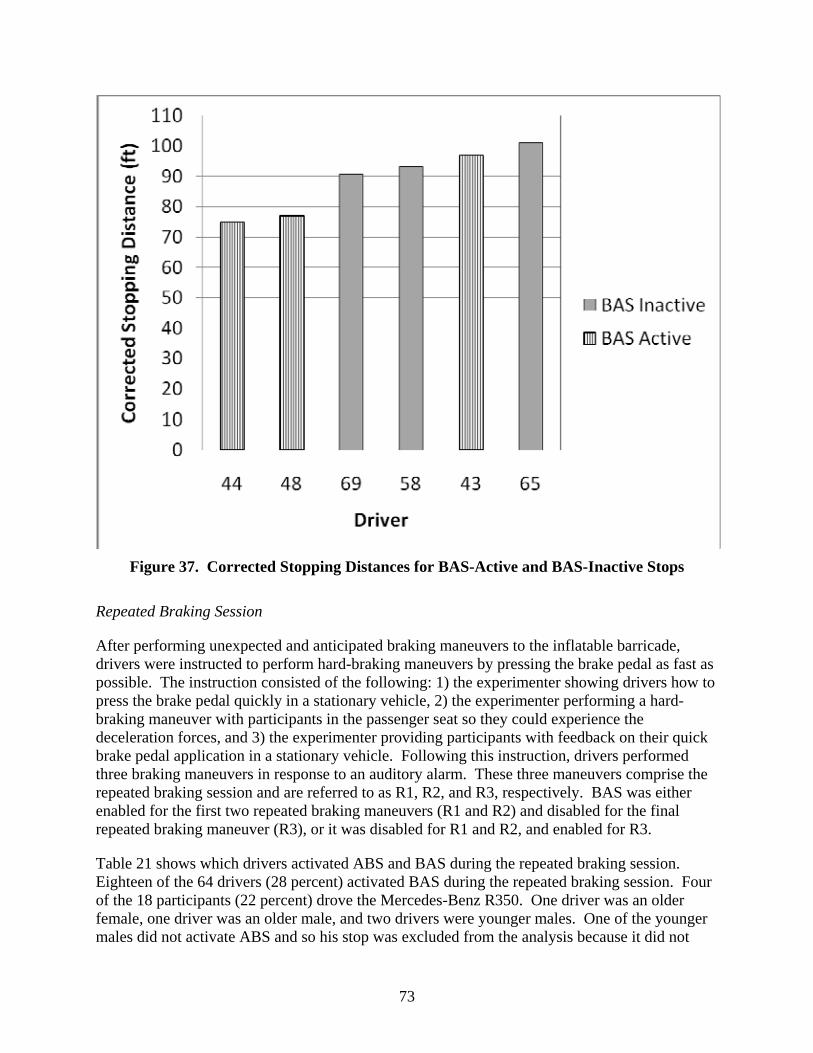
Figure 37. Corrected Stopping Distances for BAS-Active and BAS-Inactive Stops
Repeated Braking Session
After performing unexpected and anticipated braking maneuvers to the inflatable barricade, drivers were instructed to perform hard-braking maneuvers by pressing the brake pedal as fast as possible. The instruction consisted of the following: 1) the experimenter showing drivers how to press the brake pedal quickly in a stationary vehicle, 2) the experimenter performing a hard-braking maneuver with participants in the passenger seat so they could experience the deceleration forces, and 3) the experimenter providing participants with feedback on their quick brake pedal application in a stationary vehicle. Following this instruction, drivers performed three braking maneuvers in response to an auditory alarm. These three maneuvers comprise the repeated braking session and are referred to as R1, R2, and R3, respectively. BAS was either enabled for the first two repeated braking maneuvers (R1 and R2) and disabled for the final repeated braking maneuver (R3), or it was disabled for R1 and R2, and enabled for R3.
Table 21 shows which drivers activated ABS and BAS during the repeated braking session. Eighteen of the 64 drivers (28 percent) activated BAS during the repeated braking session. Four of the 18 participants (22 percent) drove the Mercedes-Benz R350. One driver was an older female, one driver was an older male, and two drivers were younger males. One of the younger males did not activate ABS and so his stop was excluded from the analysis because it did not
73

meet the preset definition of panic braking. Fourteen of the 18 drivers (78 percent) drove the Volvo S80. Two drivers were older females, one driver was an older male, five drivers were younger females, and six drivers were younger males. Table 22 shows which drivers activated BAS when collapsing across vehicles. The driver’s age was found to have a marginally significant effect on BAS activation (χ2(1) = 3.5556, p = 0.0593). The driver’s gender was not found to have a statistically significant effect on BAS activation (χ2(1) = 0.2222, p = 0.6374).
Table 21. Corrected Stopping Distances Observed in the Repeated Braking Session
Driver Vehicle Gender Age
Stop R1 Stop R2 Stop R3
ABS BAS Distance ABS BAS Distance ABS BAS Distance
1 R350 Female Older No No 78.33 No No 67.89 No D 83.27
2 R350 Female Older No No 76.45 No No 76.17 Yes D 73.56
3 R350 Female Older No No 71.41 No No 84.33 No D 79.91
4 R350 Female Older No No 77.49 No No 71.45 Yes D 67.85
5 R350 Female Older No D 69.35 No D 70.81 No No 73.03
6 R350 Female Older Yes D NA Yes D NA Yes Yes 69.08
7 R350 Female Older No D 83.67 No D 69.86 No No 71.60
8 R350 Female Older No D 80.23 No D 81.21 Yes No 79.21
9 R350 Male Older No D 70.50 Yes D 77.58 No No 76.31
10 R350 Male Older Yes Yes 67.68 Yes Yes 63.41 Yes D 73.98
11 R350 Male Older No No 96.35 No No 65.90 Yes D 68.15
12 R350 Male Older No D Driver did not stop
No D 81.05 No No 78.81
13 R350 Male Older No D 74.02 Yes D 71.59 Yes No 72.44
15 R350 Male Older No D 76.39 No D 76.68 No No 70.79
16 R350 Male Older No D 75.48 Yes D 71.66 NA
45 R350 Male Older No D 75.28 No D 71.59 No No 73.69
46 R350 Male Older No D 75.37 No D 74.91 No No 74.45
17 R350 Female Younger Yes No 69.27 Yes No 70.42 Yes D 67.41
19 R350 Female Younger No No 74.48 No No 72.34 Yes D 72.48
74

Driver Vehicle Gender Age
Stop R1 Stop R2 Stop R3
ABS BAS Distance ABS BAS Distance ABS BAS Distance
20 R350 Female Younger No No 74.57 No No 75.28 No D 75.97
23 R350 Female Younger No No 72.37 No No 72.60 No D 71.56
24 R350 Female Younger Yes D 68.96 No D 67.20 Yes No 69.39
30 R350 Female Younger No D 70.43 No D 75.41 Yes No 74.06
51 R350 Female Younger No D 73.18 No D 69.59 No No 73.94
67 R350 Female Younger Yes D 73.52 No D 72.88 No No 73.84
25 R350 Male Younger Yes No 70.28 Yes No 73.56 Yes D 76.52
26 R350 Male Younger Yes No 71.94 No Yes 66.06 Yes D 71.97
28 R350 Male Younger No No 66.80 No No 65.69 No D 64.26
29 R350 Male Younger Yes D 69.72 Yes D 70.10 Yes Yes 68.82
31 R350 Male Younger Yes D 70.94 No D 71.58 No No 78.25
32 R350 Male Younger No D 72.88 No D 67.34 No No 73.14
59 R350 Male Younger No D 69.16 No D 71.47 No No 71.24
68 R350 Male Younger No No 71.63 No No 71.63 No D 70.26
33 S80 Female Older Yes No 71.99 No No 97.29 No D 110.50
34 S80 Female Older No D 106.07 No D 90.36 No No 224.00
35 S80 Female Older Yes No 71.27 Yes No 76.07 Yes D 76.09
36 S80 Female Older Yes No 83.58 Yes Yes 78.01 NA
38 S80 Female Older Yes D 78.22 Yes D 71.34 Yes No 75.99
39 S80 Female Older Yes D 76.81 Yes D 72.00 Yes No 73.02
40 S80 Female Older Yes D 72.81 Yes D 75.87 Yes No 76.57
70 S80 Female Older Yes No 85.97 Yes Yes 74.53 Yes D 76.58
41 S80 Male Older Yes D 107.20 Yes D 73.02 Yes No 73.31
75

Driver Vehicle Gender Age
Stop R1 Stop R2 Stop R3
ABS BAS Distance ABS BAS Distance ABS BAS Distance
42 S80 Male Older NA
43 S80 Male Older Yes Yes 71.04 Yes No 71.92 Yes D 71.34
44 S80 Male Older NA
47 S80 Male Older Yes D 69.10 Yes D 69.27 Yes No 74.22
48 S80 Male Older NA Yes D 70.86 Yes No 75.34
69 S80 Male Older Yes D 69.30 Yes D 71.56 Yes No 71.32
21 S80 Female Younger Yes D 75.01 Yes D 75.48 Yes Yes 76.03
50 S80 Female Younger Yes Yes 69.11 Yes Yes 70.47 Yes D 68.74
52 S80 Female Younger Yes Yes 74.47 Yes Yes 75.10 Yes D 74.87
53 S80 Female Younger Yes D 74.57 Yes D 80.47 Yes No 83.45
54 S80 Female Younger Yes D 76.50 Yes D 73.05 Yes No 73.92
55 S80 Female Younger Yes D 74.45 Yes D 69.25 Yes Yes 70.01
56 S80 Female Younger Yes No 74.05 Yes No 69.58 Yes D 73.98
65 S80 Female Younger Yes Yes 72.93 Yes No 80.36 Yes D 83.10
49 S80 Male Younger Yes Yes 72.77 Yes Yes 75.24 Yes D 73.15
57 S80 Male Younger Yes No 74.04 Yes No 72.62 Yes D 72.32
58 S80 Male Younger Yes Yes 73.73 Yes No 72.01 Yes D 70.70
60 S80 Male Younger Yes No 70.09 Yes No 71.57 Yes D 68.49
61 S80 Male Younger No D NA No D 72.15 Yes Yes 73.05
62 S80 Male Younger Yes D 74.63 Yes D 72.86 Yes Yes 72.71
63 S80 Male Younger Yes D 71.79 Yes D 72.09 Yes Yes 70.59
64 S80 Male Younger Yes D 74.09 Yes D 75.04 Yes Yes 72.04
* D = BAS Disabled
76

Table 22. Drivers that Activated BAS in the Repeated Braking Session Collapsed Across Vehicle
Female Male Total
Older 3 (17%) 2 (11%) 5 (28%)
Younger 5 (28%) 8 (44%) 13 (72%)
Total 8 (45%) 10 (55%) 18 (100%)
When considering all repeated braking maneuvers in which ABS activated, the average stopping distance for BAS-inactive stops was 73.78 ft (s.e. = 0.56 ft, n = 86, minimum = 67.41 ft, maximum = 107.20 ft), while the average stopping distance for BAS-active stops was 71.94 ft (s.e. = 0.72 ft, n = 21, minimum = 63.41 ft, maximum = 78.01 ft). These means are shown in Figure 38. A Krustal-Wallis test did not find this 1.84 ft difference to be statistically significant (H(1) = 1.575, p = 0.2095). The stopping distance for drivers who activated BAS at least once in the repeated braking maneuvers, displayed as a function of pedal displacement and ABS and BAS activations, is provided in Appendix O.
77

Figure 38. Average Corrected Stopping Distances for all BAS-Active Stops and BAS-Inactive Stops in which ABS Activated in the Repeated Braking Session
The previous analysis compared all ABS-active braking maneuvers in which BAS activated to all ABS-active braking maneuvers in which BAS did not activate. An issue with this analysis is that driver braking performance variability may confound the investigation of a BAS effect. As such, an alternative analysis was performed in which only drivers that activated BAS during the repeated braking session were considered. Here, the stopping distances produced when BAS activated were compared to only the stopping distances produced when BAS was disabled. Because drivers were more likely to apply congruent brake pedal input in the repeated braking session, variability in drivers’ brake pedal input was reduced, allowing differences in stopping distances to be better attributed to BAS activation. This analysis was executed by comparing the stopping distances yielded by BAS-active and BAS-disabled maneuvers during the last two stops of the repeated braking session (R2 and R3) using a Wilcoxon signed-rank test, the nonparametric equivalent to a paired t-test. Braking maneuvers in which stopping distance data were lost were replaced by the stopping distance data recorded in R1 when possible. Table 23 presents the 13 drivers considered in this analysis and their respective stopping distances for BAS-active and BAS-disabled braking maneuvers.
78

Table 23. Corrected Stopping Distances for BAS-Active and BAS-Disabled Braking Maneuvers Produced by Drivers that Activated BAS during the Repeated Braking Session
Driver Vehicle Gender Age BAS-Disabled
Stopping Distance (ft)
BAS-Active Stopping
Distance (ft)
Stopping Distance
Difference (ft) 10 R350 Male Older 73.98 (R3) 63.41 (R2) 10.57 29 R350 Male Younger 70.10 (R2) 68.82 (R3) 1.28 43 S80 Male Older 71.34 (R3) 71.04 (R1) 0.30 21 S80 Female Younger 75.48 R2) 76.03 (R3) -0.55 50 S80 Female Younger 68.74 (R3) 70.47 (R2) -1.73 52 S80 Female Younger 74.87 (R3) 75.10 (R2) -0.23 55 S80 Female Younger 69.25 (R2) 70.01 (R3) -0.76 65 S80 Female Younger 83.10 (R3) 72.93 (R1) 10.17 49 S80 Male Younger 73.15 (R3) 75.24 (R2) -2.09 58 S80 Male Younger 70.70 (R3) 73.73 (R1) -3.03 62 S80 Male Younger 72.86 (R2) 72.71 (R3) 0.15 63 S80 Male Younger 72.09 (R2) 70.59 (R3) 1.50 64 S80 Male Younger 75.04 (R2) 72.04 (R3) 3.00
Average 73.13 71.70 1.43 s.e. 1.06 0.92 1.19
The average stopping distance difference between BAS-active and BAS-disabled stops was 1.43 ft (s.e. = 1.19 ft, minimum = -3.03 ft, maximum = 10.57 ft). The average stopping distance produced when BAS was disabled was 73.13 ft (s.e. = 1.06 ft, minimum = 68.74 ft, maximum = 83.10 ft), while the average stopping distance produced when BAS was activated was 71.70 ft (s.e. = 0.92 ft, minimum = 63.41 ft, maximum = 76.03 ft). A Wilcoxon signed-rank test did not find this difference to be statistically significant (S(1) = 6.5, p = 0.6848). Figure 39 presents the corrected stopping distances for BAS-active and BAS-disabled braking maneuvers produced by drivers that activated BAS during the repeated braking session. Figure 40 graphs the mean BAS-active corrected stopping distance and the mean BAS-disabled corrected stopping distance.
79

Figure 39. Corrected Stopping Distances for BAS-Active and BAS-Disabled Braking Maneuvers Produced by Drivers that Activated BAS During the Repeated Braking Session
80

Figure 40. Average Corrected Stopping Distance by BAS Activation Status for only Drivers that Activated BAS in the Repeated Braking Session
It can be seen from Figure 39 that most drivers did not experience a change in stopping distance between BAS-active and BAS-disabled stops. However, two drivers (participants 10 and 65) did experience a 10 ft reduction in stopping distance when BAS activated. Driver 10 was an older male and drove the Mercedes-Benz R350. Driver 65 was a younger female and drove the Volvo S80. In examining the stopping distances presented in Table 13, driver 10 activated BAS in R2, producing a 63.41 ft corrected stopping distance. Figure 41 presents Driver 10’s brake pedal displacement over the course of the R2 stop. The stopping distance produced when BAS was disabled in R3 was 73.98 ft. Figure 42 presents Driver 10’s brake pedal displacement over the course of the R3 stop. It can be seen that both had approximately equivalent brake pedal displacement profiles.
81

y = 0.1723x + 3.033 R² = 0.7226
0
10
20
30
40
50
60
70
80
90
100
110
0
0.5
1
1.5
2
2.5
3
3.5
4
4.5
0 0.5 1 1.5 2 2.5 3 3.5 4
Stopping Distance
(ft)
Brake
Pedal
Displacement (in)
Time (s)
Brake Pedal Travel
Stopping Distance
BAS
ABS
Figure 41. Driver 10, an Older Male Driving the Mercedes-Benz R350, had a Corrected Stopping Distance of 63.41 ft. in the R2 Braking Maneuver
82

y = ‐0.2081x + 3.4301 R² = 0.6039
0
10
20
30
40
50
60
70
80
90
100
110
0
0.5
1
1.5
2
2.5
3
3.5
4
4.5
0 0.5 1 1.5 2 2.5 3 3.5 4
Stopping Distance
(ft)
Brake
Pedal
Displacement(in)
Time (s)
Brake Pedal Travel
Stopping Distance
ABS
Figure 42. Driver 10, an Older Male driving the Mercedes-Benz R350, had a Corrected Stopping Distance of 73.98 ft. in the R3 Braking Maneuver
Driver 65 activated BAS in R1, producing a 72.93-ft stopping distance. Figure 43 presents Driver 65’s brake pedal displacement over the course of the R1 stop. The stopping distance produced when BAS was disabled in R3 was 83.10 ft. Figure 44 presents Driver 65’s brake pedal displacement over the course of the R3 stop. It can be seen that both had similar brake pedal displacement profiles.
83

y = ‐0.402x + 2.8379 R² = 0.9106
0
10
20
30
40
50
60
70
80
90
100
110
0
0.5
1
1.5
2
2.5
3
3.5
4
4.5
0 0.5 1 1.5 2 2.5 3 3.5
Stopping Distance
(ft)
Brake
Pedal
Travel D
istance
(in)
Time (s)
Brake Pedal Travel
Stopping Distance
BAS
ABS
Figure 43. Driver 65, a Younger Female, Driving the Volvo S80 had a Corrected Stopping Distance of 72.93 ft. in the R1 Braking Maneuver
84

y = 0.2087x + 1.9796 R² = 0.7007
0
10
20
30
40
50
60
70
80
90
100
110
0
0.5
1
1.5
2
2.5
3
3.5
4
4.5
0 0.5 1 1.5 2 2.5 3 3.5
Stopping Distance
(ft)
Brake
Pedal
Travel D
istance
(in)
Time (s)
Brake Pedal Travel
Stopping Distance
ABS
Figure 44. Driver 65, a Younger Female, Driving the Volvo S80, had a Corrected Stopping Distance of 83.10 ft. in the R3 Braking Maneuver
Summary
In summarizing the above analyses, 28 percent of drivers were able to activate BAS after they were shown how to perform a panic-braking maneuver. After isolating the effect of BAS activation from driver variability in panic-braking performance, BAS-active stopping distances were on average 1.43 ft (s.e. = 1.19 ft) shorter than BAS-disabled stopping distances. This difference, however, was not statistically significant. The findings suggest that BAS offers some drivers a slight improvement in stopping distance. It is worth pointing out that two drivers who differed in age, sex, and vehicle driven exhibited reductions in stopping distance exceeding 10 ft when BAS activated.
Research Question 2. Do both BASs equally affect stopping distance?
Because the test vehicles utilize different BAS technologies, there was an interest in comparing driver braking performance between the two vehicles. Recall that the Mercedes-Benz uses a vacuum-booster based BAS, while the Volvo S80 uses an ABS-pump-based BAS. This section investigates whether a BAS effect occurred in each vehicle.
85

Anticipated Braking at the Barricade
Comparisons across the two BASs were not possible using the panic-braking performance data collected during the anticipated braking maneuver at the barricade because all BAS activations were performed by participants driving the Volvo S80. This was somewhat counterintuitive because the characterization tests showed that the Mercedes-Benz R350 BAS activation threshold was lower than that of the Volvo S80. Although participants were randomly assigned to the test vehicles, a reason why fewer activations were observed in the Mercedes-Benz R350 compared to the Volvo S80 may be that their respective drivers differed in terms of their physical braking capabilities. Driver differences are explored further at the end of this section.
Repeated Braking Session
BAS comparisons were made using the driver braking performance observed in the repeated braking session. When considering all panic-braking maneuvers in the repeated braking session, there were four BAS activations in the Mercedes-Benz R350 and 17 BAS activations in the Volvo S80.
The average stopping distance for BAS-inactive stops made in the Mercedes-Benz R350 was 71.86 ft (s.e. = 0.59 ft, n = 25, minimum = 67.41 ft, maximum = 79.21 ft), while the average stopping distance for BAS-active stops was 67.25 ft (s.e. = 1.31 ft, n = 4, minimum = 63.41 ft, maximum = 69.08 ft). A Krustal-Wallis test found this 4.61 ft difference to be statistically significant (H(1) = 7.056, p = 0.0079). Figure 45 presents drivers’ stopping distances by BAS activation in the Mercedes-Benz R350. It can be seen that the BAS-active stops fall on the shorter end of the distribution.
86

Figure 45. Corrected Stopping Distance by BAS Activation in the Mercedes-Benz R350
The average stopping distance for BAS-inactive stops made in the Volvo S80 was 74.56 ft (s.e. = 0.72 ft, n = 61, minimum = 68.49 ft, maximum = 107.20 ft), while the average stopping distance for BAS-active stops was 73.05 ft (s.e. = 0.57 ft, n = 17, minimum = 69.11 ft, maximum = 78.00 ft). A Krustal-Wallis test did not find this 1.51 ft difference to be statistically significant (H(1) = 0.6478, p = 0.4209). Figure 46 presents drivers’ stopping distances by BAS activation in the Volvo S80. It can be seen that the BAS-active stopping distances are distributed within the BAS-inactive stopping distances.
87

Figure 46. Corrected Stopping Distance by BAS Activation in the Volvo S80
In continuing to analyze the panic-braking maneuvers performed in the repeated braking session, a Krustal-Wallis test revealed that the BAS-inactive stopping distances yielded with the Mercedes-Benz R350 were significantly shorter than the BAS-inactive stopping distances yielded by the Volvo S80 (p = 0.0083). A Krustal-Wallis test also revealed that the BAS-active stopping distances yielded by the Mercedes-Benz R350 were significantly shorter than the BAS-active stopping distances yielded by the Volvo S80 (p = 0.0023). Figure 47 presents the mean corrected stopping distances by BAS activation for each test vehicle.
88

Figure 47. Mean Corrected Stopping Distances by BAS Activation
As was performed earlier, an analysis that considers just those drivers that activated BAS in the repeated braking session was performed in order to investigate stopping distance differences between BAS-active and BAS-disabled stops for each test vehicle. When considering just the panic-braking maneuvers performed with the Mercedes-Benz R350 in the repeated braking session, the average stopping distance difference between BAS-active and BAS-disabled stops was 5.92 ft (s.e. = 4.65 ft, minimum = 1.28 ft, maximum = 10.57 ft). A Wilcoxon signed-rank test did not find this difference to be statistically significant (S(1) = 1.5, p = 0.5). It should be noted that stopping distance data were not available for Driver 6 because of an equipment failure. Driver 26 was not considered because ABS was not activated in the BAS-active stop. Table 24 presents the corrected stopping distances for BAS-active and BAS-disabled stops. The average stopping distance produced when BAS was disabled was 72.04 ft (s.e. = 1.94 ft, minimum = 70.10 ft, maximum = 73.98 ft), while the average stopping distance produced when BAS was activated was 66.12 ft (s.e. = 2.71 ft, minimum = 63.41 ft, maximum = 68.82 ft). The few data points should be keep in mind when considering the reported difference in stopping distance across BAS activation.
89

Table 24. Corrected Stopping Distances by BAS Activation for the Mercedes-Benz R350
Driver Vehicle Gender Age BAS-Disabled
Stopping Distance (ft)
BAS-Active Stopping
Distance (ft)
Stopping Distance
Difference (ft) 10 R350 Male Older 73.98 (R3) 63.41 (R2) 10.57 29 R350 Male Younger 70.1 (R2) 68.82 (R3) 1.28
Average 72.04 66.12 5.92 s.e. 1.94 2.71 4.65
When considering only the panic-braking maneuvers performed with the Volvo S80 in the repeated braking session, the average stopping distance difference between BAS-active and BAS-disabled stops was 0.61 ft (s.e. = 1.08 ft, minimum = -3.03 ft, maximum = 10.17 ft). A Wilcoxon signed-rank test did not find this difference to be statistically significant (S(1) = -3, p = 0.8311). Table 25 presents the corrected stopping distances for BAS-active and BAS-disabled stops. The average stopping distance produced when BAS was disabled was 73.33 ft (s.e. = 1.19 ft, minimum = 68.74 ft, maximum = 83.10 ft), while the average stopping distance produced when BAS was activated was 72.72 ft (s.e. = 0.63 ft, minimum = 70.01 ft, maximum = 76.03 ft).
Table 25. Corrected Stopping Distances by BAS Activation for the S80
Driver Vehicle Gender Age BAS-Disabled
Stopping Distance (ft)
BAS-Active Stopping
Distance (ft)
Stopping Distance
Difference (ft) 43 S80 Male Older 71.34 (R3) 71.04 (R1) 0.30 21 S80 Female Younger 75.48 R2) 76.03 (R3) -0.55 50 S80 Female Younger 68.74 (R3) 70.47 (R2) -1.73 52 S80 Female Younger 74.87 (R3) 75.10 (R2) -0.23 55 S80 Female Younger 69.25 (R2) 70.01 (R3) -0.76 65 S80 Female Younger 83.10 (R3) 72.93 (R1) 10.17 49 S80 Male Younger 73.15 (R3) 75.24 (R2) -2.09 58 S80 Male Younger 70.70 (R3) 73.73 (R1) -3.03 62 S80 Male Younger 72.86 (R2) 72.71 (R3) 0.15 63 S80 Male Younger 72.09 (R2) 70.59 (R3) 1.50 64 S80 Male Younger 75.04 (R2) 72.04 (R3) 3.00
Average 73.33 72.72 0.61 s.e. 1.19 0.63 1.08
Why were there more BAS activations in the Mercedes-Benz R350 compared to the Volvo S80?
The finding that more drivers activated BAS in the Volvo S80 compared to the Mercedes-Benz R350 was unexpected given that the characterization tests performed at VRTC revealed that the Volvo S80 had a higher BAS activation threshold than the Mercedes-Benz R350. Driver characteristics were thus examined to determine whether activation differences could be explained by differences between participants assigned to the test vehicles. At the end of the study, drivers placed the test vehicle in park and were asked to press the brake pedal as hard as
90

possible. This task was performed three times and their maximum brake pedal force was recorded. Figure 48 shows the distribution of the maximum brake pedal force recorded by the participants that drove the Mercedes-Benz R350, while Figure 49 shows the distribution of the maximum brake pedal forces for participants that drove the Volvo S80. The participants that drove the Mercedes-Benz R350 had an average maximum brake pedal force of 183 lbs (s.e. = 16 lbs, n = 32, minimum = 51 lbs, maximum = 397 lbs), while the participants that drove the Volvo S80 had an average maximum brake pedal force of 222 lbs (s.e. = 17 lbs, n = 29, minimum = 98 lbs, maximum = 476 lbs). A one-way between-subjects ANOVA was performed on the maximum brake pedal force dependent variable using the test vehicle as the independent variable. Participants driving the Volvo S80 were not found to apply the brake pedal with a significantly stronger force than the Mercedes-Benz R350 drivers (F(1, 59) = 2.84, p = 0.0971). It is worth mentioning that the benefits obtained from safety features such as BAS should be independent of drivers’ physical strength.
Figure 48. Maximum Brake Pedal Force for Drivers Assigned to the Mercedes-Benz R350
91

Figure 49. Maximum Brake Pedal Force for Drivers Assigned to the Volvo S80
Further analyses were performed on the drivers’ height, weight, and age to see if other physiological differences existed between the assigned groupings. The Mercedes-Benz R350 drivers had an average height of 5.58 feet (s.e. = 0.05 feet), while the Volvo S80 drivers had an average height of 5.47 feet (s.e. = 0.19 feet). A one-way between-subjects ANOVA did not find this difference to be statistically different (F(1, 62) = 0.34, p = 0.5612). The Mercedes-Benz R350 drivers had an average weight of 172 lbs (s.e. = 5.39 lbs), while the Volvo S80 drivers had an average weight of 170 lbs (s.e. = 4.69 lbs). A one-way between-subjects ANOVA did not find this difference to be statistically different (F(1, 62) = 0.08, p = 0.7824). The Mercedes-Benz R350 drivers had an average age of 48 years old (s.e. = 5 years), while the Volvo S80 drivers had an average age of 44 years old (s.e. = 5 years). A one-way between-subjects ANOVA did not find this difference to be statistically different (F(1, 62) = 0.41, p = 0.5247).
Summary
In comparing the two BASs, reductions in stopping distance were observed when BAS activated for both test vehicles. A mean stopping distance reduction of 5.92 ft (s.e. = 4.65 ft) was exhibited when the Mercedes-Benz R350 drivers activated BAS compared to when it was disabled. In comparison, a mean stopping distance reduction of 0.61 ft (s.e. = 1.08 ft) was exhibited when the Volvo S80 drivers activated BAS compared to when it was disabled. However, neither stopping distance reduction was found to be statistically significant. Furthermore, although the mean reduction in stopping distance exhibited by the Mercedes-Benz R350 was larger than that exhibited by the Volvo S80, BAS was activated less frequently by the Mercedes-Benz R350 drivers when compared to the Volvo S80 drivers. Drivers’ physical capabilities were examined to see if the drivers assigned to each test vehicle grossly differed. Apart from the trend that drivers assigned to the Mercedes-Benz R350 were able to generate less
92

force on the brake pedal relative to the drivers assigned to the Volvo S80, there is no evidence that drivers’ physical capabilities played a role in determining BAS activation in this study.
Research Question 3. Does BAS equally assist males and females?
Anticipated Braking to Barricade
The ability of BAS to equally support both male and female drivers was investigated by considering the panic-braking maneuvers performed in response to the anticipated barricade as well as in the repeated braking session. Of the seven panic-braking maneuvers performed in response to the anticipated barricade, two stops were performed by female drivers while five stops were performed by male drivers. None of the female drivers activated BAS, while three male drivers activated BAS. The average BAS-inactive stopping distance that male drivers produced was 91.98 ft (s.e. = 1.21 ft, n = 2, minimum = 90.77 ft, maximum = 93.19 ft), while the average BAS-active stopping distance they produced was 82.98 ft (s.e. = 7.04 m, n = 3, minimum = 74.87 ft, maximum = 97.00 ft). A Krustal-Wallis test did not find this 9.00 ft difference to be statistically significant (H(1) = 0.3333, p = 0.5637).
Repeated Braking Session
When considering the panic-braking maneuvers performed in the repeated braking session, the average BAS-inactive stopping distance that female drivers produced was 74.57 ft (s.e. = 0.66 ft, n = 44, minimum = 67.41 ft, maximum = 85.97 ft), while the average BAS-active stopping distance they produced was 72.97 ft (s.e. = 0.99 ft, n = 10, minimum = 69.08 ft, maximum = 78.01 ft). A Krustal-Wallis test did not find this 1.60-ft difference to be statistically significant (H(1) = 0.7542, p = 0.3851). The average BAS-inactive stopping distance that male drivers produced was 72.94 ft (s.e. = 0.89 ft, n = 42, minimum = 68.15 ft, maximum = 107.20 ft), while the average BAS-active stopping distance they produced was 71.01 ft (s.e. = 1.00 ft, n = 11, minimum = 63.41 ft, maximum = 75.24 ft). A Krustal-Wallis test did not find this 1.93-ft difference to be statistically significant (H(1) = 0.4925, p = 0.4828).
The stopping distances yielded by BAS-active and BAS-disabled maneuvers during the last two stops of the repeated braking session were compared for both male and female drivers. Table 26 presents the stopping distances for the BAS-active and BAS-disabled braking maneuvers performed by female drivers. Female drivers had a mean reduction in stopping distance of 1.38 ft (s.e. = 2.21 ft). A Wilcoxon signed-rank test did not find this difference to be statistically significant (S(1) = -2.5, p = 0.6250). Table 27 presents the stopping distances for the BAS-active and BAS-disabled braking maneuvers performed by male drivers. Male drivers had a mean reduction of 1.46 ft (s.e. = 1.47 ft). A Wilcoxon signed-rank test did not find this difference to be statistically significant (S(1) = 6, p = 0.4690). The mean stopping distance reduction was compared across males and females. A Krustal-Wallis test did not find a statistically significant difference to exist (H(1) = 0.5357, p = 0.4642).
93

Table 26. Corrected Stopping Distances for BAS-Active and BAS-Disabled Braking Maneuvers Produced by Female Drivers that Activated BAS during the Repeated Braking
Session
Driver Vehicle Gender Age BAS-Disabled
Stopping Distance (ft)
BAS-Active Stopping
Distance (ft)
Stopping Distance
Difference (ft) 21 S80 Female Younger 75.48 R2) 76.03 (R3) -0.55 50 S80 Female Younger 68.74 (R3) 70.47 (R2) -1.73 52 S80 Female Younger 74.87 (R3) 75.10 (R2) -0.23 55 S80 Female Younger 69.25 (R2) 70.01 (R3) -0.76 65 S80 Female Younger 83.10 (R3) 72.93 (R1) 10.17
Average 74.29 72.91 1.38 s.e. 2.60 1.20 2.21
Table 27. Corrected Stopping Distances for BAS-Active and BAS-Disabled Braking Maneuvers Produced by Male Drivers that Activated BAS during the Repeated Braking
Session
Driver Vehicle Gender Age BAS-Disabled
Stopping Distance (ft)
BAS-Active Stopping
Distance (ft)
Stopping Distance
Difference (ft) 10 R350 Male Older 73.98 (R3) 63.41 (R2) 10.57 29 R350 Male Younger 70.10 (R2) 68.82 (R3) 1.28 43 S80 Male Older 71.34 (R3) 71.04 (R1) 0.3 49 S80 Male Younger 73.15 (R3) 75.24 (R2) -2.09 58 S80 Male Younger 70.70 (R3) 73.73 (R1) -3.03 62 S80 Male Younger 72.86 (R2) 72.71 (R3) 0.15 63 S80 Male Younger 72.09 (R2) 70.59 (R3) 1.5 64 S80 Male Younger 75.04 (R2) 72.04 (R3) 3
Average 72.41 70.95 1.46 s.e. 0.59 1.28 1.47
Summary
In summarizing, the results indicate that both male and female drivers experienced a stopping distance reduction when BAS activated compared to when it was disabled. However, these stopping distance reductions were not found to be statistically significant.
Research Question 4. Does BAS equally assist older and younger drivers?
Anticipated Braking at the Barricade
The ability of BAS to equally support both older and younger drivers was investigated by considering the panic-braking maneuvers performed in response to the anticipated barricade as well as in the repeated braking session. Of the seven ABS-active stops observed in the
94

anticipated braking maneuver, four stops were performed by older drivers while three stops were performed by younger drivers. None of the younger drivers activated BAS, while three older drivers activated BAS. The average BAS-inactive stopping distance that the one older driver produced was 90.77 ft (s.e. = NA), while the average BAS-active stopping distance the other older drivers produced was 82.98 ft (s.e. = 7.04 ft, n = 3, minimum = 74.87 ft, maximum = 97.00 ft). A Krustal-Wallis test did not find this 7.79 ft difference to be statistically significant (H(1) = 0.2, p = 0.6547).
Repeated Braking Session
When considering the panic-braking maneuvers performed in the repeated braking session, the average BAS-inactive stopping distance that older drivers produced was 74.68 ft (s.e. = 1.08 ft, n = 38, minimum = 67.41 ft, maximum = 107.20 ft), while the average BAS-active stopping distance they produced was 70.62 ft (s.e. = 2.11 ft, n = 6, minimum = 63.41 ft, maximum = 78.01 ft). A Krustal-Wallis test did not find this 4.06 ft difference to be statistically significant (H(1) = 2.8082, p = 0.0938). The average BAS–inactive stopping distance that younger drivers produced was 73.06 ft (s.e. = 0.51 ft, n = 48, minimum = 67.41 ft, maximum = 83.45 ft), while the average BAS-active stopping distance they produced was 72.47 ft (s.e. = 0.59 ft, n = 15, minimum = 68.82 ft, maximum = 76.03 ft). A Krustal-Wallis test did not find this 0.59 ft difference to be statistically significant (H(1) = 0.0315, p = 0.8591).
Age differences for the drivers that activated just BAS in the repeated braking session were also examined. Table 28 presents the stopping distances for the BAS-active and BAS-disabled braking maneuvers performed by older drivers. Older drivers had a reduction in stopping distance of 5.44 ft (s.e. = 3.25 ft). A Wilcoxon signed-rank test did not find this difference to be statistically significant (S(1) = 1.5, p = 0.5000). Table 29 presents the stopping distances for the BAS-active and BAS-disabled braking maneuvers performed by younger drivers. Younger drivers had a mean reduction of 0.70 ft (s.e. = 1.60 ft). A Wilcoxon signed-rank test did not find this difference to be statistically significant (S(1) = -1, p = 0.9658). The mean stopping distance reduction was compared across older and younger drivers. A Krustal-Wallis test did not find this difference to be statistically significant (H(1) = 1.9091, p = 0.1671).
Table 28. Corrected Stopping Distances for BAS-Active and BAS-Disabled Braking Maneuvers Produced by Older Drivers that Activated BAS during the Repeated Braking
Session
Driver Vehicle Gender Age BAS-Disabled
Stopping Distance (ft)
BAS-Active Stopping
Distance (ft)
Stopping Distance
Difference (ft) 10 R350 Male Older 73.98 (R3) 63.41 (R2) 10.57 43 S80 Male Older 71.34 (R3) 71.04 (R1) 0.30
Average 72.66 67.23 5.44 s.e. 0.83 2.41 3.25
95

Table 29. Corrected Stopping Distances for BAS-Active and BAS-Disabled Braking Maneuvers Produced by Younger Drivers that Activated BAS during the Repeated
Braking Session
Driver Vehicle Gender Age BAS-Disabled
Stopping Distance (ft)
BAS-Active Stopping
Distance (ft)
Stopping Distance
Difference (ft) 21 S80 Female Younger 75.48 R2) 76.03 (R3) -0.55 50 S80 Female Younger 68.74 (R3) 70.47 (R2) -1.73 52 S80 Female Younger 74.87 (R3) 75.10 (R2) -0.23 55 S80 Female Younger 69.25 (R2) 70.01 (R3) -0.76 65 S80 Female Younger 83.10 (R3) 72.93 (R1) 10.17 29 R350 Male Younger 70.10 (R2) 68.82 (R3) 1.28 49 S80 Male Younger 73.15 (R3) 75.24 (R2) -2.09 58 S80 Male Younger 70.70 (R3) 73.73 (R1) -3.03 62 S80 Male Younger 72.86 (R2) 72.71 (R3) 0.15 63 S80 Male Younger 72.09 (R2) 70.59 (R3) 1.50 64 S80 Male Younger 75.04 (R2) 72.04 (R3) 3.00
Average 73.22 72.52 0.70 s.e. 1.80 1.06 1.60
When considering the older driver that had the 10-ft reduction in stopping distance, it was unusual that this driver’s BAS-disabled stopping distance was similar to the younger drivers’ BAS-disabled stopping distances, while his BAS-active stopping distance was shorter than the younger drivers’ BAS-active stopping distances. This suggests that the Mercedes-Benz R350 does not yield its minimum stopping distance when BAS activates. The data produced during this trial were reviewed and validated. When comparing this driver’s BAS-active stopping distance to those produced by the mechanical brake controller at VRTC, it is important to realize that a reason why it was shorter is due to the fact that the VTTI testing surface had a 3-percent uphill grade.
Summary
The results show that both older and younger drivers had shorter stopping distances when BAS was activated compared to when it was disabled. However, the stopping distance reductions were not found to be statistically significant.
Research Question 5: Are drivers aware of the BAS activating?
At the conclusion of the experiment, drivers were given a sheet that listed the six braking maneuvers (Appendix L: Post-Braking Questionnaire). Participants were asked to identify which braking maneuvers BAS activated. In analyzing these survey data, participants were grouped according to: 1) those that activated BAS, 2) those that performed a panic stop without activating BAS, 3) those that just stopped without activating ABS or BAS, and 4) those that did not stop at all. Drivers’ responses in each category were analyzed in terms of successful identifications of BAS activation (hit), a missed opportunity to identify the BAS activation (miss), an incorrect
96

identification of a BAS activation (false alarm), or correctly identifying a stop in which BAS did not activate (correct rejection). From these frequencies, hit, miss, false alarm, and correct rejection rates were calculated (Table 30).
Results indicate that drivers who activated BAS tended to have a high hit rate (average = 0.75, s.e. = 0.09, minimum = 0.57, maximum = 1.00). However, drivers who activated just ABS also tended to have a low correct rejection rate (average = 0.39, s.e. = 0.03, minimum = 0.31, maximum = 0.50). This suggests that the drivers that performed panic-braking maneuvers were not accurate in identifying BAS activation and were biased towards believing that BAS activated. This bias may be a result of the high decelerations they experienced when performing the panic-braking maneuvers. Furthermore, the drivers that did not perform panic braking erroneously denoted that BAS activated at an average false alarm rate of 0.53 (s.e. = 0.04, minimum = 0.35, maximum = 0.57). The drivers that did not stop also had an average false alarm rate of 0.50 (s.e. = 0.11, minimum = 0.20, maximum = 0.81). This provides further evidence that drivers did not clearly recognize BAS activation and were biased towards stating that BAS activated.
Table 30. Driver Performance in Identifying BAS-Active Stops
Trial Category n Hit
Rate
False Alarm Rate
Miss Rate
Correct Rejection
Rate
Unexpected Stop to Barricade
BAS Activated 0 - - - -
ABS-Only Panic Stop 4 - 0.50 - 0.50
Non-Panic Stop 7 - 0.43 - 0.57
Did Not Stop 53 - 0.19 - 0.81
Anticipated Stop to Barricade
BAS Activated 3 0.67 - 0.33 -
ABS-Only Panic Stop 3 - 0.67 - 0.33
Non-Panic Stop 47 - 0.55 - 0.45
Did Not Stop 11 - 0.36 - 0.64
R1
BAS Activated 7 0.57 - 0.43 -
ABS-Only Panic Stop 27 - 0.63 - 0.37
Non-Panic Stop 25 - 0.48 - 0.52
Did Not Stop 5 - 0.80 - 0.20
R2
BAS Activated 6 1.00 - 0.00 -
ABS-Only Panic Stop 27 - 0.56 - 0.44
Non-Panic Stop 27 - 0.52 - 0.48
Did Not Stop 3 - 0.67 - 0.33
R3
BAS Activated 8 0.75 - 0.25 -
ABS-Only Panic Stop 32 - 0.69 - 0.31
Non-Panic Stop 20 - 0.65 - 0.35
Did Not Stop 4 - 0.50 - 0.50
Drivers’ ability to identify BAS activation was broken down by test vehicle. Table 31 presents the hit, miss, false alarm, and correct rejection rates for those drivers that activated BAS. It can
97

be seen that drivers in both vehicles were poor at correctly identifying BAS activation (hit rate = 0.20 in Mercedes-Benz, and 0.19 in Volvo S80). Drivers’ correct rejection scores did not greatly differ either, with the Volvo S80 drivers being slightly more correct in identifying when BAS did not activate than the Mercedes-Benz R350 drivers.
Table 31. Driver Identification of BAS Activation Performance by Vehicle, Includes Only Drivers Performing BAS-Activated Panic Braking
Vehicle n Hit
Rate False Alarm
Rate Miss Rate
Correct Rejection Rate
Mercedes-Benz R350 3 0.20 0.47 0.80 0.53
Volvo S80 16 0.19 0.31 0.81 0.69
Total 19 0.19 0.34 0.81 0.66
Summary
It was found that drivers who activated BAS leaned towards stating that it activated. While at the same time, drivers that performed a panic stop, but did not activate BAS, leaned toward stating that BAS activated. It was also found that drivers that did not perform a panic stop, or did not stop at all, erroneously believed that BAS activated. The findings suggest that drivers were not accurate in identifying BAS activation and were biased towards believing that BAS activated. Driver sensitivity was not found to differ by test vehicle.
Research Question 6: Do drivers like the BAS?
Participants were asked to provide their opinion regarding the test vehicle’s braking effectiveness during the last two repeated braking maneuvers (Stops R2 and R3). Participants were specifically asked, “On the same 1 to 7 scale, where 1 is extremely ineffective and 7 is extremely effective, how would you rate the effectiveness of the vehicle’s brakes?” Recall that during these two stops, the BAS system was cycled, so one stop was completed with BAS enabled and one stop was completed with BAS disabled. In considering just the 13 drivers that performed panic-braking maneuvers and activated BAS, their ratings of when BAS activated were compared to their ratings when BAS was disabled (Table 32). No difference in drivers’ ratings were found (t(9) = 0.36, p = 0.7263). Drivers gave high braking-effectiveness ratings (mean = 6.3) both when BAS activated and when it was disabled, suggesting that their ratings were based on the overall braking performance of the vehicle.
98

Table 32. Subjective Ranking of BAS Effectiveness Over Last Two Trials
Driver Number BAS Disabled Rating (1-7)
BAS Active Rating (1-7)
Difference in Rating
10 6.5 6.0 -0.5 21 5.0 6.0 1.0 29 7.0 7.0 0.0 49 6.5 6.5 0.0 50 6.0 6.0 0.0 52 6.5 6.0 -0.5 55 7.0 6.5 -0.5 62 6.5 6.5 0.0 63 6.0 6.0 0.0 64 6.0 6.0 0.0
Mean 6.3 6.3 -0.1 s.e. 0.2 0.1 0.1
Overall Opinion
Drivers were also asked “Overall, how would you rate the brake assist system?” on a 1 (extremely ineffective) to 7 (extremely effective) anchored scale at the end of the experiment. This question was originally developed in case drivers were able to clearly perceive BAS activations. However, the previous analyses indicated that this was not the case. Nevertheless, the rating data were investigated.
When considering all braking maneuvers performed by the participants, those drivers that activated BAS at some point in the experiment were grouped, those drivers that just activated ABS at some point were grouped, and the remaining drivers formed a third group. The mean BAS ratings for each group were investigated (Table 33). A one-way ANOVA did not find a statistically significant difference in the ratings across each group (F(2, 60) = 2.40, p = 0.099). This suggests that BAS activation, or even the execution of panic braking, was not affecting drivers’ ratings of BAS.
Table 33. Overall Subjective Rating of BAS Driver Status n Mean s.e. Minimum Maximum
Activated BAS 19 5.66 0.23 4 7 Panic Stop without BAS 28 6.16 0.16 4 7 No Panic Stop 16 6.31 0.27 4 7 Overall 63 6.05 0.12 4 7
Brake Assist Systems as Standard Equipment on New Automobiles
Drivers were asked “If a car had brake assist as standard equipment, would you be more likely to buy it?” Driver responses were analyzed according to the groups established in the previous analysis (Table 34). Drivers responded that BAS as an offered safety feature would increase
99

their likelihood of purchasing a particular vehicle. Of the three Mercedes-Benz R350 drivers that activated BAS at some point in the experiment, two drivers responded “Yes,” while the third driver responded “Maybe,” citing the cost of the system as a factor. Of the 16 Volvo S80 drivers that activated BAS at some point in the experiment, 12 drivers responded “Yes,” two drivers responded “No”, and two drivers responded “Maybe,” citing cost as a concern.
Table 34. Frequencies of Driver Responses Vehicle Category N Yes No Undecided Comments
Activated BAS
3 2 0 1 1. Depends on how effective it
is
Mercedes-Benz R350
Panic Stop without BAS
15 12 1 2 1. Evidence of effectiveness 2. Didn't know when it was on 3. Cost
No Panic Stop
15 11 2 2 1. Depends on ABS and BAS
not jamming Activated
BAS 16 12 2 2 1. Cost
Volvo S80 Panic Stop
without BAS 13 8 3 2 1. Cost
No Panic Stop
1 1 0 0 1. No comments
Summary
Drivers gave high braking-effectiveness ratings both when BAS activated and when it was disabled, suggesting that their ratings were based on the overall braking performance of the vehicle. Even though drivers were not sensitive to BAS activations, they were asked to rate the BAS effectiveness. Drivers’ ratings of BAS effectiveness were not found to differ regarding whether they activated BAS, activated just ABS, or did not activate BAS or ABS in the study. Drivers indicated that they would be more likely to purchase a vehicle that offers BAS; however, the data indicate that this rating was not affected by their exposure to BAS activation or panic braking in the test vehicle.
Role of Expectancy
Research Question 7/8. To what degree does expectancy affect panic-braking stopping distance, and do drivers apply harder brake pedal force during unexpected braking maneuvers than during anticipated braking maneuvers?
The role of expectancy was explored by having participants brake a second time at the inflatable barricade. Although participants knew that the barricade would inflate, they did not know when it would occur. As mentioned earlier, 11 drivers stopped when the barricade was unexpected, while 58 drivers stopped when the barricade was anticipated. Table 35 presents braking maneuver descriptive statistics for those drivers that came to a complete stop in response to the unexpected and anticipated barricade. Note, not all stops met the panic-braking criteria of ABS activation.
100

Table 35. Comparison of Drivers who Stopped at the Unexpected Barricade to Drivers who Stopped at the Anticipated Barricade
Measure Unexpected Anticipated
Mean s.e. Mean s.e.
Corrected Stopping Distance (ft)
113.68 4.51 107.81 2.42
Brake Response Time (BRT) (s)
1.04 0.09 0.80 0.03
Max Brake Pedal Force (lbs)
33.82 5.10 26.75 2.09
Average Deceleration (g)
0.48 0.03 0.44 0.02
Time to Stop (s) 4.1 0.24 4.75 0.20
#ABS Activations 4/11 (36%) 7/58 (12%)
ABS Duration (s) 0.92 0.16 1.03 0.27
#BAS Activations 0/11 (0%) 3/58 (5%)
BAS Duration NA NA 1.62 0.33
Collision with Barricade
5/11 (45%) 3/58 (5%)
Initial Brake Pedal Displacement (in)
2.14 2.19
Brake Pedal Application Rate (in/s)
4.44 6.20
Maximum Brake Pedal Displacement (in)
2.76 2.38
To isolate the effects of expectancy on the measures listed in Table 35, only those drivers that stopped in both the unexpected and anticipated braking trials were analyzed. A total of 10 drivers met this criterion (Table 36). Seven participants drove the Mercedes-Benz R350, while three participants drove the Volvo S80. Of the seven Mercedes-Benz R350 drivers, two were older males, two were younger females, and three were younger males. Of the three Volvo S80 drivers, two were older males, while one was a younger female.
A one-way repeated-measures ANOVA was performed on the continuous measures listed in Table 36 using expectancy as the independent variable. Expectancy was not found to have a significant effect on drivers’ mean corrected stopping distances (F(1, 9) = 0.03, p = 0.8619). Drivers had a mean corrected stopping distance of 112.75 ft (s.e. = 4.87 ft) when the barricade was unexpected, while they had a mean corrected stopping distance of 111.12 ft (s.e. = 6.27 ft) when the barricade was anticipated. Expectancy was found, however, to have a significant effect on drivers’ mean BRT (F(1, 9) = 9.59, p = 0.0128). Drivers mean BRT was operationally defined as the time from the barricade controller receiving the command to inflate to drivers beginning to press the brake pedal. Drivers had a mean BRT of 1.04 s (s.e. = 0.10 s) when the
101

barricade was unexpected, while they had a mean BRT of 0.72 s (s.e. = 0.05 s) when the barricade was anticipated.
Table 36. Comparison of Drivers that Stopped in Both the Unexpected and Anticipated Barricade Stops
Measure Unexpected Anticipated
p-value Mean s.e. Mean s.e.
Corrected Stopping Distance (ft)
112.75 4.87 111.12 6.27 0.8619
BRT (s) 1.04 0.10 0.72 0.05 0.0128
Max Brake Pedal Force (lbs)
33.16 5.60 25.34 5.99 0.2988
Average Deceleration (g) 0.48 0.03 0.42 0.04 0.2604
Time to Stop (s) 4.16 0.26 5.06 0.51 0.0988
#ABS Activations 3/10 1/10 -
ABS Duration (s) 0.90 0.23 1.90 - -
#BAS Activations 0/10 1/10 -
BAS Duration - - 1.90 - -
Initial Brake Pedal Displacement (in)
2.12 0.23 2.27 0.11 0.5536
Brake Pedal Application Rate (in/s)
4.40 0.89 5.16 1.16 0.6769
Maximum Brake Pedal Displacement (in)
2.80 0.09 2.40 0.10 0.011
Drivers applied a mean maximum brake pedal force of 33.16 lbs (s.e. = 5.59 lbs) when braking for an unexpected barricade, while they applied a mean maximum brake pedal force of 25.34 lbs (s.e. = 5.98 lbs) when the same inflatable barricade was anticipated. Figure 50 shows the distribution of brake pedal forces of the 10 drivers in the unexpected braking maneuver. Figure 51 shows the distribution of brake pedal forces of the drivers in the anticipated braking maneuver. A one-way repeated-measures ANOVA did not find the mean maximum brake pedal forces to be statistically different (F(1, 9) = 1.22, p = 0.2988). However, a trend appears to exist in that brake pedal force during unexpected braking is higher than brake pedal force during anticipated braking.
102

Figure 50. Distribution of Brake Pedal Forces for Drivers Completing a Stop at an Unexpected Barricade
Figure 51. Distribution of Brake Pedal Forces for Drivers Completing a Stop at an Anticipated Barricade
Drivers achieved a mean maximum brake pedal displacement of 2.80 in (s.e. = 0.09 in) when braking for an unexpected inflatable barricade, while they achieved a mean maximum brake pedal displacement of 2.40 in (s.e. = 0.10 in) when the same inflatable barricade was anticipated. A one-way repeated-measures ANOVA found these mean maximum brake pedal displacements
103

to be statistically different (F(1, 9) = 10.17, p = 0.011). This suggests that in having shorter BRTs when the barricade was anticipated, drivers did not have to press the brake pedal as far down to bring the vehicle to a complete stop as they did when the barricade was unexpected.
Summary
Expectancy was found to affect drivers’ panic-braking performance in terms of how fast they pressed the brake pedal, and how much they displaced the brake pedal, in response to a forward crash threat. The finding that expectancy had no effect on corrected stopping distance suggests that drivers did not decelerate as hard to the anticipated barricade. This is somewhat supported by the findings; however, it should be noted that no statistical differences were found in drivers’ deceleration, time to stop, initial pedal displacement, and brake pedal application rate. Nevertheless, it might be said that because drivers had more time to stop due to reacting sooner, they did not have to decelerate as much, or press the brakes as hard, to avoid a collision.
Driver Panic-braking Performance
Research Question 9. Do male drivers apply the brakes with forces and displacements similar to female drivers?
Brake Pedal Force in Unexpected Braking at the Barricade
The one female driver that performed a panic-braking maneuver at the unexpected barricade applied a braking force of 39.01 lbs. The three male drivers that performed a panic-braking maneuver at the unexpected barricade applied an average braking force of 43.37 lbs (s.e. = 1.51 lbs, n = 3, minimum = 40.37 lbs, maximum = 45.08 lbs). A Krustal-Wallis test did not find this difference to be statistically significant (H(1) = 1.8, p = 0.1797).
Brake Pedal Force in Anticipated Braking at the Barricade
The two female drivers that performed a panic-braking maneuver at the anticipated barricade applied an average braking force of 27.27 lbs (s.e. = 1.11 lbs, n = 2, minimum = 26.16 lbs, maximum = 28.39 lbs), while the five male drivers that performed a panic-braking maneuver at the anticipated barricade applied an average braking force of 56.94 lbs (s.e. = 7.18 lbs, n = 5, minimum = 40.65 lbs, maximum = 77.54 lbs). A Krustal-Wallis test found this difference to be marginally statistically significant (H(1) = 3.75, p = 0.0528). When considering just the five male drivers that performed a panic-braking maneuver at the anticipated barricade, the two drivers that did not activate BAS applied a mean braking force of 62.9 lbs (s.e. = 1.92 lbs, n = 2, minimum = 60.98 lbs, maximum = 64.82 lbs), while the three drivers that did activate BAS applied a mean braking force of 52.97 lbs (s.e. = 12.29 lbs, n = 3, minimum = 40.65 lbs, maximum = 77.54 lbs). A Krustal-Wallis test did not find this difference to be statistically significant (H(1) = 0.3333, p = 0.5637).
Brake Pedal Force in Repeated Braking Session
For the panic-braking maneuvers performed in the repeated braking session, female drivers applied the brakes with a mean force of 87.15 lbs (s.e. = 5.78 lbs, n = 56, minimum = 15.45 lbs, maximum = 205.41 lbs), while male drivers applied the brakes with a mean force of 156.28 lbs
104

(s.e. = 14.77 lbs, n = 53, minimum = 36.34 lbs, maximum = 585.34 lbs). A Krustal-Wallis test found this difference to be statistically significant (H(1) = 14.129, p = 0.0002). Female drivers that performed panic braking and did not activate BAS applied a mean braking force of 82.68 lbs (s.e. = 6.26 lbs, n = 46, minimum = 15.45 lbs, maximum = 196.09 lbs), while female drivers that performed panic braking and did activate BAS applied a mean braking force of 107.7 lbs (s.e. = 13.82 lbs, n = 10, minimum = 56.19 lbs, maximum = 205.41 lbs). A Krustal-Wallis test found this difference to be marginally statistically significant (H(1) = 3.7071, p = 0.0542). The male drivers that performed panic-braking maneuvers and did not activate BAS applied a mean braking force of 142.76 lbs (s.e. = 16.37 lbs, n = 42, minimum = 36.34 lbs, maximum = 585.34 lbs), while the male drivers that performed panic braking and did activate BAS applied a mean braking force of 207.88 lbs (s.e. = 30.59 lbs, n = 11, minimum = 81.29 lbs, maximum = 414.11 lbs). A Krustal-Wallis test found this difference to be statistically significant (H(1) = 4.9067, p = 0.0268).
Brake Pedal Displacement in Unexpected Braking at the Barricade
The one female driver that performed a panic-braking maneuver at the unexpected barricade applied the brakes with a maximum displacement of 2.49 in. The three male drivers that performed a panic-braking maneuver at the unexpected barricade applied an average maximum displacement of 2.52 in (s.e. = 0.08 in, n = 3, minimum = 2.37 in, maximum = 2.62 in). A Krustal-Wallis test did not find this difference to be statistically significant (H(1) = 0.2, p = 0.6547).
Brake Pedal Displacement in Anticipated Braking at the Barricade
The two female drivers that performed a panic-braking maneuver at the anticipated barricade applied an average maximum brake pedal displacement of 2.22 in (s.e. = 0.09 in, n = 2, minimum = 2.13 in, maximum = 2.31 in), while the five male drivers that performed a panic-braking maneuver at the anticipated barricade applied an average maximum brake pedal displacement of 2.65 in (s.e. = 0.03 in, n = 5, minimum = 2.59 in, maximum = 2.75 in). A Krustal-Wallis test found this difference to be marginally statistically significant (H(1) = 3.75, p = 0.0528). When just considering the five male drivers that performed a panic-braking maneuver at the anticipated barricade, the two drivers that did not activate BAS had a mean maximum brake pedal displacement of 2.61 in (s.e. = 0.01 in, n = 2, minimum = 2.60 in, maximum = 2.62 in), while the three male drivers that did activate BAS had a mean maximum brake pedal displacement of 2.67 in (s.e. = 0.05 in, n = 3, minimum = 2.59 in, maximum = 2.75 in). A Krustal-Wallis test did not find this difference to be statistically significant (H(1) = 0.3333, p = 0.5637).
Brake Pedal Displacement in Repeated Braking Session
The female drivers that performed a panic-braking maneuver had a mean maximum brake pedal displacement of 2.74 in (s.e. = 0.04 in, n = 56, minimum = 2.26 in, maximum = 3.53 in), while the male drivers that performed a panic-braking maneuver had a mean maximum brake pedal displacement of 2.92 in (s.e. = 0.05 in, n = 53, minimum = 2.46 in, maximum = 3.70 in). A Krustal-Wallis test found this difference to be statistically significant (H(1) = 9.7533, p = 0.0018). Female drivers that performed a panic-braking maneuver and did not activate BAS had
105

a mean maximum brake pedal displacement of 2.75 in (s.e. = 0.05 in, n = 46, minimum = 2.26 in, maximum = 3.53 in), while the female drivers that performed panic braking and did activate BAS had a mean maximum brake pedal displacement of 2.68 in (s.e. = 0.07 in, n = 10, minimum = 2.48 in, maximum = 3.25 in). A Krustal-Wallis test did not find this difference to be statistically significant (H(1) = 0.0029, p = 0.9573). The male drivers that performed a panic-braking maneuver and did not activate BAS had a mean maximum brake pedal displacement of 2.90 in (s.e. = 0.05 in, n = 42, minimum = 2.46 in, maximum = 3.70 in), while the male drivers that performed panic braking and did activate BAS had a mean maximum brake pedal displacement of 3.01 in (s.e. = 0.10 in, n = 11, minimum = 2.59 in, maximum = 3.45 in). A Krustal-Wallis test did not find this difference to be statistically significant (H(1) = 1.7324, p = 0.1881).
Summary
A gender effect was found regarding drivers’ brake pedal applications in panic-braking maneuvers. Male drivers exerted significantly larger forces on the brake pedal compared to female drivers in the repeated braking session. Male drivers also displaced the brake pedal significantly further than female drivers in the repeated braking session. Both male and female drivers were observed to apply significantly more brake pedal force when BAS activated compared to when it did not activate in the repeated braking session. These findings may facilitate the development of braking system design guidelines.
Research Question 10. Do older or experienced drivers apply the brakes with forces and displacements similar to younger or less experienced drivers?
Brake Pedal Force in Unexpected Braking at the Barricade
The two older drivers that performed a panic-braking maneuver at the unexpected barricade applied an average braking force of 44.87 lbs (s.e. = 0.20 lbs, n = 2, minimum = 44.67 lbs, maximum = 45.08 lbs). The two younger drivers that performed a panic-braking maneuver at the unexpected barricade applied an average braking force of 39.69 lbs (s.e. = 0.68 lbs, n = 2, minimum = 39.01 lbs, maximum = 40.37 lbs). A Krustal-Wallis test did not find this difference to be statistically significant (H(1) = 2.4, p = 0.1213).
Brake Pedal Force in Anticipated Braking at the Barricade
The four older drivers that performed a panic-braking maneuver at the anticipated barricade applied an average braking force of 54.97 lbs (s.e. = 8.92 lbs, n = 4, minimum = 40.65 lbs, maximum = 77.54 lbs), while the three younger drivers that performed a panic-braking maneuver at the anticipated barricade applied an average braking force of 39.79 lbs (s.e. = 12.53 lbs, n = 3, minimum = 26.16 lbs, maximum = 64.82 lbs). A Krustal-Wallis test did not find this difference to be statistically significant (H(1) = 1.125, p = 0.2888). When considering just the four older drivers that performed a panic-braking maneuver at the anticipated barricade, the one driver that did not activate BAS applied a braking force of 60.98 lbs, while the three older male drivers that did activate BAS applied a mean braking force of 52.97 lbs (s.e. = 12.29 lbs, n = 3, minimum = 40.65 lbs, maximum = 77.54 lbs). A Krustal-Wallis test did not find this difference to be statistically significant (H(1) = 0.2, p = 0.6547).
106

Brake Pedal Force in Repeated Braking Session
The older drivers that performed a panic-braking maneuver applied the brakes with a mean force of 88.72 lbs (s.e. = 8.80 lbs, n = 46, minimum = 15.45 lbs, maximum = 268.84 lbs), while the younger drivers that performed a panic-braking maneuver applied the brakes with a mean force of 144.16 lbs (s.e. = 12.32 lbs, n = 63, minimum = 31.95 lbs, maximum = 585.34 lbs). A Krustal-Wallis test found this difference to be statistically significant (H(1) = 16.2983, p < 0.0001). The older drivers that performed a panic-braking maneuver and did not activate BAS applied a mean braking force of 79.74 lbs (s.e. = 8.05 lbs, n = 40, minimum = 15.45 lbs, maximum = 268.84 lbs), while the older drivers that performed panic braking and did activate BAS applied a mean braking force of 148.58 lbs (s.e. = 33.90 lbs, n = 6, minimum = 56.19 lbs, maximum = 247.37 lbs). A Krustal-Wallis test found this difference to be statistically significant (H(1) = 4.3574, p = 0.0368). The younger drivers that performed a panic-braking maneuver and did not activate BAS applied a mean braking force of 137.71 lbs (s.e. = 14.08 lbs, n = 48, minimum = 31.95 lbs, maximum = 585.34 lbs), while the younger drivers that performed panic braking and did activate BAS applied a mean braking force of 164.81 lbs (s.e. = 25.55 lbs, n = 15, minimum = 75.73 lbs, maximum = 414.11 lbs). A Krustal-Wallis test did not find this difference to be statistically significant (H(1) = 1.6667, p = 0.1967).
Brake Pedal Displacement in Unexpected Braking at the Barricade
The two older drivers that performed a panic-braking maneuver at the unexpected barricade applied the brakes with a mean maximum brake pedal displacement of 2.59 in (s.e. = 0.02 in, n = 2, minimum = 2.57 in, maximum = 2.62 in). The two younger drivers that performed a panic-braking maneuver at the unexpected barricade applied an average maximum displacement of 2.43 in (s.e. = 0.06 in, n = 2, minimum = 2.37 in, maximum = 2.49 in). A Krustal-Wallis test did not find this difference to be statistically significant (H(1) = 0.2, p = 0.6547).
Brake Pedal Displacement in Anticipated Braking at the Barricade
The four older drivers that performed a panic-braking maneuver at the anticipated barricade applied an average maximum brake pedal displacement of 2.65 in (s.e. = 0.04 in, n = 4, minimum = 2.59 in, maximum = 2.75 in), while the three younger drivers that performed a panic-braking maneuver at the anticipated barricade applied an average maximum brake pedal displacement of 2.35 in (s.e. = 0.14 in, n = 3, minimum = 2.13 in, maximum = 2.62 in). A Krustal-Wallis test did not find this difference to be statistically significant (H(1) = 2, p = 0.1573). When considering just the four older drivers that performed a panic-braking maneuver at the anticipated barricade, the one driver that did not activate BAS had a maximum brake pedal displacement of 2.60 in, while the three older drivers that did activate BAS had a mean maximum brake pedal displacement of 2.67 in (s.e. = 0.05 in, n = 3, minimum = 2.59 in, maximum = 2.75 in). A Krustal-Wallis test did not find this difference to be statistically significant (H(1) = 0.2, p = 0.6547).
Brake Pedal Displacement in Repeated Braking Session
The older drivers that performed a panic-braking maneuver had a mean maximum brake pedal displacement of 2.80 in (s.e. = 0.05 in, n = 46, minimum = 2.26 in, maximum = 3.46 in), while
107

the younger drivers that performed a panic-braking maneuver had a mean maximum brake pedal displacement of 2.85 in (s.e. = 0.04 in, n = 63, minimum = 2.40 in, maximum = 3.70 in). A Krustal-Wallis test did not find this difference to be statistically significant (H(1) = 1.9407, p = 0.1636). The older drivers that performed a panic-braking maneuver and did not activate BAS had a mean maximum brake pedal displacement of 2.76 in (s.e. = 0.05 in, n = 40, minimum = 2.26 in, maximum = 3.46 in), while the older drivers that performed panic braking and did activate BAS had a mean maximum brake pedal displacement of 3.02 in (s.e. = 0.17 in, n = 6, minimum = 2.48 in, maximum = 3.44 in). A Krustal-Wallis test found this difference to be statistically significant (H(1) = 6.3113, p = 0.012). The younger drivers that performed a panic-braking maneuver and did not activate BAS had a mean maximum brake pedal displacement of 2.87 in (s.e. = 0.05 in, n = 48, minimum = 2.40 in, maximum = 3.70 in), while the younger drivers that performed panic braking and did activate BAS had a mean maximum brake pedal displacement of 2.78 in (s.e. = 0.07 in, n = 15, minimum = 2.56 in, maximum = 3.45 in). A Krustal-Wallis test did not find this difference to be statistically significant (H(1) = 0.2043, p = 0.6512).
Summary
An age effect was found regarding drivers’ brake pedal applications in panic-braking maneuvers. Younger drivers exerted significantly greater forces on the brake pedal compared to older drivers in the repeated braking session. Older drivers also applied significantly more brake pedal force, and displaced the brake pedal further, when they activated BAS in the repeated braking session compared to when they did not activate BAS. An age effect was not found regarding how far drivers displaced the brake pedal.
Research Question 11. What initial pedal travel speed and displacement are characteristic of panic-braking maneuvers?
Panic braking is reported to be characterized by a rapid onset of the brake pedal, followed by sustained brake force application (Hara, et al., 1998). The rate at which drivers pressed the brake pedal in the first 0.05 s of the braking maneuver was measured. The brake pedal displacement achieved prior to sustained braking force was also measured. This value was defined as the first inflection point in the brake pedal displacement profile.
Unexpected Braking at the Barricade
The four Volvo S80 drivers that performed a panic-braking maneuver at the unexpected barricade applied the brakes with a mean application rate of 3.55 in/s (s.e. = 0.61 in/s, n = 4, minimum = 2.00 in/s, maximum = 4.80 in/s). These drivers achieved a mean initial brake pedal displacement of 1.96 in (s.e. = 0.29 in, n = 4, minimum = 1.18 in, maximum = 2.47 in).
Anticipated Braking at the Barricade
The seven Volvo S80 drivers that performed a panic-braking maneuver at the anticipated barricade applied the brakes with a mean application rate of 5.14 in/s (s.e. = 1.49 in/s, n = 7, minimum = 0.80 in/s, maximum = 11.4 in/s). These drivers achieved a mean initial brake pedal displacement of 2.41 in (s.e. = 0.12 in, n = 7, minimum = 1.83 in, maximum = 2.67 in). When
108

considering the BAS-inactive stops, drivers applied the brakes with a mean application rate of 3.50 in/s (s.e. = 1.74 in/s, n = 4, minimum = 0.80 in/s, maximum = 8.60 in/s), and achieved a mean initial brake pedal displacement of 2.23 in (s.e. = 0.15 in, n = 4, minimum = 1.83 in, maximum = 2.57 in). In comparison, when considering the BAS-active stops, drivers applied the brakes with a mean application rate of 7.33 in/s (s.e. = 2.31 in/s, n = 3, minimum = 3.40 in/s, maximum = 11.40 in/s), and achieved a mean initial brake pedal displacement of 2.64 in (s.e. = 0.02 in, n = 3, minimum = 2.59 in, maximum = 2.67 in).
Repeated Braking Session
When considering all panic-braking maneuvers performed in the repeated braking session, drivers applied the brakes with a mean application rate of 9.30 in/s (s.e. = 0.53 in/s, n = 109, minimum = 0.2 in/s, maximum = 22.2 in/s). These drivers achieved a mean initial brake pedal displacement of 2.70 in (s.e. = 0.03 in, n = 109, minimum = 0.72 in, maximum = 3.45 in).
When considering the panic-braking maneuvers performed in the Mercedes-Benz R350 during the repeated braking session, the brakes were applied at a mean application rate of 7.29 in/s (s.e. = 0.97 in/s, n = 31, minimum = 0.40 in/s, maximum = 17.80 in/s). The mean initial brake pedal displacement was 3.06 in (s.e. = 0.04 in, n = 31, minimum = 2.45 in, maximum = 3.45 in). When considering the BAS-inactive stops performed in the Mercedes-Benz R350, the brakes were applied at a mean application rate of 6.67 in/s (s.e. = 0.99 in/s, n = 27, minimum = 0.40 in/s, maximum = 16.4 in/s), and a mean initial brake pedal displacement of 3.03 in (s.e. = 0.04 in, n = 27, minimum = 2.45 in, maximum = 3.45 in). In comparison, when considering the BAS-active stops, the brakes were applied at a mean application rate of 11.45 in/s (s.e. = 3.16 in/s, n = 4, minimum = 3.20 in/s, maximum = 17.80 in/s), and a mean initial brake pedal displacement of 3.24 in (s.e. = 0.09 in, n = 4, minimum = 3.05 in, maximum = 3.41 in).
When considering the panic-braking maneuvers performed in the Volvo S80 during the repeated braking session, the brakes were applied at a mean application rate of 10.15 in/s (s.e. = 0.61 in/s, n = 78, minimum = 0.20 in/s, maximum = 22.20 in/s). The mean initial brake pedal displacement was 2.56 in (s.e. = 0.03 in, n = 78, minimum = 0.72 in, maximum = 2.93 in). When considering the BAS-inactive stops, the brakes were applied at a mean application rate of 10.61 in/s (s.e. = 0.69 in/s, n = 61, minimum = 0.20 in/s, maximum = 22.20 in/s), and a mean initial brake pedal displacement of 2.54 in (s.e. = 0.04 in, n = 61, minimum = 0.72 in, maximum = 2.86 in). In comparison, when considering the BAS-active stops, the brakes were applied at a mean application rate of 8.28 in/s (s.e. = 1.20 in/s, n = 17, minimum = 1.20 in/s, maximum = 18.40 in/s), and a mean initial brake pedal displacement of 2.65 in (s.e. = 0.03 in, n = 17, minimum = 2.48 in, maximum = 2.93 in).
Research Question 12. Can brake pedal displacement alone be used to identify panic braking?
The initial brake pedal displacement was used to investigate whether brake pedal displacement alone can be used to identify panic braking. Recall that panic braking was operationally defined as a braking maneuver in which ABS activated. The approach taken was to compare the initial brake pedal displacements for all panic-braking maneuvers to the initial brake pedal displacements for all complete stops where ABS did not activate.
109

Unexpected Braking at the Barricade
In considering the complete stops performed in response to the unexpected barricade, the four Volvo S80 drivers that performed panic-braking maneuvers exhibited a mean initial brake pedal displacement of 1.96 in (s.e. = 0.30 in, n = 4, minimum = 1.18 in, maximum = 2.47 in). The seven Mercedes-Benz R350 drivers that stopped, but did not activate ABS, had a mean initial brake pedal displacement of 2.25 in (s.e. = 0.29 in, n = 7, minimum = 1.09 in, maximum = 3.21 in). A Krustal-Wallis test did not find this difference to be statistically significant (H(1) = 0.3229, p = 0.5699).
Anticipated Braking at the Barricade
In considering the complete stops performed in response to the anticipated barricade, the six drivers that performed panic-braking maneuvers exhibited a mean initial brake pedal displacement of 2.45 in (s.e. = 0.14 in, n = 6, minimum = 1.83 in, maximum = 2.67 in). The 47 drivers that stopped, but did not activate ABS, had a mean initial brake pedal displacement of 2.16 in (s.e. = 0.05 in, n = 47, minimum = 1.38 in, maximum = 2.84 in). A Krustal-Wallis test did not find this difference to be statistically significant (H(1) = 2.1727, p = 0.1405).
The three BAS-active stops had a mean initial brake pedal displacement of 2.64 in (s.e. = 0.02 in, n = 3, minimum = 2.59 in, maximum = 2.67 in), while the 50 complete stops where BAS did not activate had a mean initial brake pedal displacement of 2.16 in (s.e. = 0.05 in, n = 50, minimum = 1.38 in, maximum = 2.84 in). A Krustal-Wallis test found this difference to be statistically significant (H(1) = 4.1628, p = 0.0413).
Repeated Braking Session
In considering the complete stops performed in the repeated braking session, panic-braking maneuvers had a mean initial brake pedal displacement of 2.70 in (s.e. = 0.03 in, n = 107, minimum = 0.72 in, maximum = 3.45 in), while the complete stops without ABS-activation had a mean initial brake pedal displacement of 2.81 in (s.e. = 0.04 in, n = 71, minimum = 1.72 in, maximum = 3.33 in). A Krustal-Wallis test found this difference to be statistically significant (H(1) = 13.344, p = 0.0003).
BAS-active stops had a mean initial brake pedal displacement of 2.78 in (s.e. = 0.06 in, n = 22, minimum = 2.48 in, maximum = 3.41 in), while the complete stops where BAS did not activate had a mean initial brake pedal displacement of 2.74 in (s.e. = 0.03 in, n = 158, minimum = 0.72 in, maximum = 3.45 in). A Krustal-Wallis test did not find this difference to be statistically significant (H(1) = 0.1013, p = 0.7503).
Summary
Drivers’ initial brake pedal displacement was found to vary by driver and braking maneuver. Drivers’ initial brake pedal displacement cannot be used alone to reliably predict ABS or BAS activation.
110

Research Question 13. Do drivers modulate their braking during panic-braking maneuvers?
Brake modulation refers to drivers adjusting braking effort to control the vehicle’s deceleration profile. Brake modulation might occur when drivers initially apply a low force on the brake pedal and increase it as they realize a need for greater deceleration (to avoid an object). Brake modulation could also consist of drivers overestimating the required deceleration, leading to easing off the brake pedal as the vehicle comes to a stop (in front of an object). Brake modulation is of interest since some drivers may not be aware they are doing it during panic-braking maneuvers. These drivers are therefore not achieving minimum stopping distances.
Whether drivers modulate their braking during panic-braking maneuvers was investigated as follows. First, all ABS-active stops were identified. The first inflection point in the brake pedal displacement was selected to mark the onset of sustained braking effort. The brake pedal displacement associated with the first inflection point was stored as a threshold. All values of brake pedal displacement between the first and last inflection points were then considered. The largest negative decrease, and largest positive increase, in brake pedal displacement was recorded. A “Modulation” score was developed by adding the absolute value of these two variables together. A large Modulation score was produced when brake pedal travel was great, which occurs as drivers’ modulate their braking effort. A “Direction” score was then developed by adding the largest positive increase and the largest negative decrease together. Positive Direction scores were indicative of drivers increasing their braking effort, while negative Direction scores were indicative of drivers decreasing their braking effort.
The next step was to determine whether the Modulation scores significantly differed from the brake pedal displacement noise that occurs during sustained braking input. The brake pedal displacement noise was quantified using two sources. The first source was the brake pedal displacement data collected during the BAS characterization tests performed at VRTC. Here, the brake pedal displacement realized from the brake pedal controller input was examined. Specifically, steady state input for a number of stops was inspected and the largest range in brake pedal displacement was recorded as noise. The largest observed range was 0.1 in. The second source was the braking maneuvers performed by participants who exhibited steady brake pedal effort. Steady brake pedal effort was defined as a participant with a linear regression slope of near-zero and a high r-squared value, as compared to other drivers in the study. A participant matching these criteria was identified, and the characteristics of this participant’s best stop were compared to the brake pedal displacement noise produced by the piston. The pedal modulation noise produced by the human participant during the flattest portion of the pedal displacement series was found to have a maximum range of 0.11 in. Since this value was greater than that produced by the piston, it was used when testing the Modulation measure for significant differences.
The final step consisted of performing hypothesis tests where the mean Modulation and Direction scores significantly differed from the mean noise scores with 95-percent confidence. The average Modulation and Direction scores, as well as the results of the hypothesis tests, for each braking maneuver are reported below.
111

Unexpected Braking at the Barricade
The four Volvo S80 drivers that performed panic-braking maneuvers at the unexpected barricade had a mean Modulation score of 1.55 in (s.e. = 0.78 in, n = 4, minimum = 0.28 in, maximum = 3.66 in). With alpha set at 0.05, a one-sample t-test found this mean to not differ significantly from the 0.11 in noise score (t(3) = 1.83, p = 0.1639), suggesting that these drivers did not modulate their braking at the unexpected barricade. However, this non-significant outcome may be the result of the low number of observations. These drivers produced a mean Direction score of positive 1.26 in (s.e. = 0.90 in, n = 4, minimum = -0.43 in, maximum = 3.66 in). This suggests that these drivers may have increased their braking effort after the onset of sustained braking. This may be indicative of partial braking upon the detection of the barricade, followed by increased braking upon the recognition of the barricade.
The low number of drivers performing panic stops at the inflatable barricade preclude statistical testing of gender and age differences in Modulation and Direction. The one female participant had a higher Modulation (1.83 in) as compared to the four males (1.45 in), although no conclusions should be drawn from the comparison. No patterns or trends were apparent in the Modulation scores. Descriptive statistics for Modulation and Direction are presented in Table 37.
Table 37. Modulation Scores for those Drivers that Stopped to the Unexpected Barricade Measure Gender Age N Mean s.e. Minimum Maximum
Modulation Female Younger 1 1.83 -- 1.83 1.83 Male Older 2 1.97 1.69 0.28 3.66 Male Younger 1 0.43 -- 0.43 0.43
Direction Female Younger 1 1.57 -- 1.57 1.57 Male Older 2 1.94 1.71 0.23 3.66 Male Younger 1 -0.43 -- -0.43 -0.43
Anticipated Braking to Barricade
The six Volvo S80 drivers that performed an ABS-activated stop at the anticipated barricade had a mean Modulation score of 1.02 in (s.e. = 0.40 in, n = 6, minimum = 0.15 in, maximum = 2.92 in). With alpha set at 0.05, a one-sample t-test found this mean to not differ significantly from the 0.11-inch noise score (t(5) = 2.24, p = 0.07), suggesting that these drivers did not modulate their braking when the barricade was anticipated. However, this non-significant outcome may be the result of the low number of observations. These drivers produced a mean Direction score of 0.32 in (s.e. = 0.57 in, n = 6, minimum = -2.92 in, maximum = 0.99 in). This may suggest that these drivers decreased their braking effort after the onset of sustained braking, which may be indicative of over braking upon the detection of the barricade, followed by decreased braking after recognizing that they would have plenty of room to stop ahead of the barricade.
The low number of drivers performing panic stops at the inflatable barricade preclude statistical testing of gender or age differences in Modulation and Direction. No gender or age group patterns were apparent in the Modulation or Direction scores. Descriptive statistics for Modulation and Direction are presented in Table 38.
112

Table 38. Modulation Scores for those Drivers that Stopped at the Anticipated Barricade Measure Gender Age N Mean s.e. Minimum Maximum
Modulation Female Younger 1 0.76 -- 0.76 0.76 Male Older 4 1.09 0.63 0.15 2.92 Male Younger 1 0.99 -- 0.99 0.99
Direction Female Younger 1 0.76 -- 0.76 0.76 Male Older 4 -0.92 0.67 -2.92 0 Male Younger 1 0.99 -- 0.99 0.99
Repeated Braking Session
The 29 ABS-active stops performed in the Mercedes-Benz R350 in the repeated braking session had a mean Modulation score of 0.72 in (s.e. = 0.08 in, n = 29, minimum = 0.18 in, maximum = 1.68 in). With alpha set at 0.05, a one-sample t-test found that this mean significantly differed from the 0.11-inch noise score (t(28) = 7.84, p < 0.0001) , suggesting that these drivers modulated their braking when they stopped as fast as possible upon detecting an auditory alarm. These drivers produced a mean Direction score of 0.14 in (s.e. = 0.12 in, n = 29, minimum = 1.52 in, maximum = 1.63 in). This suggests that these drivers increased their braking effort after the onset of sustained braking. Descriptive statistics for drivers in the Mercedes-Benz R350, for Stops R1, R2, and R3, are presented in Table 39.
Table 39. Modulation Scores for Drivers that Stopped in R1, R2, and R3 Using the Mercedes-Benz R350
Gender Age Measure N Mean s.e. Minimum Maximum Female Older Modulation 4 0.84 0.18 0.48 1.32 Female Older Direction 4 0.12 0.47 -0.75 1.32 Female Younger Modulation 8 0.58 0.07 0.30 0.91 Female Younger Direction 8 0.22 0.14 -0.46 0.71 Male Older Modulation 8 0.65 0.13 0.33 1.27 Male Older Direction 8 0.07 0.16 -0.84 0.53 Male Younger Modulation 9 0.86 0.20 0.18 1.68 Male Younger Direction 9 0.14 0.29 -1.52 1.63
In order to assess for differences in Modulation based on driver gender and age, a 2 (Gender) x 2 (Age) ANOVA was performed. Gender or Age effects were not found (F(1, 26) = 0.33, p = 0.57, F(1, 26) = 0.03, p = 0.87, respectively). To assess for differences in Direction, an ANOVA assessing the effect of driver gender and age was performed. There was no main effect for gender (F(1, 26) = 0.07, p = 0.80) or age (F(1, 26) = 0.11, p = 0.74).
The 76 ABS-active stops performed in the Volvo S80 in the repeated braking session had a mean Modulation score of 0.81 in (s.e. = 0.05 in, n = 76, minimum = 0.20 in, maximum = 2.46 in). With alpha set at 0.05, a one-sample t-test found that this mean differed significantly from the 0.11-inch noise score (t(75) = 14.14, p < 0.0001) , suggesting that these drivers modulated their braking when they stopped as fast as possible upon detecting an auditory alarm. These drivers produced a mean Direction score of -0.45 in (s.e. = 0.07 in, n = 76, minimum = -2.23 in, maximum = 1.42 in). This suggests that these drivers decreased their braking effort after the
113

onset of sustained braking. Descriptive statistics for drivers in the Volvo S80, for Stops R1, R2, and R3, are presented in Table 40.
Table 40. Modulation Scores for Drivers that Stopped in R1, R2, and R3 Using the Volvo S80
Gender Age Measure N Mean s.e. Minimum Maximum Female Older Modulation 18 0.73 0.10 0.20 1.55 Female Older Direction 18 -0.57 0.11 -1.40 0.43 Female Younger Modulation 24 0.87 0.09 0.28 2.29 Female Younger Direction 24 -0.56 0.12 -2.24 0.89 Male Older Modulation 13 0.80 0.16 0.30 2.46 Male Older Direction 13 -0.31 0.20 -0.91 1.32 Male Younger Modulation 21 0.82 0.09 0.25 2.29 Male Younger Direction 21 -0.31 0.14 -1.02 1.42
In order to assess for differences in Modulation based on driver gender and age, a 2 (Gender) x 2 (Age) ANOVA was performed. There was no main effect for gender (F(1, 73) < 0.005, p = 0.94) or age (F(1, 73) = 0.65, p = 0.42). To assess for differences in Direction, an ANOVA assessing the effect of driver gender and age was performed. There was no main effect for gender (F(1, 73) = 3.50, p = 0.07) or age (F(1, 73) < 0.005, p = 0.97).
For the Repeated Braking Sessions, assessments comparing the two test vehicles were performed. No significant effect of test vehicle was found on Modulation, F(1, 103) = 0.96, p = 0.33. However, a significant effect of test vehicle was present for Direction, F(1, 103) = 19.57, p < 0.0001. Drivers of the Volvo S80 tended to have a negative Direction, with a mean of -0.45 in (s.e. = 0.07 in). Drivers of the Mercedes-Benz R350 had a positive Direction, with a mean of 0.72 in (s.e. = 0.08 in). This significant difference may have been influenced by the unbalanced nature of the comparison, as there were 29 stops recorded in the Mercedes-Benz, and 76 recorded in the Volvo.
Table 41. Modulation Scores by Test Vehicle Used Vehicle Measure N Mean s.e. Minimum Maximum
Mercedes-Benz R350 Modulation 29 0.72 0.08 0.18 1.68 Direction 29 0.14 0.12 -1.52 1.63
Volvo S80 Modulation 76 0.81 0.05 0.20 2.46 Direction 76 -0.45 0.07 -2.24 1.42
Summary
As a whole, drivers tended to modulate the brake pedal of the test vehicle. This was evidenced by significant differences between the Modulation variable and the derived noise threshold of 0.11 in. Most drivers, across all stops, tended to reduce their braking effort. This was illustrated in the significant differences between Direction scores and the comparison value of 0.11 in.
Interestingly, no significant gender or age differences were present. However, this may be due to almost all drivers modulating the brake pedal to some extent. Although Modulation did not differ between the two test vehicles, there were significant differences in Direction. The Volvo
114

S80 drivers tended to reduce brake application across the duration of a stop, while Mercedes-Benz R350 drivers tended to increase brake application. This may be due to either the nature of the individual vehicles, or some facet of driver behavior not otherwise captured by the experimental design.
115

CHAPTER 6. DISCUSSION
This discussion chapter is broken into two sections. The first section discusses the effect of BAS on driver panic-braking performance, while the second section discusses panic braking in general and the role that expectancy plays.
THE BRAKE ASSIST EFFECT
BAS has become a standard feature on many vehicle models since its introduction to the marketplace by Mercedes-Benz in 1996. It was conceived from simulator research internal to Mercedes-Benz in the early 1990’s that found that although many drivers apply the brakes quickly during panic-braking maneuvers, many fail to apply braking forces capable of yielding a vehicle’s maximum braking performance. The BAS safety feature addresses this human physical limitation by supplementing drivers’ braking force upon detecting a panic-braking maneuver.
This report presents the results of a comprehensive investigation of drivers’ panic-braking performance with the BAS safety feature. Information was gathered by submitting surveys to OEMs and Tier 1 suppliers that solicited information on the type of BAS they manufacture, its operation, and the direction the technology was taking. This communication revealed that electronic BAS would become commonplace as fundamental components become standard on less expensive vehicle models. As such, two electronic BASs were selected for this investigation: 1) a 2006 Mercedes-Benz R350 that had a vacuum-booster-based BAS, and 2) a 2007 Volvo S80 that had an ABS-pump-based BAS.
At the onset of this investigation, little was known about the brake pedal input necessary to activate BAS, as well as the maximum reduction in stopping distance that BAS activation produced. Both test vehicles were thus brought to the VRTC in East Liberty, Ohio to have their BAS characterized. Using a mechanical brake controller, the brake pedal input necessary to activate BAS was systematically identified. It was found that BAS activation with threshold brake pedal input in the Mercedes-Benz R350 produced stopping distances 20.2 ft shorter than stopping distances produced when BAS was disabled. In contrast, BAS activation with maximum brake pedal input in the Mercedes-Benz R350 produced stopping distances 0.1 ft shorter than stopping distances produced when BAS was disabled. Unfortunately, a BAS activation threshold could not be systematically identified in the Volvo S80 because of limitations with the brake controller. However, BAS activation generated by a professional driver revealed that the activation threshold was higher than what the brake controller was capable of producing. Overall, the characterization tests revealed that the benefits offered by BAS are dependent on what drivers’ baseline brake pedal input is (i.e., drivers that apply brake pedal input near the BAS activation threshold will benefit more than drivers that apply the maximally allowed brake pedal input).
There was a concern that high BAS activation thresholds would prevent participants from activating BAS in the human performance braking study. Preliminary testing at VTTI with human subjects was thus performed. Here, it was found that drivers could activate BAS, but only after they were shown how to press the brake pedal in the proper manner. This finding encouraged the researchers to continue with the human braking performance evaluation, but to
116

incorporate a component that measured drivers’ performance after they were shown how to perform panic-braking maneuvers.
The human braking performance tests comprised various braking maneuvers to investigate BAS. Sixty-four participants, balanced for age and gender, drove one of the two instrumented vehicles down a closed-course test track at 45 mph. After a 25-minute familiarization period, drivers were unknowingly presented with an inflatable barricade that spanned the entire road for which some of them stopped the vehicle to avoid a collision. After drivers consented to continue the experiment, a series of braking maneuvers were performed afterwards, including stopping at the inflatable barricade again and performing numerous hard-braking maneuvers in response to an auditory alarm. Drivers’ panic-braking performances were measured and the effect of BAS activation on vehicle stopping distance was evaluated using more than one approach. Here, a panic-braking maneuver was operationally defined as a braking maneuver in which ABS activated and the vehicle came to a complete stop.
BAS was first evaluated by comparing the mean corrected stopping distance produced by BAS-inactive panic-braking maneuvers to the mean corrected stopping distance produced by BAS-active panic-braking maneuvers. The stops performed to the unexpected barricade were not analyzed in this approach because no BAS activations were observed in this trial. The three BAS-active panic-braking maneuvers performed in the Volvo S80 at the anticipated barricade, however, were found to be on average 11.98 ft shorter than the three BAS-inactive panic-braking maneuvers performed in the same vehicle. This difference was not found to be statistically significant (p = 0.2752). This was likely because of the small sample size available. Stopping distance comparisons for the anticipated barricade braking maneuver in the Mercedes-Benz R350 were not made because BAS activations in it were not observed. When considering the panic-braking maneuvers performed in the repeated braking session, the four BAS-active panic-braking maneuvers performed in the Mercedes-Benz R350 were on average 4.61 ft shorter than the 25 BAS-inactive panic-braking maneuvers performed in the Mercedes-Benz R350. This difference was found to be statistically significant (p = 0.0079). The 17 BAS-active panic-braking maneuvers performed in the Volvo S80 were on average 1.51 ft shorter than the 61 BAS-inactive panic-braking maneuvers performed in the Volvo S80. This difference was not statistically significant (p = 0.4209). Here, BAS activation produced a larger reduction in stopping distance for the trained Mercedes-Benz R350 drivers than it did for the trained Volvo S80 drivers, while more trained Volvo S80 drivers were able to activate BAS than the trained Mercedes-Benz R350 drivers. Overall, although not all findings were statistically significant, because the mean stopping distance differences were all in the same direction, there appears to be a trend that BAS activation reduces panic-braking stopping distance.
A potential criticism of the previous approach is that panic-braking performance varies across drivers. To isolate the effect of BAS on driver panic-braking performance, drivers’ individual differences should be controlled. The second analytical approach accomplished this by considering only drivers that activated BAS in the repeated braking session and by comparing the stopping distances they produced when BAS-activated to the stopping distances they produced when BAS was disabled. Here, the mean BAS-active stopping distance produced in the Mercedes-Benz R350 was 5.92 ft shorter than the mean BAS-disabled stopping distance. This difference was not statistically significant (p = 0.5). The mean BAS-active stopping
117
distance produced in the Volvo S80 was 0.61 ft shorter than the mean BAS-disabled stopping distance. This difference was not statistically significant (p = 0.8311). Again, although these differences were not statistically significant, because all of the mean stopping distance differences were in the same direction, there appears to be a trend that BAS activation reduces panic-braking stopping distance. Furthermore, it is worth pointing out that one Mercedes-Benz R350 driver and one Volvo S80 driver (who differed in age and gender) exhibited reductions in stopping distance exceeding 10 ft when BAS activated.
When drawing conclusions from these results, the reader should consider the finding that few drivers activated BAS in this study. None of the drivers activated BAS when braking for the unexpected barricade. Three older male drivers activated BAS in the Volvo S80 when braking for the anticipated barricade. After drivers were instructed how to perform panic-braking maneuvers and repeatedly performed hard-braking maneuvers, four drivers activated BAS in the Mercedes-Benz R350 and 14 drivers activated BAS in the Volvo S80. When considering just the 18 drivers that activated BAS in the repeated braking session, three drivers were older females, two drivers were older males, five drivers were younger females, and eight drivers were younger males. Here, younger drivers were found to be more likely to activate BAS than older drivers (p = 0.0593), while male drivers were not found to be more likely to activate BAS than female drivers (p = 0.6374).
The panic-braking maneuvers performed in the repeated braking session were used to investigate whether BAS equally supports older and younger drivers. It was found that the mean BAS-active stopping distance produced by older drivers was 4.06 ft shorter than the mean BAS-inactive stopping distance they produced. This difference was not statistically significant (p = 0.0938). The mean BAS-active stopping distance produced by younger drivers was 0.59 ft shorter than the mean BAS-inactive stopping distance they produced. This difference was also not statistically significant (p = 0.8591). When considering just the drivers that activated BAS in the repeated braking session, the mean BAS-active stopping distance produced by two older drivers was 5.44 ft shorter than the mean BAS-disabled stopping distance they produced. This difference was not statistically significant (p = 0.5000). Similarly, the mean BAS-active stopping distance produced by 11 younger drivers was 0.70 ft shorter than the mean BAS-disabled stopping distance they produced. This difference was also not statistically significant (p = 0.1671). A reason why the two older drivers showed a larger stopping distance reduction trend than the 11 younger drivers may be due to the fact that the sample size greatly differed in size. One of the two older drivers exhibited a 10-ft reduction in stopping distance, which raised the average. It was unusual that this driver’s BAS-disabled stopping distance was similar to the younger drivers’ BAS-disabled stopping distances, while his BAS-active stopping distance was shorter than the younger drivers’ BAS-active stopping distances. This suggests that the Mercedes-Benz R350 does not yield its minimum stopping distance when BAS activates.
The panic-braking maneuvers performed in the repeated braking session were analyzed to investigate whether BAS equally supports female and male drivers. It was found that the mean BAS-active stopping distance produced by female drivers was 1.60 ft shorter than the mean BAS-inactive stopping distance they produced. This difference was not statistically significant (p = 0.3851). The mean BAS-active stopping distance produced by male drivers was 1.93 ft shorter than the mean BAS-inactive stopping distance they produced. This difference was not
118

statistically significant (p = 0.4828). When considering just the drivers that activated BAS in the repeated braking session, the mean BAS-active stopping distance produced by five female drivers was 1.38 ft shorter than the mean BAS-disabled stopping distance they produced. This difference was not statistically significant (p = 0.6250). Similarly, the mean BAS-active stopping distance produced by eight male drivers was 1.46 ft shorter than the mean BAS-disabled stopping distance they produced. This difference was also not statistically significant (p = 0.4642). It should be noted that one male and one female exhibited a 10-ft stopping distance reduction when BAS activated. Unlike the male driver who was described in the previous paragraph, the female driver’s BAS-disabled stopping distance was longer than the other females’ BAS-disabled stopping distances, suggesting that her braking style was close to the Volvo S80’s BAS activation threshold.
An analysis of drivers’ questionnaire responses indicated that they could not detect when BAS activated. A SDT analysis also exemplified that drivers were not sensitive to the perception of BAS activation. Despite these findings, drivers indicated that they liked BAS and would purchase a vehicle that came equipped with it. However, these favorable ratings may be attributed to the allure of the safety feature, and not necessarily from experiencing greater decelerations and shorter stopping distances when it activated.
DRIVER PANIC-BRAKING PERFORMANCE AND THE ROLE OF EXPECTANCY
This study was specifically designed to observe drivers perform rapid brake pedal applications in an attempt to observe BAS activation. This was performed using a series of techniques, one of which is programming the barricade-launch-TTC to be short enough to demand drivers to rapidly press the brake pedal, while being long enough to provide drivers with sufficient time to avoid a collision. Using a TTC of 2.5 s, 11 of the 64 drivers (17 percent) came to a complete stop when the barricade was unexpected. Six drivers (9 percent) avoided a collision with the barricade. Four drivers activated ABS (6 percent), while none activated BAS. These results suggest that the 2.5-second TTC was short enough to incite four drivers to perform panic braking, while it was not short enough to instigate drivers to press the brake pedal fast enough to activate BAS. Reasons for why this occurred are explored below.
Braking for an object can be decomposed into a series of stages. The first stage is the detection of the object. This consists of drivers perceiving the object, cognitively processing that something is ahead, and making a response (Figure 52). With object detection, drivers comprehend that an object is present, but they do not know what it is, nor are they aware whether or not it poses a crash threat (McLaughlin, Hankey, & Dingus, 2005). Drivers’ responses to detected objects might include easing up on the throttle or applying the brakes. The second stage is object recognition. This involves drivers further perceiving information about the object, recognizing what it is by relating it to their previous experiences, and making a response. With object recognition, drivers make a decision regarding whether or not the detected object poses a crash threat (McLaughlin, et al., 2005). Drivers’ responses to recognized crash threats may include applying the brakes (if they have not been pressed yet), or increasing the force on the brake pedal to reduce stopping distance.
119

Figure 52. Stages of Human Information Processing Relevant to Normal Braking Performance
BAS-active braking, on the other hand, demands that drivers detect an object, immediately recognize the danger it poses based on their previous experiences, and act on this information by rapidly applying the brakes (Figure 53). Because drivers immediately recognize the crash threat, they quickly perform a braking response to the best of their ability to avoid the crash threat.
120

Figure 53. Stages of Human Information Processing Relevant to Panic-Braking Performance
Under this driver braking-maneuver decision-making model, perhaps a reason why drivers did not activate BAS in response to the unexpected barricade was due to the fact that they did not immediately recognize the barricade as a crash threat. The drivers that stopped in response to the barricade detected that it was there, but did not immediately recognize it as an imminent crash threat that demanded a quick brake pedal application to avoid it. Drivers that stopped at the unexpected barricade applied the brakes with a mean BRT of 1.04 s (s.e. = 0.10 s), an initial pedal travel speed of 4.40 in/s (s.e. = 0.89 in/s), a mean initial brake pedal displacement of 2.12 in (s.e. = 0.23 in), and a mean maximum brake pedal displacement of 2.80 in (s.e. = 0.09 in).
Conversely, for the second braking maneuver, drivers knew the barricade would launch and that they would need to brake to avoid colliding with it. Fifty-eight of the 62 eligible drivers (93 percent) came to a complete stop, three drivers (5 percent) collided with the barricade, seven drivers activated ABS (all were driving the Volvo S80), and three drivers activated BAS (all were driving the Volvo S80). Drivers that stopped for the anticipated barricade applied the brakes with a mean BRT of 0.72 s (s.e. = 0.05 s), an initial pedal application rate of 5.16 in/s (s.e. = 1.16 in/s), a mean initial brake pedal displacement of 2.27 in (s.e. = 0.11 in), and a mean
121
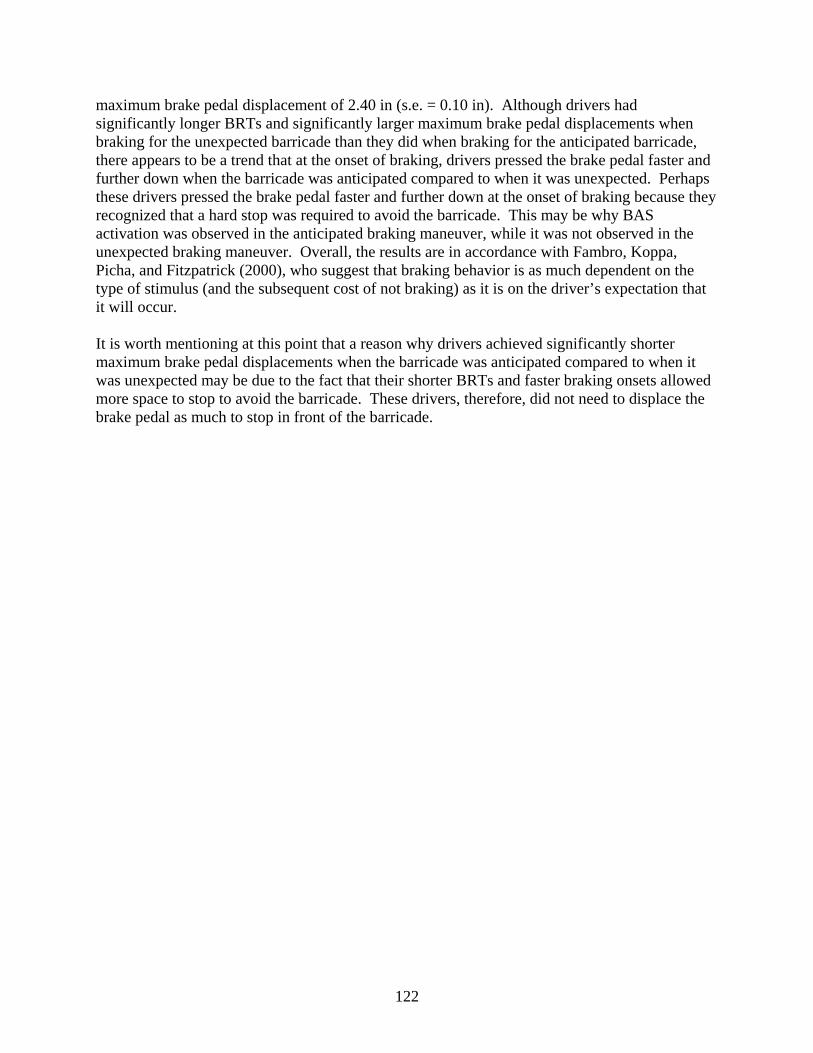
maximum brake pedal displacement of 2.40 in (s.e. = 0.10 in). Although drivers had significantly longer BRTs and significantly larger maximum brake pedal displacements when braking for the unexpected barricade than they did when braking for the anticipated barricade, there appears to be a trend that at the onset of braking, drivers pressed the brake pedal faster and further down when the barricade was anticipated compared to when it was unexpected. Perhaps these drivers pressed the brake pedal faster and further down at the onset of braking because they recognized that a hard stop was required to avoid the barricade. This may be why BAS activation was observed in the anticipated braking maneuver, while it was not observed in the unexpected braking maneuver. Overall, the results are in accordance with Fambro, Koppa, Picha, and Fitzpatrick (2000), who suggest that braking behavior is as much dependent on the type of stimulus (and the subsequent cost of not braking) as it is on the driver’s expectation that it will occur.
It is worth mentioning at this point that a reason why drivers achieved significantly shorter maximum brake pedal displacements when the barricade was anticipated compared to when it was unexpected may be due to the fact that their shorter BRTs and faster braking onsets allowed more space to stop to avoid the barricade. These drivers, therefore, did not need to displace the brake pedal as much to stop in front of the barricade.
122

CHAPTER 7. CONCLUSIONS
This study investigated drivers’ panic-braking performance with the BAS safety feature. It was found that 28 percent of drivers were able to activate BAS after they were shown how to perform panic-braking maneuvers. This suggests that not all drivers are able to benefit from BAS owing to their inability to generate the necessary braking input. When considering the drivers that did activate BAS, BAS-active stopping distances were 1.84 ft shorter than the BAS-inactive stopping distances. Furthermore, after isolating the effect of BAS activation from driver variability in panic-braking performance, BAS-active stopping distances were on average 1.43 ft (s.e. = 1.19 ft) shorter than BAS-disabled stopping distances. The findings show that regardless of how the data are analyzed, there appears to be a trend that BAS activation yields a reduction in panic braking maneuver stopping distance. When the data were analyzed by test vehicle, BAS-active stops in the Mercedes-Benz were 4.61 ft shorter than BAS-inactive stops and the BAS-active stops in the Volvo S80 were 1.51 ft shorter than BAS-inactive stops. Closer inspection revealed that younger drivers were more likely to activate BAS than older drivers, while male drivers were not more likely to activate BAS than female drivers. Additionally, a 10 ft reduction in stopping distance occurred once in each test vehicle. The larger number of BAS activations in the Volvo S80 compared to the Mercedes-Benz R350 (17 vs. 4 activations, respectively) is therefore a reason why the stopping distance differences in the Volvo S80 are not as pronounced. These findings suggest that BAS activation offers some drivers a slight reduction in panic braking stopping distance.
RECOMMENDATIONS
Overall, the as-tested BAS has potential safety benefit that could be accrued from reduced stopping distance, but were not realized in this evaluation. Nevertheless, BAS is fundamentally limited in that it only addresses a portion of drivers’ braking performance. Recall from the driver braking model that drivers must perceive an object and cognitively process its presence before they can initiate a response such as pressing the brake pedal. The elapsed time spanning perception and cognition can equate to a surmountable distance traveled by the vehicle. For example, a vehicle travelling 45 mph will travel 99 ft from the point a driver perceives a crash threat and begins to apply the brakes, assuming a BRT of 1.5 s. This distance can be exacerbated if the driver is not looking forward at the time the crash threat develops. Systems, such as the Mercedes-Benz Brake Assist PLUS with PRE-SAFE brake (Breuer, et al., 2007), the Volvo Collision Warning System with brake support, the Honda Collision Mitigation Brake System, the Toyota Pre-Crash Safety system, and General Motors’ Vehicle-to-Vehicle technology, that continuously scan the forward roadway, assess crash threat, alert the driver, activate the necessary deceleration upon braking input, or engage the vehicle’s brakes when a collision becomes unavoidable, stand to significantly reduce stopping distance compared to systems that depend upon a driver response to activate. These types of BAS may better serve improvements in highway safety.
123

FUTURE RESEARCH
As mentioned in the recommendations section, advanced BASs, such as the Mercedes-Benz Brake Assist PLUS with PRE-SAFE brake (Breuer, et al., 2007), the Volvo Collision Warning System with brake support, the Honda Collision Mitigation Brake System, the Toyota Pre-Crash Safety system, and General Motors’ Vehicle-to-Vehicle technology, may better support drivers in avoiding crashes because they do not depend on drivers surpassing a braking input threshold in order to activate. Furthermore, if a collision is deemed unavoidable, these BASs engage braking independently of the driver. Panic braking maneuver stopping distances, therefore, stand to become significantly shorter. Future research should explore the benefits offered by these advanced BASs on drivers’ panic-braking performance.
Another consideration for future research would be to develop a standardized method to test human subjects in performing panic braking maneuvers. This research could investigate what objects are immediately recognized by drivers as a crash threat. This could involve interviewing drivers to determine what objects they find threatening on the road, and what objects they would perform a hard-braking maneuver to avoid. Since using actual replicas of human bodies and animals is not advised by the IRB owing to the upsetting emotional experiences such objects can trigger (particularly for participants that have been involved in pedestrian/animal collisions), work can be performed to develop plastic objects that have recognizable shapes, but are clearly not alive. A plastic cutout of a child that has no details and is a bright color may strike a balance between being immediately recognizable as an object demanding a panic-braking maneuver, while not being alive. However, such objects must be wide enough so that they do not encourage drivers to swerve around them. They also cannot damage the vehicle if they are struck (i.e., the procedure cannot call for the replacement of the vehicle’s bumper each time it is damaged, not can energy be transferred to the participants from a collision). A standard TTC should be used to allow results to be compared across studies. In developing a procedure to test human’s panic braking performance, important lessons were learnt regarding how to maintain participants’ safety. These lessons are outlined in the next section.
LESSONS LEARNED
This section outlines the lessons learned regarding upholding participants’ safety throughout a panic braking experiment. The considerations that were taken were particularly made owing to the older age group that was included in the investigation. First, during the pilot testing and planning phase of the experiment, it was determined that peak acceleration experienced during panic braking was approaching and occasionally exceeding 1.0 g. Although humans have some tolerance for accelerative loads perpendicular to the spine, repeated loading is less-tolerated and may lead to uneasiness in some individuals (Creer, Smedal, & Wingrove, 1960). Through a full board review of the research protocol by Virginia Tech’s IRB, it was determined that participants risk encountering an unexpected event that demands hard braking each time they drive. However, repeated exposure to hard-braking events tremendously increases risk of injury. The number of hard-braking events was therefore limited to six. Secondly, subjects had to be in reasonably good health to participate. Potential participants were screened for a multitude of health issues, including pregnancy and previous history of eye or neck/spine surgeries. Despite this screening, participants were told prior to the braking session that they had to be in reasonably good health to continue. This was done as a precaution in case participants had
124

forgotten this information. Thirdly, the inflatable barricade used in this study was chosen as the most prudent tradeoff between replicable situations and experimental control, while ensuring a high degree of participant safety. Participants could safely collide with the barricade at 65 mph, with no damage to the test vehicle. Although the barricade incurred damage, it could be quickly replaced with new components, which was ideal for the anticipated braking maneuvers. It should be noted that strategies, such as the use of a surrogate crash vehicle (such as a towable rear-end mockup of a vehicle) were not employed as their use may have proved distressing for the potentially vulnerable age groups in the study. Also, the use of these types of crash surrogates may have increased the likelihood of drivers performing an avoidance steering maneuver instead of panic braking. Future panic braking studies can benefit from the lessons learned through this research on how to maintain participant safety.
125

APPENDIX A. AUTOMOTIVE MANUFACTURER AND TIER 1 SUPPLIER SURVEY RESPONSES
INTRODUCTION
Although BAS is currently available on an increasing number of vehicles in North America and Europe, the system is largely absent from public awareness. Additionally, information regarding the operation and activation conditions of BAS is lacking in the literature. To help address this lack of information, a brief survey was conducted. Three Original Equipment Manufacturers (OEM) and three Tier-1 suppliers were surveyed regarding their implementation of BAS.
Five companies were able to provide information regarding their BAS. One supplier was not able to provide information regarding their system. Additionally, not every company was able to provide information for every question. The responses from each company, along with a brief qualitative summary of the responses received, are provided.
INTERVIEW FINDINGS
BAS Operational Mechanism
The manufacturers and suppliers interviewed were asked, “Is the brake assist feature electronic or mechanical?” Three companies provided responses.
Table 42. BAS Operational Mechanism Mechanism n
All Electronic 1 All Mechanical 0 Differ by Model 2
No Response 2
An issue revealed by the survey is that BAS vary in their suitability for mass production. Certain configurations are more likely to be incorporated into future product lines compared to others. Survey respondents commonly indicated that their companies were pursuing electronic BAS. It is foreseeable that the need for mechanically based BAS will decrease as ABS and ESC continue to propagate into the market.
Ability to Purposefully Disable BAS
The ability to safely and controllably disable a vehicle’s BAS has significant interest to the research community. The next question asked of the manufacturers and suppliers was, “Can BAS be disabled?” Five companies provided responses. Of the five companies, two manufactured both mechanically- and electrically-controlled BAS.
126

Table 43. Ability to Disable BAS by Operational Mechanism Mechanism Response n Mechanical Yes 0 Mechanical No 2 Electronic Yes 2 Electronic No 1
There is a significant interest in being able to easily deactivate a vehicle’s BAS. OEM supplier communications have indicated that mechanical BAS cannot be disengaged. However, this system type is more common as an option compared to electronic BAS. In contrast, it has been indicated by some OEMs that electronic BAS can be deactivated.
Cues to BAS Activation
A variety of responses were provided when OEMs and suppliers were asked, “How can we tell that BA has engaged?”
Table 44. Cues to BAS Activation Activation Cue n
Brake Force vs. Deceleration 4 Sound 2
Pedal Feeling 2
Most respondents indicated a reliable cue to BAS activation was that brake pedal force applied would no longer be proportional to the deceleration experienced. One manufacturer and one supplier both noted that a sound may be emitted from the BAS modulator and be accompanied by a change in brake pedal feeling. No respondent described purposefully providing any indication of BAS activations. Failures of BAS were described as triggering a warning light for the ABS system, with the associated failure being stored in the ECU.
BAS Actuation Method
From a system interface perspective, the activation pattern of BAS holds experimental interest. OEMs and suppliers were asked, “Is actuation either on/off or is it variable (are there different degrees of brake assist)?”
Table 45. BAS Actuation Style Actuation Style n
On/Off 2 Variable 2
One manufacturer and one supplier indicated that BAS actuation was constant across the activation. One manufacturer indicated that the level of boost provided by a BAS activation would vary with brake pedal input. One supplier indicated that, during driver induced panic-braking events, the base system was designed to provide a constant (maximum) deceleration profile at the beginning of the event and allow modulation later. However, this supplier also
127

indicated that when activated by an on-board safety system (such as collision avoidance systems), the system provider or OEM will typically determine the boost amount. In these cases, the level of boost may be consistent or variable.
BAS Activation Conditions
In order to experimentally examine BAS, the conditions required to activate the system must be able to be recreated. OEMs and suppliers were asked, “Are there certain conditions required to activate BAS (e.g., speed greater than 2 mph)?”
Table 46. Conditions Required for BAS Activation Activation Condition n
Velocity > 15 km/h, Pressure > 40 bar 2 Threshold change with velocity 2
Pedal Force and Rate 1
There are minimum conditions that need to be met before BAS engages. These conditions vary across OEMs. For example, some BAS require the vehicle to be traveling above 15 km/h and the brake pressure to be higher than 40 bar before the boost engages. In addition, activation may vary slightly between vehicle models. However, many respondents reported that the activation conditions vary based on the individual vehicle model, deceleration, or pressure/brake pedal force profiles.
BAS Deactivation Prior to a Complete Stop
In order to determine if any conditions or driver actions would deactivate the BAS prior to the vehicle coming to a complete stop, OEMs and suppliers were asked, “Are there any conditions that will deactivate the system before the vehicle comes to a complete stop? If so, what is the algorithm used?”
Table 47. Conditions Deactivating BAS Following Activation Deactivation Condition n
Driver reduces brake pressure 1 None (Vehicle comes to
complete stop) 1
When asked about the conditions to deactivate the BAS during a stop, two manufacturers provided differing responses. One responded that the BAS acted in a ballistic manner, once activated the BAS would remain active until the vehicle reached a complete stop. The other manufacturer responded that the system would remain active until the driver reduced the brake pedal pressure.
BAS Packet ID Reporting
OEMs and suppliers were asked, “Is status reported on the on-board diagnostic network?” This would allow for BAS status to be read by on-board data collection systems.
128

Table 48. BAS Packet ID Reporting Status BAS Info Reported as
PIDs n
Yes 2 Malfunctions/Failures
Only 2
No 1
The manufacturers surveyed for this project all handled PID-based reporting of BAS status on the vehicle diagnostic network differently. One manufacturer indicated that all BAS information is passed as PIDs. One reported that only disabled status and malfunctions are reported, while the third indicated no BAS information was passed as PIDs. Likewise, the suppliers varied in their responses. One’s system was capable of passing information as a PID, while the other only reported BAS failures.
Packet ID-Based Disabling of BAS
OEMs and manufacturers were asked, “Can BAS be disabled by using network PIDs?”
Table 49. Ability to Disable BAS with PID PID Available to Disable
BAS n
Yes 1 No 4
Two manufacturers and one supplier reported that their BAS equipment cannot be disabled through PIDs. Another supplier noted that their BAS would only be effectively disabled through disconnecting the BAS-related equipment at the brake booster. One manufacturer reported being able to disable BAS through PIDs.
BAS Driver Adaptation
There is a growing interest in driver-adaptive automotive systems. To understand if BAS has the ability to adapt to the driver, OEMs and suppliers were asked, “Does the BAS feature learn driver behavior? If so, can BAS be reset?”
Table 50. BAS Driver Adaptation BAS Adaptive to Driver N
Yes 0 No 4
129

No respondent indicated their BAS would adapt to a driver. Two suppliers indicated their systems would either learn or be calibrated to the vehicle, but would not offer any type of adaptation to vehicle changes or reset abilities.
Target Population for BAS
As a safety feature, BAS promises to assist drivers in making more effective emergency and panic stops. In order to determine if manufacturers and suppliers were orienting their BAS towards specific populations of drivers, they were asked, “What is the target population of this feature?
Table 51. Target Population for BAS Assistance Target Population n
Average Drivers 2 Drivers with Insufficient
Pedal Effort 1
Two suppliers and one manufacturer responded to this question. The two suppliers indicated that BAS was oriented towards the normal (non-expert) driver of a passenger car. The one manufacturer provided a similar response, but elaborated that BAS is designed to assist drivers with situations where insufficient brake pedal pressure is exerted.
SUMMARY
Although a growing number of North American vehicles have or offer BAS, the system remains relatively unpublicized. BAS is a safety feature that has propagated into the automotive market, particularly in Europe. Despite the increase in fielded systems, BAS remains widely unknown in the public. A survey of OEMs provided key insight on BAS technology information that is unavailable in the public domain. This survey of manufacturers and suppliers demonstrates the wide variety of implementations and designs of BAS control systems. Additionally, the variability in responses indicates any BAS investigation must account for a multitude of factors requiring experimental control to avoid potential confounds.
130

APPENDIX B. LIST OF VEHICLES OFFERING BAS
A list of vehicles equipped with BAS was developed to facilitate the selection of the test vehicles. Unlike ABS and brake force distribution, BAS is not a commonly advertised feature of vehicles. This made determining the range of vehicles which have BAS, either available as an option or as standard equipment, difficult. Common, publically available, auto-industry sources and databases were examined in order to form an estimate of which available vehicles were either equipped with or offered BAS. When a vehicle was found to have as standard equipment or offer BAS, an attempt was made to determine the first year of availability. Table 50 lists the results of this effort. Note that the information provided is an estimate, and does not reflect communications with OEMs or distributors.
Table 52. Vehicle offering BAS
Vehicle (Make, Model) Segment Model Year BAS First
Available Offering Acura MDX SUV 2005 Standard
Acura TL Sedan 2004 Standard Acura RL Sedan 2005 Standard Audi A4 Sedan 2002 Standard Audi A6 Sedan 2002 Standard Audi A8 Sedan 2003 Standard
BMW 3-Series Sedan 2002 Standard BMW 5-Series Sedan 2000 Standard BMW 7-Series Sedan 2000 Standard
BMW M3 Convertible/Coupe 2002 Standard BMW M Coupe/M
Roadster Convertible/Coupe 2002 Standard Honda Accord Intermediate Sedan 2006 Optional Infiniti FX35 SUV 2004 Standard Infiniti G35 Sedan 2003 Standard Infiniti Q45 Sedan 2002 Standard
Jaguar S-Type Sedan 2003 Standard Jaguar X-type Sedan 2005 Standard
Jeep Grand Cherokee SUV 2006 Standard Jeep Liberty SUV 2006 Standard
Land Rover LR3 SUV 2005 Standard Land Rover Range Rover SUV 2004 Standard
Lexus ES330 Sedan 2004 Optional Lexus GS Sedan 2000 Standard
Lexus LS430 Sedan 2001 Standard Lincoln Navigator SUV 2004 Standard
Mazda 5 Sedan 2006 Standard
131

Mercedes-Benz C-Class Sedan 1997 Standard Mercedes-Benz E-Class Sedan 1997 Standard Mercedes-Benz R-Class SUV 2006 Standard Mercedes-Benz S-Class Sedan 1997 Standard
Mercedes-Benz SL-Class Convertible/Roadster 1997 Standard Mercury Grand Marquis Sedan 2003 Standard
Mercury Mariner SUV 2005 Standard Mitsubishi Montero SUV 2006 Standard
Nissan 350Z Convertible/Roadster 2003 Standard Nissan Altima 2.5S Intermediate Sedan 2006 Optional
Nissan Maxima Intermediate Sedan 2002 Standard Saab 9-3 Sedan 2003 Standard Saab 9-5 Sedan 2000 Standard
Toyota Camry Intermediate Sedan 2006 Optional Volvo S40 Sedan 2004 Standard Volvo S50 Sedan 2004 Standard Volvo S80 SUV 2004 Standard
Volvo XC-70 SUV 2004 Standard VW Passat Intermediate Sedan 2006 Standard
132

APPENDIX C. TIRE WEAR
The tire depth measurement was collected on all four tires before each participant. The rear tires of the Volvo S80 were changed in October due to sidewall damage that occurred from improper
parking. The Mercedes-Benz R350 tires were never changed.
Figure 54. Mercedes Benz R350 tire wear over the course of the study Figure 54 illustrates the Mercedes-Benz R350 tire wear over the course of the study. Figure 55 illustrates the Volvo S80 tire wear over the course of the study. Note that variations in the measurements are due to a lack of precision in the measurement device, which was only accurate to approximately 2/32nd of an inch.
Figure 54. Mercedes Benz R350 tire wear over the course of the study
133

Figure 55. Volvo S80 tire wear over the course of the study
134

APPENDIX D. MANUFACTURER PROVIDED DESCRIPTION OF THE HEITZ BRAKE CONTROLLER
INTENT
The brake actuator is intended to aid in automation of vehicle road holding testing. Its control system provides closed-loop control of actuation rate and maximum level, for pedal travel, application force, master cylinder pressure, or vehicle deceleration. In stand-alone operation, selected level and application rate are set with 0-99 pushwheel digital potentiometers. Under external control the actuator will follow any voltage command within its force/travel limits. START BRAKING is normally activated by a radio switch attached to the vehicle steering wheel. The vehicle can be driven normally when the actuator is not activated.
MODES OF OPERATION
1. Stand alone brake control. 2. Stand alone in conjunction with throttle lock for initial conditions. 3. Brake/throttle program control by a program in the Trimode Steering Machine. 4. Brake/throttle control by an on-board Notebook computer through a supplied USB link. 5. Remote brake/throttle control by a telemetry system.
COMPONENTS
The system consists of four components: Reaction Frame; Actuator; Battery/Electronics Box; and Actuation switch. There are three actuator options: A, B, and C, which differ in servo motor and actuator lead screw to provide desired force/velocity specifications.
The Reaction Frame is a simple structure made with stainless steel tubing. It sits on the driver’s seat and extends downward in front of the seat. A vertical tube is hinged at the lower front cross-tube and impinges on the upper front cross-tube. The Actuator attaches between this vertical tube and the vehicle brake pedal. The brake pedal/actuator is free to move forward in “normal” manual braking. In programmed braking the actuator extends to create a force between the brake pedal and the upper from cross-tube, with the “line of action” approximately from the driver’s knee. The reaction is transferred to the vehicle seat frame, which is retained by two straps running from the upper front cross-tube under the vehicle seat to the rear cross-tube. For the driver comfort, the seat portion of the Frame is fitted with an integral cushion.
The Actuator is a motor-driven linear actuator, with integral position potentiometer and load cell. The actuator also has a switch for enabling the servo amplifier and a potentiometer for setting the initial position at any point in the 8 inch actuator travel to adjust free play at the pedal. The Batter/Electronics Box contains three 12 volt batteries with DC-DC converters to maintain charge and provide galvanic isolation from the vehicle 12 volt system. A circular connector is provided for charging current (CAR12V); D-Sub connectors for actuator and External commands; and signal in/out BNC’s for “start”, pedal force, pedal travel and an external decal transducer signal.
135

The on/off Actuation Switch is similar to the remote doorlock “keychain” switches used in many modern cars. It is mounted on a “wristwatch band” for attachment to the vehicle steering wheel in a location accessible to the driver’s thumb. The driver’s hand can remain on the steering wheel throughout a braking test.
There are three modes of standalone operation: 1. Press ON, press OFF. 2. MOMENTARY: press either switch ON and held until the switch is released. 3. ON-NOT MOMENTARY. Throttle lock ON when the ON switch is pressed and
held until it is released. Upon switch release the throttle is released and the brake is applied, and the brake is held until switch OFF. The purpose is to establish a stable initial condition for several seconds before braking.
MECHANIZATION
In “normal” operation, the driver selects application rate and maximum level for the test variable. The frequency output of a voltage-controlled oscillator is set by the rate command digipot. This frequency signal is counted up and applied to a D/A converter to create a ramp signal. At the selected maximum level the counter is inhibited, holding that command. The errors between the command and each feedback signal are amplified and conditioned, and the selected signal (travel force, or decel) is applied to the servo amplifier to drive the servo motor.
Signals for “trigger”, force, actuator position and “decel” are brought out to galvanically-isolated BNC’s for monitoring or recording. The BNC signals are also available at the external control D-Sub connector. At this connector voltages are also provided for excitation and input signal for the supplied accelerometer.
EXTERNAL CONNECTOR
The system can also follow external commands from the Trimode Machine, or from a notebook computer through a supplied USB link. In these cases the external command signals replace the internal ramp. The external connector includes the resulting travel, force, pressure or decel, and radio switch data signals from the brake system, for recording in the computer. All signals in and out of the USB link are galvanically isolated, to avoid ground loops.
USB MODULE
The data acquisition module supplied for the USB link is a Data Translation model DT981210V. It has analog inputs and outputs (+ 10 volts @ 12 bits), and 5 volt digital I/O, all using computer ground lines isolated from Trimode/Brake system grounding. The TTL digital outputs can source 2 ma and sink 10 ma.
CAPABILITIES AND SCALING
Table 53 shows the capabilities and scaling of the Heitz Brake Controller.
136

Table 53. Capabilities and Scaling Capabilities Scaling
Maximum travel, in (mm) 8 (200) Maximum open-loop force, lb/N 280 (1250)
Scaled force (10 volts), lb/N 200 (1000) Maximum no-load travel rate, in/sec,
mm/sec 34 (860) Maximum service-load travel rate, in/sec 25(635)
Travel scaling (10 volts), In 5.0(200) Scaled travel rate (10 volts), in/sec,
mm/sec 25(600)
NOTES: Actual scaling is 0-99, or 9.9 volts full scale. Max scaled servo travel is 4.95 in from zero position, up to 8 inch max total. Travel zero trim position is 0-6 in. Travel rate with force servo is max or that required for force rate.
Table 54 shows the step input force response with output blocked.
Table 54. Step Input Force Response with Output Blocked Step Input Force with Output Blocked Response
Rice time to 90%, seconds 0.01 Time to peak, seconds 0.02
Overshoot, percent 23 Setting time to 2 percent, seconds 0.035
Overshoot in ramp response, percent 0
INSTALLED WEIGHTS
Table 55 shows each component and weight of the Heitz Brake Controller.
Table 55. Weight of the Components Component Weight
Actuator 4.3 lbs. / 1.95 kg. Battery/Electronics Box 12 lbs. / 5.5 kg
Seat frame 9 lbs. / 4 kg Radio Switch .05 lbs. / .02 kg
USB Link Module .3 lbs. / .14 kg Total 25.7 lbs. / 11.6 kg
137

POWER REQUIREMENT
Power is 10-18 volts from the vehicle battery. Current requirement is nominally 4 amps to operate the system and maintain battery charge. With brake applied the 12-volt current drops to 1 amp, because the battery-charging DC/DC converters are shut off. Immediately after brakes are released the current momentarily jumps from about 15 amps to restore surface charge to the batteries. The current then gradually drops back to 4 amps in about 10 seconds. The system is protected against input voltage reversal and from high voltage surges resulting from “alternator load dump” (removing a vehicle battery terminal with the engine running).
SAFETY CONSIDERATION
It is important for vehicle safety that the driver’s hands remain on the steering wheel and his eyes remain on the road. For this reason the ATI brake actuator system is operated with a steering wheel-mounted radio switch.
138

APPENDIX E. THE VIRGINIA SMART ROAD
The Virginia Smart Road is a controlled test bed designed for ITS, human factors, and safety research. The research support infrastructure of the facility makes it an ideal location for safety and human factors evaluation. The road is built to Virginia Department of Transportation and Federal Highway Administration standards. The Smart Road has a large number of features and capabilities and is highly adaptable.
WEATHER-MAKING CAPABILITY
The facility is capable of producing snow, fog-like mist, or rain over a 0.5-mile stretch of roadway under suitable temperature and wind conditions. At maximum output, the system can produce 10 cm (4 in) of snow per hour for 1 hour (Figure 56). A 1900 kilolitre (500,000-gallon) water tank feeds 76 weather towers and allows for multiple research events. The all-weather testing towers’ output is automatically controlled from VTTI’s control room and can produce snow, rain, fog, or mist at varying intensities. Recently, VTTI has configured portable all-weather testing towers to further enhance the facility’s flexibility for research customization. In addition, water can be sprayed by the towers onto freezing pavement to create icy conditions.
Figure 56. Fog, rain, and snow equipment installed on the Smart Road.
VARIABLE LIGHTING TEST BED
A highway lighting test bed is also incorporated within the Smart Road. The system consists of 36 overhead light poles that span a 1.1-mile section of the road. The pole spacing pattern is: 4020-20-40-40-20-20-40-40-20-20 m. This spacing, combined with the wiring of the poles on three separate circuits, allows for evaluation of lighting systems with spacings of 40, 60, 80 or 120 m. The poles incorporate a modified design to allow for easy height adjustment of the bracket arm. In addition to evaluating spacing and bracket height, various luminaires are also available, including metal halide and high-pressure sodium. Additional poles are mounted on portable bases that allow the simulation of other environments as needed (e.g., crosswalks).
The combination of weather-making capabilities and the variable lighting test bed can simulate over 90 percent of the highway lighting in the United States and allows for a variety of different visibility conditions to be created for testing purposes Figure 57).
139

Figure 57. All-weather testing equipment with experimental lighting test bed installed on the Smart Road.
PAVEMENT MARKINGS
The road includes an additional visibility testing section. This section has been used with a variety of pavement markings for visibility testing. Periodically, as specific studies require it, the markers are reconfigured. Markers on the road may also be reconfigured or repainted as needed. Past research on pavement markings has included UV-reflective markings, prototype reflective mixtures for markings, three-dimensional markings, and installation quality effects on marking visibility.
ON-SITE DATA ACQUISITION AND ROAD WEATHER INFORMATION SYSTEMS
The roadway has an underground conduit network with an access port (bunker) every 60 m. This network houses a fiber-optic data network and interfaces with several on-site DASs and road feature controls. The facility has a complement of road weather information system sensors connected to the data network. In addition, the road is outfitted in its entirety with a wireless network that ties into the research building’s data network. This network may be used for data transfer between the vehicle, the research building, and infrastructure within the road Figure 58).
140

Figure 58. Bunker with DAS and weather station installed on the Smart Road.
DIFFERENTIAL GPS SYSTEM
Differential GPS corrections are broadcast from the research building to the road. Experimental vehicles are equipped with portable GPS units that, combined with the differential GPS corrections, allow for extremely accurate (on the order of ±1.5 cm) on-road vehicle positioning. VTTI has a number of portable differential GPS units available and thus is able to quickly outfit any vehicle for GPS positioning to enhance studies.
ROAD ACCESS AND SURVEILLANCE
The Smart Road is closed to live traffic, which allows for a variety of different scenarios to be created for testing purposes in relative safety. During past research, for example, experimenters have placed objects of differing size, contrast, and reflectivity on the road to determine the driver’s ability to detect them under a wide range of conditions. The lack of live traffic, however, does not prevent the simulation of crash scenarios. Some research projects have used vehicle mockups and appropriately timed distractions to generate surprise conditions. Other projects have employed trained experimenters that act as a pretend maintenance crew. This last method creates the illusion of possible traffic conflicts for participants without any decrease in their safety.
In order to keep the road free of live traffic, vehicle access to the road is restricted with a gate that is controlled from the research building (Figure 59). In addition, the road is outfitted with a video surveillance system that is monitored from the research building 24 hours a day, 7 days per week. This video surveillance system also allows for visual confirmation of vehicle and personnel locations on the road during ongoing studies.
141

Figure 59. Gate that restricts access to the Smart Road.
RESEARCH BUILDING AT THE SMART ROAD
The main offices and laboratories of the Virginia Tech Transportation Institute are located within two research buildings located adjacent to the Smart Road. The first research building has three floors encompassing over 2700 square meters (29,000 square feet) of office, garage, and specialized laboratory space. In addition to the control room and the garage, discussed in the following paragraphs, this research building contains office space for research and administrative staff, conference facilities, multiple laboratories, and work areas for students. The second building is a recently constructed 2100 square meter (23,000-square-foot) building that is accompanied by a warehouse with four additional garage bays.
CONTROL ROOM
The control room serves as the core control and monitoring center for the Smart Road (Figure 60). Vehicular access to the Smart Road is managed at all times by a dispatcher who has visual contact with all sections of the road through direct line-of-sight and through a set of surveillance cameras. This dispatcher also activates, as required, controls for lighting and weather. All research efforts using the Smart Road are coordinated and monitored through the control room with a primary focus on safety and security. To aid the dispatcher in monitoring all Smart Road operations, the control room houses a 3 m (10 ft) by 2.3 m (7.5 ft) video wall, a projection screen, and up to 12 monitors.
142

Figure 60. Smart Road control room and dispatcher monitoring research.
GARAGES
Two garage bays are present in the main building along with machine and electronics shops. The warehouse contains four additional garage bays. All bays have oversized outside doors tall enough to accommodate a semi-tractor. In addition, all of the garages can be isolated in case they need to be used for confidential research, as contractor-dedicated facilities, or as separate tool and work rooms. These six garages also lack windows to ensure privacy when it is needed by the sponsor.
LABORATORIES
The building has space allocated for multiple laboratories, including driver interface development, eyeglance data reduction, lighting research, accident analysis, accident database analysis, pavement research, and traffic simulation. Rooms are also available to host focus groups.
VEHICLE FLEET
VTTI has a variety of vehicles that are used for vehicle research (). These vehicles are outfitted with basic instrumentation packages that can be quickly tailored to the specifications of a particular project. The vehicles are capable of recording a variety of data in real time from a suite of sensors and cameras that are inconspicuously mounted. The vehicles include:
2002 Ford Econoline – Mobile Traffic Laboratory. 2002 Cadillac Escalade.
143

2002 Cadillac Seville. 2002 Chevrolet Cavalier. 2001 Saab 9-5. 2000 Chevrolet Impala. 2000 Ford Explorer, including attachments to test alternate headlamp configurations. 1999 Ford Contour. 1999 Ford Crown Victoria. 1999 Ford Explorer, including attachments to test alternate headlamp configurations. 1997 Ford Taurus. 1995 Oldsmobile Aurora. 1997 Volvo, VN series, class 8 tractor, along with a 14.63-m (48-ft) trailer. 1994 Peterbilt model 379 with sleeper.
All of these vehicles have been used in a number of safety and human factors experiments. Experimental areas that have been studied with them include in-vehicle displays, driver distraction, collision warning and avoidance, fatigue assessment, navigation systems, and use of in-vehicle devices. In addition to these vehicles, VTTI owns a small number of experimental support vehicles, such as pickup trucks and passenger vans.
Figure 61. VTTI’s vehicle fleet on the Smart Road bridge.
VEHICLE INSTRUMENTATION
Over the last 15 years and most recently as part of its efforts during the 100-Car Naturalistic Driving study, VTTI has designed and developed a self-contained vehicle DAS. The system contains a combination of commercial off-the-shelf and in-house components.
144

The core of the DAS is a Pentium-based PC104 computer. The computer runs custom data acquisition software and communicates with a distributed data acquisition network. Each node on the network contains an independently programmable micro-controller capable of controlling or measuring a moderate number of signals. This system configuration maximizes flexibility while minimizing the physical size of the system. The system is capable of managing up to 120 nodes, but only 10 are used in the current configuration.
145

APPENDIX F. LOAD CELL
The ELPM load cell is a compact package able to fit into many applications where others cannot. The low noise Wheatstone bridge consists of metal foil strain gages which provide 2 mV/V of full scale output. When compact design and superior stability are required, the ELPM load cell is the sensor for your application. The ELPM is provided with either SAE or metric threads for tension and compression applications. The ELPM incorporates flexible diaphragms paralleling the primary measuring flexure to provide maximum immunity to the effects of off-axis loads. Designed specifically to provide high zero stability, the ELPM is rated for a cycle life expectancy of typically 1 X 10⁶ 0-FS cycles of zero to full rated load. The ELPM is ideal for applications requiring superior longer-term stability for loads measured over a long period of time. The ELPM can be configured with a variety of different options to fine-tune the instrument to your application: select from several standard compensated temperature ranges, input voltages, lead lengths or specify entirely unique combinations of these options. (Measurement Specialties, Inc) Figure 62 is a picture of the load cell that was used in BAS.
Figure 62. Load Cell used in the study
146

APPENDIX G. PARTICIPANT SCREENING FORM
Telephone Script
General Note: There are up to three separate contacts which will be made with the participant prior to their participation in the experiment. The initial contact, which will serve as screening for eligibility, a second contact where any questions regarding the informed consent will be answered, and (time permitting) a third contact which serves as a day-before reminder call for the participant. All three calls are described in their respective sections, below.
Initial Contact Script Note to Researcher: Initial contact between participants and researchers may take place over the phone. If this is the case, read the following Introductory Statement, followed by the screening questions. Regardless of how contact is made, this information must be administered verbally before a decision is made regarding eligibility for this study.
Introductory Statement: After prospective participant calls or you call them, use the following script as a guideline in the screening interview.
Hello. My name is _____ and I am a researcher at the Virginia Tech Transportation Institute in Blacksburg, VA. I am recruiting participants for a new driving study being conducted here at the Smart Road. (IF CALLING FROM DATABASE) I obtained your contact information from the VTTI internal participant database. If this is something you would like to participate in, would you like me to describe the study?
If No: Ok, thank you for your time.
If Yes: The purpose of the study is to evaluate a new vehicle technology. If you choose to participate, you will drive a test vehicle on the Smart Road while sensing vibrations in the driver seat. The vibrations are a part of a new communication system. I would like you to know that the test vehicle is equipped with cameras that allow us to collect data. The cameras, however, are very small and are placed out of the way.
This study has three parts to it. First, we would perform a simple vision and hearing test. Providing these are passed, we would move on to the second part which involves you driving the test vehicle around a closed-course test track. The third part involves filling out some questionnaires. The study takes approximately 2 to 2.5 hours at the Transportation Institute to complete. Participants are paid $20/hr. Please note that for tax recording purposes, the fiscal and accounting services office at Virginia Tech (also known as the Controller’s Office) requires that all participants provide their social security number to receive payment for participation in our studies. Does this study sound like something you would be interested in doing, and if so, are you willing to provide your social security number when you come in for the study?
147

If they indicated that they are not interested: Thank you for your time.
If they indicated that they are interested: That’s great. I would like to ask you some questions to see if you are eligible to participate.
1. Do you have a valid driver’s license? Criterion: has valid driver’s license
2. When does your license expire? Criterion: expires after December, 2008
3. How old are you? Criterion: age between 18-25, or 65 years and older. Note age in Participant Database.
4. Have you had any moving violations in the past 3 years? If so, please explain each case. Criterion: no more than two moving violations in the past 3 years
5. Do you have normal or corrected to normal vision? Criterion: normal or corrected to normal vision
6. Do you wear glasses when driving? A. If the answer is “Yes with glasses,” ask: If you wear glasses, do you wear transition
lenses (lenses tone changes depending on light)? a. If the answer is “Yes,” ask: If you wear transition lenses, do
you have a pair of glasses with regular lenses and can you still drive?
i. If the answer is “Yes,” ask: Would you bring the glasses with regular lenses if you decide to participate in the study? Criterion: must have non-Transitions lenses available for study
7. Do you have normal or corrected to normal hearing? Criterion: normal or corrected to normal hearing
8. Are you able to drive an automatic transmission vehicle without assistive devices or special equipment?
Criterion: able to drive automatic transmission vehicle without accommodation
9. (Females only) Are you currently pregnant? Criterion: not pregnant
10. Have you been involved in any accidents within the past 3 years? If so, please explain. Criterion: no at-fault accidents in the past 3 years.
148

11. Do you have a history of any of the following? If yes, please explain. A. Neck/Spine Pain or Injury B. Heart/Cardiovascular Condition C. Stroke D. Brain tumor E. Head injury F. Motion sickness
i. Criterion for A-F: no lingering effects
G. Respiratory disorders H. Dizziness, vertigo, or other balance problems I. Inner ear problems J. Migraine, tension headaches
i. Criterion for G-J: no recent/current occurrence of the problem
K. Epileptic seizures i. Criterion for K: no seizures within the last 12 months.
L. Diabetes i. Criterion for L: not insulin dependent
12. Are you currently taking any medications on a regular basis? If yes, please list them. Criterion: no medications interfering with driving, alert level, or motor functions
13. Are you eligible for employment in the United States? Criterion: eligible for US employment
14. Have you had any eye injuries or surgeries (including, but not limited to, LASIK, Radial Keratotomy, and cataract surgery)
If “yes” then read the following statement: Participants who have had previous eye injuries and/or surgeries are at an increased risk of further eye injury by participating in this study where risks, although minimal, include the possibility of collision.
15. Do you own a pair of closed-toe shoes, such as tennis shoes, which you could wear to the study?
If “no” then read the following statement: Some participants have experienced difficulties in driving vehicles while wearing open-toed shoes such as sandals and flip-flops. These shoes can become trapped on pedals, preventing proper acceleration and braking. Because you will be experiencing this vehicle for the first time, we ask that all participants wear closed-toe shoes in order to ensure they are able to properly use the pedals.
149

---------------------------------------------------------------------------------------------------------------
------------------------------------------------------------------------------------------------------------------
Note to Researcher: If a response to any of the above questions does not meet its criterion, read the following:
Unfortunately you are not eligible for this particular study. Thank you for your time.
If all the responses to the above questions meet the criteria, continue to scheduling the participant.
Criteria For Participation: Must hold a valid drivers license. 1. Must be between 18-25 or 65+ years old. 2. Must not have more than two moving violations in the past three years. 3. Must have normal (or corrected to normal) hearing and vision. 4. Must be able to drive an automatic transmission vehicle without assistive devices. 5. Must not be pregnant. 6. Must not have caused an injurious accident in the past three years. 7. Cannot have lingering effects of heart condition, brain damage from stroke, tumor, head
injury, recent concussion, or infection. Cannot have had epileptic seizures within 12 months, current respiratory disorders, motion sickness, inner ear problems, dizziness, vertigo, balance problems, diabetes for which insulin is required, chronic migraine or tension headaches.
8. Cannot currently be taking any substances that may interfere with driving ability, cause drowsiness or impair motor abilities.
9. Must be eligible for employment in the U.S. and willing to provide their social security number.
10. Cannot have participated in a previous braking study at VTTI. 11. If the person has normally drives while wearing photochromic lensed eyeglasses (e.g.,
Transitions lenses), the person must be able to bring appropriate, non-photochromic eyeglasses to wear during the study.
12. Participant must have closed-toed shoes (such as tennis shoes) which they agree to wear during the study.
Providing participant meets the above criteria, the researcher will ask to send the informed consent form to the potential participant.
Ok, I would like to send you an informed consent form (ICF) that explains the study, its risks, and potential benefits. I can send this to you through e-mail or a fax, you can receive a copy by coming by the VTTI offices, or I can read the form to you over the phone. Will any of these methods work for you?
If Yes: Great, how would you like to receive the Informed Consent Form? (Record contact method in BA Master List.) We would like to talk to you again after you have read the Informed
150

Consent form to answer any questions you may have. When would be a good time to contact you? (Record contact time in BA Master List.) Great! I will call you back at (day and time) If No: That’s alright. In order to participate on this study you need to be able to read the ICF in advance. We certainly thank you for your time today.
Also, would you be interested in being contacted to participant in future studies at VTTI? If response is yes, and participant is not on participant database already, add to list. If response is no, then highlight entry in red within participant database.
151

Informed Consent Form Follow-Up Call
Hello. My name is _____ and I am a researcher at the Virginia Tech Transportation Institute in Blacksburg, VA. I am calling to ensure you received the Informed Consent form we sent to you earlier. Did you receive the form?
If the response is yes: Good. Did you have any questions regarding the Informed Consent statement?
If the response is yes: Answer questions. If the response is no: continue to scheduling.
If the response is no: arrange for retransmitting of the ICF. recruiting participants for a new driving study being conducted here at the Smart Road. I obtained your contact information from the VTTI internal participant database. If this is something you would like to participate in, would you like me to describe the study?
I would like to set up a time when you can come to VTTI and participate in this study. Would it be possible for you to come in on ____________ (day of week) at____:____ hrs (time)?
If the response is yes: go ahead and schedule the participant and update the ‘scheduled participant list.xls’ excel sheet with his/her information. If the response is no, ask the following to the participant:
What day and time would be convenient for you? If requested day and time is available then schedule the participant and update the ‘scheduled participant list.xls’ excel sheet with his/her information. If requested day and time is not available then suggest closer day and time slots and see if that will work for the participant.
Once the researcher has scheduled the participant and updated his/her information in the “scheduled participant list.xls” excel sheet then repeat the schedule day and time back to the participant.
Great! I have you scheduled for ___________ (day) at ___:____ hrs.
I will be calling you the day before to remind you of your schedule. If you need to cancel or reschedule, please call me at at 540-___________.
Here are the directions to the Institute. I can also email them to you if you wish. From I-81: 1. Take exit 118B onto US-460 W towards Christiansburg. 2. Continue on US-460 W for approximately 10 miles. 3. Take exit 5AB toward US-460-BR W/US-460-BR E. The sign for this exit will read “Smart Road Center/Control Center. 4. Stay to your right on the exit ramp until you come to a stop sign at Industrial Park Drive. 5. Turn right onto Industrial Park Dr. 6. Take an immediate right onto Transportation Research Dr.
152

7. Turn left onto Transportation Research Plaza. 8. Drive up to the building
When you come to institute you may park in any open space available and walk to the new building, which is only one level tall. On the front door you will see a flyer reading “seat study here”. You may enter the first door and wait for the experimenter to open the second door for you. The experimenter will be there to greet you a few minutes before your scheduled time. If you do not see anybody, please wait and an experimenter will be with your shortly.
We ask that all subjects refrain from drinking alcohol and taking any substances that will impair their ability to drive prior to participating in our study.
Please bring your driving license, driving glasses for the study and remember to wear closed-toe shoes such as tennis shoes. Do you have any questions that I can answer for you? (Answer the questions if any).
Great then I’ll see you on _____________ (day) at ____:____ hrs for the study. Thanks. Have a good day.
Day Before Reminder Call
Script for reminder calls (leaving a message):
Hello, this message is for ________ (participant’s name). This is ________ (your name) calling from the Virginia Tech Transportation Institute. I am calling to remind you that you are scheduled to participate in our study tomorrow at _____ (am/pm). Please remember to wear closed toe shoes, bring your driver’s license (IF APPLICIABLE: and bring your non-Transitions lens glasses). If you need to cancel or reschedule, please call me back at 540-231-_____. Thank you.
Script for reminder calls (participant answers):
Hi, may I please speak to _________ (participant’s name)?
Hi, this is __________ (your name) calling from the Virginia Tech Transportation Institute. I am calling to remind you that you are scheduled to participate in our study tomorrow at _____ (am/pm).
If participant must cancel, ask if they would like to reschedule and try to find an alternate date/time that works for them.
If participant acknowledges their scheduled appointment:
153

Ok, great! We will see you tomorrow at _______ (am/pm). Please remember to wear closed toe shoes, bring your driver’s license (IF APPLICIABLE: and bring your non-Transitions lens glasses). Have a good night.
154

APPENDIX H. STATEMENT OF INFORMED CONSENT
VIRGINIA POLYTECHNIC INSTITUTE AND STATE UNIVERSITY Informed Consent for Participants of Investigative Projects
Title of Project: Evaluation of vehicle technologies
Investigators: Myra Blanco, Richard Hanowski, Greg Fitch, Justin Morgan, Jeanne Rice, Amy Wharton, Rory Brannan, Ashwin Zalte, & Andrea Birget
I. The Purpose of this Research/Project
The results of this study will contribute to our understanding of, and aid in the design of, vehicle technologies. Testing completed today will aid in the design of a vibrating driver seat designed to direct drivers’ attention. This understanding will provide improvements in system design and usability.
II. Procedures During the course of this experiment you will be asked to perform the following tasks:
1) Read this Informed Consent Form and sign it if you agree to participate. 2) Show your valid driver’s license. 3) Complete a vision test. 4) Complete a hearing test. 5) Drive an instrumented vehicle on the Smart Road at 45 mph. An experimenter will sit in the
back right seat of the vehicle. A video and audio recording will be made for this condition to allow for later analysis of your eye movements.
It is important for you to understand that we are not evaluating you or your performance in any way. You are helping us evaluate new technology. Any tasks you perform, or opinions you have will only help us do a better job of designing the systems. Therefore, we ask that you perform to the best of your abilities. The information and feedback that you provide is very important to this project. The experiment will last about 2 to 2 ½ hours.
III. Risks
There are risks or discomforts to which you may be exposed in volunteering for this research. They include the following:
1) The risk of an accident normally associated with driving an unfamiliar vehicle at 45 mph. 2) Possible fatigue due to the length of the experiment. 3) The additional risk of an accident that might occur while viewing any displays. 4) While you are driving the vehicle, cameras will videotape your face and eye movements.
Due to this fact, we ask that you not wear sunglasses. If this, at any time, impairs your ability to drive the vehicle safely, you are instructed to notify the experimenter.
155

5) Participants who have had previous eye injuries and/or surgeries are at an increased risk of further eye injury by participating in this study where risks, although minimal, include the possibility of collision and airbag deployment.
6) Participants who have had previous neck/spine injuries and/or surgeries are at an increased risk of further neck/spine injury by participating in this study where risks, although minimal, include the possibility of whiplash.
7) Some studies at VTTI involve an unanticipated event. You may or may not encounter such an event during this study. Please be aware that equipment failure, changes in the test track, stray or wild animals entering the road, and weather changes may require you to respond accordingly. The appropriate response may or may not involve rapid deceleration.
The following precautions will be taken to ensure minimal risk to you: 1) You may take breaks or decide not to participate at any time. 2) An experimenter will be present in the back right seat of the vehicle. However, as long as
you drive the research vehicle, it remains your responsibility to drive in a safe and legal manner.
3) The vehicle is equipped with a driver's side and passenger's side airbag supplemental restraint system, fire extinguisher and first-aid kit. The experimenter has a cell phone.
4) All data collection equipment is mounted such that, to the greatest extent possible, it does not pose a hazard to you in any foreseeable case.
5) All testing will be performed on dry test track conditions during daylight hours. 6) You are required to wear the seat and lap belt restraint system while in the car. 7) The experimenter will have control of the vehicle's brakes via an auxiliary hand brake in the
rear of the vehicle. 8) In the event of a medical emergency, or at your request, VTTI staff will arrange medical
transportation to a nearby hospital emergency room. The cost of this transportation would be covered by whichever insurance policy covers the incident causing the medical emergency (see examples in the next section).
9) If you are pregnant, you are not allowed to participate. 10) You do not have any medical condition that would put you at a greater risk, including but not
restricted to neck/spine injury, epilepsy, balance disorders, and lingering effects of head injuries and stroke.
VTTI does not own this vehicle. The owner of this vehicle maintains insurance, which is compliant with all states of operation, to cover its liabilities. In the event of an accident or injury in the automobile, the automobile liability coverage for property damage and personal injury is provided by the vehicle owner. This coverage (unless the other party was at fault, which would mean all expense would go to the insurer of the other party’s vehicle) would apply in case of an accident for all volunteers and would cover medical expenses up to the policy limit. Participants in a study are considered volunteers, regardless of whether they receive payment for their participation; under Commonwealth of Virginia law, worker's compensation does not apply to volunteers; therefore, if not in the automobile, the participants are responsible for their own medical insurance for bodily injury. Appropriate health insurance is strongly recommended to cover these types of expenses. For example, if you were injured outside of this automobile during the project, the cost of transportation to the hospital emergency room would be covered by your insurance.
156

IV. Benefits of this Project
While there are no direct benefits to you from this research, you may find the experiment interesting. No promise or guarantee of benefits is made to encourage you to participate. Participation in this study may contribute to the improvement of in-vehicle systems.
V. Extent of Anonymity and Confidentiality
The data gathered in this experiment will be treated with confidentiality. Shortly after participation, your name will be separated from your data. A coding scheme will be employed to identify the data by participant number only (e.g., Participant No. 1). At no time will the researchers release data identifiable to an individual to anyone other than VTTI staff working on the project without your written consent. VTTI will not turn over the digital video of your image to the sponsor without your permission. It is possible that the Institutional Review Board (IRB) may view this study’s collected data for auditing purposes. The IRB is responsible for the oversight of the protection of human subjects involved in research.
VI. Compensation
You will be paid $20.00 per hour for participating. You will be paid at the end of this study in cash. If you choose to withdraw before completing all scheduled experimental tasks, you will be compensated for the portion of time of the study for which you participated. If these payments are in excess of $600 dollars in any one calendar year, then by law, Virginia Tech is required to file Form 1099 with the IRS. For any amount less than $600, it is up to you as the participant to report any additional income as Virginia Tech will not file Form 1099 with the IRS.
VII. Freedom to Withdraw
As a participant in this research, you are free to withdraw at any time without penalty. If you choose to withdraw, you will be compensated for the portion of time of the study for which you participated. Furthermore, you are free not to answer any question or respond to experimental situations without penalty. If you choose to withdraw while you are driving on the test route, please inform the experimenter of this decision and he/she will provide you with transportation back to the building.
VIII. Approval of Research
Before data can be collected, the research must be approved, as required, by the Institutional Review Board for Research Involving Human Subjects at Virginia Polytechnic Institute and State University and by the Virginia Tech Transportation Institute. You should know that this approval has been obtained. This form is valid for the period listed at the bottom of the page.
157

IX. Subject’s Responsibilities
If you voluntarily agree to participate in this study, you will have the following responsibilities:
1. To follow the experimental procedures as well as you can. 2. To inform the experimenter if you have difficulties of any type. 3. To wear your seat and lap belt. 4. To abstain from any substances that will impair your ability to drive. 5. To obey traffic regulations and maintain safe operation of the vehicle at all times. 6. To treat the driving task as the primary task and perform other tasks only when it is safe
to do so.
Participant’s Acknowledgments
Check one of the following:
I have not had an eye injury/surgery (including, but not limited to, LASIK, Radial Keratotomy, and cataract surgery.)
I have had an eye injury/surgery and I have been informed of the possible risks to participants who have had eye surgery. I choose to accept this possible risk to participate in this study.
Please confirm the statement below by checking the box:
I have not had a neck/spine injury/surgery.
158

Consent to Use Video/Audio Data for Research Reporting Purposes
Digital video cameras will be used to record driving behavior that represents the way people drive. These digital video files could be used to clarify the experimental methods used and to report findings at technical conferences and for other presentations. We are asking you for your permission to show portions of videotape displaying your image when useful for research or research reporting purposes (e.g., report presentations to our sponsor, as well as at technical conferences). With your permission, we would also like to give the video, audio, and vehicle data to our sponsor. The purpose of the box below is to obtain your permission to do so. If you agree, please make a check mark in the box that best represents your opinion. If you do not agree, you will still be able to participate in this study, but your data will not be used for demonstration or presentation purposes, and will not be given to the sponsor.
Check one of the following:
Use of Video Data at Technical Presentations
VTTI has my permission to show the digital video including my image for research or research reporting purposes (such as presentations). I understand that VTTI will only use the videotape data for these purposes.
VTTI does not have my permission to show the digital video including my image for research or research reporting purposes. I understand that VTTI will maintain possession of the data for research purposes.
Submission of Video Data to Project Sponsor
VTTI has my permission to give the digital video data including my image to its sponsor.
VTTI does not have my permission to give the digital video data including my image to its sponsor. I understand that VTTI will maintain possession of the data for research purposes.
159

X. Participant’s Permission
I have read and understood the Informed Consent and conditions of this project. I have had all my questions answered. I hereby acknowledge the above and give my voluntary consent for participation in this project. If I participate, I may withdraw at any time without penalty. I agree to abide by the rules of this project.
Participant’s Name (Print) Signature Date
Experimenter’s Name (Print) Signature Date
Should I have any questions about this research or its conduct, I may contact:
Myra Blanco 231-1500 Greg Fitch 231-1500 Justin Morgan 231-1500 David Moore (Institutional Review Board Chair) 231-4991
160

APPENDIX I. VIRGINIA TECH IRB APPROVAL
This study received full IRB approval on August 11, 2008.
161

APPENDIX J. PRE-PARTICIPATION SCREENING
VISUAL ACUITY TEST PROTOCOL AND SCRIPT
Protocol:
1. The participant can wear glasses or contact lenses to meet these criteria but not transition lenses.
2. Attach a Snellen eye chart to a wall in a well lit area that is not too bright. The center of the chart should be positioned at approximately eye-level of the participant (see Figure 63). Use a measuring tape to set this up. Tests can be given in any room as long as: (i) there is enough distance to administer the test, (ii) the lighting is consistent for every participant, and (iii) there is no glare on the vision chart that could prevent the participant from accurately viewing the chart.
3. Have the participant stand directly facing the chart with his/her toes on a tape line marked on the floor twenty (20) feet from the wall (see Figure 63).
Figure 63. Visual Acuity Chart Positioning
4. Following the script for the vision test, instruct the participant to look at the wall and read aloud the smallest line that he/she can see.
5. If the participant gets every letter on that line correct, have him/her read the next line down in the same manner. Continue this process until the participant can no longer read an entire line correctly. Record the visual acuity of the last completed line.
162

6. If the participant did not get every letter correct in the first line read, have him/her read the line above in the same manner. Repeat as necessary until a line is read correctly. Record the visual acuity of the first completed line.
Script for Visual Acuity Test:
Next we are going to be performing an informal vision test. You should wear your corrective glasses or contact lenses if prescribed. Please stand with your toes on the tape line that you see on the floor, and face the eye chart ahead. Keeping both eyes open, please read aloud the smallest line that you can see.
If the line is read successfully, read:
Please read the line below that.
Repeat until a line is missed, then record the vision number from the line above.
If the line is not read successfully, read:
Please read the line above that one.
Repeat until one full line is read correctly, and record the vision number from that line.
Thank you for your time.
163
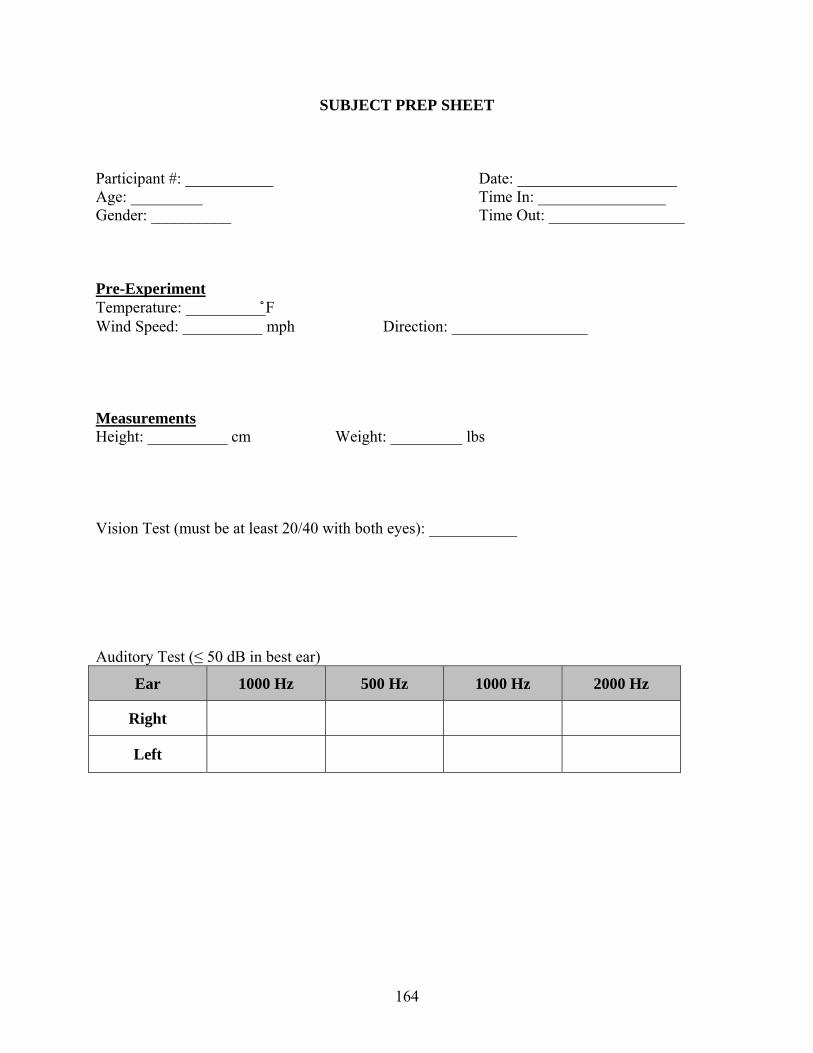
SUBJECT PREP SHEET
Participant #: ___________ Date: ____________________ Age: _________ Time In: ________________ Gender: __________ Time Out: _________________
Pre-Experiment Temperature: __________̊F Wind Speed: __________ mph Direction: _________________
Measurements Height: __________ cm Weight: _________ lbs
Vision Test (must be at least 20/40 with both eyes): ___________
Auditory Test (≤ 50 dB in best ear)
Ear 1000 Hz 500 Hz 1000 Hz 2000 Hz
Right
Left
164

Figure 42. Response Button Figure 44. Headphones
Figure 45. Ports Figure 46. Power Cord Port
HEARING LEVEL TEST PROTOCOL AND SCRIPT
1. In a quiet room, set up a place for the participant to sit. Situate the Earscan Audiometer (Figure ) and the experimenter behind the participant so that the participant cannot see the audiometer’s display screen.
a. The audiometer is the tan colored box that has several keys and a display screen on its top surface.
b. Even the fans of a laptop may mask some of the tones coming from the audiometer headphones. To prevent this masking effect, it is best to leave the laptop in another room.
2. Plug the participant response button (Figure 65) and the headphones (Figure 66), into the audiometer (Figure 64).
Figure 64. AudiometerFigure 43. Audiometer Figure 65. Response Button Figure 66. Headphones
3. The headphone plug should be placed into the port marked PHONE on the right side of the audiometer and the participant response button should be placed in the port marked BUTTON on the same side (Figure 67).
4. Plug the power cord into the wall, and make sure that its female port fits securely into the back of the audiometer (Figure 68).
Figure 67. Ports Figure 68. Power Cord Port
165

Figure 48. Keypad
5. Instruct the participant to sit in the chair and show him or her how the headphones are properly worn and how the participant response button is used. To properly wear the headphones, the headset must be placed on the participant from the back of the head, the RED earpiece must go on the right ear, the BLUE on the left, and the headband must be adjusted accordingly. Ensure that the speaker in each earphone is placed directly over the ear canal.
6. To use the participant response button, the participant should hold it in either hand so that it is comfortable and can be easily reached.
7. Instruct the participant to press the button when a series of three tones is heard. Instruct the participant not to press and hold the button. A quick and strong button press is all that is needed. Ask the participant if there are any questions, and then inform the participant that you are beginning the test.
8. Turn the audiometer on by flipping the rocker arm on the back of the machine from (0) to (|), (Figure 69).
Figure 69. Power Switch
9. To start the test, press the button labeled AUTO (Figure 70). The experimenter may pause the test at any time by pressing the MAN button (Figure 70) on the keypad and may resume the test by pressing the AUTO button again.
Figure 70. Keypad
166

10. The test consists of sounds played at 1 KHz, 500 Hz, 1 KHz (repeated for accuracy), 2 KHz, 3 KHz, 4 KHz, 6 KHz, and 8 KHz. Each frequency level is given in a series of three tones, and the decibel level of the following three tones is either increased or decreased based on the participant’s response. A series of sounds is played to the right ear first, and then played to the left ear.
11. If the participant pushes the button when there is not a tone (“false positive”), the audiometer will beep and display FALSE RESPONSES. In this case, the experimenter should explain that the participant should not guess. Then, the experimenter should begin the test again.
12. When the test is completed, TEST COMPLETE will be displayed and an audible beep will be presented.
13. Write down the results for each participant. Press DISP button on the Audiometer Interface (Figure ) to view the results for right and left ears at 1 KHz, 500 Hz, 1 KHz, and 2 KHz. Press one more time to scroll through the data at 3 KHz, 4 KHz, 6 KHz, and 8 KHz. The data ranges from 0-90+.
14. Press and hold CLEAR button on the Audiometer Interface (Figure ) to reset the Audiometer, after ensure that all the results were written down. No data will be saved once reset is conducted.
167

Script for Hearing Test:
Next we are going to be performing an informal hearing test. Please have a seat in this chair. This test will take no more than ten minutes, so I ask you to please stay as still and as quiet as possible so that your hearing through the headphones is not affected.
Hold this button in either hand, whichever is the most comfortable for you.
You will hear a series of three tones for several different sound levels. Press the button when you can just hear the sound. Press the button firmly and release. Do not hold the button down.
Please do not guess, as this will cause the test to stop, and we will have to re-start the test from the beginning. I will let you know when the test is over, and I will then remove the headphones.
Do you have any questions?
Answer any questions that the participant may have.
I am about to fit the headphones to your head.
If the participant is wearing anything that can get in the way of the headset, say:
Please take off _________ (earrings, hair clips, rubber bands, hat, etc.) because it might get in the way of the headset.
When the test is over, say:
The test has finished, you can put the button in the table and I will take off the headset from your head.
Thank you for your time.
168

PROTOCOL FOR MEASURING WEIGHT AND HEIGHT
1. Place the scale on a hard, stable, surface.
2. Ask the participant to push any of the five buttons on the front of the scale with their toe.
3. Once the scale reads “0.0”, ask the participant to step on the scale.
4. Once the participant’s weight is displayed, record the participant’s weight on the participant screening data sheet.
5. Ask the participant to step off the scale.
6. Ask the participant to remove their shoes and step onto the base of the height meter.
7. Place the sliding height measurer at the top of the participants head.
8. Record the participant’s height on the participant screening data sheet.
169

APPENDIX K. INFORMATION SHEET
VIRGINIA POLYTECHNIC INSTITUTE AND STATE UNIVERSITY Information Sheet for Participants of Investigative Projects
Title of Project: Human Performance Evaluation of Brake Assist Systems Investigators: Myra Blanco, Richard Hanowski, Greg Fitch, Justin Morgan, Jeanne Rice, Amy Wharton, Rory Brannan, Ashwin Zalte, & Andrea Birget
THE PURPOSE OF THIS RESEARCH
We apologize for not being able to tell you the additional purpose of this research project prior to data collection. This research is also evaluating the braking system’s ability to help drivers stop a vehicle as fast as possible in both unexpected and anticipated braking conditions. If you have further questions about the study, the researcher can answer them at this time. All known precautions were taken to ensure your complete safety today. Please realize that the timing of the unexpected event was set to be very short. Your ability to avoid the barricade may have been compromised by factors outside of your control, such as unfamiliarity with this vehicle and inexperience with performing hard braking with this vehicle. Therefore, if you ran over the barrier you should not be concerned. It is not an indication of your driving ability. We ask that you do not talk about the details of this study to others after your participation because this may invalidate future data that may be collected.
Providing you are willing to continue, we have a few more braking tests planned for today. I assure you that none of them will be unexpected events. However, they do involve hard braking similar to the one you just performed. The risks inherent in any one braking maneuver are less than if they were performed on a public highway owing to the absence of traffic. However, you may experience forces similar to those experienced when riding an amusement park ride. As such, we are aware of uneasiness occurring in some individuals. If this happens to you, VTTI will compensate you for the time required for these sensations to subside. To continue, you must be in reasonably good health, including having no history of back, neck, or other upper extremity disorders, and be able to withstand heavy braking. We again assure you that all data will be treated with complete confidentiality. Shortly after participating, your name will be separated from the data. A coding scheme will be employed to identify the data by subject number only (for example, Subject No. 7). It is your right to request that your data be deleted. If you would like your data to not be used, please inform the experimenter and indicate your selection on the following page. All other aspects of the earlier informed consent you signed, including risks, benefits, safety precautions, and your responsibilities, continue to apply to the remainder of this experiment.
At this point, you are entirely free to end the experiment. If you would like to leave, the experimenter will drive you back to the Institute and compensate you for the time you have graciously given us today. However, if you wish to continue, please let the experimenter know and initial the appropriate box below.
Please initial one of the following:
_______I do not want to continue with the braking experiment.
_______I would like to continue with the braking experiment.
170

Please initial one of the following for your consent:
_______I give my voluntary consent for the data that was so far and will be collected to be used in the analysis for this research project.
_______I do not give my consent for the data that was collected so far to be used in the analysis for this research project.
I have read and understand the Informed Consent and conditions of this project. I have had all my questions answered. I hereby acknowledge the above and give my voluntary consent for participation in this project.
If I participate, I may withdraw at any time without penalty. I agree to abide by the rules of this project.
Participant’s Name (Print) Signature Date
Experimenter’s Name (Print) Signature Date
Should I have any questions about this research or its conduct, I may contact:
Myra Blanco 231-1500 Greg Fitch 231-1500 Justin Morgan 231-1500 David Moore (Institutional Review Board Chair) 231-4991
If you begin to experience discomfort due to the braking events, please let the experimenter know immediately so the experiment can be stopped. If you experience discomfort after the experiment is over, please contact one of the individual s listed above using the above contact information.
171
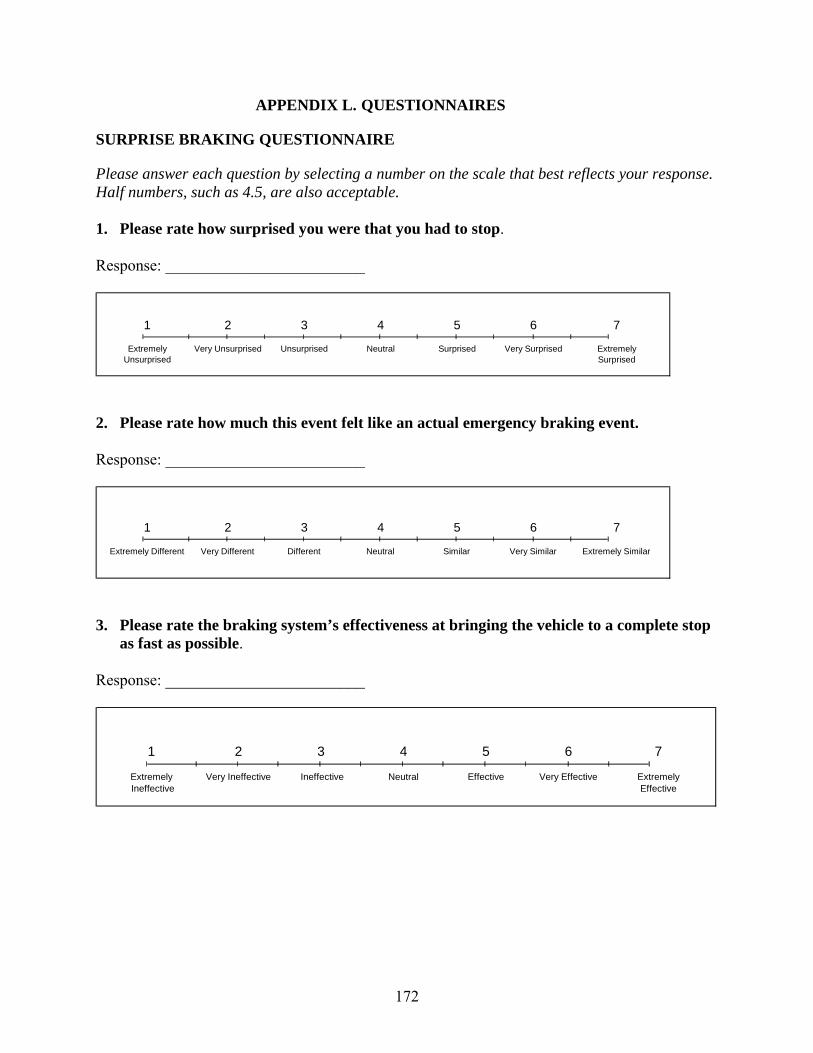
APPENDIX L. QUESTIONNAIRES
SURPRISE BRAKING QUESTIONNAIRE
Please answer each question by selecting a number on the scale that best reflects your response. Half numbers, such as 4.5, are also acceptable.
1. Please rate how surprised you were that you had to stop.
Response: _________________________
1 2 3 4 5 6 7
Extremely Very Unsurprised Unsurprised Neutral Surprised Very Surprised Extremely Unsurprised Surprised
2. Please rate how much this event felt like an actual emergency braking event.
Response: _________________________
1 2 3 4 5 6 7
Extremely Different Very Different Different Neutral Similar Very Similar Extremely Similar
3. Please rate the braking system’s effectiveness at bringing the vehicle to a complete stop as fast as possible.
Response: _________________________
1 2 3 4 5 6 7
Extremely Very Ineffective Ineffective Neutral Effective Very Effective Extremely Ineffective Effective
172

4. Please rate how hard you pressed on the brakes - extremely hard braking being what you would perform in response to a child darting out in front of your car.
Response: _________________________
1 2 3 4 5 6 7
Extremely Lightly Very Lightly Lightly Neutral Hard Very Hard Extremely Hard
N/A – Not Applicable. I did not press the brakes.
5. Please rate how fast you were at pressing the brakes.
Response: ___________________
1 2 3 4 5 6 7
Extremely Slow Very Slow Slow Neutral Fast Very Fast Extremely Fast
6. Did you lift your foot off the brake at all over the course of the stop?
Yes No
7. If yes, please rate how much you agree with the statement “This did not affect my stopping distance.”
Response: ___________________
1 2 3 4 5 6 7
Extremely Disagree Highly Disagree Disagree Neutral Agree Highly Agree Extremely Agree
173

8. Was there anything that prevented you from braking hard? If so, please explain?
9. What was the hardest braking you have ever done?
10. How did this stop compare to the hardest braking you have ever done? Response: _________________________
1 2 3 4 5 6 7
Extremely Softer Greatly Softer Softer Same Harder Greatly Harder Extremely Harder
11. Please rate how willing you were to apply the brakes.
Response: _________________________
1 2 3 4 5 6 7
Extremely Unwilling Very Unwilling Unwilling Neutral Willing Very Willing Extremely Willing
174

12. How aggressive are you at driving?
Response: _________________________
1 2 3 4 5 6 7
Extremely Passive Very Passive Passive Neutral Aggressive Very Aggressive Extremely Aggressive
13. Have you taken any emergency braking training? If so, please explain?
175

ANTICIPATED BRAKING QUESTIONNAIRE
Please answer each question by selecting a number on the scale that best reflects your response. Half numbers, such as 4.5, are also acceptable.
1. Please rate how surprised you were that you had to stop.
Response: _________________________
1 2 3 4 5 6 7
Extremely Very Unsurprised Unsurprised Neutral Surprised Very Surprised Extremely Unsurprised Surprised
2. Please rate how much this event felt like an actual emergency braking event.
Response: _________________________
1 2 3 4 5 6 7
Extremely Different Very Different Different Neutral Similar Very Similar Extremely Similar
3. Please rate the braking system’s effectiveness at bringing the vehicle to a complete stop as fast as possible.
Response: _________________________
1 2 3 4 5 6 7
Extremely Very Ineffective Ineffective Neutral Effective Very Effective Extremely Ineffective Effective
176

4. Please rate how hard you pressed on the brakes - extremely hard braking being what you would perform in response to a child darting out in front of your car.
Response: _________________________
1 2 3 4 5 6 7
Extremely Lightly Very Lightly Lightly Neutral Hard Very Hard Extremely Hard
N/A – Not Applicable. I did not press the brakes.
5. Please rate how fast you were at pressing the brakes.
Response: __________________
1 2 3 4 5 6 7
Extremely Slow Very Slow Slow Neutral Fast Very Fast Extremely Fast
6. Did you lift your foot off the brake at all over the course of the stop?
Yes No
7. If yes, please rate how much you agree with the statement “This did not affect my stopping distance.”
Response: ___________________
1 2 3 4 5 6 7
Extremely Disagree Highly Disagree Disagree Neutral Agree Highly Agree Extremely Agree
8. Was there anything that prevented you from braking hard? If so, please explain?
177

9. How did this stop compare to the hardest braking you have ever done?
Response: _________________________
1 2 3 4 5 6 7
Extremely Softer Greatly Softer Softer Same Harder Greatly Harder Extremely Harder
10. Please rate how willing you were to apply the brakes?
Response: _________________________
1 2 3 4 5 6 7
Extremely Unwilling Very Unwilling Unwilling Neutral Willing Very Willing Extremely Willing
178

BARRICADE FOLLOW-UP QUESTIONNAIRE
1. How different did the braking you experienced in response to the anticipated barricade feel from the braking you experienced when the barricade closure was a surprise? For this question, please choose a number on the scale below that matches your response.
Response: _________________________
1 2 3 4 5 6 7
Felt the Same Felt Completely Different
2. Please comment on your response.
3. What was different?
4. What was the same?
179

REPEATED BRAKING QUESTIONNAIRE
Please answer each question by selecting a number on the scale that best reflects your response. Half numbers, such as 4.5, are also acceptable.
1. Overall, please rate how surprised you were that you had to stop.
Response: _________________________
1 2 3 4 5 6 7
Extremely Very Unsurprised Unsurprised Neutral Surprised Very Surprised Extremely Unsurprised Surprised
2. Please rate how urgent the auditory alarm was perceived to be.
Response: _________________________
1 2 3 4 5 6 7
Not Urgent at All Moderately Urgent Extremely Urgent
3. Please rate the braking system’s effectiveness at bringing the vehicle to a complete stop as fast as possible.
Response: _________________________
1 2 3 4 5 6 7
Extremely Very Ineffective Ineffective Neutral Effective Very Effective Extremely Ineffective Effective
180

4. Please rate how fast you were at pressing the brakes.
Response: ___________________
1 2 3 4 5 6 7
Extremely Slow Very Slow Slow Neutral Fast Very Fast Extremely Fast
5. Please rate how hard you pressed on the brakes - extremely hard braking being what you would perform in response to a child darting out in front of your car.
Response: _________________________
1 2 3 4 5 6 7
Extremely Lightly Very Lightly Lightly Neutral Hard Very Hard Extremely Hard
N/A – Not Applicable. I did not press the brakes.
6. Did you lift your foot off the brake at all over the course of the stop?
Yes No
7. If yes, please rate how much you agree with the statement “This did not affect my stopping distance.”
Response: ___________________
1 2 3 4 5 6 7
Extremely Disagree Highly Disagree Disagree Neutral Agree Highly Agree Extremely Agree
181

8. Was there anything that prevented you from braking hard? If so, please explain?
9. Please rate how willing you were to apply the brakes?
Response: _________________________
1 2 3 4 5 6 7
Extremely Unwilling Very Unwilling Unwilling Neutral Willing Very Willing Extremely Willing
182

POST-BRAKING QUESTIONNAIRE
We are interested in your opinions and thoughts about the braking maneuvers you performed today. After we ask you a question, we will take notes and record your responses. Although we will be asking you questions, feel free to mention any other information you feel is important.
1. On a scale of 1 to 7, where 1 is extremely ineffective and 7 is extremely effective, how would you rate the overall effectiveness of the vehicle’s brakes across all your braking maneuvers today?
2. Now, please think about your fourth braking maneuver (this was to the auditory tone). On the same 1 to 7 scale, where 1 is extremely ineffective and 7 is extremely effective, how would you rate the effectiveness of the vehicle’s brakes?
3. How would you describe the brake pedal’s feel for the fourth braking maneuver?
4. Now, please think about your fifth braking maneuver (this was to the auditory tone). On the same 1 to 7 scale, where 1 is extremely ineffective and 7 is extremely effective, how would you rate the effectiveness of the vehicle’s brakes?
5. How would you describe the brake pedal’s feel for the fifth braking maneuver?
6. Please compare the brake pedal’s feel during the last two braking maneuvers?
7. While you were performing braking, did you pump the brakes at any point in this experiment?
183
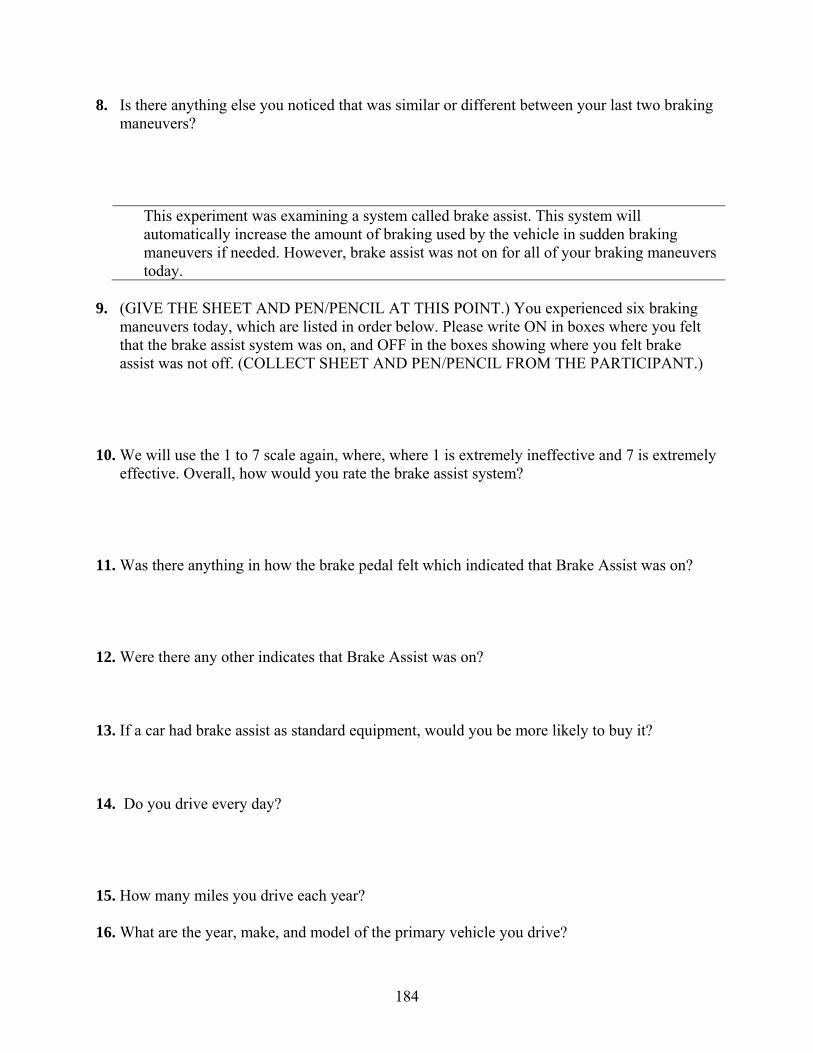
8. Is there anything else you noticed that was similar or different between your last two braking maneuvers?
This experiment was examining a system called brake assist. This system will automatically increase the amount of braking used by the vehicle in sudden braking maneuvers if needed. However, brake assist was not on for all of your braking maneuvers today.
9. (GIVE THE SHEET AND PEN/PENCIL AT THIS POINT.) You experienced six braking maneuvers today, which are listed in order below. Please write ON in boxes where you felt that the brake assist system was on, and OFF in the boxes showing where you felt brake assist was not off. (COLLECT SHEET AND PEN/PENCIL FROM THE PARTICIPANT.)
10. We will use the 1 to 7 scale again, where, where 1 is extremely ineffective and 7 is extremely effective. Overall, how would you rate the brake assist system?
11. Was there anything in how the brake pedal felt which indicated that Brake Assist was on?
12. Were there any other indicates that Brake Assist was on?
13. If a car had brake assist as standard equipment, would you be more likely to buy it?
14. Do you drive every day?
15. How many miles you drive each year?
16. What are the year, make, and model of the primary vehicle you drive?
184

17. Does this vehicle have an automatic or manual transmission?
18. Do you drive any other vehicles? If yes, have participant state the year, make, model, and transmission type (automatic, manual) for each vehicle.
19. Are you currently employed in the design, engineering, or development of in-vehicle technologies?
185

Please fill in each box with either on or off: ON = you felt that the brake assist system was ON. OFF = you felt that the brake assist system was OFF.
First Braking Maneuver
(Braking was to the Barricade)
Second Braking Maneuver
(Braking was to the Barricade)
Experimenter Demonstration
(Braking was to the Auditory Tone)
Third Braking Maneuver
(Braking was to the Auditory Tone)
Fourth Braking Maneuver
(Braking was to the Auditory Tone)
Fifth Braking Maneuver
(Braking was to the Auditory Tone)
186

Note: This was used as a laminated visual aid given to participants while they were responding to questions in the Post-Braking Questionnaire.
First Braking Maneuver
(Braking was to the Barricade)
Second Braking Maneuver
(Braking was to the Barricade)
Experimenter Demonstration
(Braking was to the Auditory Tone)
Third Braking Maneuver
(Braking was to the Auditory Tone)
Fourth Braking Maneuver
(Braking was to the Auditory Tone)
Fifth Braking Maneuver
(Braking was to the Auditory Tone)
1 2 3 4 5 6 7
Extremely Very Ineffective Ineffective Neutral Effective Very Effective Extremely Ineffective Effective
187

APPENDIX M. LIBRARY OF BRAKING MANEUVERS PERFORMED TO THE UNANTICIPATED BARRICADE
INTRODUCTION
The following graphs show brake pedal displacement and stopping distance for a select set of braking maneuvers performed to the unanticipated barricade. This section is intended to depict the difference between an ABS active stop vs. an ABS inactive stop. Brake pedal displacement is denoted with a solid line (Figure 71). The small square overlaid on the brake pedal displacement series represents the displacement observed 0.05 seconds into the braking maneuver. Its location can be used to assess the brake pedal application rate. To help visualize drivers braking performance, a linear trend line was fit to the brake pedal displacement data spanning the first and last inflection points in the series. The first brake pedal displacement inflection point signifies the point at which the brake pedal travel starts to go back down after braking onset. The final inflection point denotes the last highest point in the brake pedal displacement before the driver consciously releases pressure on the brake pedal as the vehicle comes to a complete stop. The trend line can be used to determine whether braking effort changed over the course of the maneuver. ABS activation are shown when they occurred. The test vehicle’s stopping distance is also plotted on the secondary axis. The braking input that was responsible for the majority of the stopping distance can therefore be seen. The produced stopping distanced is also presented on each graph.
Brake Pedal Displacement
Brake Pedal Displacement between 1st and 2nd Inflection Points
Stopping Distance
Brake Pedal Displacement in First 0.05 s
BAS Activation
ABS Activation
Figure 71. Braking Maneuver Library Legend
188

DRIVERS WHO HAD A PANIC-BRAKING MANEUVER TO THE UNEXPECTED BRAKING MANEUVER
Driver 44 Panic-braking Maneuver to the Unexpected Barricade
Figure 72 portrays Driver 44’s panic-braking maneuver to the unexpected barricade. This stop is an ABS active stop with a stopping distance of 136.61 ft. Driver 44 was driving the Volvo S80.
Figure 72. Driver 44, an older male driving the Volvo S80, activated ABS 2.35 seconds into the panic-braking maneuver.
189

Driver 47 Panic-Braking Maneuver to the Unexpected Barricade
Figure 73 portrays Driver 47’s panic-braking maneuver. This is an ABS active stop with a stopping distance of 125 ft. Driver 47 was driving the Volvo S80.
Figure 73. Driver 47, an older male driving the Volvo S80, activated ABS 1.7 seconds into the panic-braking maneuver.
190

Driver 53 Panic-Braking Maneuver to the Unexpected Barricade
Figure 74 portrays Driver 53’s panic-braking maneuver. This is an ABS active stop with a stopping distance of 103.77 ft. Driver 53 was driving the Volvo S80.
Figure 74. Driver 53, a younger female driving the Volvo S80, activated ABS 1.15 seconds into the panic-braking maneuver.
191

Driver 57 Panic Braking Maneuver to the Unexpected Barricade
Figure 75 portrays Driver 57’s panic braking maneuver. This is an ABS active stop with a stopping distance of 108 ft. Driver 57 was driving the Volvo S80.
Figure 75. Driver 57, a younger male driving the Volvo S80, activated ABS 1.9 seconds into the panic braking maneuver.
192

DRIVERS WHO DID NOT HAVE A PANIC BRAKING MANEUVER TO THE UNEXPECTED BARRICADE
Driver 9 Braking Maneuver to the Unexpected Barricade
Figure 76 portrays Driver 9’s braking maneuver. This is an ABS inactive stop with a stopping distance of 108.39 ft. Driver 9 was driving the Mercedes-Benz R350.
Figure 76. Driver 9, an older male driving the Mercedes-Benz R350, did not activate ABS in the braking maneuver.
193
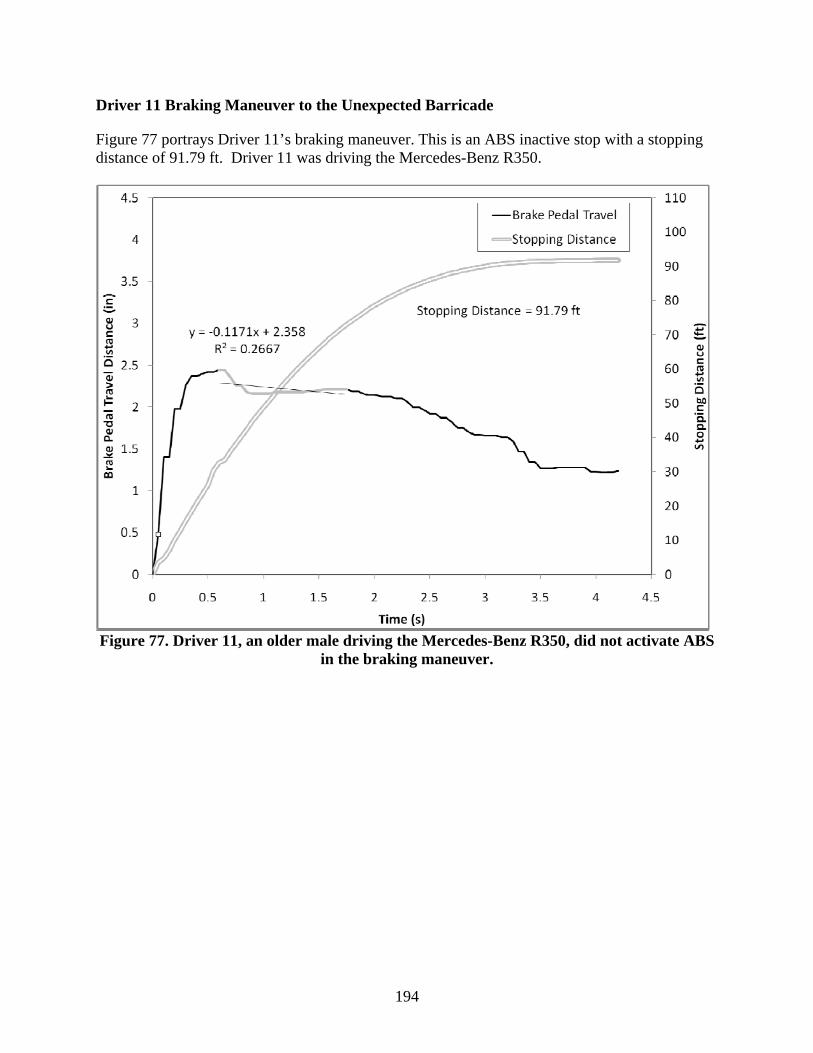
Driver 11 Braking Maneuver to the Unexpected Barricade
Figure 77 portrays Driver 11’s braking maneuver. This is an ABS inactive stop with a stopping distance of 91.79 ft. Driver 11 was driving the Mercedes-Benz R350.
Figure 77. Driver 11, an older male driving the Mercedes-Benz R350, did not activate ABS in the braking maneuver.
194

Driver 19 Braking Maneuver to the Unexpected Barricade
Figure 78 portrays Driver 19’s braking maneuver. This is an ABS inactive stop with a stopping distance of 142.84 ft. Driver 19 was driving the Mercedes-Benz R350.
Figure 78. Driver 19, a younger female driving the Mercedes-Benz R350, did not activate ABS in the braking maneuver.
195

Driver 23 Braking Maneuver to the Unexpected Barricade
Figure 79 portrays Driver 23’s braking maneuver. This is an ABS inactive stop with a stopping distance of 120.96 ft. Driver 23 was driving the Mercedes-Benz R350.
Figure 79. Driver 23, a younger female driving the Mercedes-Benz R350, did not activate ABS in the braking maneuver.
196

Driver 25 Braking Maneuver to the Unexpected Barricade
Figure 80 portrays Driver 25’s braking maneuver. This is an ABS inactive stop with a stopping distance of 88 ft. Driver 25 was driving the Mercedes-Benz R350.
Figure 80. Driver 25, a younger male driving the Mercedes-Benz R350, did not activate ABS in the braking maneuver.
197

Driver 29 Braking Maneuver to the Unexpected Barricade
Figure 81 portrays Driver 29’s braking maneuver. This is an ABS inactive stop with a stopping distance of 90.68 ft. Driver 29 was driving the Mercedes-Benz R350.
Figure 81. Driver 29, a younger male driving the Mercedes-Benz R350, did not activate ABS in the braking maneuver.
198

Driver 59 Braking Maneuver to the Unexpected Barricade
Figure 82 portrays Driver 59’s braking maneuver. This is an ABS inactive stop with a stopping distance of 73.65 ft. Driver 59 was driving the Mercedes-Benz R350.
Figure 82. Driver 59, a younger male driving the Mercedes-Benz R350, did not activate ABS in the braking maneuver.
199

APPENDIX N. LIBRARY OF BRAKING MANEUVERS PERFORMED TO THE ANTICIPATED BARRICADE
INTRODUCTION
The following graphs show brake pedal displacement and stopping distance for a select set of braking maneuvers performed to the anticipated barricade. This section is intended to depict the difference between a BAS active stop vs. a BAS inactive stop. Brake pedal displacement is denoted with a solid line (Figure 71). The small square overlaid on the brake pedal displacement series represents the displacement observed 0.05 seconds into the braking maneuver. Its location can be used to assess the brake pedal application rate. To help visualize drivers braking performance, a linear trend line was fit to the brake pedal displacement data spanning the first and last inflection points in the series. The first brake pedal displacement inflection point signifies the point at which the brake pedal travel starts to go back down after braking onset. The final inflection point denotes the last highest point in the brake pedal displacement before the driver consciously releases pressure on the brake pedal as the vehicle comes to a complete stop. The trend line can be used to determine whether braking effort changed over the course of the maneuver. BAS and ABS activation are shown when they occurred. The test vehicle’s stopping distance is also plotted on the secondary axis. The braking input that was responsible for the majority of the stopping distance can therefore be seen. The produced stopping distanced is also presented on each graph.
Brake Pedal Displacement
Brake Pedal Displacement between 1st and 2nd Inflection Points
Stopping Distance
Brake Pedal Displacement in First 0.05 s
BAS Activation
ABS Activation
Figure 83. Braking Maneuver Library Legend
200

DRIVERS PANIC BRAKING MANEUVERS WITH A BAS ACTIVATION TO THE ANTICIPATED BARRICADE
Driver 43 Panic Braking Maneuver to the Anticipated Barricade
Figure 84 portrays Driver 43’s anticipated braking maneuver. This is a BAS active stop with a stopping distance of 73.65 ft. ABS was also activated during this stop. Driver 43 was driving the Mercedes-Benz R350.
Figure 84. Driver 43, an older male driving the Volvo S80, activated BAS 0.1 second into the anticipated braking maneuver.
201

Driver 44 Panic Braking Maneuver to the Anticipated Braking Maneuver
Figure 85 portrays Driver 44’s anticipated braking maneuver. This is a BAS active stop with a stopping distance of 75.78 ft. ABS was also activated during this stop. Driver 44 was driving the Volvo S80.
Figure 85. Driver 44, an older male driving the Volvo S80, activated BAS 0.1 second into the anticipated braking maneuver.
202

Driver 48 Panic Braking Maneuver to the Anticipated Braking Maneuver
Figure 86 portrays Driver 48’s anticipated braking maneuver. This is a BAS active stop with a stopping distance of 74.37 ft. ABS was also activated during this stop. Driver 48 was driving the Volvo S80.
Figure 86. Driver 48, an older male driving the Volvo S80, activated BAS 0.1 second into the anticipated braking maneuver.
203
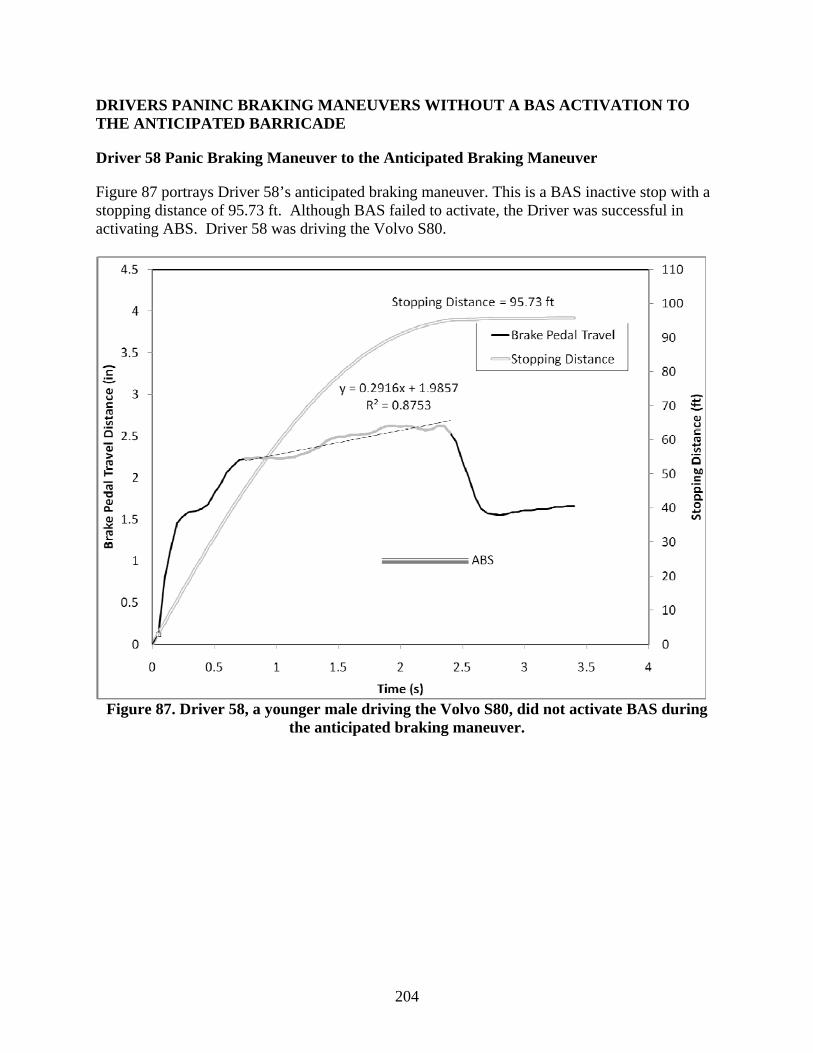
DRIVERS PANINC BRAKING MANEUVERS WITHOUT A BAS ACTIVATION TO THE ANTICIPATED BARRICADE
Driver 58 Panic Braking Maneuver to the Anticipated Braking Maneuver
Figure 87 portrays Driver 58’s anticipated braking maneuver. This is a BAS inactive stop with a stopping distance of 95.73 ft. Although BAS failed to activate, the Driver was successful in activating ABS. Driver 58 was driving the Volvo S80.
Figure 87. Driver 58, a younger male driving the Volvo S80, did not activate BAS during the anticipated braking maneuver.
204

Driver 65 Panic Braking Maneuver to the Anticipated Braking Maneuver
Figure 88 portrays Driver 65’s anticipated braking maneuver. This is a BAS inactive stop with a stopping distance of 98.88 ft. Although BAS failed to activate, the Driver was successful in activating ABS. Driver 65 was driving the Volvo S80.
Figure 88. Driver 65, a younger female driving the Volvo S80, did not activate BAS during the anticipated braking maneuver.
205

Driver 69 Panic Braking Maneuver to the Anticipated Braking Maneuver
Figure 89 portrays Driver 69’s anticipated braking maneuver. This is a BAS inactive stop with a stopping distance of 91.33 ft. Although BAS failed to activate, the Driver was successful in activating ABS. Driver 69 was driving the Volvo S80.
Figure 89. Driver 69, an older male driving the Volvo S80, did not activate BAS during the anticipated braking maneuver.
206

APPENDIX O. LIBRARY OF BRAKING MANEUVERS FOR DRIVERS THAT ACTIVATED BAS AT SOME POINT IN THE REPEATED BRAKING SESSION
INTRODUCTION
The following graphs show brake pedal displacement and stopping distance for a select set of braking maneuvers performed to the anticipated barricade. Specifically, this section illustrates the three braking maneuvers (R1, R2, R3) performed in the repeated braking session. Only those drivers that activated BAS at some point in the repeated braking session are presented. Brake pedal displacement is denoted with a solid line (Figure 90). The small square overlaid on the brake pedal displacement series represents the displacement observed 0.05 seconds into the braking maneuver. Its location can be used to assess the brake pedal application rate. To help visualize drivers braking performance, a linear trend line was fit to the brake pedal displacement data spanning the first and last inflection points in the series. The first brake pedal displacement inflection point signifies the point at which the brake pedal travel starts to go back down after braking onset. The final inflection point denotes the last highest point in the brake pedal displacement before the driver consciously releases pressure on the brake pedal as the vehicle comes to a complete stop. The trend line can be used to determine whether braking effort changed over the course of the maneuver. BAS and ABS activation are shown when they occurred. The test vehicle’s stopping distance is also plotted on the secondary axis. The braking input that was responsible for the majority of the stopping distance can therefore be seen. The produced stopping distanced is also presented on each graph.
Brake Pedal Displacement
Brake Pedal Displacement between 1st and 2nd Inflection Points
Stopping Distance
Brake Pedal Displacement in First 0.05 s
BAS Activation
ABS Activation
Figure 90. Braking Maneuver Library Legend
207

Driver 10 Repeated Braking Session
Figure 91, Figure 92, and Figure 93 portray Driver 10’s braking maneuvers for stops R1, R2, and R3 respectively. In the R1 and R2 stops, the Driver activated ABS as well as BAS. BAS was not activated for R3 because the system was disabled; however, ABS was activated during this stop. Driver 10 was included in the enabled-disabled condition and drove the Mercedes-Benz R350.
Figure 91. Brake pedal displacement over the first 4 seconds of the R1 panic braking maneuver for Driver 10, an older male driving the Mercedes-Benz R350
Figure 91. This graph shows the change in the Driver’s brake pedal displacement over the first 4 seconds of the braking maneuver. It can be seen that the brake pedal was pressed quickly upon onset. A displacement of 0.73 in was produced in the first 0.05 second, reaching a displacement of 3.37 in. in the first 0.55 seconds. BAS was activated immediately, while ABS was activated 0.4 seconds into the stop. The liner regression for data ranging from the first brake pedal displacement inflection point to the last inflection point is described by the equation y = -0.163x + 3.4552. The R-squared value of the regression was 0.6945. The braking maneuver yielded a stopping distance of 68.24 ft.
208

Figure 92. Brake pedal displacement over the first 4 seconds of the R2 panic braking maneuver for Driver 10, an older male driving the Mercedes-Benz R350
Figure 92. This graph shows the change in the Driver’s brake pedal displacement over the first 4 seconds of the braking maneuver. It can be seen that the brake pedal was pressed quickly upon onset. A displacement of 0.89 in was produced in the first 0.05 second, reaching a displacement of 3.05 inches in the first 0.25 seconds. BAS was activated 0.1second into the stop, while ABS was activated 0.2 seconds into the stop. The liner regression for data ranging from the first brake pedal displacement inflection point to the last inflection point is described by the equation y = 0.1723x + 3.033. The R-squared value of the regression was 0.7226. The braking maneuver yielded a stopping distance of 64.76 ft.
209

Figure 93. Brake pedal displacement over the first 4 seconds of the R3 panic braking maneuver for Driver 10, an older male driving the Mercedes-Benz R350
Figure 93. This graph shows the change in the Driver’s brake pedal displacement over the first 4 seconds of the braking maneuver. It can be seen that the brake pedal was pressed slowly upon onset. A displacement of 0.02 in was produced in the first 0.05 second, reaching a displacement of 3.18 inches in the first 0.45 seconds. BAS was not activated in this stop, although ABS was activated 0.5 seconds into the stop. The liner regression for data ranging from the first brake pedal displacement inflection point to the last inflection point is described by the equation y = -0.2081x + 3.4301. The R-squared value of the regression was 0.6039. The braking maneuver yielded a stopping distance of 77.95 ft.
210

Driver 21 Repeated Braking Session
Figure 94, Figure 95, and Figure 96 portray Driver 21’s braking maneuvers for stops R1, R2, and R3 respectively. In the R1 and R2 stops, BAS was not activated because the system was disabled. However, ABS was activated during R1 and R2. BAS was enabled for the R3 braking maneuver and was activated by the Driver. Driver 21 was included in the disabled-enabled condition and drove the Volvo S80.
Figure 94. Brake pedal displacement over the first 3.5 seconds of the R1 panic braking maneuver for Driver 21, a younger female driving the Volvo S80
Figure 94. This graph shows the change in the Driver’s brake pedal displacement over the first 3.5 seconds of the braking maneuver. It can be seen that the brake pedal was pressed slowly upon onset. A displacement of 1.83 in was produced in the first .05 second, reaching a displacement of 2.76 inches in the first 0.3 seconds. BAS was not activated in this stop, although ABS was activated 0.25 seconds into the stop. The liner regression for data ranging from the first brake pedal displacement inflection point to the last inflection point is described by the equation y = -0.1195x + 2.5817. The R-squared value of the regression was 0.3252. The braking maneuver yielded a stopping distance of 73.62 ft.
211

Figure 95. Brake pedal displacement over the first 3.5 seconds of the R2 panic braking maneuver for Driver 21, a younger female driving the Volvo S80
Figure 95. This graph shows the change in the Driver’s brake pedal displacement over the first 3.5 seconds of the braking maneuver. It can be seen that the brake pedal was pressed slowly upon onset. A displacement of 0.01 in was produced in the first 0.05 second, reaching a displacement of 2.49 inches in the first 0.35 seconds. BAS was not activated in this stop, although ABS was activated 0.4 seconds into the stop. The liner regression for data ranging from the first brake pedal displacement inflection point to the last inflection point is described by the equation y = -0.0382x + 2.479. The R-squared value of the regression was 0.0964. The braking maneuver yielded a stopping distance of 78.83 ft.
212

Figure 96. Brake pedal displacement over the first 4 seconds of the R3 panic braking maneuver for Driver 21, a younger female driving the Volvo S80
Figure 96. This graph shows the change in the Driver’s brake pedal displacement over the first 4 seconds of the braking maneuver. It can be seen that the brake pedal was pressed quickly upon onset. A displacement of 0.26 in was produced in the first 0.05 second, reaching a displacement of 2.61 inches in the first 0.25 seconds. BAS was activated 0.15 seconds into the stop, and ABS was activated 0.3 seconds into the stop. The liner regression for data ranging from the first brake pedal displacement inflection point to the last inflection point is described by the equation y = -0.2411x + 2.7579. The R-squared value of the regression was 0.8771. The braking maneuver yielded a stopping distance of 73.65 ft
213

Driver 26 Repeated Braking Session
Figure 97, Figure 98, and Figure 99 portray Driver 26’s braking maneuvers for stops R1, R2, and R3 respectively. Although BAS was enabled for R1, the Driver was unable to get the system to activate, however activated ABS shortly into the braking maneuver. During the R2 braking maneuver, the Driver activated BAS though ABS was not activated at any point during the stop. BAS was disabled for the R3 braking maneuver therefore making it impossible for the driver to activate the system. The Driver did activate ABS during R3. Driver 21 was included in the enabled-disabled condition and drove the Volvo S80.
Figure 97. Brake pedal displacement over the first 4 seconds of the R1 panic braking maneuver for Driver 26, a younger male driving the Mercedes-Benz R350
Figure 97. This graph shows the change in the Driver’s brake pedal displacement over the first 4 seconds of the braking maneuver. It can be seen that the brake pedal was pressed quickly upon onset. A displacement of 0.44 in was produced in the first 0.05 second, reaching a displacement of 2.5 inches in the first 0.4 seconds. BAS was not activated in this stop, and ABS was activated 1.2 seconds into the stop. The liner regression for data ranging from the first brake pedal displacement inflection point to the last inflection point is described by the equation y = 0.0604 + 28974. The R-squared value of the regression was 0.0751. The braking maneuver yielded a stopping distance of 72.96 ft.
214

Figure 98. Brake pedal displacement over the first 4 seconds of the R2 panic braking maneuver for Driver 26, a younger male driving the Mercedes-Benz R350
Figure 98. This graph shows the change in the Driver’s brake pedal displacement over the first 4 seconds of the braking maneuver. It can be seen that the brake pedal was pressed quickly upon onset. A displacement of 0.85 in was produced in the first 0.05 second, reaching a displacement of 2.89 inches in the first 0.45 seconds. BAS was activated immediately into the stop, and ABS was not activated. The liner regression for data ranging from the first brake pedal displacement inflection point to the last inflection point is described by the equation y = 0.0163x + 2.9421. The R-squared value of the regression was 0.0551. The braking maneuver yielded a stopping distance of 63.29 ft.
215

Figure 99. Brake pedal displacement over the first 4 seconds of the R3 panic braking maneuver for Driver 26, a younger male driving the Mercedes-Benz R350
Figure 99. This graph shows the change in the Driver’s brake pedal displacement over the first 4 seconds of the braking maneuver. It can be seen that the brake pedal was pressed slowly upon onset. A displacement of 0.05 in was produced in the first 0.05 second, reaching a displacement of 2.81 inches in the first 0.45 seconds. BAS was not activated in this stop, and ABS was activated 0.6 seconds into the stop. The liner regression for data ranging from the first brake pedal displacement inflection point to the last inflection point is described by the equation y = -0.0601x + 3.0421. The R-squared value of the regression was 0.2107. The braking maneuver yielded a stopping distance of 70.57 ft.
216

Driver 29 Repeated Braking Session
Figure 100, Figure 101, and Figure 102 portray Driver 29’s braking maneuvers for stops R1, R2, and R3 respectively. BAS was not activated for R1 and R2 because the system was disabled. ABS, however, was activated for both stops. BAS was enabled for R3 and activated by the Driver. ABS was also activated during the R3 braking maneuver. Driver 29 was included in the disabled-enabled condition and drove the Mercedes-Benz R350.
Figure 100. Brake pedal displacement over the first 3.5 seconds of the R1 panic braking maneuver for Driver 29, a younger male driving the Mercedes-Benz R350
Figure 100. This graph shows the change in the Driver’s brake pedal displacement over the first 3.5 seconds of the braking maneuver. It can be seen that the brake pedal was pressed somewhat quickly upon onset. A displacement of 0.55 in was produced in the first 0.05 second, reaching a displacement of 3.18 inches in the first 0.45 seconds. BAS was not activated in this stop, and ABS was activated 0.4 seconds into the stop. The liner regression for data ranging from the first brake pedal displacement inflection point to the last inflection point is described by the equation y = -0.3906x + 3.3617. The R-squared value of the regression was 0.9402. The braking maneuver yielded a stopping distance of 65.98 ft.
217

Figure 101. Brake pedal displacement over the first 3.5 seconds of the R2 panic braking maneuver for Driver 29, a younger male driving the Mercedes-Benz R350
Figure 101. This graph shows the change in the Driver’s brake pedal displacement over the first 3.5 seconds of the braking maneuver. It can be seen that the brake pedal was pressed somewhat quickly upon onset. A displacement of 0.47 in was produced in the first 0.05 second, reaching a displacement of 2.91 inches in the first 0.4 seconds. BAS was not activated for this stop, and ABS was activated 0.35 seconds into the stop. The liner regression for data ranging from the first brake pedal displacement inflection point to the last inflection point is described by the equation y = -0.0565x + 3.0517. The R-squared value of the regression was 0.4538. The braking maneuver yielded a stopping distance of 64.93 ft.
218

Figure 102. Brake pedal displacement over the first 3.5 seconds of the R3 panic braking maneuver for Driver 29, a younger male driving the Mercedes-Benz R350
Figure 102. This graph shows the change in the Driver’s brake pedal displacement over the first 3.5 seconds of the braking maneuver. It can be seen that the brake pedal was pressed somewhat quickly upon onset. A displacement of 0.51 in was produced in the first 0.05 second, reaching a displacement of 3.41 inches in the first 0.6 seconds. BAS was activated 0.05 seconds into the stop, and ABS was activated 0.35 seconds into the stop. The liner regression for data ranging from the first brake pedal displacement inflection point to the last inflection point is described by the equation y = -0.0767x + 3.4407. The R-squared value of the regression was 0.071. The braking maneuver yielded a stopping distance of 64.33 ft.
219

Driver 43 Repeated Braking Session
Figure 103, Figure 104, and Figure 105 portray Driver 43’s braking maneuvers for stops R1, R2, and R3 respectively. BAS and ABS were activated for R1. BAS was not activated by the Driver during R2 even though the system was enabled, however the Driver was able to activate ABS. BAS was not activated during the R3 stop because the system was disabled. The Driver was able to activate ABS during the R3 braking maneuver. Driver 43 was included in the enabled-disabled condition and drove the Volvo S80.
Figure 103. Brake pedal displacement over the first 4 seconds of the R1 panic braking maneuver for Driver 43, a older male driving the Volvo S80
Figure 103. This graph shows the change in the Driver’s brake pedal displacement over the first 4 seconds of the braking maneuver. It can be seen that the brake pedal was pressed somewhat quickly upon onset. A displacement of 0.12 in was produced in the first 0.05 second, reaching a displacement of 2.71 inches in the first 0.3 seconds. BAS was activated 0.15 seconds into the stop, and ABS was activated 0.2 seconds into the stop. The liner regression for data ranging from the first brake pedal displacement inflection point to the last inflection point is described by the equation y = -0.1705x + 2.6377. The R-squared value of the regression was 0.425. The braking maneuver yielded a stopping distance of 66.33 ft.
220

Figure 104. Brake pedal displacement over the first 4 seconds of the R2 panic braking maneuver for Driver 43, a older male driving the Volvo S80
Figure 104. This graph shows the change in the Driver’s brake pedal displacement over the first 4 seconds of the braking maneuver. It can be seen that the brake pedal was pressed very quickly upon onset. A displacement of 0.59 in was produced in the first 0.05 second, reaching a displacement of 2.64 inches in the first 0.2 seconds. BAS was not activated for this stop, and ABS was activated 0.2 seconds into the stop. The liner regression for data ranging from the first brake pedal displacement inflection point to the last inflection point is described by the equation y = -0.2514x + 2.706. The R-squared value of the regression was 0.9137. The braking maneuver yielded a stopping distance of 72.01 ft.
221

Figure 105. Brake pedal displacement over the first 4 seconds of the R3 panic braking maneuver for Driver 43, an older male driving the Volvo S80
Figure 105. This graph shows the change in the Driver’s brake pedal displacement over the first 4 seconds of the braking maneuver. It can be seen that the brake pedal was pressed quickly upon onset. A displacement of 0.82 in was produced in the first 0.05 second, reaching a displacement of 2.71 inches in the first 0.35 seconds. BAS was not activated for this stop, and ABS was activated 0.15 seconds into the stop. The liner regression for data ranging from the first brake pedal displacement inflection point to the last inflection point is described by the equation y = 0.2766x + 2.2824. The R-squared value of the regression was 0.3088. The braking maneuver yielded a stopping distance of 61.97 ft.
222
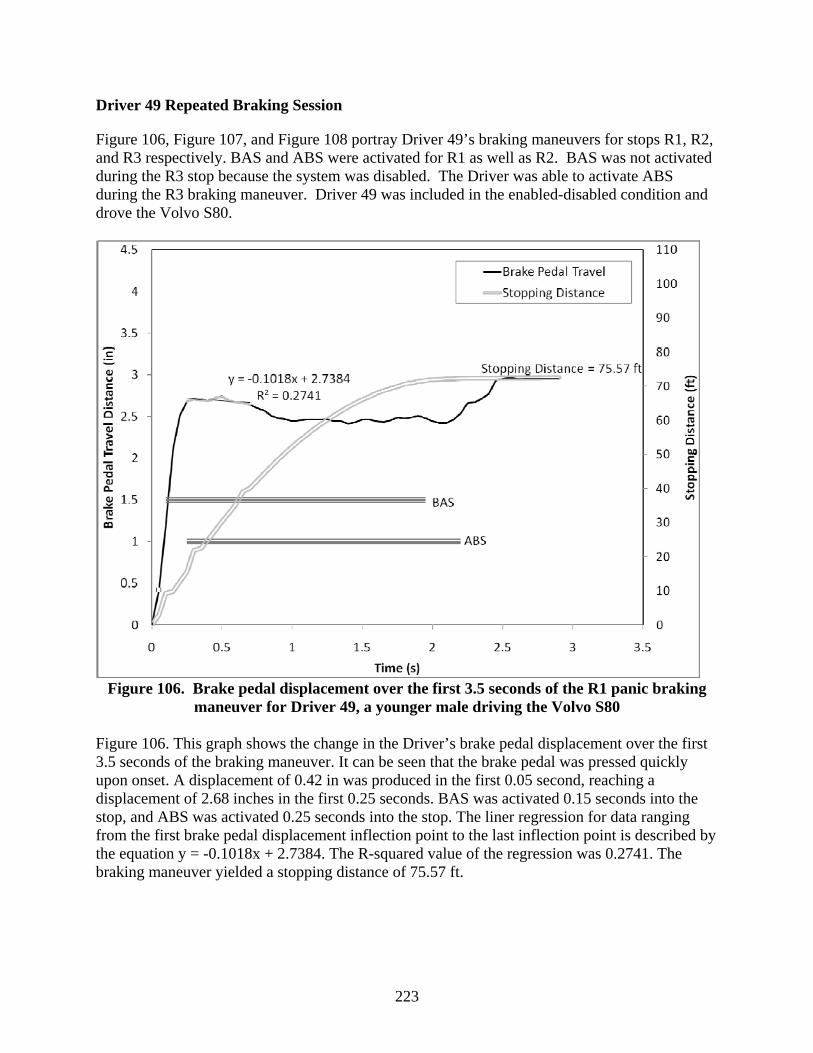
Driver 49 Repeated Braking Session
Figure 106, Figure 107, and Figure 108 portray Driver 49’s braking maneuvers for stops R1, R2, and R3 respectively. BAS and ABS were activated for R1 as well as R2. BAS was not activated during the R3 stop because the system was disabled. The Driver was able to activate ABS during the R3 braking maneuver. Driver 49 was included in the enabled-disabled condition and drove the Volvo S80.
Figure 106. Brake pedal displacement over the first 3.5 seconds of the R1 panic braking maneuver for Driver 49, a younger male driving the Volvo S80
Figure 106. This graph shows the change in the Driver’s brake pedal displacement over the first 3.5 seconds of the braking maneuver. It can be seen that the brake pedal was pressed quickly upon onset. A displacement of 0.42 in was produced in the first 0.05 second, reaching a displacement of 2.68 inches in the first 0.25 seconds. BAS was activated 0.15 seconds into the stop, and ABS was activated 0.25 seconds into the stop. The liner regression for data ranging from the first brake pedal displacement inflection point to the last inflection point is described by the equation y = -0.1018x + 2.7384. The R-squared value of the regression was 0.2741. The braking maneuver yielded a stopping distance of 75.57 ft.
223

Figure 107. Brake pedal displacement over the first 3.5 seconds of the R2 panic braking maneuver for Driver 49, a younger male driving the Volvo S80
Figure 107. This graph shows the change in the Driver’s brake pedal displacement over the first 3.5 seconds of the braking maneuver. It can be seen that the brake pedal was pressed slowly upon onset. A displacement of 0.14 in was produced in the first 0.05 second, reaching a displacement of 2.67 inches in the first 0.3 seconds. BAS was activated 0.1 seconds into the stop, and ABS was activated 0.2 seconds into the stop. The liner regression for data ranging from the first brake pedal displacement inflection point to the last inflection point is described by the equation y = 0.2342x + 2.3693. The R-squared value of the regression was 0.4217. The braking maneuver yielded a stopping distance of 73.33 ft.
224

Figure 108. Brake pedal displacement over the first 3.5 seconds of the R3 panic braking maneuver for Driver 49, a younger male driving the Volvo S80
Figure 108. This graph shows the change in the Driver’s brake pedal displacement over the first 3.5 seconds of the braking maneuver. It can be seen that the brake pedal was pressed quickly upon onset. A displacement of 0.49 in was produced in the first 0.05 second, reaching a displacement of 2.63 inches in the first 0.20 seconds. BAS was not activated for this stop, and ABS was activated 0.2 seconds into the stop. The liner regression for data ranging from the first brake pedal displacement inflection point to the last inflection point is described by the equation y = 0.0121x + 2.7005. The R-squared value of the regression was 0.0076. The braking maneuver yielded a stopping distance of 71.65 ft.
225

Driver 50 Repeated Braking Session
Figure 109, Figure 110, and Figure 111 portray Driver 50’s braking maneuvers for stops R1, R2, and R3 respectively. BAS and ABS were activated for R1as well as R2. BAS was not activated during the R3 stop because the system was disabled. The Driver was able to activate ABS during the R3 braking maneuver. Driver 50 was included in the enabled-disabled condition and drove the Volvo S80.
Figure 109. Brake pedal displacement over the first 3.5 seconds of the R1 panic braking maneuver for Driver 50, a younger female driving the Volvo S80
Figure 109. This graph shows the change in the Driver’s brake pedal displacement over the first 3.5 seconds of the braking maneuver. It can be seen that the brake pedal was pressed quickly upon onset. A displacement of 0.61 in was produced in the first 0.05 second, reaching a displacement of 2.56 inches in the first 0.2 seconds. BAS was activated 0.05 seconds into the stop, and ABS was activated 0.2 seconds into the stop. The liner regression for data ranging from the first brake pedal displacement inflection point to the last inflection point is described by the equation y = -0.0973x + 2.5253. The R-squared value of the regression was 0.6799. The braking maneuver yielded a stopping distance of 62.63 ft.
226

Figure 110. Brake pedal displacement over the first 3 seconds of the R2 panic braking maneuver for Driver 50, a younger female driving the Volvo S80
Figure 110. This graph shows the change in the Driver’s brake pedal displacement over the first 3 seconds of the braking maneuver. It can be seen that the brake pedal was pressed somewhat quickly upon onset. A displacement of 0.35 in was produced in the first 0.05 second, reaching a displacement of 2.49 inches in the first 0.3 seconds. BAS was activated 0.1 second into the stop, and ABS was activated 0.25 seconds into the stop. The liner regression for data ranging from the first brake pedal displacement inflection point to the last inflection point is described by the equation y = -0.0181x + 2.4407. The R-squared value of the regression was 0.0127. The braking maneuver yielded a stopping distance of 61.29 ft.
227

Figure 111. Brake pedal displacement over the first 3.5 seconds of the R3 panic braking maneuver for Driver 50, a younger female driving the Volvo S80
Figure 111. This graph shows the change in the Driver’s brake pedal displacement over the first 3.5 seconds of the braking maneuver. It can be seen that the brake pedal was pressed very quickly upon onset. A displacement of 0.84 in was produced in the first 0.05 second, reaching a displacement of 2.67 inches in the first 0.3 seconds. BAS was not activated for this stop, and ABS was activated 0.25 seconds into the stop. The liner regression for data ranging from the first brake pedal displacement inflection point to the last inflection point is described by the equation y = -0.0195x + 2.5109. The R-squared value of the regression was 0.0306. The braking maneuver yielded a stopping distance of 65.65 ft.
228

Driver 52 Repeated Braking Session
Figure 112, Figure 113, and Figure 114 portray Driver 52’s braking maneuvers for stops R1, R2, and R3 respectively. BAS and ABS were activated for R1as well as R2. BAS was not activated during the R3 stop because the system was disabled. The Driver was able to activate ABS during the R3 braking maneuver. Driver 52 was included in the enabled-disabled condition and drove the Volvo S80.
Figure 112. Brake pedal displacement over the first 3.5 seconds of the R1 panic braking maneuver for Driver 52, a younger female driving the Volvo S80
Figure 112. This graph shows the change in the Driver’s brake pedal displacement over the first 3.5 seconds of the braking maneuver. It can be seen that the brake pedal was pressed slowly upon onset. A displacement of 0.06 in was produced in the first 0.05 second, reaching a displacement of 2.6 inches in the first 0.35 seconds. BAS was activated 0.1 second into the stop, and ABS was activated 0.35 seconds into the stop. The liner regression for data ranging from the first brake pedal displacement inflection point to the last inflection point is described by the equation y = 0.035x + 2.4476. The R-squared value of the regression was 0.0317. The braking maneuver yielded a stopping distance of 67.98 ft.
229

Figure 113. Brake pedal displacement over the first 3.5 seconds of the R2 panic braking maneuver for Driver 52, a younger female driving the Volvo S80
Figure 113. This graph shows the change in the Driver’s brake pedal displacement over the first 3.5 seconds of the braking maneuver. It can be seen that the brake pedal was pressed slowly upon onset. A displacement of 0.1 in was produced in the first 0.05 second, reaching a displacement of 2.56 inches in the first 0.3 seconds. BAS was activated 0.15 seconds into the stop, and ABS was activated 0.3 seconds into the stop. The liner regression for data ranging from the first brake pedal displacement inflection point to the last inflection point is described by the equation y = 0.1251x + 2.5964. The R-squared value of the regression was 0.7372. The braking maneuver yielded a stopping distance of 66.08 ft.
230

Figure 114. Brake pedal displacement over the first 3 seconds of the R3 panic braking maneuver for Driver 52, a younger female driving the Volvo S80
Figure 114. This graph shows the change in the Driver’s brake pedal displacement over the first 3.5 seconds of the braking maneuver. It can be seen that the brake pedal was pressed slowly upon onset. A displacement of 0.08 in was produced in the first 0.05 second, reaching a displacement of 2.68 inches in the first 0.35 seconds. BAS was not activated for this stop, and ABS was activated 0.3 seconds into the stop. The liner regression for data ranging from the first brake pedal displacement inflection point to the last inflection point is described by the equation y = 0.0046x + 2.5307. The R-squared value of the regression was 0.0008. The braking maneuver yielded a stopping distance of 67.42 ft.
231

Driver 55 Repeated Braking Session
Figure 115, Figure 116, and Figure 117 portray Driver 55’s braking maneuvers for stops R1, R2, and R3 respectively. BAS was not activated for either R1 or R2 because the system was disabled. The Driver was able to activate ABS for both R1 and R2. During the R3 stop, the Driver activated BAS as well as ABS. Driver 55 was included in the disabled-enabled condition and drove the Volvo S80.
Figure 115. Brake pedal displacement over the first 3.5 seconds of the R1 panic braking maneuver for Driver 55, a younger female driving the Volvo S80
Figure 115. This graph shows the change in the Driver’s brake pedal displacement over the first 3.5 seconds of the braking maneuver. It can be seen that the brake pedal was pressed quickly upon onset. A displacement of 0.55 in was produced in the first 0.05 second, reaching a displacement of 2.55 inches in the first 0.3 seconds. BAS was not activated for this stop, and ABS was activated 0.35 seconds into the stop. The liner regression for data ranging from the first brake pedal displacement inflection point to the last inflection point is described by the equation y = -0.0029x + 2.4111. The R-squared value of the regression was 0.0003. The braking maneuver yielded a stopping distance of 68.18 ft.
232

Figure 116. Brake pedal displacement over the first 3 seconds of the R2 panic braking maneuver for Driver 55, a younger female driving the Volvo S80
Figure 116. This graph shows the change in the Driver’s brake pedal displacement over the first 3 seconds of the braking maneuver. It can be seen that the brake pedal was pressed somewhat quickly upon onset. A displacement of 0.31 in was produced in the first 0.05 second, reaching a displacement of 2.52 inches in the first 0.25 seconds. BAS was not activated for this stop, and ABS was activated 0.3 seconds into the stop. The liner regression for data ranging from the first brake pedal displacement inflection point to the last inflection point is described by the equation y = -0.1044x + 2.4265. The R-squared value of the regression was 0.3878. The braking maneuver yielded a stopping distance of 66.01 ft
233

Figure 117. Brake pedal displacement over the first 4 seconds of the R3 panic braking maneuver for Driver 55, a younger female driving the Volvo S80
Figure 117. This graph shows the change in the Driver’s brake pedal displacement over the first 4 seconds of the braking maneuver. It can be seen that the brake pedal was pressed quickly upon onset. A displacement of 0.43 in was produced in the first 0.05 second, reaching a displacement of 2.6 inches in the first 0.3 seconds. BAS was activated 0.1 seconds into the stop, and ABS was activated 0.25 seconds into the stop. The liner regression for data ranging from the first brake pedal displacement inflection point to the last inflection point is described by the equation y = -0.4372x + 6.676. The R-squared value of the regression was 0.5286. The braking maneuver yielded a stopping distance of 64.44 ft.
234

Driver 58 Repeated Braking Session
Figure 118, Figure 119, and Figure 120 portray Driver 58’s braking maneuvers for stops R1, R2, and R3 respectively. BAS and ABS were activated for R1. Although BAS was enabled for R1, the Driver failed to activate the system, however, was successful in activating ABS. The Driver did not activate BAS during R3 because the system was disabled. ABS was activated by the Driver for the R3 stop. Driver 58 was included in the enabled-disabled condition and drove the Volvo S80.
Figure 118. Brake pedal displacement over the first 2.5 seconds of the R1 panic braking maneuver for Driver 58, a younger male driving the Volvo S80
Figure 118. This graph shows the change in the Driver’s brake pedal displacement over the first 2.5 seconds of the braking maneuver. It can be seen that the brake pedal was pressed quickly upon onset. A displacement of 0.61 in was produced in the first 0.05 second, reaching a displacement of 2.6 inches in the first 0.25 seconds. BAS was activated 0.05 seconds into the stop, and ABS was activated 0.3 seconds into the stop. The liner regression for data ranging from the first brake pedal displacement inflection point to the last inflection point is described by the equation y = -0.0984x + 2.6147. The R-squared value of the regression was 0.1825. The braking maneuver yielded a stopping distance of 68.08 ft.
235

Figure 119. Brake pedal displacement over the first 3.5 seconds of the R2 panic braking maneuver for Driver 58, a younger male driving the Volvo S80
Figure 119. This graph shows the change in the Driver’s brake pedal displacement over the first 3.5 seconds of the braking maneuver. It can be seen that the brake pedal was pressed quickly upon onset. A displacement of 0.78 in was produced in the first 0.05 second, reaching a displacement of 2.37 inches in the first 0.3 seconds. BAS was not activated for this stop, and ABS was activated 0.25 seconds into the stop. The liner regression for data ranging from the first brake pedal displacement inflection point to the last inflection point is described by the equation y = 0.1954x + 2.1851. The R-squared value of the regression was 0.6551. The braking maneuver yielded a stopping distance of 71.82 ft.
236

Figure 120. Brake pedal displacement over the first 3 seconds of the R3 panic braking maneuver for Driver 58, a younger male driving the Volvo S80
Figure 120. This graph shows the change in the Driver’s brake pedal displacement over the first 3 seconds of the braking maneuver. It can be seen that the brake pedal was pressed very quickly upon onset. A displacement of 0.94 in was produced in the first 0.05 second, reaching a displacement of 2.74 inches in the first 0.25 seconds. BAS was not activated for this stop, and ABS was activated 0.25 seconds into the stop. The liner regression for data ranging from the first brake pedal displacement inflection point to the last inflection point is described by the equation y = 0.1681x + 2.5818. The R-squared value of the regression was 0.3352. The braking maneuver yielded a stopping distance of 69.32 ft.
237

Driver 62 Repeated Braking Session
Figure 121, Figure 122, and Figure 123 portray Driver 62’s braking maneuvers for stops R1, R2, and R3 respectively. BAS was not activated for stops R1 and R2 because the system was disabled. The Driver activated ABS for both R1 and R2. BAS and ABS were activated by the Driver during R3. Driver 62 was included in the disabled-enabled condition and drove the Volvo S80.
Figure 121. Brake pedal displacement over the first 3.5 seconds of the R1 panic braking maneuver for Driver 62, a younger male driving the Volvo S80
Figure 121. This graph shows the change in the Driver’s brake pedal displacement over the first 3.5 seconds of the braking maneuver. It can be seen that the brake pedal was pressed quickly upon onset. A displacement of 0.54 in was produced in the first 0.05 second, reaching a displacement of 2.83 inches in the first 0.45 seconds. BAS was not activated for this stop, and ABS was activated 0.45 seconds into the stop. The liner regression for data ranging from the first brake pedal displacement inflection point to the last inflection point is described by the equation y = -0.07x + 2.7237. The R-squared value of the regression was 0.2299. The braking maneuver yielded a stopping distance of 71.72 ft.
238

Figure 122. Brake pedal displacement over the first 3.5 seconds of the R2 panic braking maneuver for Driver 62, a younger male driving the Volvo S80
Figure 122. This graph shows the change in the Driver’s brake pedal displacement over the first 3.5 seconds of the braking maneuver. It can be seen that the brake pedal was pressed extremely fast upon onset. A displacement of 1.6 in was produced in the first 0.05 second, reaching a displacement of 2.63 inches in the first 0.25 seconds. BAS was not activated for this stop, and ABS was activated 0.3 seconds into the stop. The liner regression for data ranging from the first brake pedal displacement inflection point to the last inflection point is described by the equation y = -0.0554x + 2.5917. The R-squared value of the regression was 0.258. The braking maneuver yielded a stopping distance of 67.55 ft.
239

Figure 123. Brake pedal displacement over the first 3.5 seconds of the R3 panic braking maneuver for Driver 62, a younger male driving the Volvo S80
Figure 123. This graph shows the change in the Driver’s brake pedal displacement over the first 2.5 seconds of the braking maneuver. It can be seen that the brake pedal was pressed somewhat slowly upon onset. A displacement of 0.21 in was produced in the first 0.05 second, reaching a displacement of 2.78 inches in the first 0.3 seconds. BAS was activated 0.1 seconds into the stop, and ABS was activated 0.3 seconds into the stop. The liner regression for data ranging from the first brake pedal displacement inflection point to the last inflection point is described by the equation y = -0.1803x + 2.8457. The R-squared value of the regression was 0.9179. The braking maneuver yielded a stopping distance of 75.36 ft.
240

Driver 63 Repeated Braking Session
Figure 124, Figure 125, and Figure 126 portray Driver 63’s braking maneuvers for stops R1, R2, and R3 respectively. BAS was not activated for stops R1 and R2 because the system was disabled. The Driver activated ABS for both R1 and R2. BAS and ABS were activated by the Driver during R3. Driver 63 was included in the disabled-enabled condition and drove the Volvo S80.
Figure 124. Brake pedal displacement over the first 5 seconds of the R1 panic braking maneuver for Driver 63, a younger male driving the Volvo S80
Figure 124. This graph shows the change in the Driver’s brake pedal displacement over the first 5 seconds of the braking maneuver. It can be seen that the brake pedal was pressed quickly upon onset. A displacement of 0.52 in was produced in the first 0.05 second, reaching a displacement of 2.83 inches in the first 0.35 seconds. BAS was not activated for this stop, and ABS was activated 0.35 seconds into the stop. The liner regression for data ranging from the first brake pedal displacement inflection point to the last inflection point is described by the equation y = -0.0382x + 2.6856. The R-squared value of the regression was 0.0637. The braking maneuver yielded a stopping distance of 63.97 ft.
241

Figure 125. Brake pedal displacement over the first 3 seconds of the R2 panic braking maneuver for Driver 63, a younger male driving the Volvo S80
Figure 125. This graph shows the change in the Driver’s brake pedal displacement over the first 3 seconds of the braking maneuver. It can be seen that the brake pedal was pressed very quickly upon onset. A displacement of 0.84 in was produced in the first 0.05 second, reaching a displacement of 2.74 inches in the first 0.2 seconds. BAS was not activated for this stop, and ABS was activated 0.25 seconds into the stop. The liner regression for data ranging from the first brake pedal displacement inflection point to the last inflection point is described by the equation y = -0.0756x + 2.8113. The R-squared value of the regression was 0.13. The braking maneuver yielded a stopping distance of 56.89 ft.
242

Figure 126. Brake pedal displacement over the first 2.5 seconds of the R3 panic braking maneuver for Driver 63, a younger male driving the Volvo S80
Figure 126. This graph shows the change in the Driver’s brake pedal displacement over the first 2.5 seconds of the braking maneuver. It can be seen that the brake pedal was pressed quickly upon onset. A displacement of 0.64 in was produced in the first 0.05 second, reaching a displacement of 2.87 inches in the first 0.35 seconds. BAS was activated 0.05 seconds into the stop, and ABS was activated 0.3 seconds into the stop. The liner regression for data ranging from the first brake pedal displacement inflection point to the last inflection point is described by the equation y = -0.0613x + 2.7631. The R-squared value of the regression was 0.1358. The braking maneuver yielded a stopping distance of 66.73 ft.
243

Driver 64 Repeated Braking Session
Figure 127, Figure 128, and Figure 129 portray Driver 64’s braking maneuvers for stops R1, R2, and R3 respectively. BAS was not activated for stops R1 and R2 because the system was disabled. The Driver activated ABS for both R1 and R2. BAS and ABS were activated by the Driver during R3. Driver 64 was included in the disabled-enabled condition and drove the Volvo S80.
Figure 127. Brake pedal displacement over the first 3.5 seconds of the R1 panic braking maneuver for Driver 64, a younger male driving the Volvo S80
Figure 127. This graph shows the change in the Driver’s brake pedal displacement over the first 3.5 seconds of the braking maneuver. It can be seen that the brake pedal was pressed quickly upon onset. A displacement of 0.52 in was produced in the first 0.05 second, reaching a displacement of 2.49 inches in the first 0.35 seconds. BAS was not activated for this stop, and ABS was activated 0.25 seconds into the stop. The liner regression for data ranging from the first brake pedal displacement inflection point to the last inflection point is described by the equation y = 0.0075x + 2.3289. The R-squared value of the regression was 0.0038. The braking maneuver yielded a stopping distance of 68.34 ft.
244

Figure 128. Brake pedal displacement over the first 3.5 seconds of the R2 panic braking maneuver for Driver 64, a younger male driving the Volvo S80
Figure 128. This graph shows the change in the Driver’s brake pedal displacement over the first 3.5 seconds of the braking maneuver. It can be seen that the brake pedal was pressed slowly upon onset. A displacement of 0.13 in was produced in the first 0.05 second, reaching a displacement of 2.74 inches in the first 0.35 seconds. BAS was not activated for this stop, and ABS was activated 0.3 seconds into the stop. The liner regression for data ranging from the first brake pedal displacement inflection point to the last inflection point is described by the equation y = 0.124x + 2.4987. The R-squared value of the regression was 0.3333. The braking maneuver yielded a stopping distance of 72.18 ft.
245

Figure 129. Brake pedal displacement over the first 3.5 seconds of the R3 panic braking maneuver for Driver 64, a younger male driving the Volvo S80
Figure 129. This graph shows the change in the Driver’s brake pedal displacement over the first 3.5 seconds of the braking maneuver. It can be seen that the brake pedal was pressed quickly upon onset. A displacement of 0.68 in was produced in the first 0.05 second, reaching a displacement of 2.67 inches in the first 0.25 seconds. BAS was activated 0.05 seconds into the stop, and ABS was activated 0.25 seconds into the stop. The liner regression for data ranging from the first brake pedal displacement inflection point to the last inflection point is described by the equation y = -0.1503x + 2.6233. The R-squared value of the regression was 0.7858. The braking maneuver yielded a stopping distance of 73.03 ft.
246

Driver 65 Repeated Braking Session
Figure 130, Figure 131, and Figure 132 portray Driver 65’s braking maneuvers for stops R1, R2, and R3 respectively. BAS and ABS were activated for R1. Although BAS was enabled for R2, the Driver failed to activate it. ABS was activated by the Driver during R2. BAS was not activated in R3 because the system was disabled, however ABS was activated. Driver 65 was included in the enabled-disabled condition and drove the Volvo S80.
Figure 130. Brake pedal displacement over the first 3.5 seconds of the R1 panic braking maneuver for Driver 65, a younger female driving the Volvo S80
Figure 130. This graph shows the change in the Driver’s brake pedal displacement over the first 3.5 seconds of the braking maneuver. It can be seen that the brake pedal was pressed quickly upon onset. A displacement of 0.65 in was produced in the first 0.05 second, reaching a displacement of 2.69 inches in the first 0.25 seconds. BAS was activated 0.1 seconds into the stop, and ABS was activated 0.25 seconds into the stop. The liner regression for data ranging from the first brake pedal displacement inflection point to the last inflection point is described by the equation y = -0.402x + 2.8379. The R-squared value of the regression was 0.9106. The braking maneuver yielded a stopping distance of 72.73 ft.
247

Figure 131. Brake pedal displacement over the first 3.5 seconds of the R2 panic braking maneuver for Driver 65, a younger female driving the Volvo S80
Figure 131. This graph shows the change in the Driver’s brake pedal displacement over the first 3.5 seconds of the braking maneuver. It can be seen that the brake pedal was pressed quickly upon onset. A displacement of 0.79 in was produced in the first 0.05 second, reaching a displacement of 2.64 inches in the first 0.25 seconds. BAS was not activated for this stop, and ABS was activated 0.2 seconds into the stop. The liner regression for data ranging from the first brake pedal displacement inflection point to the last inflection point is described by the equation y = -0.6581x + 2.751. The R-squared value of the regression was 0.8398. The braking maneuver yielded a stopping distance of 76.44 ft.
248

Figure 132. Brake pedal displacement over the first 3.5 seconds of the R3 panic braking maneuver for Driver 65, a younger female driving the Volvo S80
Figure 132. This graph shows the change in the Driver’s brake pedal displacement over the first 3.5 seconds of the braking maneuver. It can be seen that the brake pedal was pressed slowly upon onset. A displacement of 0.11 in was produced in the first 0.05 second, reaching a displacement of 2.05 inches in the first 0.35 seconds. BAS was not activated for this stop, and ABS was activated 1.3 seconds into the stop. The liner regression for data ranging from the first brake pedal displacement inflection point to the last inflection point is described by the equation y = 0.2087x + 1.9796. The R-squared value of the regression was 0.7007. The braking maneuver yielded a stopping distance of 85.20 ft.
249

Driver 70 Repeated Braking Session
Figure 133, Figure 134, and Figure 135 portray Driver 70’s braking maneuvers for stops R1, R2, and R3 respectively. Although BAS was enabled for R1, the Driver failed to activate it. ABS was activated by the Driver during R1. BAS and ABS were activated in R2. BAS was not activated in R3 because the system was disabled, however ABS was activated. Driver 70 was included in the enabled-disabled condition and drove the Volvo S80.
Figure 133. Brake pedal displacement over the first 3.5 seconds of the R1 panic braking maneuver for Driver 70, an older female driving the Volvo S80
Figure 133. This graph shows the change in the Driver’s brake pedal displacement over the first 3.5 seconds of the braking maneuver. It can be seen that the brake pedal was pressed somewhat quickly upon onset. A displacement of 0.38 in was produced in the first 0.05 second, reaching a displacement of 2.35 inches in the first 0.75 seconds. BAS was not activated for this stop, and ABS was activated 0.85 seconds into the stop. The liner regression for data ranging from the first brake pedal displacement inflection point to the last inflection point is described by the equation y = -0.1374x + 2.4194. The R-squared value of the regression was 0.4211. The braking maneuver yielded a stopping distance of 77.66 ft.
250
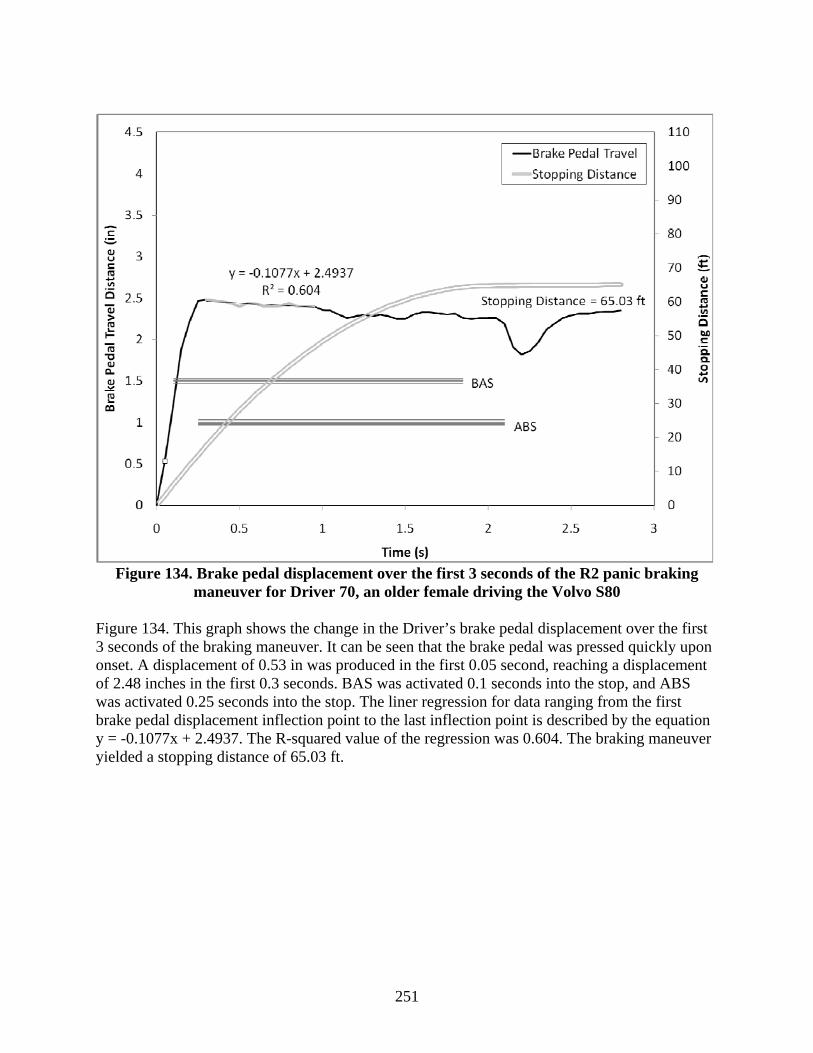
Figure 134. Brake pedal displacement over the first 3 seconds of the R2 panic braking maneuver for Driver 70, an older female driving the Volvo S80
Figure 134. This graph shows the change in the Driver’s brake pedal displacement over the first 3 seconds of the braking maneuver. It can be seen that the brake pedal was pressed quickly upon onset. A displacement of 0.53 in was produced in the first 0.05 second, reaching a displacement of 2.48 inches in the first 0.3 seconds. BAS was activated 0.1 seconds into the stop, and ABS was activated 0.25 seconds into the stop. The liner regression for data ranging from the first brake pedal displacement inflection point to the last inflection point is described by the equation y = -0.1077x + 2.4937. The R-squared value of the regression was 0.604. The braking maneuver yielded a stopping distance of 65.03 ft.
251

Figure 135. Brake pedal displacement over the first 3 seconds of the R3 panic braking maneuver for Driver 70, an older female driving the Volvo S80
Figure 135. This graph shows the change in the Driver’s brake pedal displacement over the first 3.5 seconds of the braking maneuver. It can be seen that the brake pedal was pressed somewhat quickly upon onset. A displacement of 0.48 in was produced in the first 0.05 second, reaching a displacement of 2.54 inches in the first 0.55 seconds. BAS was not activated for this stop, and ABS was activated 0.5 seconds into the stop. The liner regression for data ranging from the first brake pedal displacement inflection point to the last inflection point is described by the equation y = -0.5143x + 2.8405. The R-squared value of the regression was 0.8305. The braking maneuver yielded a stopping distance of 67.45 ft.
252

ACKNOWLEDGEMENTS
This research was funded by the National Highway Traffic Safety Administration (NHTSA) under DTNH22-05-D-01019, Task Order Number 8. The authors wish to express their gratitude to Dr. Paul Rau, Task Order Manager, for his technical direction, insight, and support throughout the entire project.
Additionally, the authors wish to thank Garrick Forkenbrock, Bob Jones, Larry Jolliff, and colleagues at the NHTSA Vehicle Research Test Center (VRTC) for their assistance with the characterization of the brake assist systems evaluated in this research effort.
The authors also wish to express their gratitude to Dan Selke and Dr. Joerg Breuer of Mercedes-Benz, as well as Henrik Wiberg, Bruno DiGennaro, and Bodmar Magnus of Volvo Cars, for their assistance with the project.
This study would not have been possible without the hard work and ingenuity of the Center for Technology Development. Their dedication to instrumented vehicles and data collection made the requirements for this data collection effort possible. The dedicated group of technicians and engineers under the direction of Andy Alden, Jared Bryson, and Carl Cospel include: Reggie Bryson, Mike Ellery, Fang Fuang, Donald Gautier, Travis Graham, Julie Jermeland, Dave Mellichamp, Matt Moeller, Stacy Payne, Jerald Peppers, Matt Perez, Kenny Smith, Ryan Talbot, Jeff Taylor, and Jean Paul Talledo Viela.
The authors would also like to thank Shelby McDonald, Rory Brannan, and Matthew Camden for their assistance with data collection and reporting.
253

REFERENCES
AASHTO (2001). A Policy on Geometric Design of Highways and Streets. Washington, DC: AASHTO.
Blanco, M., Hickman, J. S., Klauer, S. G., & Hanowski, R. J. (2006). The new generation human factors naturalistic driving research: A proactive approach to enhance safety. Paper presented at the Proceedings of the 6th Annual Intelligent Vehicle Systems Symposium. National Defense Industrial Association.
Breuer, J. J., Faulhaber, A., Frank, P., & Gleissner, S. (2007). Real World Safety Benefits of Brake Assistance Systems. Paper presented at the 20th International Technical Conference on the Enhanced Safety of Vehilces.
Creer, B. Y., Smedal, H. A., & Wingrove, R. C. (1960). Centrifuge study of pilot tolerance to acceleration and the effects of acceleration on pilot performance. . Moffett Field, CA: NASA Ames Research Center.
Delaigue, P., & Eskandarian, A. (2005). A comprehensive vehicle braking model for predictions of stopping distances. Proceedings from the Institution of Mechanical Engineers, 218(Part D: Automobile Engineering), 1409-1417.
Fambro, D. B., Koppa, R. J., Picha, D. L., & Fitzpatrick, K. (2000). Driver braking performance in stopping sight distance situations. Transportation Research Record, 1701, 9-16.
Feigel, H. J., & Schonlau, J. (1999). Mechanical Brake Assist – A Potential New Standard Safety Feature (SAE Paper No. 1999-01-0480). Detroit, Michigan: Society for Automotive Engineers.
Forkenbrock, G. (2006). The contribution of the BAS installed in a 2003 Ford Expedition evaluated by NHTSA In G. M. Fitch (Ed.). Blacksburg.
Forkenbrock, G., Flick, M., & Garrott, W. R. (1999a). A Comprehensive Light Vehicle Antilock Brake System Test Track Performance Evaluation (SAE Paper No. 1999-01-1287). (SAE Technical Paper): Society of Automotive Engineers.
Forkenbrock, G. J., Flick, M., & Garrott, W. R. (1999b). NHTSA Light Vehicle Antilock Brake System Research Program Task 4: A Test Track Study of Light Vehicle ABS Performance Over a Broad Range of Surfaces and Maneuvers. (Final Report No. DOT HS 808 875): National Highway Traffic Safety Administration.
Hancock, P. A., Lesch, M., & Simmons, L. (2003). The distraction effects of phone use during a crucial driving maneuver. Accident Analysis and Prevention, 35(4), 501-214.
Hara, M., Ohta, M., Yamamoto, A., & Yoshida, H. (1998). Development of Brake Assist Systems., Paper No. 98-S2-P-17 (pp. 497-501): Society of Automotive Engineers of Japan Paper Series.
Kiefer, R. J., LeBlanc, D. J., & Flannagan, C. A. (2005). Developing an inverse time-to-collision crash alert timing approach based on drivers' last-second braking and steering judgments. Accident Analysis and Prevention, 37, 295-303.
Mazzae, E. N., Baldwin, G.H.S., and McGehee, D.V. (1999). Driver Crash Avoidance Behavior with ABS in an Intersection Incursion Scenario on the Iowa Driving Simulator (SAE Paper No. 1999-01-1290). (SAE Technical Paper): Society of Automotive Engineers.
Mazzae, E. N., Barickman, F., Baldwin, G. H. S., & Forkenbrock, G. (1999). Driver Crash Avoidance Behavior with ABS in an Intersection Incursion Scenario on Dry Versus Wet Pavement (SAE Paper No. 1999-01-1288). Detroit, Michigan: Society of Automotive Engineers.
254

McLaughlin, S. B., Hankey, J. M., & Dingus, T. A. (2005). Enhanced Night Visibility Series, Volume XIII: Phase III—Study 1: Comparison of Near Infrared, Far Infrared, High Intensity Discharge, and Halogen Headlamps on Object Detection in Nighttime Clear Weather (No. FHWA-HRT-04-144). Blacksburg, VA: Virginia Tech Transportation Institute.
Page, Y., Foret-Bruno, J.-Y., & Cuny, S. (2005). Are expected and observed effectiveness of emergency brake assist in preventing road injury accidents consistent?, Paper No. 05-0268 (pp. 11): Society of Automotive Engineers of Japan Paper Series.
Society of Automotive Engineers (1993). SAE J299: Stopping Distance Test Procedure. Sorniotti, A. (2006). Virtual and Experimental Analysis of Brake Assist Systems (SAE Paper No.
2006-01-0477). Detroit, Michigan: Society of Automotive Engineers. Strickland, A., & Dagg, K. (1998). ABS Braking Performance and Steering Input (SAE Paper
No. 980240). Detroit, Michigan: Society of Automotive Engineers. Traffic Engineering Handbook (1992). Washington, DC: ITE. Yoshida, H., Sugitani, T., Ohta, M., Kizaki, Yamamoto, A., and Shirai, K. (1998). Development
of the Brake Assist System (SAE Paper No. 980601). Toyota Motor Corporation.
255

DOT HS 811 251April 2010