human population trends 2006 update elizabeth willott the university of arizona © 2006...
TRANSCRIPT

Human Population Trends 2006 update
Elizabeth Willott
The University of Arizona
© 2006

Northwest Mutual’s Longevity Game: http://www.nmfn.com/tn/learnctr--lifeevents--longevity
How long do they predict you’ll live?
How much is within your control?
Just for Fun

Paul Ehrlich, The Population Bomb, 1968
“The battle to feed all of humanity is over. In the 1970’s the world will undergo famines. Hundreds of millions of people are going to starve to death in spite of any crash programs embarked upon now. At this late date nothing can prevent a substantial increase in the world death rate.” p. xi

Obtaining Data: Key SourcesMost statistics, unless otherwise indicated,
are from one or more of the following:
• US Census: International Datahttp://www.census.gov
• CIA World Factbook 2006http://www.cia.gov/cia/publications/factbook
• UN Population Divisionhttp://esa.un.org/unpp/

The reason for the problem?
We became highly successful at controlling disease and death.

Paul Ehrlich, The Population Bomb, 1968
“Medical science, with its efficient public health programs, has been able to depress the death rate with astonishing rapidity and at the same time drastically increase the birth rate; healthier people have more babies.” (p.32)

DDT, an insecticide, worked effectively in reducing malaria in many developing countries.
E.g., Sri Lanka (then Ceylon)
Year Deaths per 1000 people
1946 22
1955 10
Note: this is not death rate due to malaria, but total death rate. Source: Ehrlich. The Population Bomb, 1971, p.16
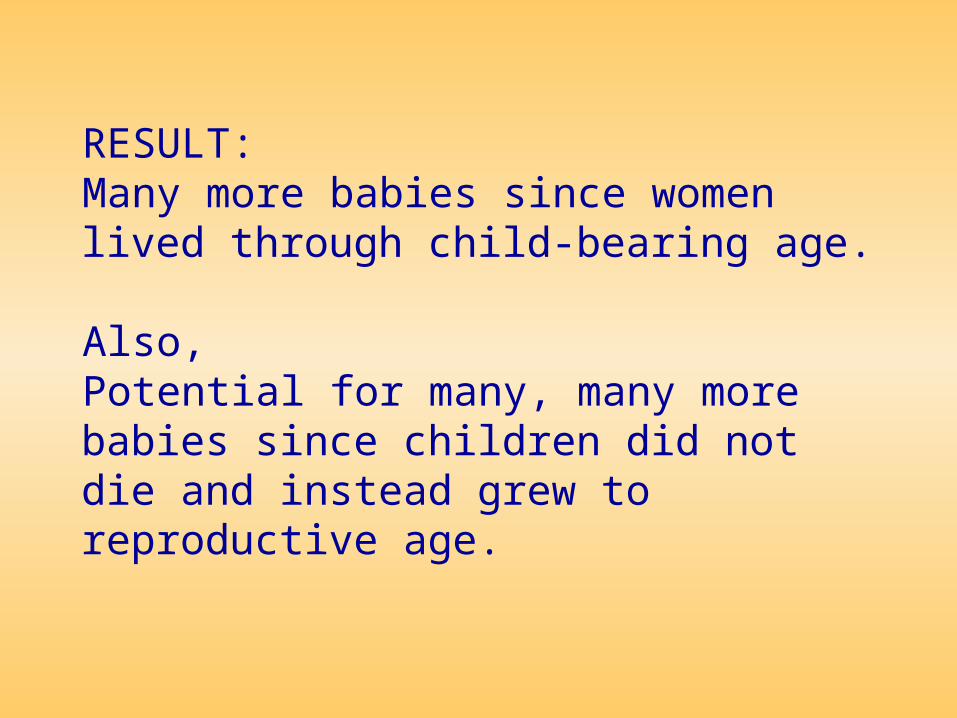
RESULT:Many more babies since women lived through child-bearing age.
Also, Potential for many, many more babies since children did not die and instead grew to reproductive age.

Simple basic ecology:
Remove the predators (in this case the micropredators
such as microbial diseases) and the prey increase.

Net increase in a population is due to:• births, B= Birth rate• immigration, I= Immigration rate• emigration, E= Emigration rate• deaths, D= Death rate
dN/dt = (B + I) - (E + D)
If we consider the world population then dN/dt = Birthrate - Deathrate
For more info: EO Wilson, WH Bossart, A primer of population ecology, c1971, Sinauer Associates.NJ Gotelli, A primer of ecology, c1995, Sinauer Associates.

In classic population ecology,
If, for any given time period, Births > Deaths then Population will always be increasing,
And,IF Birth Rate and Death Rate are constants,
THEN, the population size is given by an exponential equation.

An Exponential Equation, like y = 2x, or, in this case Nf= Ni x 1.5x
0
40
80
120
160
200
0 2 4 6 8 10 12 14
Was, or is, human population like this?

0
0.5
1
1.5
2
2.5
3
3.5
1000 1250 1500 1750 2000
Year
Population in billions
Human Population to 1960

0
1
2
3
4
5
6
7
1000 1250 1500 1750 2000
Year
Population in billions
Human Population to 2005
Source: UN Population Figures http://esa.un.org/unpp/
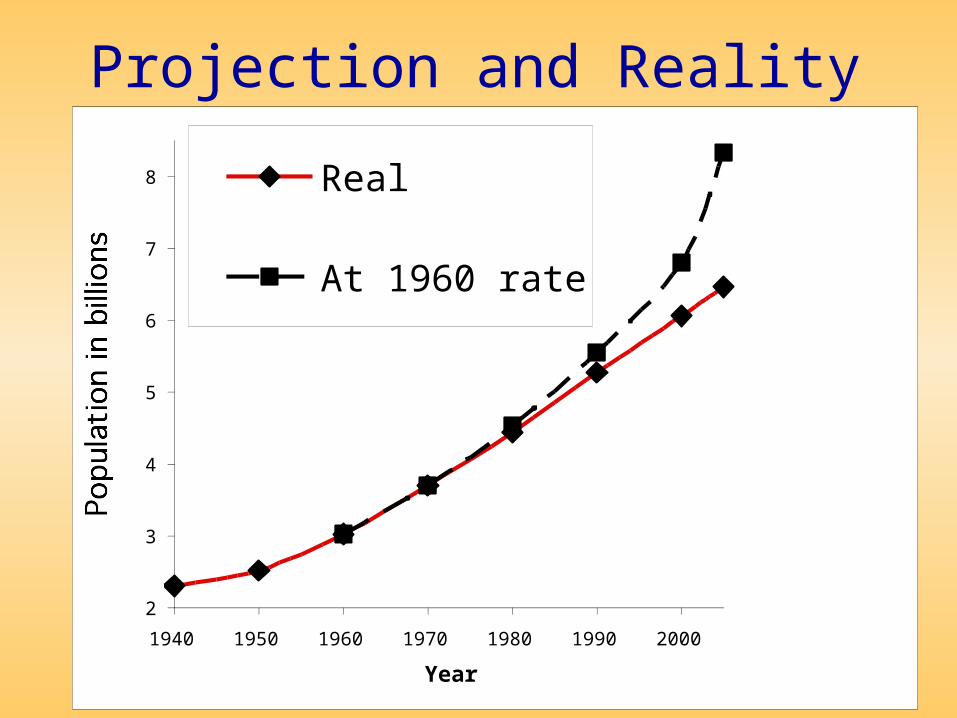
Projection and Reality
2
3
4
5
6
7
8
1940 1950 1960 1970 1980 1990 2000
Year
Population in billions
Real
At 1960 rate

Projection and Reality
How is the gap best explained?What’s happened to
• Overall rate?• Birth rate?• Death rate?
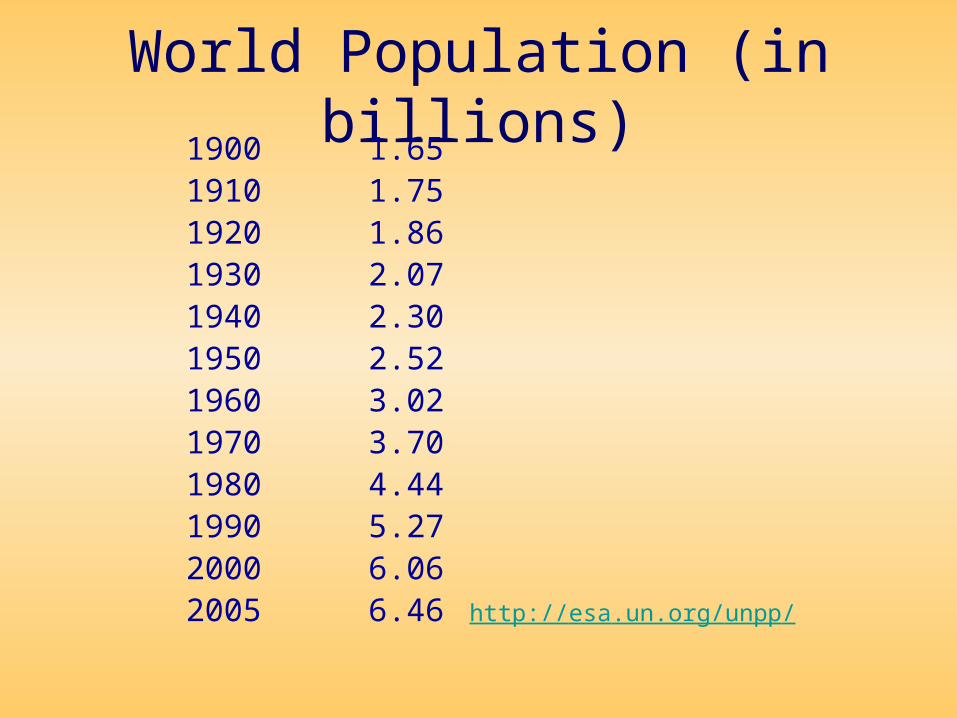
World Population (in billions)1900 1.651910 1.751920 1.861930 2.071940 2.301950 2.521960 3.021970 3.701980 4.441990 5.272000 6.062005 6.46 http://esa.un.org/unpp/

World Population (in billions)1900 1.65 % increase1910 1.75 ((1.75/1.65)-1) x 1001920 1.861930 2.071940 2.301950 2.521960 3.021970 3.701980 4.441990 5.272000 6.062005 6.46 http://esa.un.org/unpp/

World Population (in billions)1900 1.65 % increase1910 1.75 6.11920 1.86 6.31930 2.07 11.31940 2.30 11.11950 2.52 9.61960 3.02 19.81970 3.70 22.51980 4.44 20.01990 5.27 18.72000 6.06 15.02005 6.46

Rate of Population Change per Decade
0
5
10
15
20
25
1900-19101910-19201920-19301930-19401940-19501950-19601960-19701970-19801980-19901990-2000
Years
% Change1900-1910
1910-1920
1920-1930
1930-1940
1940-1950
1950-1960
1960-1970
1970-1980
1980-1990
1990-2000
Decade
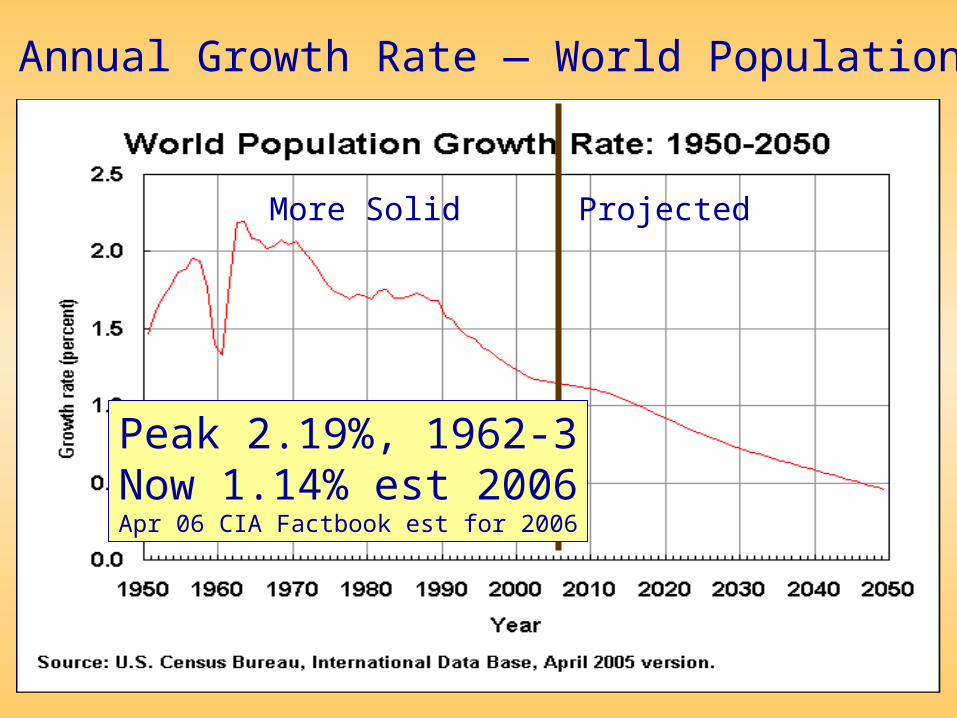
ProjectedMore Solid
Peak 2.19%, 1962-3Now 1.14% est 2006Apr 06 CIA Factbook est for 2006
Annual Growth Rate — World Population

I’ve presented data showing the world population is not increasing exponentially.
The growth rate has been decreasing.
What’s happening in absolute numbers of people added per year?
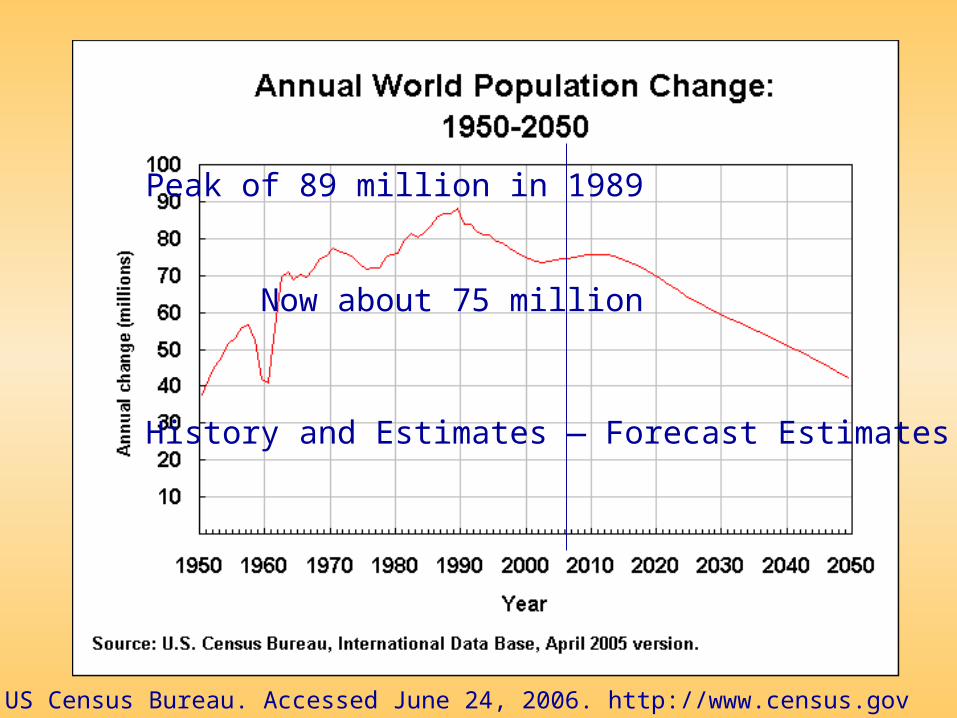
US Census Bureau. Accessed June 24, 2006. http://www.census.gov
Peak of 89 million in 1989
Now about 75 million
History and Estimates — Forecast Estimates
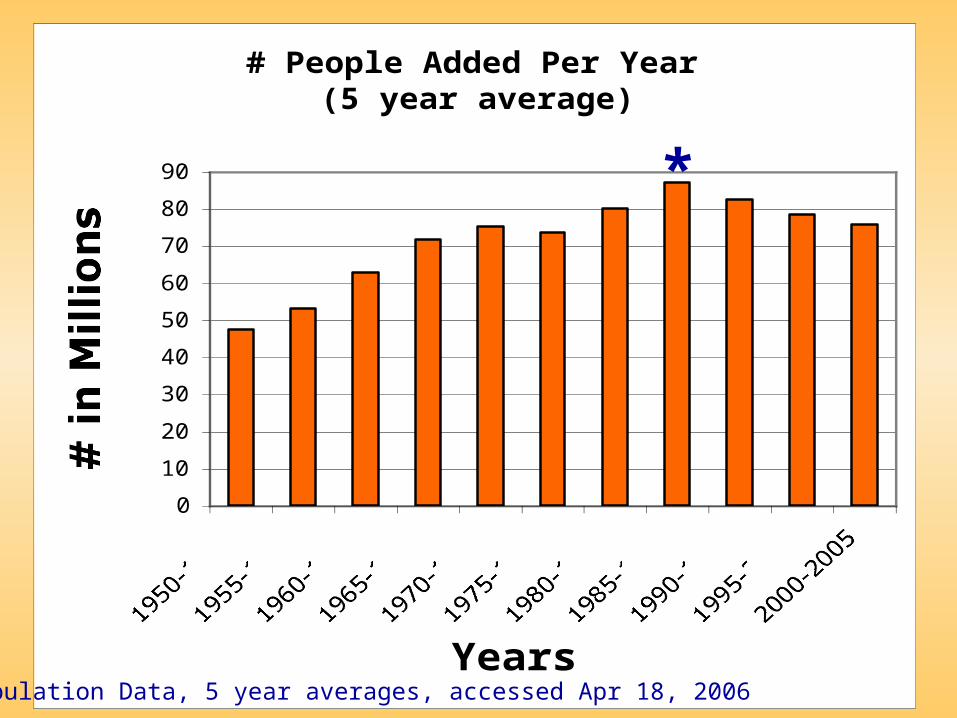
# People Added Per Year (5 year average)
0
10
20
30
40
50
60
70
80
90
1950-19551955-19601960-19651965-19701970-19751975-19801980-19851985-19901990-19951995-20002000-2005
Years
# in Millions
UN Population Data, 5 year averages, accessed Apr 18, 2006
*

# of People Added to World
1989 94.4 million people added.
2006 74.4 million.
Source: CIA World Factbook
(for 2006: world population x 0.0114)

The rate of increase has declined.
The absolute number of people added has started to decline.
Still, we have major increases.
1. What counts for the overall increase in population?
Many countries have shown dramatic decreases in death rates.
This is seen as
• an increase in longevity, or,
• decrease in mortality, or,
• in particular, decrease in infant mortality

Lifespan (World)
UN Population Division:
1950-1955: 46.6 years
2000-2005: 65.4 years
Increase of > 40%Source: http://esa.un.org/unpp/
CIA World Factbook: 1989: 62 years
2006: 65 yearsSource: http://www.cia.gov/cia/publications/factbook (accessed June 22, 2006)
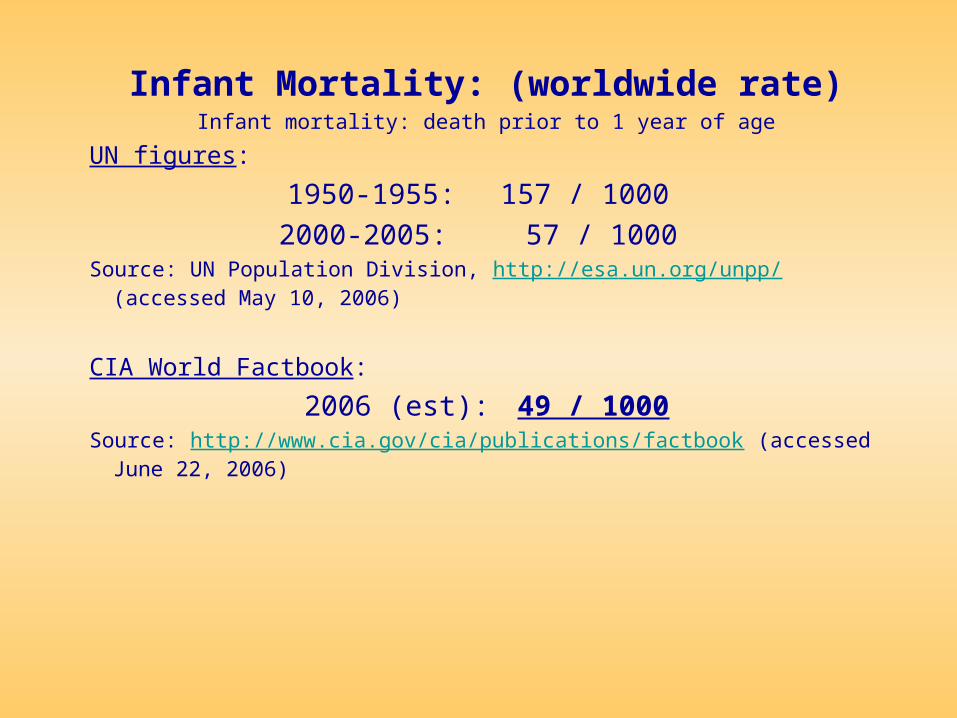
Infant Mortality: (worldwide rate)Infant mortality: death prior to 1 year of age
UN figures:
1950-1955: 157 / 1000
2000-2005: 57 / 1000 Source: UN Population Division, http://esa.un.org/unpp/ (accessed May 10, 2006)
CIA World Factbook:
2006 (est): 49 / 1000Source: http://www.cia.gov/cia/publications/factbook (accessed June 22, 2006)

More women survive through child-bearing years, more babies born.
More children survive to child-bearing years.
Therefore, potential exists for even more babies to be born.
This explosive burst is what Garrett Hardin and Paul Ehrlich, back in the 1960’s and early 1970’s, envisioned happening.It didn’t.

Did women have more and more babies?
Worldwide
Births per Year (TOTAL numbers)
1950-1955: 99,044,000
2000-2005: 132,508,000Source: UN Population Division: http://esa.un.org/unpp/
There are more babies now, true.
But the population is much larger, too.
These numbers don’t support individual women having more and more babies.
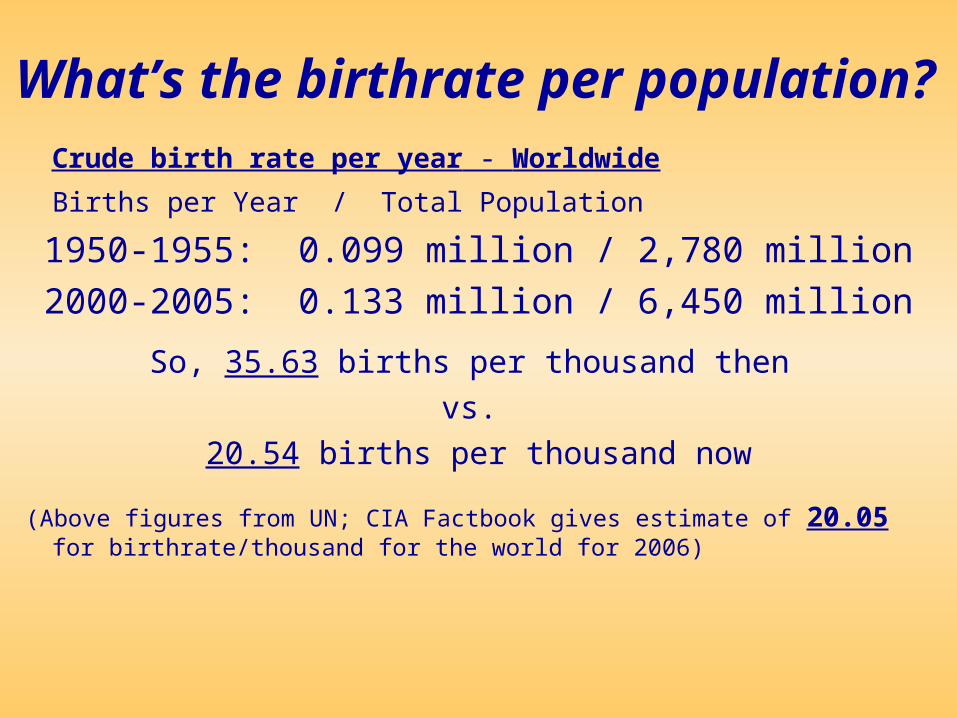
Crude birth rate per year - Worldwide
Births per Year / Total Population
1950-1955: 0.099 million / 2,780 million
2000-2005: 0.133 million / 6,450 million
So, 35.63 births per thousand then
vs.
20.54 births per thousand now
(Above figures from UN; CIA Factbook gives estimate of 20.05 for birthrate/thousand for the world for 2006)
What’s the birthrate per population?
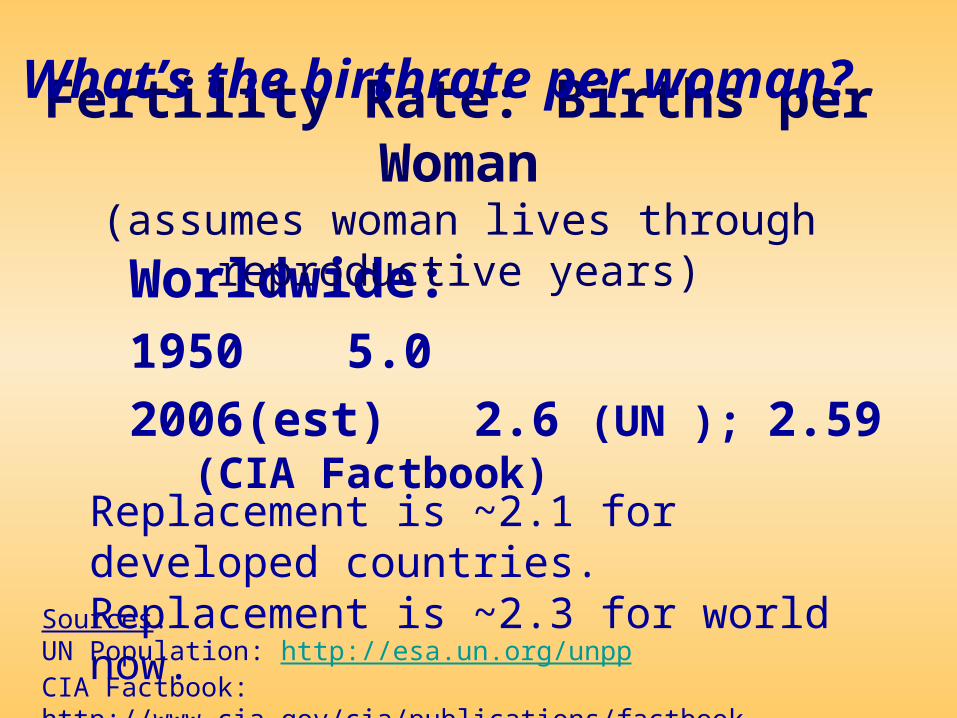
Worldwide:1950 5.0
2006(est) 2.6 (UN ); 2.59 (CIA Factbook)
Fertility Rate: Births per Woman(assumes woman lives through reproductive years)
Sources: UN Population: http://esa.un.org/unppCIA Factbook: http://www.cia.gov/cia/publications/factbook
Replacement is ~2.1 for developed countries. Replacement is ~2.3 for world now.
What’s the birthrate per woman?

One well-documented correlation:When women have educational opportunities, birth rate drops quickly.
Prehaps women having other opportunities is the key, not just educational ones. When women have other opportunities, birth rate drops relatively quickly.

The Point?
Women don’t seem to be like calculating shepherds—wanting as many children as they can bear as long as someone else is feeding them (as Hardin conjectured).
Nor do they seem to be solely biological automatons determined by evolution to bear babies in high number.

Examples:India GuatemalaHaiti United StatesIran ChinaPakistan IndonesiaSouth Africa NigerNigeria
(There are ~238 countries in the world.)

IndiaPopulation 1,095 million Pop. growth rate 1.38 %
Total fertility rate 2.73 children/women
Life expectancy at birth 64.71 yrs
Birth rate 22.01 / 1000 Death rate 8.18 / 1000
Median age 24.9 yrs HIV rate: 0.9 %
Infant mortality 54.63 / 1000 live births
Literacy rate 59.5 % Land phones: 67.3 million- Male 70.2 % Cell phones: 69.2 million- Female 48.3 % Internet users: 50.6 million
SOURCE: CIA World Factbook, June 2006.


Andra Pradesh, India.
Area of very rapid economic and cultural change presently (last 15 years or so).Higher proportion of illiterate women now use birth control.Their daughters are much more likely to go to school.
Bhat, P. N. M. (2002). "Returning a favor: reciprocity between female education and fertility in India." World Development 30(10): 1791-1803.McNay, K. and P. Arokiasamy, R.H. Cassen (2003) Why are uneducated women in India using contraception? A multilevel analysis. Population Studies 57 (1) 21-40.

Education and Fertility
Education Level of Woman
FertilityRate of Woman(Family Size)

Fertility and Education
Family Size(particularly of illiterate mothers)
Education of Offspring
Children of illiterate mothers are more likely
to attend school if family size is limited

Andra Pradesh, India
Deccan Development Society: work with Dalit (untouchable) women to help them improve their livelihoods in Andra Pradesh.
This area is undergoing rapid social change co-incident with a dramatic decrease in fertility of illiterate women in recent years.
For article on DDS, see Rao, V. R. (2002). Women farmers of India's Deccan Plateau: ecofeminists challenge world elites. Environmental ethics: what really matters, what really works. D. Schmidtz and E. Willott. New York, Oxford University Press: 255-262.

The DDS in Andra Pradesh, IndiaAmong other projects, the DDS provided microloans to untouchable women so women could have cell phone to rent to others, thereby generating a livelihood for themselves.In so doing, this also worked to change the culture since suddenly the phones were “touchable” and it became acceptable to negotiate with the untouchable women.The breakdown of the caste system is making more opportunities available for women.
This cell-phone project is only possible as a society transitions from no phones to many people having cell phones. The current DDS website does not discuss the cell-phone project any longer.
DDS website is found at http://www.ddsindia.com/www/default.asp

What’s Happening With Phones?
From CIA Factbook for 2006:Landlines worldwide: 1.21 billionCell phones worldwide: 1.75 billionInternet users 1.02 billion

United StatesPopulation 298.4 million Pop. growth rate 0.91 %
Total fertility rate 2.09 children/women
Life expectancy at birth 77.85 yrs
Birth rate 14.14 / 1000 Death rate 8.26 / 1000
Median age 36.5 yrs HIV rate: 0.6 %
Infant mortality 6.43 / 1000 live births
Literacy rate 99 % Land phones: 268 million- Male 99 % Cell phones: 194.5million- Female 99 % Internet users: 203.4 million
SOURCE: CIA World Factbook, June 2006.

US 2006MALE FEMALE
Population in millionsSource: US. Census Bureau, Apr 2006, estimates for 2006
5 year age increments

MALE FEMALE
Source: US. Census Bureau, Apr 2006, estimates for 2006
US 2006
US 1960
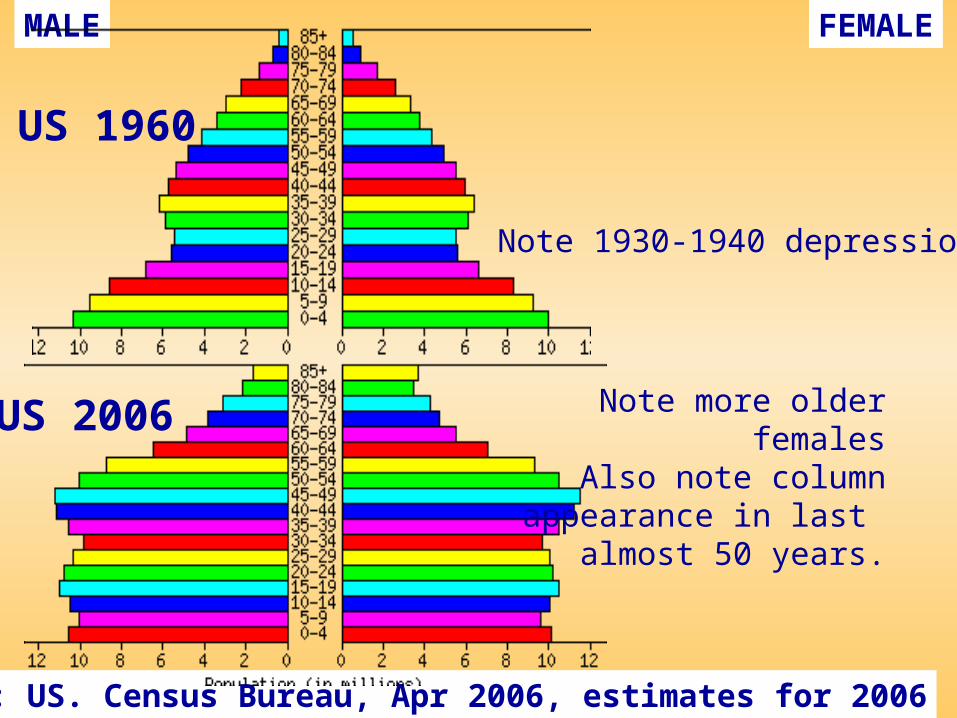
MALE FEMALE
Source: US. Census Bureau, Apr 2006, estimates for 2006
US 2006
US 1960
Note 1930-1940 depression
Note more older femalesAlso note column
appearance in last almost 50 years.

GuatemalaPopulation 12.3 million Pop. growth rate 2.27 %
Total fertility rate 3.82 children/women
Life expectancy at birth 69.38 yrs
Birth rate 29.88 / 1000 Death rate 5.22 / 1000
Median age 18.9 yrs HIV rate: 1.1 %
Infant mortality 39.94 / 1000 live births
Literacy rate 70.6 % Land phones: 1.13 million- Male 78 % Cell phones: 3.17 million- Female 63.3 % Internet users: 0.76 million
SOURCE: CIA World Factbook, June 2006.

GuatemalaBabies per woman:
1990: 5.6
1999: 4.8
2006 est. 3.8Was highest fertility rate in the Americas.
Now Haiti is highest with 4.94.
CIA Factbook, est for 2006
http://www.cia.gov/cia/publications/factbook/geos/xx.html Also US Census: http://www.census.gov

Guatemala
1981 1991
2006 Note change in lowest 3-4 bars in these years.Guatemala not expanding in rate as it was 15 years ago
Still, a high proportion of the population are children and there are many of them!
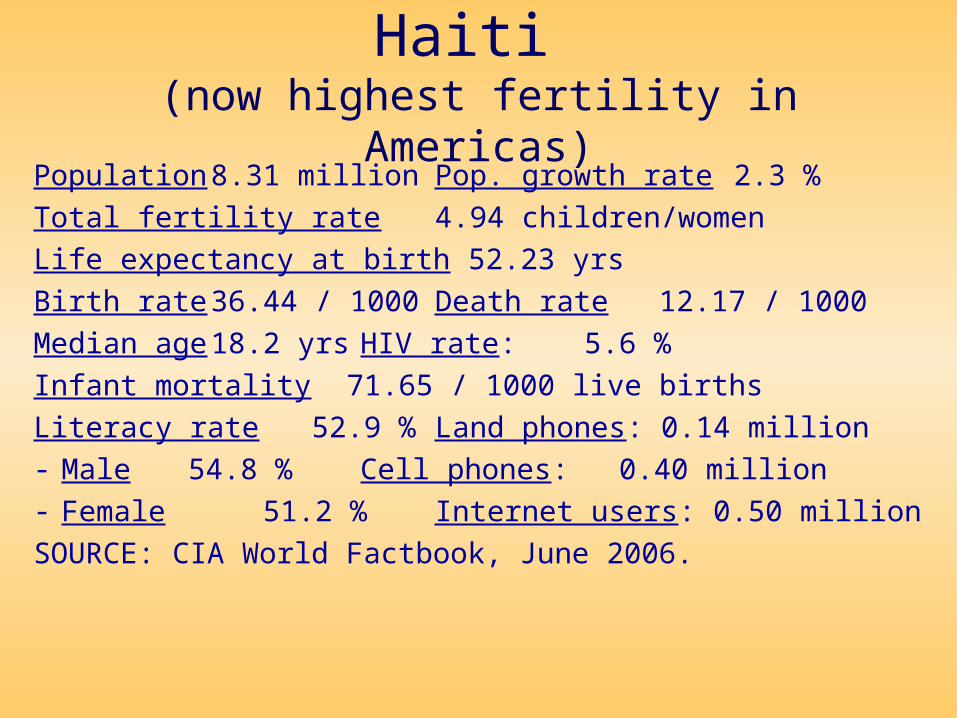
Haiti (now highest fertility in Americas)
Population 8.31 million Pop. growth rate 2.3 %
Total fertility rate 4.94 children/women
Life expectancy at birth 52.23 yrs
Birth rate 36.44 / 1000 Death rate 12.17 / 1000
Median age 18.2 yrs HIV rate: 5.6 %
Infant mortality 71.65 / 1000 live births
Literacy rate 52.9 %Land phones: 0.14 million- Male 54.8 % Cell phones: 0.40 million- Female 51.2 % Internet users: 0.50 million
SOURCE: CIA World Factbook, June 2006.

Haiti1986
2006 NOTE: More females in older categories.
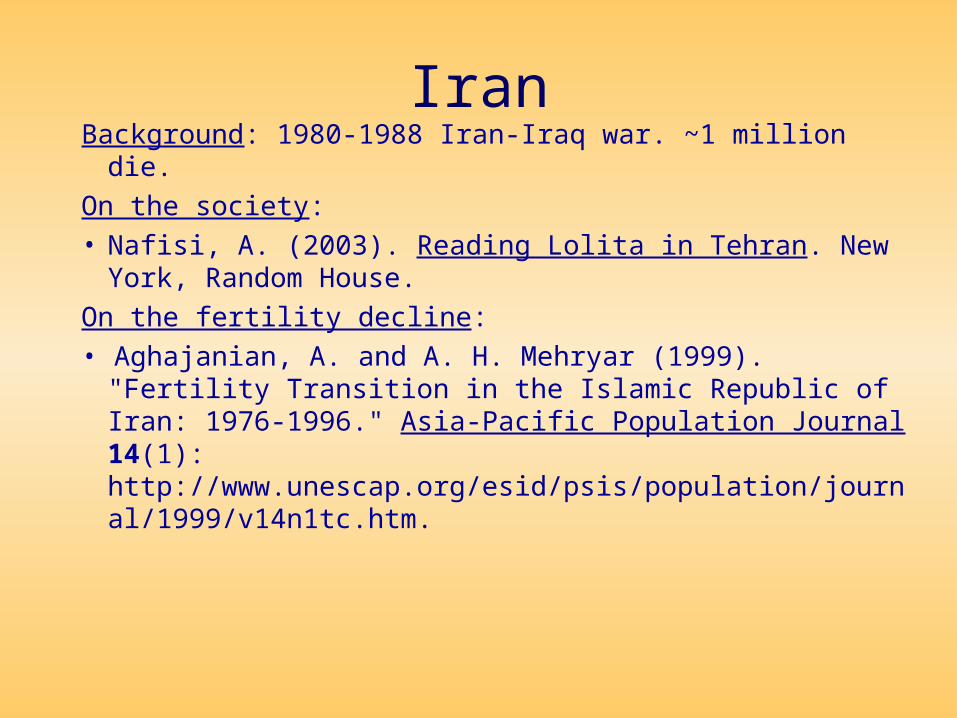
IranBackground: 1980-1988 Iran-Iraq war. ~1 million die.
On the society: • Nafisi, A. (2003). Reading Lolita in Tehran. New York,
Random House.
On the fertility decline:
• Aghajanian, A. and A. H. Mehryar (1999). "Fertility Transition in the Islamic Republic of Iran: 1976-1996." Asia-Pacific Population Journal 14(1): http://www.unescap.org/esid/psis/population/journal/1999/v14n1tc.htm.

IranPopulation 68.7 million Pop. growth rate 1.1 %
Total fertility rate 1.8 children/women
Life expectancy at birth 70.26 yrs
Birth rate 17 / 1000 Death rate 5.55 / 1000
Median age 24.8 yrs HIV rate: < 0.1 %
Infant mortality 40.3 / 1000 live births
Literacy rate 70.26 % Land phones: 14.6 million- Male 79.4 % Cell phones: 4.3 million- Female 73 % Internet users: 7.5 million
SOURCE: CIA World Factbook, June 2006.

Iran, 1986
Iran, 2006
*
*
Note “boat” shape in 2006, versus acceleration
shape of 1986
Looks as if ~600,000 babies born ~1980-1985
did not survive to adulthood.
Would be good to compare 1991, 1996, 2001
as well to see if pattern emerges
Can it be cell-phones? Well, really communication and possible opportunities
There was no way Ehrlich or Hardin could have predicted this.
Nor the UN, nor US Census bureau, nor CIA.Anecdotal evidence suggests cell phones may play
role! Guatemala radically deregulated phones a few years
ago.Iranian mother of two of my students mentioned cell
phones and satellite TV as reason for decreased birth rate in Iran

Andra Pradesh, India
Deccan Development Society: work with Dalit (untouchable) women to help them improve their livelihoods in Andra Pradesh.
This area is undergoing rapid social change co-incident with a dramatic decrease in fertility of illiterate women in recent years.
For article on DDS, see Rao, V. R. (2002). Women farmers of India's Deccan Plateau: ecofeminists challenge world elites. Environmental ethics: what really matters, what really works. D. Schmidtz and E. Willott. New York, Oxford University Press: 255-262.
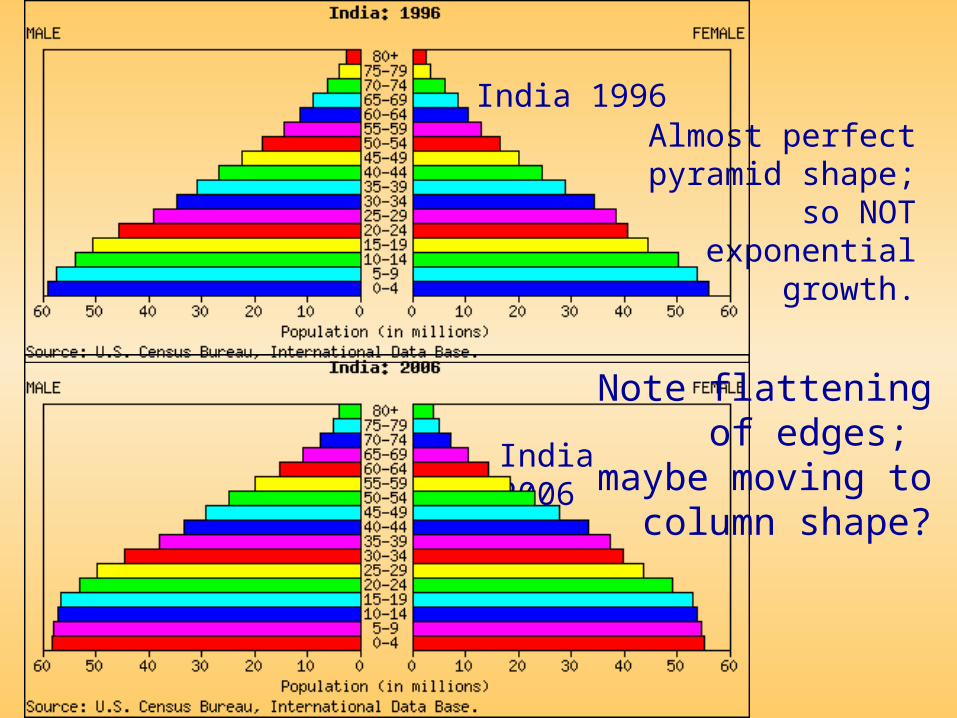
India 1996
India 2006
Note flattening of edges; maybe moving to
column shape?
Almost perfect pyramid shape; so NOT
exponential growth.

ChinaPopulation 1314 millionPop. growth rate 0.59 %
Total fertility rate 1.73 children/women
Life expectancy at birth 72.58 yrs
Birth rate 13.25 / 1000 Death rate 6.97 / 1000
Median age 32.7 yrs HIV rate: 0.1 %
Infant mortality 23.12 / 1000 live births
Literacy rate 90.9 %Land phones: 312 million- Male 95.1 % Cell phones: 335 million- Female 86.5 % Internet users: 111 million
SOURCE: CIA World Factbook, June 2006.

China 1991
China 2006
Note:“Boat” shape of last 20 years.
2006 Male:Female Sex Ratios: 0-4 yr old: 1.158
5-9 yr old: 1.155
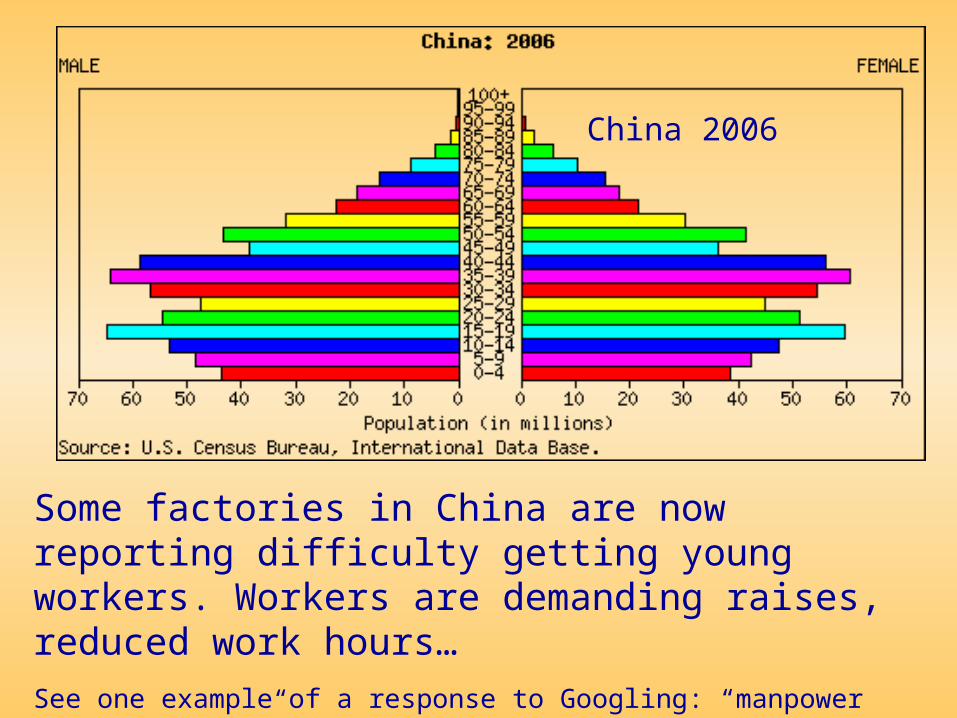
Some factories in China are now reporting difficulty getting young workers. Workers are demanding raises, reduced work hours…
See one example of a response to Googling: “manpower shortage China”http://news.yahoo.com/s/csm/20060501/ts_csm/ohelpwanted
China 2006
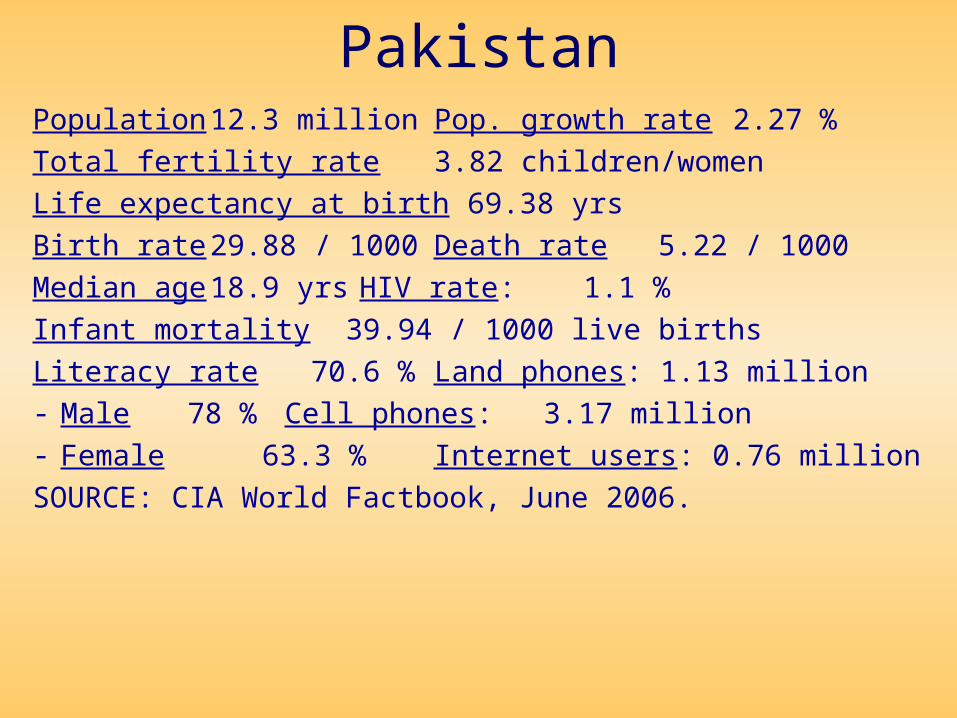
PakistanPopulation 12.3 million Pop. growth rate 2.27 %
Total fertility rate 3.82 children/women
Life expectancy at birth 69.38 yrs
Birth rate 29.88 / 1000 Death rate 5.22 / 1000
Median age 18.9 yrs HIV rate: 1.1 %
Infant mortality 39.94 / 1000 live births
Literacy rate 70.6 %Land phones: 1.13 million- Male 78 % Cell phones: 3.17 million- Female 63.3 % Internet users: 0.76 million
SOURCE: CIA World Factbook, June 2006.

Pakistan2006
Pakistan1986

IndonesiaPopulation 245.5 million Pop. growth rate 1.41 %
Total fertility rate 2.4 children/women
Life expectancy at birth 69.87 yrs
Birth rate 20.34 / 1000 Death rate 6.25 / 1000
Median age 26.8 yrs HIV rate: <0.1 %
Infant mortality 34.39 / 1000 live births
Literacy rate 87.9 % Land phones: 9.99 million- Male 92.5 % Cell phones: 30 million- Female 83.4 % Internet users: 18 million
SOURCE: CIA World Factbook, June 2006.

Indonesia1991
Indonesia2006
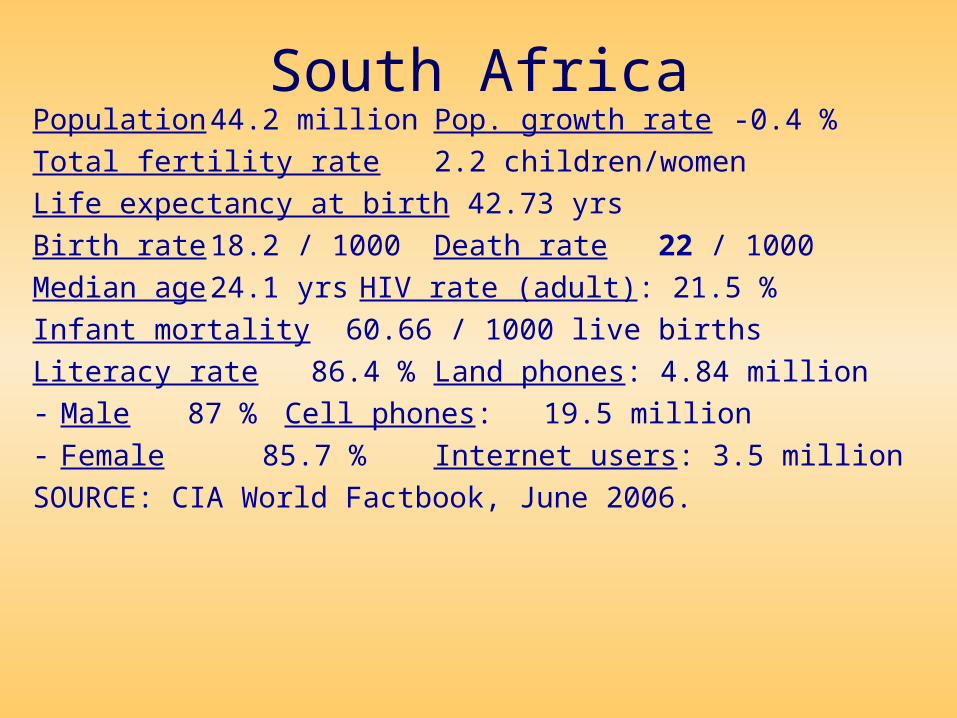
South AfricaPopulation 44.2 million Pop. growth rate -0.4 %
Total fertility rate 2.2 children/women
Life expectancy at birth 42.73 yrs
Birth rate 18.2 / 1000 Death rate 22 / 1000
Median age 24.1 yrs HIV rate (adult): 21.5 %
Infant mortality 60.66 / 1000 live births
Literacy rate 86.4 % Land phones: 4.84 million- Male 87 % Cell phones: 19.5 million- Female 85.7 % Internet users: 3.5 million
SOURCE: CIA World Factbook, June 2006.

South Africa
1986
South Africa
2006
Note step-like character to 1986, and
subsequent boat-like shape of 2006.
HIV/AIDS is prevalent in South Africa leading to increased deaths
of infants and young children. Also, condoms are effective
contraception and condom use is up due to HIV/AIDS.

Only a few countries are not showing a reduction in fertility rate (if higher than replacement).
The majority of those countries are involved, or were recently involved, in war.
Countries with high fertility rates are mainly in Africa and the Middle East, plus Afghanistan.Most of Europe, the far east, and southeast Asia are below replacement fertility.

WorldPopulation 6525 millionPop. growth rate 1.14 %
Total fertility rate 2.59 children/women
Life expectancy at birth 64.77 yrs
Birth rate 20.05 / 1000 Death rate 8.67 / 1000
Median age 27 yrsHIV rate: N/A
Infant mortality 48.87 / 1000 live births
Literacy rate 82 % Land phones: 1.21 billion- Male 87 % Cell phones: 1.75 billion- Female 77 % Internet users: 1.12 billion
SOURCE: CIA World Factbook, June 2006.

Worldwide Fertility Rate/Woman1996 2.87
1997 2.84
1998 2.80
1999 2.76
2000 2.73
2001 2.70
2002 2.67
2003 2.65
2004 2.63
2005 2.61
2006 2.59
Replacement is ~2.3

Population increase still occurs if
1. Increase in longevity2. Lots of youngsters still growing up!

Changes in Population Pyramid - World(Numbers indicate % of total population)
http://esa.un.org/unpp/p2k0data.asp
1955 1996 20050-9 25.9 21.2 18.7
10-19 18.8 19.1 18.7
20-29 16.2 17.3 16.9
30-39 12.6 14.4 15.1
40-49 10.6 11.0 10.8
50-59 7.8 7.4 9.2
60-69 5.1 5.5 5.6
70-79 2.5 3.0 3.5
80+ 0.6 1.1 1.4
Age
Cat
egor
ies

The Changing World Profile - Age Distribution (%)Data source: US Census; http://www.census.gov
1955
0.0 5.0 10.0 15.0 20.0 25.0 30.0
0-9
10-19
20-29
30-39
40-49
50-59
60-69
70-79
80+
1996
0.0 5.0 10.0 15.0 20.0 25.0
0-9
10-19
20-29
30-39
40-49
50-59
60-69
70-79
80+
2006
0.0 5.0 10.0 15.0 20.0
0-9
10-19
20-29
30-39
40-49
50-59
60-69
70-79
80+
0 250 500 750 1000 1250
0-9
10-19
20-29
30-39
40-49
50-59
60-69
70-79
80-89
Population (in millions)
Age Category
200619961955
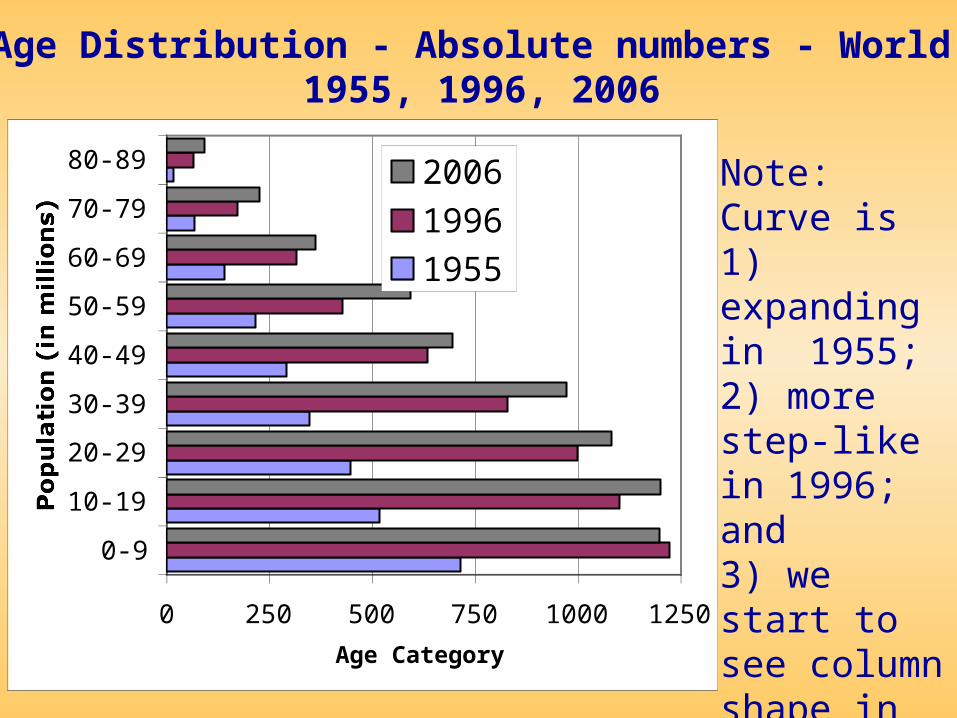
Age Distribution - Absolute numbers - World 1955, 1996, 2006
Note: Curve is 1) expanding in 1955; 2) more step-like in 1996; and3) we start to see column shape in 2006.Data: US Census

Population increase still occurs if
1. Increase in longevity2. Lots of youngsters still growing up!
HIV/AIDS is causing decreases in population in most-effected countries.
Prevention via condoms is effective birth control!

Countries with high fertility/woman rates:
SOURCE: US Census Bureau, International Data Base; accessed June 22, 2006. http://www.census.gov/
(All countries ≥ 6 babies/women are listed above.)
Niger 7.46
Mali 7.42
Somalia 6.76
Uganda 6.71
Afghanistan 6.69
Yemen 6.58
Burundi 6.55
Burkina Faso 6.47
Congo (Kinshasa) 6.45
Angola 6.35
Chad 6.25
Sierra Leone 6.08
Congo (Brazzaville)
6.07
Liberia 6.02
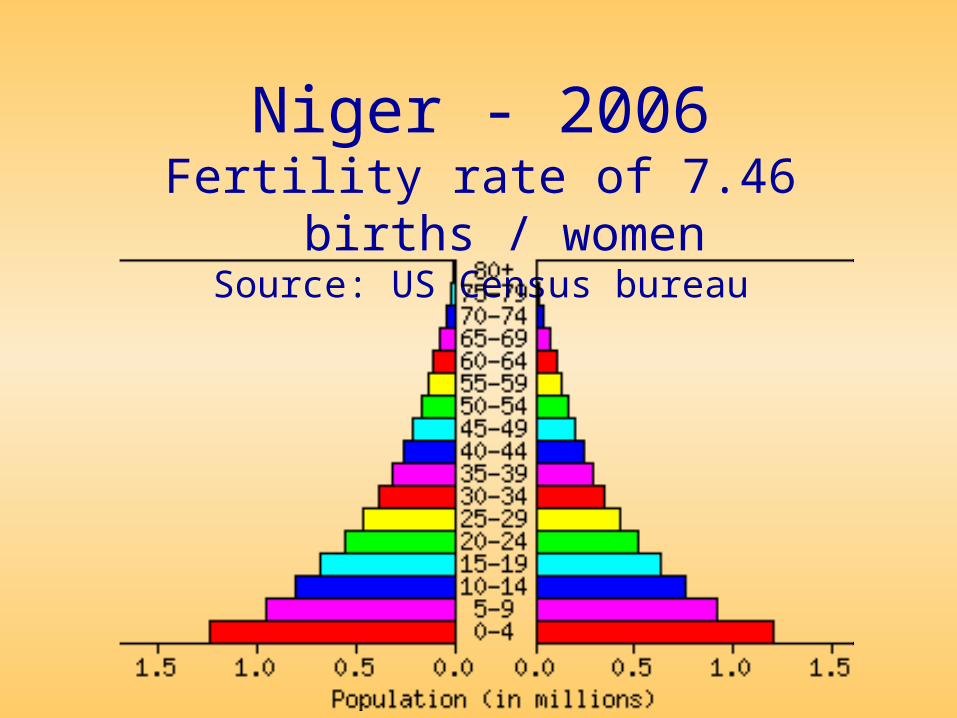
Niger - 2006Fertility rate of 7.46 births / women
Source: US Census bureau

NigerPopulation 12.5 million Pop. growth rate 2.92 %
Total fertility rate 7.46 children/women
Life expectancy at birth 43.76 yrs
Birth rate 50.73 / 1000 Death rate 20.91 / 1000
Median age 16.5 yrs HIV rate: 1.2 %
Infant mortality 118.3 / 1000 live births
Literacy rate 17.6 %Land phones: 0.024 million- Male 25 % Cell phones: 0.148 million- Female 9.7 % Internet users: 0.024 million
SOURCE: CIA World Factbook, June 2006.

Ten Most Populous CountriesPopulation TFR
China 1,313,973,713 1.73India 1,095,351,995 2.73United States 298,444,215 2.09Indonesia 245,452,739 2.40Brazil 188,078,227 1.91Pakistan 165,803,560 4.00Bangladesh 147,365,352 3.11Russia 142,893,540 1.28Nigeria 131,859,731 5.49Japan 127,463,611 1.40

Nigeria - 2006Fertility rate of 5.49 births / women
Source: US Census bureau

NigeriaPopulation 131.9 million Pop. growth rate 2.38 %
Total fertility rate 5.49 children/women
Life expectancy at birth 47.08 yrs
Birth rate 40.43 / 1000 Death rate 16.94 / 1000
Median age 18.7 yrs HIV rate: 5.4 %
Infant mortality 97.14 / 1000 live births
Literacy rate 68 % Land phones: 1.03 million- Male 75.7 % Cell phones: 9.15 million- Female 60.6 % Internet users: 1.77 million
SOURCE: CIA World Factbook, June 2006.
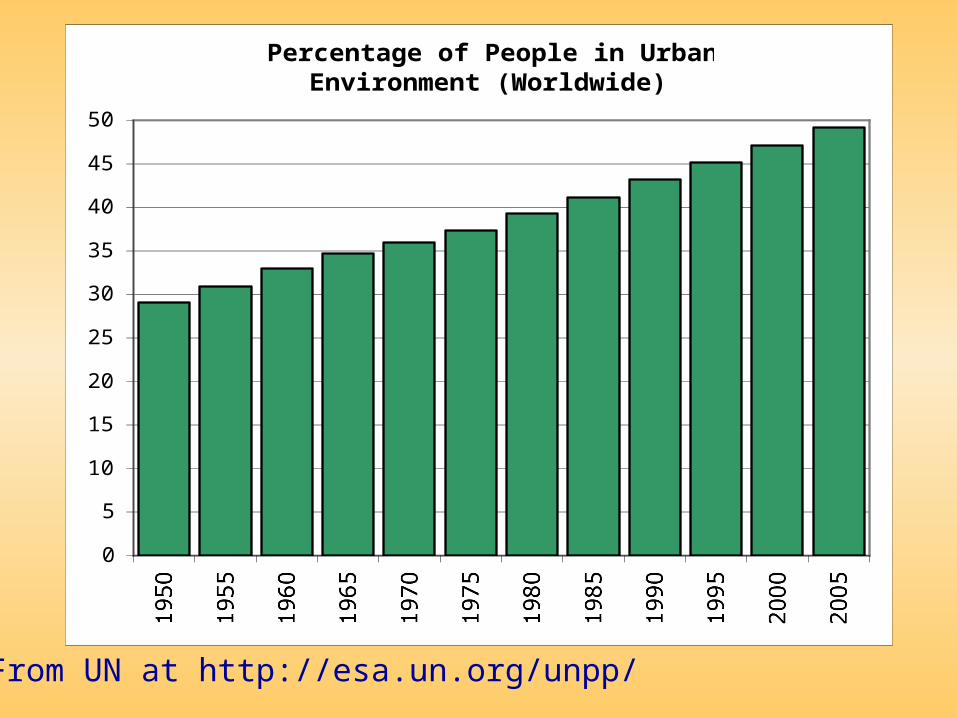
Percentage of People in Urban Environment (Worldwide)
0
5
10
15
20
25
30
35
40
45
50
1950 1955 1960 1965 1970 1975 1980 1985 1990 1995 2000 2005
From UN at http://esa.un.org/unpp/

MEDIAN AGE (UN at http://esa.un.org/unpp/)Year World More Less Least1950 23.9 29.0 21.4 19.61955 23.5 29.4 20.8 19.11960 23.2 29.8 20.3 18.61965 22.5 30.0 19.5 18.21970 22.2 30.5 19.1 17.81975 22.4 31.0 19.4 17.71980 23.1 32.0 20.2 17.61985 23.8 33.2 21.0 17.61990 24.6 34.6 21.8 17.71995 25.7 36.0 23.0 17.92000 26.8 37.3 24.3 18.32005 28.1 38.6 25.6 18.9
data acquired June 24, 2006

INFANT MORTALITY (UN at http://esa.un.org/unpp/)Year World More Less Least
1950-1955 156.9 59.1 179.8 194.11955-1960 140.8 42.9 162.8 180.41960-1965 119.1 32.7 136.3 168.31965-1970 103.6 26.3 116.6 156.41970-1975 93.2 21.4 104.7 146.81975-1980 87.4 18.3 98.0 137.91980-1985 77.8 14.7 86.8 126.31985-1990 70.4 12.7 77.9 117.81990-1995 65.7 10.1 72.3 110.61995-2000 61.5 8.3 67.4 104.12000-2005 57.0 7.7 62.4 97.4data acquired June 24, 2006

POPULATION GROWTH RATE (%) (UN at http://esa.un.org/unpp/)Year World More Less Least
1950-1955 1.8 1.2 2.1 2.01955-1960 1.9 1.2 2.1 2.21960-1965 2.0 1.1 2.4 2.31965-1970 2.0 0.8 2.5 2.51970-1975 1.9 0.8 2.4 2.51975-1980 1.7 0.7 2.1 2.51980-1985 1.7 0.6 2.1 2.61985-1990 1.7 0.6 2.1 2.61990-1995 1.5 0.4 1.8 2.71995-2000 1.3 0.3 1.6 2.42000-2005 1.2 0.3 1.4 2.4data acquired June 24, 2006

TOTAL FERTILITY RATE (children/woman) (UN at http://esa.un.org/unpp/)Year World More Less Least
1950-1955 5.0 2.8 6.2 6.61955-1960 5.0 2.8 6.0 6.71960-1965 5.0 2.7 6.0 6.71965-1970 4.9 2.4 6.0 6.71970-1975 4.5 2.1 5.4 6.61975-1980 3.9 1.9 4.7 6.41980-1985 3.6 1.9 4.2 6.31985-1990 3.4 1.8 3.8 6.11990-1995 3.0 1.7 3.4 5.81995-2000 2.8 1.6 3.1 5.42000-2005 2.7 1.6 2.9 5.0data acquired June 24, 2006

Year World More Less Least1950-1955 46.6 66.1 41.1 36.11955-1960 49.7 68.3 44.5 38.31960-1965 52.5 69.7 47.8 40.31965-1970 56.2 70.6 52.4 42.41970-1975 58.1 71.4 54.8 44.21975-1980 59.9 72.3 56.9 45.91980-1985 61.4 73.0 58.6 48.01985-1990 62.9 74.1 60.4 49.31990-1995 63.7 74.0 61.5 49.41995-2000 64.6 74.8 62.5 50.12000-2005 65.4 75.6 63.4 51.0
LIFE EXPECTANCY AT BIRTH (years) (UN at http://esa.un.org/unpp/)
From UN at http://esa.un.org/unpp/