human resource capability survey of public service ... · public service human resource ... are...
TRANSCRIPT

Human Resource Capability Survey of Public Service Departments as at 30 June 2003

2
ISBN 0-478-24447-9 Published in December 2003-12-09 by the State Services Commission, Wellington, New Zealand Crown Copyright reserved 2003 This publication is available on the website of the State Services commission at: http://www.ssc.govt.nz
3
Index of Contents
Executive Summary .....................................................................................................................4 Background ..................................................................................................................................5 Staff Numbers...............................................................................................................................5 Collective Bargaining...................................................................................................................6 Pay Movement..............................................................................................................................6 Gender Pay Gap............................................................................................................................7 Pay Gaps for Ethnic Groups.........................................................................................................8 Employment Stability and Security.............................................................................................. 8
Redundancy 8 Turnover 9
Recruitment Difficulties, Skill Shortages and Skill Gaps ..........................................................10 Equal Employment Opportunities ..............................................................................................11 Appendix 1: Full-time Equivalent Number of Employees, 2001–2003.....................................14 Appendix 2: Collective Bargaining and Employment Term – June 2003 .................................15
List of Figures
Figure 1: Filled Jobs in the State Sector, May 2003 ....................................................................6 Figure 2: Pay Movement 1992-2003............................................................................................7 Figure 3: Redundancy Payments, 1993-2003...............................................................................9
List of Tables
Table 1: Public Service Employment – 2002 - 2003....................................................................5 Table 2: Public Service Turnover Rates, 1998-2003 ...................................................................9 Table 3: Core Unplanned Turnover Rates (%) for Major Occupation Categories 2001-2003 ..10 Table 4: Representation of EEO Groups - 1998-2003 ...............................................................11 Table 5: Representation of EEO Groups in Senior Management – 1998-2003 ........................12
4
Public Service Human Resource Capability Survey - 2003
Executive Summary Growth. As at 30 June 2003 there were 34,445 people employed in the Public Service. The number of permanent (open-term) staff grew by just over 1,250 (5%) during the past year. This growth was spread across most departments. Since 2000, the Public Service has grown by around 3,000 employees (10%) indicating a building of capability in departments, a greater reliance on permanent staff (up by 15% since 2000) and less reliance on temporary staff (down by a third since 2000). Collective Bargaining. The coverage of collective bargaining has increased by 4 percentage points over the past year to 56% of all employees. Union membership has similarly increased by 4 percentage points to 58% of employees. Pay Movement. Pay movement in the Public Service has kept pace with movement across the economy as a whole. Pay movement in the education sector continues to move at a faster rate than elsewhere in the State sector. Pay Gaps. The gender pay gap in the Public Service was smaller than that in the labour force as a whole, once differences due to the occupational structure of the Public Service were taken into account. The largest contributors to pay gaps in the Public Service were that women worked in jobs that had a smaller job-size, on average, than the jobs in which men worked, and that women worked in lower-paid occupations. Employment Stability and Security. Employment stability and security has increased over the past year. The number of redundancies (188) over the past year was the lowest since information began being collected in 1991. Turnover of permanent staff in Public Service departments has continued at moderate levels similar to recent years, and turnover of all staff has been on a downward trend for several years. This trend reflects a fall in the reliance on fixed-term or temporary employees. On current trends, two-thirds of current public servants are expected to complete at least ten years service with their department. Employment relationships in the Public Service are typically long-term and full-time. Equal Employment Opportunities. The Public Service continues to employ a diverse workforce that reflects the community it serves and attracts a relatively high proportion of most of the EEO groups in the labour force. Over the past year the numbers of women, Asian and Pacific peoples in the Public Service have increased and the number of Māori public servants has remained steady at a high level compared with the wider labour force. While all of these groups are under-represented in senior management ranks compared with the rest of the Public Service, figures from 1998-2003 indicate that Māori and women are entering senior management ranks at a rate closer to their overall level of representation. However, this progress has not been matched for Asian or Pacific peoples. When compared with the labour force as a whole, the Public Service employs a high proportion of staff who have disabilities.

5
Background This paper presents staffing information (as at 30 June 2003) provided to the State Services Commission by Public Service departments. The information comes from the Human Resource Capability (HRC) survey, which gathers anonymous unit-record data on employees1 in Public Service departments. The survey includes a wide range of information relevant to Human Resource (HR) management and Equal Employment Opportunities (EEO).
Staff Numbers The number of permanent staff in the Public Service has continued to increase over the year to 30 June 2003 and followed a similar pattern to the previous year. Permanent (open-term) staff increased by just over 1,250 employees (4%) once machinery of government changes and data improvements2 were taken into account. The growth was spread across most of the Public Service. 25 departments reported an increase in their number of permanent staff, two stayed the same size, nine departments decreased in size and one was new to the Public Service. There was a small fall in the number of fixed-term employees, as shown in Table 1. �
Since 2000, the Public Service has grown by around 3,000 employees (10%), once structural government changes (such as organisations entering or leaving the Public Service) have been removed. This indicates a building of capability in departments, a greater reliance on permanent staff (up by 15% since 2000) and less reliance on temporary staff (down by a third since 2000). This is consistent with job growth in the overall labour force as a whole, as measured by Statistics NZ's Quarterly Employment Survey. The Public Service has made up around 2.2 percent of all jobs throughout the 2000-2003 period.
Table 1: Public Service Employment – 2002 - 2003 Open-term Fixed-Term Total
FTE Headcount FTE Headcount FTE Headcount
2003 31,107 32,200 2,012 2,245 33,118 34,445
2002 29,513 30,529 2,072 2,308 31,585 32,837
% change 5 5 -3 -3 5 5
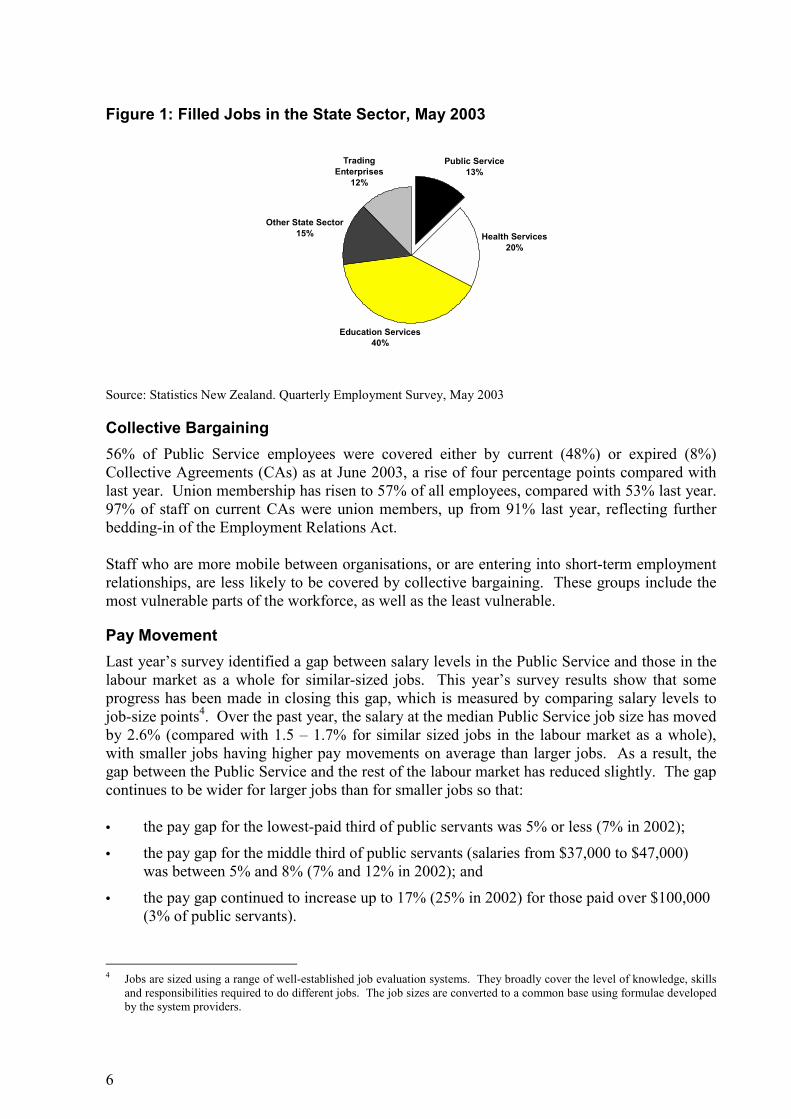
The Public Service makes up a small proportion of total State sector employment, which is shown in Figure 1 below. In 2003, jobs in the Public Service made up only 13% of the 270,000 State sector jobs3. 60% of State sector jobs are in the public Education or Health Services.
1 The survey includes all permanent and temporary employees but does not include employees who work on a casual or as-
required basis. 2 The Government Communications Security Bureau (GCSB) became a Public Service department during the year. The
Ministry of Health was able to provide data on employees in the HealthPAC group, which had not been previously available.
3 Including NZ Defence Force staff who are excluded from the Quarterly Employment Survey (QES).
6
Figure 1: Filled Jobs in the State Sector, May 2003
Public Service13%
Health Services20%
Education Services40%
Other State Sector15%
Trading Enterprises
12%
Source: Statistics New Zealand. Quarterly Employment Survey, May 2003
Collective Bargaining 56% of Public Service employees were covered either by current (48%) or expired (8%) Collective Agreements (CAs) as at June 2003, a rise of four percentage points compared with last year. Union membership has risen to 57% of all employees, compared with 53% last year. 97% of staff on current CAs were union members, up from 91% last year, reflecting further bedding-in of the Employment Relations Act. Staff who are more mobile between organisations, or are entering into short-term employment relationships, are less likely to be covered by collective bargaining. These groups include the most vulnerable parts of the workforce, as well as the least vulnerable.
Pay Movement Last year’s survey identified a gap between salary levels in the Public Service and those in the labour market as a whole for similar-sized jobs. This year’s survey results show that some progress has been made in closing this gap, which is measured by comparing salary levels to job-size points4. Over the past year, the salary at the median Public Service job size has moved by 2.6% (compared with 1.5 – 1.7% for similar sized jobs in the labour market as a whole), with smaller jobs having higher pay movements on average than larger jobs. As a result, the gap between the Public Service and the rest of the labour market has reduced slightly. The gap continues to be wider for larger jobs than for smaller jobs so that: • the pay gap for the lowest-paid third of public servants was 5% or less (7% in 2002);
• the pay gap for the middle third of public servants (salaries from $37,000 to $47,000) was between 5% and 8% (7% and 12% in 2002); and
• the pay gap continued to increase up to 17% (25% in 2002) for those paid over $100,000 (3% of public servants).
4 Jobs are sized using a range of well-established job evaluation systems. They broadly cover the level of knowledge, skills
and responsibilities required to do different jobs. The job sizes are converted to a common base using formulae developed by the system providers.
7
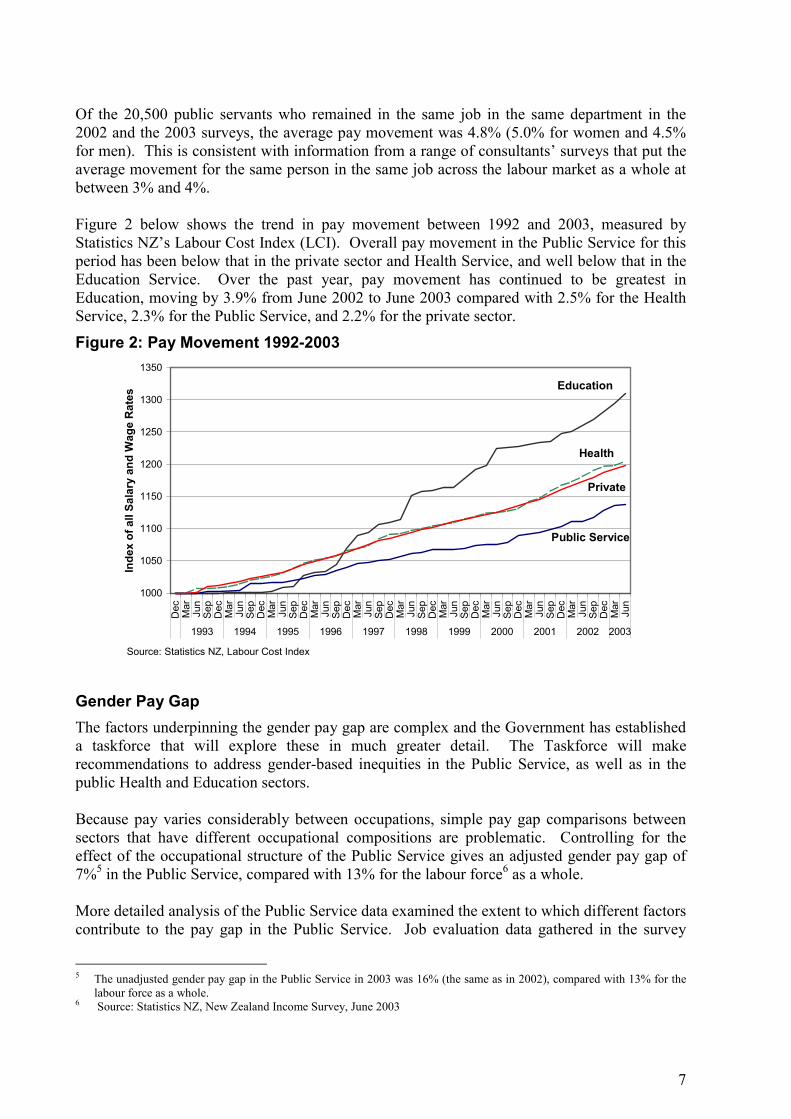
Of the 20,500 public servants who remained in the same job in the same department in the 2002 and the 2003 surveys, the average pay movement was 4.8% (5.0% for women and 4.5% for men). This is consistent with information from a range of consultants’ surveys that put the average movement for the same person in the same job across the labour market as a whole at between 3% and 4%. Figure 2 below shows the trend in pay movement between 1992 and 2003, measured by Statistics NZ’s Labour Cost Index (LCI). Overall pay movement in the Public Service for this period has been below that in the private sector and Health Service, and well below that in the Education Service. Over the past year, pay movement has continued to be greatest in Education, moving by 3.9% from June 2002 to June 2003 compared with 2.5% for the Health Service, 2.3% for the Public Service, and 2.2% for the private sector.
Figure 2: Pay Movement 1992-2003
1000
1050
1100
1150
1200
1250
1300
1350
Dec Mar
Jun
Sep
Dec Mar
Jun
Sep
Dec Mar
Jun
Sep
Dec Mar
Jun
Sep
Dec Mar
Jun
Sep
Dec Mar
Jun
Sep
Dec Mar
Jun
Sep
Dec Mar
Jun
Sep
Dec Mar
Jun
Sep
Dec Mar
Jun
Sep
Dec Mar
Jun
1993 1994 1995 1996 1997 1998 1999 2000 2001 2002 2003
Inde
x of
all
Sala
ry a
nd W
age
Rat
es
Education
Private
Public Service
Source: Statistics NZ, Labour Cost Index
Health
Gender Pay Gap The factors underpinning the gender pay gap are complex and the Government has established a taskforce that will explore these in much greater detail. The Taskforce will make recommendations to address gender-based inequities in the Public Service, as well as in the public Health and Education sectors. Because pay varies considerably between occupations, simple pay gap comparisons between sectors that have different occupational compositions are problematic. Controlling for the effect of the occupational structure of the Public Service gives an adjusted gender pay gap of 7%5 in the Public Service, compared with 13% for the labour force6 as a whole. More detailed analysis of the Public Service data examined the extent to which different factors contribute to the pay gap in the Public Service. Job evaluation data gathered in the survey
5 The unadjusted gender pay gap in the Public Service in 2003 was 16% (the same as in 2002), compared with 13% for the
labour force as a whole. 6 Source: Statistics NZ, New Zealand Income Survey, June 2003

8
indicate that half of the pay gap in the Public Service was due to men working in larger-sized jobs than women. The effect of women working in occupations that were paid less than those occupations men worked in explained a further 23% of the pay gap. Age, length of service, region, collective bargaining, employment term and ethnicity together explained 17% of the pay gap. Men were more likely to work in higher-paying departments than women, and this explained 8% of the gender pay gap. In total, 98% of the pay gap in the Public Service could be attributed to the effect of these factors.
Pay Gaps for Ethnic Groups For Māori the occupation-adjusted pay gap was 5% in the Public Service compared with 8% in the labour force. For Pacific peoples, the gaps were 8% in the Public Service and 14% in the labour force. The occupation-adjusted pay gap for Asian public servants was 5%. Comparable figures for Asian peoples in the labour force are not available. The younger age profile of each of these ethnic groups in the Public Service (and the wider population) has an effect on pay gaps. When the pay gaps were adjusted both for age and occupation, the pay gaps in the Public Service fell to 4% for Māori, 5% for Pacific peoples and 3% for Asian peoples. Comparable figures for the labour force are not available. There are also gender pay gaps within different ethnic groups in the Public Service: • Māori women were paid on average 9% less than Māori men and 22% less than all men;
• Pacific women were paid 9% less than Pacific men and 29% less than all men; and
• Asian women 10% less than Asian men and 19% less than all men.
Employment Stability and Security Over a third of permanent public servants have already been employed in their department for ten years or more and, based on current turnover patterns, a total of 66% will achieve ten years service before leaving. Around 40% of staff who are currently employed in departments are expected to still be employed in those departments in 2013. While turnover rates are likely to have increased over the long-term, in line with general labour market trends, there has been no noticeable increase over the four years that the HRC survey has been carried out. Only 6% of public servants worked less than 30 hours per week (compared to 38% of the labour force as a whole) and a further 4% work 30 hours or more, but less than full-time.
Redundancy The number of people who received redundancy payments7 has continued on the downward path that has been evident for the last three years. In the year to June 2003, 188 people received redundancy payments, the lowest number since data on redundancy payments began being collected in 1991. These payments had an average value of $42,804, up from $36,171 in 2002. The trend in redundancy payments is shown in Figure 3 below.
7 Redundancy payments include severance payments and enhanced early retirements.

9
Figure 3: Redundancy Payments, 1993-2003
0
10
20
30
40
50
60
70
80
90
1993 1994 1995 1996 1997 1998 1999 2000 2001 2002 2003
Total Redundancy
Cost in 2003
prices($m)
-
200
400
600
800
1,000
1,200
1,400
1,600
1,800 No. of staff
Real Total Cost ($m) Staff Receiving Payments
Turnover The core unplanned turnover8 rate for the Public Service was 11% (12% for women, 9% for men) for the year to 30 June 2003. The unplanned turnover rate has been stable over the four years that this measure has been available, while the gross turnover rate (which includes people on fixed-term employment) has been slowly decreasing as shown in Table 2.
Table 2: Public Service Turnover Rates, 1998-2003 Year ended 30 June Core Unplanned
Turnover Rate (%) Gross9 Turnover
Rate (%) 2003 11 18
2002 11 19
2001 13 22
2000 11 22
1999 * 22
1998 * 23 * Core unplanned turnover rates are not available before 2000
The turnover rate for the Public Service is derived from the exits from departments. As a result it includes movements between departments and so the actual level of “loss” to the Public Service through unplanned exits is below the 11% reported here. The core unplanned turnover rates of the major occupation categories10 have been relatively stable over the last three years as shown in Table 3 below. Managers, and Personal and
8 Core unplanned turnover is primarily due to resignations of open-term employees, but also includes retirements,
dismissals, and death. Planned turnover includes cessations of staff on fixed-term employment agreements and cessations due to restructuring.
9 Gross turnover is calculated using all cessations of all open and fixed term staff.
10
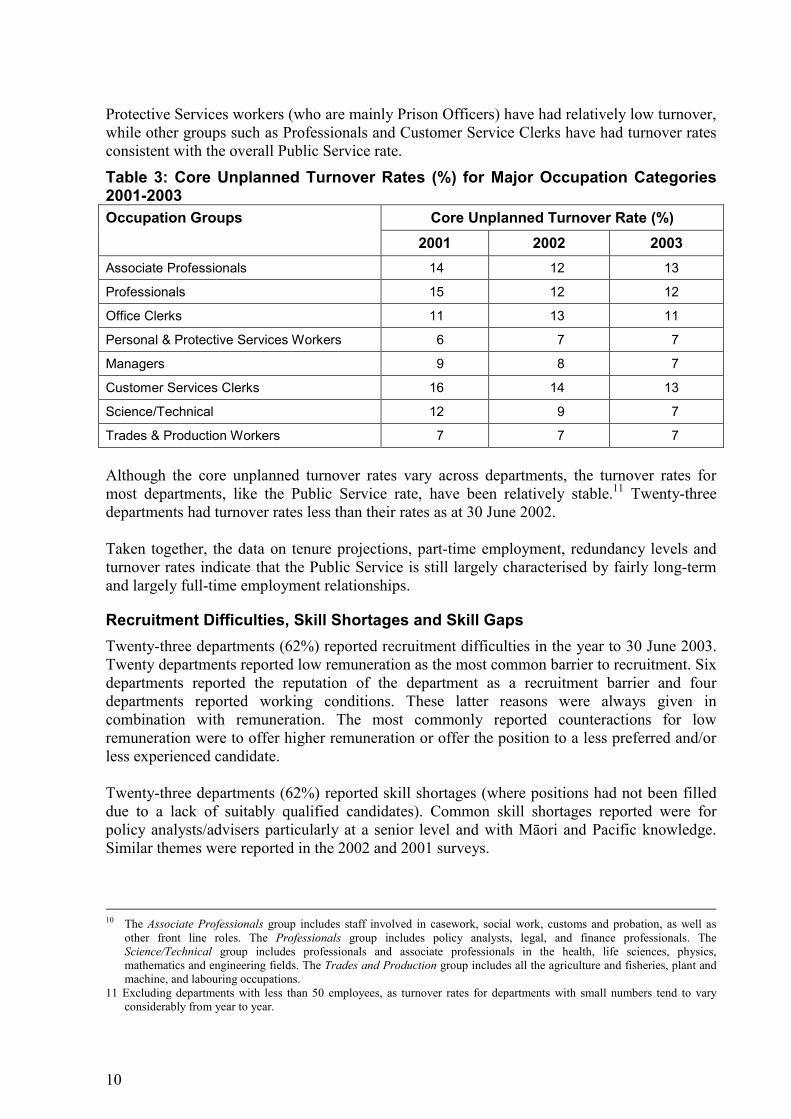
Protective Services workers (who are mainly Prison Officers) have had relatively low turnover, while other groups such as Professionals and Customer Service Clerks have had turnover rates consistent with the overall Public Service rate.
Table 3: Core Unplanned Turnover Rates (%) for Major Occupation Categories 2001-2003
Core Unplanned Turnover Rate (%) Occupation Groups 2001 2002 2003
Associate Professionals 14 12 13
Professionals 15 12 12
Office Clerks 11 13 11
Personal & Protective Services Workers 6 7 7
Managers 9 8 7
Customer Services Clerks 16 14 13
Science/Technical 12 9 7
Trades & Production Workers 7 7 7 Although the core unplanned turnover rates vary across departments, the turnover rates for most departments, like the Public Service rate, have been relatively stable.11 Twenty-three departments had turnover rates less than their rates as at 30 June 2002. Taken together, the data on tenure projections, part-time employment, redundancy levels and turnover rates indicate that the Public Service is still largely characterised by fairly long-term and largely full-time employment relationships.
Recruitment Difficulties, Skill Shortages and Skill Gaps Twenty-three departments (62%) reported recruitment difficulties in the year to 30 June 2003. Twenty departments reported low remuneration as the most common barrier to recruitment. Six departments reported the reputation of the department as a recruitment barrier and four departments reported working conditions. These latter reasons were always given in combination with remuneration. The most commonly reported counteractions for low remuneration were to offer higher remuneration or offer the position to a less preferred and/or less experienced candidate. Twenty-three departments (62%) reported skill shortages (where positions had not been filled due to a lack of suitably qualified candidates). Common skill shortages reported were for policy analysts/advisers particularly at a senior level and with Māori and Pacific knowledge. Similar themes were reported in the 2002 and 2001 surveys.
10 The Associate Professionals group includes staff involved in casework, social work, customs and probation, as well as
other front line roles. The Professionals group includes policy analysts, legal, and finance professionals. The Science/Technical group includes professionals and associate professionals in the health, life sciences, physics, mathematics and engineering fields. The Trades and Production group includes all the agriculture and fisheries, plant and machine, and labouring occupations.
11 Excluding departments with less than 50 employees, as turnover rates for departments with small numbers tend to vary considerably from year to year.
11
Sixty two percent of the departments reported skill gaps in 2003. The most common skill gap reported by departments was in the area of management skills – including contract, relationship, operational and project management. Other common skill gaps were analytical/evaluative skills, IT skills, report writing and lack of central government knowledge. Remuneration was the most common factor departments expected would have a significant impact on their future capability. Several departments considered their remuneration levels were not competitive either within the Public Service and/or the wider labour market to attract or retain good staff. They expected that the labour market would continue to be tight in the future, which would compound the remuneration problem. A perceived lack of ethnic diversity, and in particular a shortage of Māori and Pacific staff in the Public Service, was commonly reported as having a significant impact on future capability. The shortage affects a wide range of positions such as advisors/analysts in economic, social and conservation areas, language services and social services.
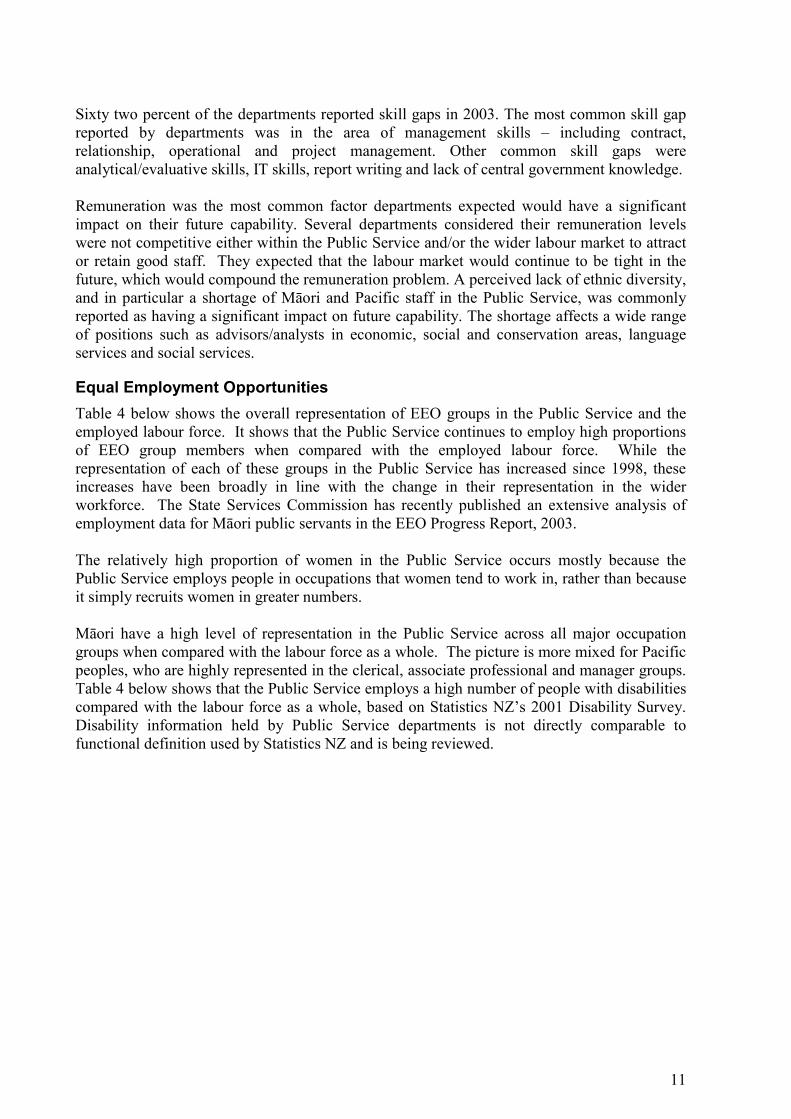
Equal Employment Opportunities Table 4 below shows the overall representation of EEO groups in the Public Service and the employed labour force. It shows that the Public Service continues to employ high proportions of EEO group members when compared with the employed labour force. While the representation of each of these groups in the Public Service has increased since 1998, these increases have been broadly in line with the change in their representation in the wider workforce. The State Services Commission has recently published an extensive analysis of employment data for Māori public servants in the EEO Progress Report, 2003. The relatively high proportion of women in the Public Service occurs mostly because the Public Service employs people in occupations that women tend to work in, rather than because it simply recruits women in greater numbers. Māori have a high level of representation in the Public Service across all major occupation groups when compared with the labour force as a whole. The picture is more mixed for Pacific peoples, who are highly represented in the clerical, associate professional and manager groups. Table 4 below shows that the Public Service employs a high number of people with disabilities compared with the labour force as a whole, based on Statistics NZ’s 2001 Disability Survey. Disability information held by Public Service departments is not directly comparable to functional definition used by Statistics NZ and is being reviewed.
12
Table 4: Representation of EEO Groups - 1998-2003 EEO Groups 1998 1999 2000 2001 2002 2003
% % % % % %
Public Service 15.5 16.1 16.9 17.0 17.6 17.4 Māori
Employed Labour Force13
8.1 7.6 8.9 8.8 9.5 9.4
Public Service 5.9 6.2 6.6 6.6 6.8 7.1 Pacific peoples
Employed Labour Force
3.6 4.0 4.0 4.0 4.5 4.5
Public Service 3.0 3.0 3.3 3.4 3.6 4.1
Ethnicity12
Asian peoples
Employed Labour Force
4.8
Public Service 18.5 People with Disabilities
Employed Labour Force
14.6
Public Service 54.5 56.3 56.2 56.5 57.5 57.8 Women
Employed Labour Force
44.9 45.4 45.1 45.7 45.4 45.5
Table 5 below shows that the proportions of people from EEO groups in senior management positions (tiers one to three) have stabilised over the past year. Senior managers have a very low turnover rate, meaning that compositional change in this group is likely to occur slowly. After adjusting for the change due to GCSB being included in the survey, between 40 and 45% of new senior managers over the past year were women. While this figure is down from that shown for the previous year, it indicates that the proportion of senior managers who are women will continue to increase in the coming years.
Table 5: Representation of EEO Groups in Senior Management – 1998-2003 EEO Groups 1998 1999 2000 2001 2002 2003 % % % % % %
Māori 8.2 7.6 8.7 9.7 10.4 10.2
Pacific peoples 1.4 1.7 1.4 1.9 1.6 1.4
Asian peoples 2.4 2.2 1.8 1.6 1.4 1.4
Women 29.4 32.7 33.6 32.7 35.5 35.1
12 Public Service ethnicity data double-counts people with more than one ethnicity, so that a person who is M~ori and
Samoan will be counted in both M~ori and Pacific peoples. The labour force figures shown, which are sourced from Statistics NZ’s Household Labour Force Survey (HLFS), use a priority reporting system that has the effect of slightly reducing the figure for Pacific peoples. Figures on Asian peoples are not available from the HLFS and the figure shown comes from the 2001 Census. The figures shown are a percentage of people whose ethnicity is known rather than the total population.
13 Labour force figures in Table 4 are based on the total employed labour force (i.e. including the self-employed) to preserve the time series going back to 1998. All other labour force data in this report are based on employees only, to provide a more direct comparator to employees in the Public Service. This is the same as the group used in the NZ Income Survey and various consultants’ reports, which provide comparative wage and salary data.

13
Over the longer term, the proportion of senior managers who are women has increased from 29% in 1998 to 35% in 2003. This equates to between 45% and 50% of new senior management positions14 being filled by women. Similarly Māori filled between 15% and 18% of new senior management positions over this period. However, the increase in the proportion of Asian people the Public Service as a whole has not been reflected in the Public Service senior management group. The same is true for Pacific peoples in senior management. However, the senior management patterns for these groups are based on a small number of employees. For example, the reduction in the proportion of Asian senior managers between 1998 and 2003 is equivalent to the loss of 8 employees.
14 The number of new senior managers cannot be directly measured because the data do not allow individuals to be identified
as they move around the Public Service or through departments. The figures shown have been estimated based on the average turnover rates for senior managers and the average number of senior managers over the 1998-2003 period.

14
Appendix 1: Full-time Equivalent Number of Employees, 2001–2003 Total FTE Staff - June 2003 Comparison With Previous Periods Department
Female Male Total 2002 % change 2003/2002
2001 % change2003/2001
Agriculture & Forestry 515 777 1291 1219 6.0 1192 8.3 Archives 58 51 109 110 -1.5 94 15.7 Audit Department - - - - - 251 - Child, Youth & Family Services 1617 571 2187 2154 1.6 2096 4.4 Conservation 579 1185 1763 1727 2.1 1618 9.0 Corrections 1475 2810 4285 4266 0.4 4088 4.8 Courts 1361 704 2065 1974 4.6 1888 9.4 Crown Law Office 92 37 129 126 2.6 126 2.5 Culture and Heritage 28 29 57 54 7.2 51 12.5 Customs 315 523 838 771 8.7 724 15.8 Defence 21 31 52 49 6.1 50 4.8 Economic Development 331 323 653 725 -9.8 678 -3.6 Education 1362 487 1849 1742 6.1 649 184.9 Education Review Office 116 58 173 180 -3.6 168 3.2 Environment 103 69 172 138 24.5 122 41.3 Fisheries 110 226 336 313 7.3 298 12.8 Foreign Affairs & Trade 309 313 622 610 2.0 605 2.8 Government Communications Security Bureau
60 193 253 - - - -
Health 672 339 1012 818 23.6 781 29.5 Housing 88 54 142 129 10.4 121 17.4 Inland Revenue Department 2839 1684 4523 4418 2.4 4373 3.4 Internal Affairs 523 457 984 940 4.7 886 11.0 Justice 127 62 189 186 1.6 184 2.6 Labour 663 536 1199 1081 11.0 1092 9.8 Land Information New Zealand 243 340 583 614 -5.0 645 -9.6 Maori Development 212 132 343 302 13.5 294 16.8 National Library 255 101 356 364 -2.1 359 -0.7 Pacific Island Affairs 21 23 44 42 4.8 35 25.7 Prime Minister & Cabinet 56 49 105 103 1.7 95 10.3 Public Trust Office - - - - - 420 - Research, Science & Technology
40 19 59 49 21.8 51 15.9
Serious Fraud Office 15 18 33 33 -1.8 34 -4.1 Social Development 3946 1539 5485 5085 7.9 - - Social Policy - - - - - 183 - State Services Commission 96 57 154 153 0.2 142 8.2 Statistics New Zealand 309 294 604 654 -7.7 642 -6.0 Transport 35 33 68 66 3.2 63 7.9 Treasury 148 178 326 307 6.1 313 4.1 Women's Affairs 19 1 20 32 -35.9 28 -27.2 Work and Income - - - - - 4859 - Youth Affairs 12 8 20 21 -3.1 22 -8.0 Total1 18779 14334 33118 31585 4.9 30355 9.1
1 Includes chief executives, who are not included in the departmental figures, and staff whose gender was unknown.
15
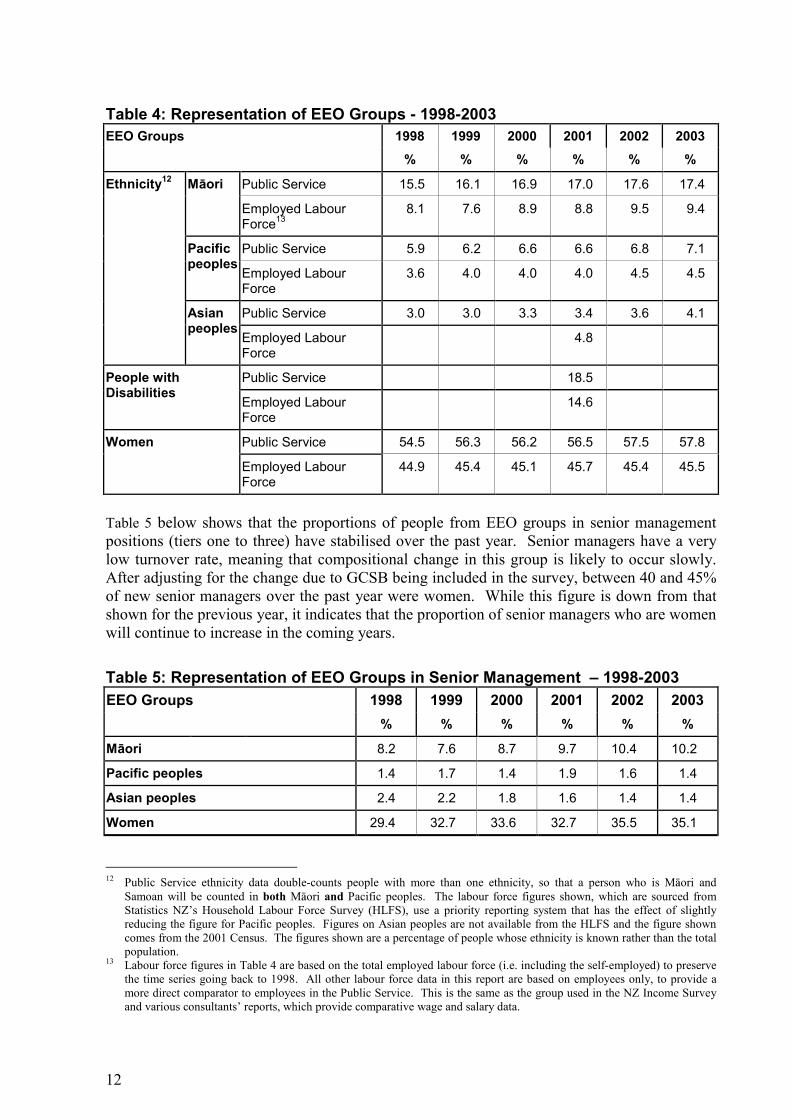
Appendix 2: Collective Bargaining and Employment Term – June 2003
% of staff % of staff Department IEA CA Expired CA Open-term Fixed-term
Agriculture & Forestry 50 0 50 97 3 Archives 28 72 0 84 16 Child, Youth & Family Services 32 68 0 91 9 Conservation 40 60 0 86 14 Corrections 32 68 1 97 3 Courts 41 38 20 93 7 Crown Law Office 100 0 0 72 28 Culture and Heritage 82 8 10 72 28 Customs 25 75 0 99 1 Defence 100 0 0 94 6 Economic Development 65 35 0 97 3 Education 42 18 41 87 13 Education Review Office 29 71 0 96 4 Environment 56 44 0 87 13 Fisheries 73 27 0 95 5 Foreign Affairs & Trade 41 59 0 93 7 Government Communications Security Bureau
37 63 0 100 0
Health 90 3 7 87 13 Housing 45 55 0 97 3 Inland Revenue Department 39 61 0 97 3 Internal Affairs 60 40 0 90 10 Justice 61 39 0 89 11 Labour 70 30 0 94 6 Land Information New Zealand 32 0 68 91 9 Maori Development 97 0 3 92 8 National Library 37 63 0 92 8 Pacific Island Affairs 100 0 0 96 4 Prime Minister & Cabinet 100 0 0 83 17 Research, Science & Technology 100 0 0 89 11 Serious Fraud Office 100 0 0 100 0 Social Development 32 67 1 96 4 State Services Commission 100 0 0 78 22 Statistics New Zealand 48 0 52 98 2 Transport 100 0 0 99 1 Treasury 100 0 0 97 3 Women's Affairs 43 57 0 95 5 Youth Affairs 52 48 0 90 10 Total1 44 48 8 93 7
1 Includes chief executives, who are not included in the departmental figures.