hummingbird behavioural study - cloudbridge
TRANSCRIPT

Hummingbird Behavioural Study
at Cloudbridge Nature Reserve
4 August 2015 - 22 September 2015
by Anna Rabone and Christian Staunton
A research project analysing hummingbird feeding behaviour around a popular feeding site.

Page 2 of 52
Contents
Contents 1. Introduction
1.1 The Site 1.2 The Plant 1.3 Hummingbird Feeding Behaviour
1.3.1 Territorial 1.3.2 Trap-lining
2. Study 1 2.1 Overview
What was measured? 2.2 Methodology
2.2.1 Set-up Sections Flowers
2.2.2 Data Recording Per session: Per flower spike: Data logged for each visit:
2.3 Findings 2.3.1 Relationship between flower cluster position and size 2.3.2 Hummingbird preference of flower cluster position on flower spike 2.3.3 Hummingbird preference of number of flowers in cluster 2.3.4 Efficiency of hummingbird feeding - flower cluster utilisation 2.3.5 Hummingbird species concentrations
2.4 Discussion 2.4.1 Relationship between flower cluster position and size 2.4.2 Hummingbird preference of flower cluster position on flower spike 2.4.3 Hummingbird preference of number of flowers in cluster 2.4.4 Efficiency of feeding - flower cluster utilisation 2.4.5 Species concentrations
Study 2 3.1 Overview
What was measured? 3.2 Methodology
3.2.1 Set-up Section Flowers
2.2.2 Data Recording 3.3 Findings
3.3.1 Hummingbird preference of flower cluster position on flower spike 3.3.2 Hummingbird preference of number of flowers in cluster 3.3.3 Influence of proximity to neighbouring flower clusters 3.3.4 Hummingbird species feeding behaviour
3.4 Discussion
Page 3 of 52
3.4.1 Hummingbird preference of flower cluster position on flower spike 3.4.2 Hummingbird preference of number of flowers in cluster 3.4.3 Influence of proximity to neighbouring flower clusters 3.4.4 Hummingbird species feeding behaviour
4. Anecdotal and behavioural observations 4.1 Study 1 - Weeks 1 & 2
4.1.1 Green Violet-ears 4.1.2 White-tailed Emerald 4.1.3 Scintillant
4.2 Study 2 - Week 1 4.2.1 Green Violet-ears 4.2.2 Scintillant hummingbird 4.2.3 White-tailed Emerald
4.3 Study 2 - Weeks 2 & 3 4.3.1 Green Violet-ears 4.3.2 White-throated Mountain Gem 4.3.3 Snowy-bellied hummingbird 4.3.4 Stripe-tailed hummingbird 4.3.5 White-tailed Emerald 4.3.6 Other species
4.4 Other sites: Behind Gavilan 4.5 Other sites: The Casita
5. Conclusion 5.1 Purple Porterweed 5.2 Feeding behaviour 5.3 Species behaviour
6. Suggestions for further study 7. A sidenote - planting and/or using feeders to attract hummingbirds Appendix 1 - Data collection parameters and definitions
1. Data Collection Parameters - Session 2. Data Collection Parameters - Visits
Appendix 2 - References Appendix 3 - Sample data recording sheets

Page 4 of 52
1. Introduction The purpose of this research project was to gain a better understanding of hummingbird feeding behaviour. We aimed to determine if there were favourite feeding spots within a single site and if this differed per species; identify if there were trends in flower selection and what factors influenced this; and record species interactions witnessed during monitoring.
1.1 The Site
Name: Gavilan Location: On the Gavilan trail, in front of the Gavilan hut. Altitude: 1800m approx. Plant species: Purple Porterweed - Stachytarpheta frantzii Bush size: 1130 x 505 x 300 cm approx. (length x depth x height)
1.2 The Plant
Purple Porterweed (Stachytarpheta frantzii) is a shrub in the Verbenaceae family. It is native to Costa Rica. The plant has many branches or ‘spikes’ upon which the purple flowers grow. Leaves grow on the lower parts of the plant. The plant flowers throughout the year and is a popular garden plant within Costa Rica. The purple flowers are five-lobed. The plant has seeds, which are small (0.5mm). The plant is known to attract short-billed hummingbirds, butterflies and moths who also pollinate the plant. Interestingly, the plant will grow a set of purple flowers which start at the base of the spike. The flowers will die and fall off daily, and the plant will grow a new set of flowers at a slightly higher position along the spike. The spike itself will also grow throughout its life-cycle. In this way, the flowers progress along the spike until they reach the end. At this point, all flowers will cease and the spike will dry up and die. We were unable to measure nectar production as we did not have the resources to do so. However, according to a study on a similar plant (Strachytarpheta maximiliani) in 20061, nectar production by the plant is in low quantities which forces pollinators to visit many flowers from different plants. In addition, the study found that nectar production starts at low quantities in the morning, and then increases throughout the day until late afternoon, after which nectar availability declines. The study found that sugar concentration was 32%. Another study2 on Strachytarpheta jamaicensis found that nectar production was optimal in the early morning and late afternoon. This study concluded that this was a specific function of the plant in order to attract hummingbirds and moths as pollinators, since hummingbirds are most active in the early morning, and moths in the evening.
1 http://www.scielo.br/scielo.php?pid=S0085-56262006000400010&script=sci_arttext 2 http://digital.lib.usf.edu/SFS0001254/00001

Page 5 of 52
Figure 1. The terminology and measured points on Stachytarpheta frantzii

Page 6 of 52
1.3 Hummingbird Feeding Behaviour
A hummingbird’s diet consists of mainly nectar, supplemented by small insects (10% of a hummingbird's food intake). The small insects are to provide protein in their diet. Nectar provides easily convertible energy to fulfil the high metabolic requirements of a hummingbird. Each day, a hummingbird will drink at least one and a half times their own body weight in nectar. Hummingbirds exhibit two types of feeding behaviour: territorial and trap-lining.
1.3.1 Territorial
Territorial hummingbirds will remain in one area with good access to food and water. Usually this will be a specific plant or set of plants close to each other. They will aggressively defend the area and try to prevent other hummingbirds or insects from feeding at the plant.
1.3.2 Trap-lining
Trap-liners will feed from many plants over an area of up to half a mile radius, often in a regular or set pattern. They will also often try to opportunistically feed from plants occupied by territorial hummingbirds. The trap-liners can also be divided into two types; high reward and low-reward. High-reward trap liners (such as the hermits) will seek flowers with high volumes of nectar, while low-reward species visit insect-pollinated flowers or those with small amounts of nectar (usually small, short-billed hummingbirds). Individual species will exhibit a preference for one of the two types of feeding behaviour, although some species are more generalist and will adopt both methods, adapting to particular circumstances as they arise. Hummingbird communities in a particular area will change throughout the year, because nectar abundance is variable. Indeed, changes can occur rapidly and were observed during our study. Migrations may be to higher or lower elevations, or between dry and wet regions, or between patches of flowering trees.

Page 7 of 52
2. Study 1
2.1 Overview
The initial, preliminary study, was designed to give an indication if there were possible trends in hummingbird flower selection and what factors influenced their selection. Specifically, we aimed to identify if the flower cluster position on a spike and the number of flowers in a flower cluster, were influencing factors in a hummingbird’s choice of flowers to feed upon. If trends were identified these would be studied in more detail in a subsequent study. Four varying sections of the bush were monitored - low, mid, high and shaded - intended to give a general overview of the site as well as reveal if certain sections yielded differing results to each other. By keeping each section small, we were able to monitor and measure individual flowers.
What was measured?
A. Relationship between flower cluster position and size Does Stachytarpheta frantzii produce different-sized flower clusters depending where on the flower spike they are positioned?
B. Hummingbird preference of flower cluster position on flower spike Do hummingbirds prefer flowers located at a particular position on the flower spike?
C. Hummingbird preference of number of flowers in flower cluster Do hummingbirds prefer flower clusters of a certain size?
D. Efficiency of hummingbird feeding - flower cluster utilisation Does the number of flowers in a flower cluster influence the amount (measured as % utilised) of flowers a hummingbird feeds upon?
E. Hummingbird species concentrations
Are some sections of the bush more appealing to certain species? Which species feed on the bush the most?

Page 8 of 52
2.2 Methodology
2.2.1 Set-up
No. of monitored sections: 4 (Low, Mid, High and Shaded) Total flowers monitored: 80 (20 per section) Length of monitoring session: 20 minutes Number of sessions for each section: 10 Total monitoring time: 800 minutes / 13hrs 20m (13:20:00) Total amount of hummingbird visits: 49 Total time of feeding by hummingbirds: 6 minutes 22 seconds (0:06:22) Dates of study 1: From 4 August 2015 to 14 August 2015
Sections
Four sections were chosen at the site. The sections were far enough apart to ensure no flowers would overlap between sections. Low-level, Mid-level and High-level were unshaded. Section 1 - Low-level Average flower height: 60cms from ground Distance from tripod centre to front of bush: 186cm Section 2 - Mid-level Average flower height: 135cms from ground Distance from tripod centre to front of bush: 210cm Section 3 - High-level Average flower height: 190cms from ground Distance from tripod centre to front of bush: 180cm Section 4 - Shaded (mid-to-high level) Average flower height: 158cms from ground Distance from tripod centre to front of bush: 410cm
Flowers
In each section, 20 flower spikes were selected and labelled using green masking tape and a marker pen. Care was taken not to inhibit the natural progression of the flower cluster along the spike, by placing labels on the end of the spike if the flower clusters were low down, and vice-versa. Green masking tape was selected as it would not interfere with the hummingbirds’ flower cluster choice. A colour such as red, which hummingbirds associate with nectar, may have

Page 9 of 52
influenced their choice of flower visits. Throughout this study, we observed the labels having no impact whatsoever in hummingbird flower selection or behaviour. Flower spikes were selected which were grouped together (as far as possible), to create a section small enough to film, but which would contain a range of flower cluster sizes and positions. Flowers deep into the bush were not selected as they could not be seen in the filmed footage and were more difficult to measure accurately.
2.2.2 Data Recording
In 20 minute sessions, each section was monitored by eye and also recorded on film. All hummingbird feeds on labelled flower spikes were recorded. Observational data was recorded on data sheets at the time by noting the number of visits, the time they occurred within the 20 minute period and the species. The templates of the data sheets used for Study 1 and 2 can be found at Appendix 3. The video analysis (using slow-motion and zoom features) then took place afterwards to complete data on the sequence of flowers fed on, and the exact length of the feed. This way, every visit to a labelled flower was accurately logged. Data was then entered into spreadsheets for subsequent analysis. Each data item collected is listed below. For a definition and more detailed explanation of each, see the “Data Parameters and Definitions” section of Appendix 1.
Per session:
● Session # ● Date ● Conditions e.g. sunny, cloudy ● Time of start and finish
Per flower spike:
● Length of spike in centimetres (taken from the first leaf stalk at the bottom of the spike to the tip)
● Distance of lowest flower from spike base in centimetres. Used to calculate the flower cluster position along the spike as a percentage.
● Number of flowers in flower cluster.
Data logged for each visit:
● Visit # ● Species ● Flower spikes visited (i.e. A, B, C etc) ● Sequence of feeding (i.e. C, A, B etc) ● Number of flowers in the flower cluster fed on by the hummingbird ● Notes of any particular observed behaviour

Page 10 of 52
2.3 Findings
In all the following data analysis, where possible, data collected was put on an ‘even footing’ by dividing by the sample size. This was to ensure that there would be no bias to the results due to uneven samples.
2.3.1 Relationship between flower cluster position and size
It was important to establish if there was a connection between flower cluster sizes and the position on the spike they occupy, as this could have an impact on hummingbird flower selection, as well as potentially explain any trends in their preference. Figure 2 shows the distribution of flower cluster sizes relative to position for all sections (colour-coded) and the overall trendline (pink). Trends identified were:
a. Clearly, the higher the flower cluster position on the spike, the fewer flowers in the cluster.
b. The graph also reveals a numerical bias towards flowers with high flower cluster positions.
Figure 2.
Page 11 of 52
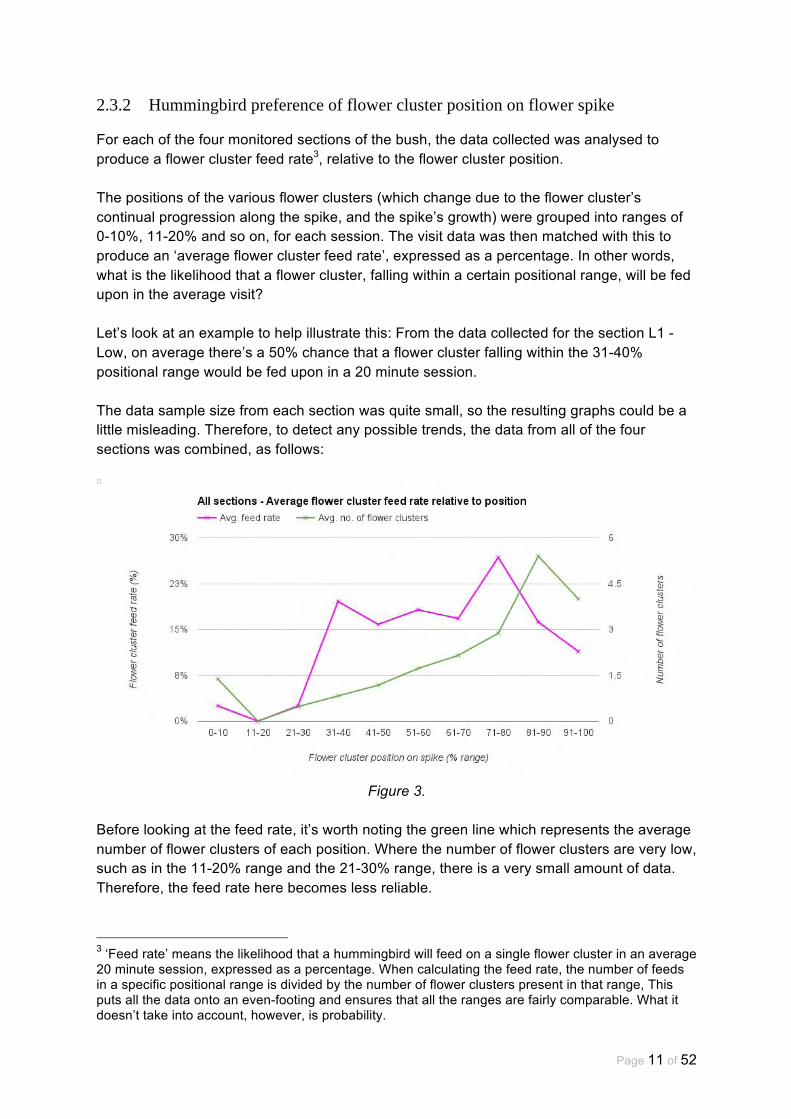
2.3.2 Hummingbird preference of flower cluster position on flower spike
For each of the four monitored sections of the bush, the data collected was analysed to produce a flower cluster feed rate3, relative to the flower cluster position. The positions of the various flower clusters (which change due to the flower cluster’s continual progression along the spike, and the spike’s growth) were grouped into ranges of 0-10%, 11-20% and so on, for each session. The visit data was then matched with this to produce an ‘average flower cluster feed rate’, expressed as a percentage. In other words, what is the likelihood that a flower cluster, falling within a certain positional range, will be fed upon in the average visit? Let’s look at an example to help illustrate this: From the data collected for the section L1 - Low, on average there’s a 50% chance that a flower cluster falling within the 31-40% positional range would be fed upon in a 20 minute session. The data sample size from each section was quite small, so the resulting graphs could be a little misleading. Therefore, to detect any possible trends, the data from all of the four sections was combined, as follows:
Figure 3.
Before looking at the feed rate, it’s worth noting the green line which represents the average number of flower clusters of each position. Where the number of flower clusters are very low, such as in the 11-20% range and the 21-30% range, there is a very small amount of data. Therefore, the feed rate here becomes less reliable.
3 ‘Feed rate’ means the likelihood that a hummingbird will feed on a single flower cluster in an average 20 minute session, expressed as a percentage. When calculating the feed rate, the number of feeds in a specific positional range is divided by the number of flower clusters present in that range, This puts all the data onto an even-footing and ensures that all the ranges are fairly comparable. What it doesn’t take into account, however, is probability.

Page 12 of 52
Concentrating on the feed rate, it is clear that the most popular of all the positional ranges is in the 71-80% range, followed by the 31-40% range. Next, 41-50%, 51-60%, 61-70% and 81-90% which are all similar. The following are identified trends:
a. A general preference for flower cluster positions between 31% and 90%.
b. A specific preference for flowers clusters positions in the range of 71-80% (where there are large numbers of available flower clusters in this range).
c. A specific preference for flower cluster positions in the range of 31-40%
(despite small numbers of flower clusters in this range).
2.3.3 Hummingbird preference of number of flowers in cluster
For each of the four monitored sections of the bush, the data collected was analysed to produce a flower cluster feed rate, relative to the flower cluster size. The sizes of the various flower clusters changes on a daily basis, so the data collected for each session was grouped into flower cluster sizes. The visit data was then matched with this, to produce an ‘average flower cluster feed rate’ expressed as a percentage. In other words, what is the likelihood that a flower cluster of a certain size will be fed upon in the average visit? The data sample size from each section was quite small, so the resulting graphs could be a little misleading. Therefore, to detect any possible trends, the data from all the sections was combined, as follows:
Figure 4.

Page 13 of 52
As in the previous section’s (section 2.3.2) findings, the feed rate must be considered alongside the amount of data sampled, represented by the average occurrence of each flower cluster size in Figure 4 (the green line). Trends identified were:
a. The most common flower cluster size tended to be between 3 and 6 flowers.
There was a roughly curved-shaped trend line within flower cluster size occurrences, peaking at 4 and reducing in numbers as the cluster size increased.
b. A hummingbird preference for the mid-sized flower clusters, despite low-
medium sizes being more populous.
Peaks at sizes 6 and 8 could probably be attributed to a small data sample size. It was suspected that more data would see this curve be smoother.
2.3.4 Efficiency of hummingbird feeding - flower cluster utilisation
It was important to establish if there was a pattern between the size of the flower cluster and the hummingbird feeding efficiency, i.e. how many of the available flowers in the cluster does it feed on. If a preference for a particular range of cluster sizes was identified, then this may provide an explanation. Figure 5 shows the total average utilisation rate relative to flower cluster size for all sections. Trends identified were:
a. Hummingbirds were most efficient at feeding on flower cluster sizes between 3 and 8 flowers
b. The largest flower cluster sizes (9 to 10 flowers) were less efficiently utilised by the hummingbirds than the smallest flower cluster sizes (2 to 4 flowers).

Page 14 of 52
Figure 5.
2.3.5 Hummingbird species concentrations
During this particular part of our study, we observed three species of hummingbirds on the bush, which were as follows:
● Green Violet-ear (Colibri thalassinus) ● White-tailed Emerald (Elvira chionura) ● Scintillant Hummingbird (Selasphorus scintilla)
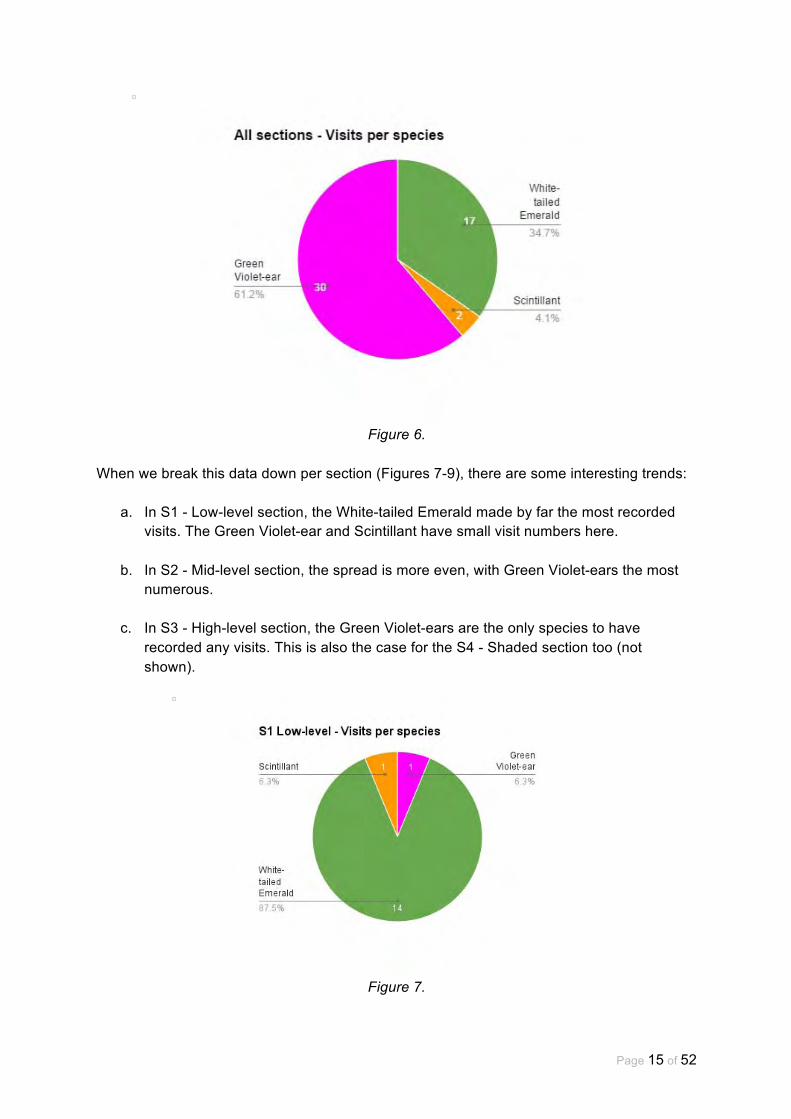
Figure 6 shows the percentage of visits by each of the three observed species across all four sections. The greatest percentage of visits was by Green Violet-ear hummingbirds. The next was the White-tailed hummingbird and the Scintillant hummingbird visited the bush the least often.
Page 15 of 52
Figure 6.
When we break this data down per section (Figures 7-9), there are some interesting trends:
a. In S1 - Low-level section, the White-tailed Emerald made by far the most recorded visits. The Green Violet-ear and Scintillant have small visit numbers here.
b. In S2 - Mid-level section, the spread is more even, with Green Violet-ears the most numerous.
c. In S3 - High-level section, the Green Violet-ears are the only species to have recorded any visits. This is also the case for the S4 - Shaded section too (not shown).
Figure 7.

Page 16 of 52
Figure 8.
Figure 9.

Page 17 of 52
2.4 Discussion
2.4.1 Relationship between flower cluster position and size
The following is a discussion of the trends identified:
a. The higher the flower cluster position on the spike, the fewer flowers in the cluster. This would make sense; as the flowers reach the end of the spike the spike will die and thus, the plant is unlikely to expend energy creating higher numbers of flowers at the latter stage of the individual spike’s life cycle. It was felt that this trend was established from a sufficient data sample size, and so did not require further testing in Study 2.
b. The graph also reveals a numerical bias towards flowers with high flower cluster positions. When you observe the entire bush, it is clear there are more flower spikes with flower clusters in the latter half position of the spike, i.e. 50% and upwards. This could be beneficial to the plant as it makes the flowers more easily accessible to pollinators. In addition, it was noted that the spike grows at a rate only a little slower than the flowers advance along it. Therefore, the flowers will be in an advanced spike position for longer than in the early stages of the spike life-cycle because the spike is continually growing, making the flower’s progression along it less significant. In other words, the second half of the spike’s flowering life-cycle is longer than the first half. However, rather than this purely being only due to the bush producing more flower clusters in advanced positions, it was felt this was also explained by our flower spike selection process. i.e. we had a tendency to select flower spikes to sample that were easily accessible and visible. Shorter spikes with flower clusters at the base would therefore tend to be overlooked, being deeper into the bush, resulting in an unintended numerical bias towards longer spikes with more advanced flower clusters. In Study 2, an effort was made to select more of an even range of flower cluster positions and to replace any non-flowering spikes with new ones.

Page 18 of 52
2.4.2 Hummingbird preference of flower cluster position on flower spike
The following is a discussion of the trends identified.
a. A general preference for flower cluster positions between 31% and 90%. Generally, there appeared to be a preference for flower clusters which are at least 31% along the spike and no more than 10% from the end. Why would this be? Perhaps the most obvious notion is that the flower clusters within this range are at their largest, thus providing a hummingbird to feed on a greater amount of nectar when visiting the flower. In section 2.3.1 we saw that there is a trend for flower cluster size to reduce as it moves along the spike. Indeed, the largest cluster sizes are present between 30% and 80%. At less than 30% there was not enough data to reach any conclusions, therefore affecting all aspects of this study. Interestingly, beyond 80%, flower clusters are at their most numerous - but as can be seen in Figure 3 - the feed rate falls away. This strongly indicates a hummingbird preference for the larger clusters found below the 80% position.
So, the 30-80% range does contain the largest clusters, supporting the idea that flower cluster size may influence selection. That said, a range of 30-80% is large and contains the majority of the flowers studied. It is perhaps too generalistic to confirm as a trend. Measuring the preference for flower cluster positions was repeated in Study 2, using a larger data set, for comparison.
b. A specific preference for flowers clusters positions in the range of 71-80% (where there are large numbers of available flower clusters in this range).
The feed rate line in Figure 3 ascends, suggesting hummingbirds increasingly prefer flower clusters the further along the spike they are located. Indeed, the 71-80% positional range shows as being the most popular, with a feed rate of 26%. However, the ‘number of clusters’ line also plotted in Figure 3 ascends at a similar rate. Therefore, it’s extremely likely that this explains the former. i.e. the more flower clusters there are in a positional range, the more likely they are to be selected for feeding. This would be expected, simply due to increased probability. Where it bucks this trend however, is in the 31-40% range, as follows.
c. A particular preference for flower cluster positions in the range of 31-40%
Our findings showed that there was a particular preference for flower cluster positions in the range of 31-40%, despite small numbers of flower clusters in this range. The discrepancy between the feed rate and the number of flower clusters in this range is at its largest here.

Page 19 of 52
As can be seen in Figure 3, there were 0 flower clusters sampled in the positional range 11-20% and very few in the 21-30% range.
Looking at the data from section 2.4.1 and using the notion that flower cluster size influences selection, then this 31-40% preference would make sense; this is the range where flower cluster sizes are at their largest from those sampled. Larger flower cluster sizes could mean that more nectar is available to the hummingbird.
Of course, the flower cluster size could be irrelevant. There are others factors which may explain a preference for flower cluster positions in the 31-40% range, such as nectar production, proximity to neighbouring flower clusters or ease of access. Or indeed, this could simply be anomaly. Study 2 aimed to collect more data of this kind, to prove or disprove this preference using a larger data sample, and to test proximity of neighbouring flowers as an additional measurable.
2.4.3 Hummingbird preference of number of flowers in cluster
The following is a discussion of the trends identified.
a. The most common flower cluster size tended to be between 3 and 6 flowers.
In Figure 4 we see that the green line, representing the average number of flower clusters, is highest where the flower clusters are smaller, peaking between 3 and 6. Simply, this tells us that there were the most flowers sampled of this flower cluster size. When we compare that with the trend seen in 2.4.1, we know that these flowers tend to be further along the spike. Indeed the peak flower cluster size of 4, is shown as having an average position of 80% along the spike. As mentioned previously, it could be that the bush has more advanced, smaller flower clusters; or it could be down to our flower selection process.
b. A hummingbird preference for the mid-sized flower clusters, despite low-
medium sizes being more populous.
The feed rate line in Figure 4 is largely curved shaped, peaking at flower cluster sizes of 6 and 8 respectively. Interestingly, despite their being a larger quantity of small-to-mid-sized flower clusters (3-6) available, the hummingbirds more commonly fed on the mid-sized flower clusters (5-8). The largest flower clusters (8-10) were much less common, but also much less fed upon, when available. So, why would the hummingbirds prefer mid-sized flower clusters? Well, in 2.4.1 we established that there is a link between the flower cluster position on the spike and the flower cluster size. In both 2.4.2 and here, we see a preference for the mid-sized and mid-positioned flower clusters respectively. Perhaps these flower clusters represent a good compromise? They’re not the most numerous (which tend to have

Page 20 of 52
smaller flower clusters) and not the largest flower clusters (which tend to be in low positions on the spike) - but offer a good compromise between flower cluster size, spike position and availability. It was felt that the peaks and troughs in the trendline between 6 and 8 would be smoothed out if a larger data set was used. For this reason, and to confirm the mid-sized preference identified above, the measurement of ‘preference for number of flowers in cluster’ was repeated in Study 2.
2.4.4 Efficiency of feeding - flower cluster utilisation
The following is a discussion of the trends identified.
a. Hummingbirds were most efficient at feeding on flower cluster sizes between 3 and 8 flowers Our findings showed that hummingbirds more efficiently utilise flower cluster sizes of between 3-8 flowers. This could be that a flower cluster size between 3-8 flowers is an optimum size, perhaps producing good amounts of nectar. As we did not have the equipment to measure nectar production, this remains an unknown and could be of interest for further study. Within the 3-8 range, which admittedly is quite large, there isn’t a huge amount of difference between the utilisation rates of the flower cluster sizes. This may suggest that there isn’t a notable difference in utilisation rates beyond the largest and smallest flower clusters, and that the small differences seen in Figure 5 are down to varying numbers of each flower cluster size being sampled. In addition, it could be that utilisation rates differ per species because of different feeding behaviours. We were unable to explore this aspect further due to a small data set, but it could provide an interesting avenue for further study.
b. The largest flower cluster sizes (9 to 10 flowers) were less efficiently utilised by the hummingbirds than the smallest flower cluster sizes (2 to 4 flowers). The larger flower cluster sizes (9 and 10 flowers) were less efficiently utilised. We know from the trend identified in 2.4.1 that the largest flower cluster sizes are more common near the base of the spike. So this could simply be an access issue, i.e. large flower clusters near the base of the spike are deeper in the bush, often surrounded by leaves and with much less space around them. Another notion is that it is perhaps indicative of hummingbird feeding behaviour. Hummingbirds feed fast and move around a lot during feeding. For trap-lining species, spending too long at one particular flower puts them at risk of being spotted and chased off by territorial hummingbirds, and also at a greater risk from predators. Clearly, utilising all 10 flowers on one flower cluster would, although more efficient,

Page 21 of 52
require spending longer in one place. Speed is their advantage and therefore, they may feed on less flowers in a larger flower cluster in order to move to their next flower quickly and remain illusive.
2.4.5 Species concentrations
The Green Violet-ears were the species with the highest amount of visits to the bush. This particular species is the largest of the three4 and also exhibited territorial feeding behaviour. The White-tailed Emerald and Scintillant hummingbirds exhibited trap-lining feeding behaviour and visited the bush less, usually at low levels. The Green Violet-ear were frequently observed chasing off the other species and at least two were often observed perching around the bush. The other two species therefore, had less chance to feed on the bush (a certain amount of ‘ninja’ feeding behaviour was observed by these two species, where they stealthily fed on the inner parts of the bush or around the low edges, out of sight of the Green Violet-ears). Indeed, the total length of feeding time for the Green Violet-ear over the course of this study was 3 minutes 39 seconds. For the White-tailed Emerald it was 2 minutes 18 seconds, and for the Scintillant it was only 25 seconds. This shows the Green Violet-ears were able to feed more often and for longer being the ‘bosses’ of the bush. For a more detailed record of the observed behaviour of the various hummingbird species visiting the bush during Study 1, please see section 4.1 of ‘Anecdotal and Behavioural Observations’.
4 Green Violet-ear - 10cm, White-tailed Emerald - 8cm, Scintillant - 8 cm. Data from ‘Helm Field Guides. Birds of Costa Rica’ by Richard Garrigues and Robert Dean (2007).
Page 22 of 52
3. Study 2
3.1 Overview
The nature of Purple Porterweed means that a specific individual flower spike can not be monitored for lengthy periods of time, given that once the flowers reach the end of the spike, the spike dies. In Study 1 it was found that the vast majority of the spikes were reaching their natural end. In addition, all the sections combined still only amounted to a small proportion of the bush being monitored and some areas were far more popular than others (low and mid-level). Therefore, the decision was taken to concentrate on getting more data from monitoring one section (across a well-visited low-to-mid-level part of the bush), but with a greater number of flowers (40 flowers). The new selection of flowers would also reflect a more even range of flowers at different positions along the spike. In addition, any spike which stopped flowering, was replaced with another, ensuring the sample size was a constant 40 flowers. A new measurement was also introduced to try and identify whether the hummingbirds preferred flowers in close proximity to others, or those more remote from other flowers.
What was measured?
A. Hummingbird preference of flower cluster position on flower spike Do hummingbirds prefer flowers located at a particular position on the flower spike? Are the trends identified in Study 1 supported by Study 2?
B. Hummingbird preference of number of flowers in cluster Do hummingbirds prefer flower clusters of a certain size? Are the trends identified in Study 1 supported by Study 2?
C. Influence of proximity to neighbouring flower clusters
Do hummingbirds prefer flower clusters in close proximity to others?
D. Hummingbird species feeding behaviour In the average feed, does the amount of flower clusters visited and the number of individual flowers fed upon differ per species? Which species feeds on this section of the bush the most?

Page 23 of 52
3.2 Methodology
3.2.1 Set-up
No. of monitored sections: 1 Total flowers monitored: 40 Length of monitoring session: 20 minutes Number of sessions: 50 Total monitoring time: 1000 minutes / 16 hrs 40 minutes (16:40:00) Total amount of hummingbird visits: 95 Total time of feeding by hummingbirds: 24 minutes 44 seconds (0:24:44) Dates of Study 2: From 21 August 2015 to 14 September 2015
Section
Low-to-mid-level Average flower height: 50cms from ground Distance from tripod centre to front of bush: 85cm The methodology for Study 2 was the same as for Study 1, save for an additional measurement being made on the bush to determine proximity of one flower cluster to neighbouring flower clusters, as follows: ● Number of other flower clusters within a 15cm radius of the measured flower cluster ● Number of other flower clusters within a 30cm radius of the measured flower cluster A 30cm piece of string was used for this measurement, which was marked at the 15cm point.
Flowers
The same procedure was carried out to label flowers as used in Study 1, save for a sample size of 40 flowers. Care was also taken to select a broader range of flower cluster positions so that more data could be obtained across the spectrum of positions. When a flower spike expired and no longer possessed any flowers, it was replaced by a newer flower spike, which was given a new letter code and label. In total, three flowers were replaced during the course of the study.

Page 24 of 52
2.2.2 Data Recording
Data recording was carried out exactly as in Study 1. Each data item collected was identical to Study 1, with the addition of: Per flower spike:
● No. of other flower clusters within a 30cm radius ● No. of other flower clusters within a 15cm radius
For a definition and more detailed explanation of each data parameter collected, see the “Data Parameters and Definitions” section of Appendix 1.

Page 25 of 52
3.3 Findings
In all the following data analysis, where possible, data collected was put on an ‘even footing’ by dividing by the sample size. This was to ensure that there would be no bias to the results due to uneven samples.
3.3.1 Hummingbird preference of flower cluster position on flower spike
Calculation of the average flower cluster feed rate, relative to the position on the flower spike (carried out in Study 1 - 2.3.2) was repeated in Study 2. The same statistical analysis was undertaken to produce results comparable to each other. From the resulting graph (Figure 10), the trends identified and points for discussion are as follows:
a. A general preference for flower cluster positions between 11% and 80%.
b. A specific preference for flowers clusters positions in the range of 41-50% (where there are large numbers of available flower clusters in this range).
c. A specific preference for flower cluster positions in the ranges of 11-20% and
61-80%, (despite small numbers of flower clusters in the former and large numbers of flower clusters in the latter).
d. Generally, the feed rate line is further ‘left’ than in Study 1.
Figure 10.

Page 26 of 52
3.3.2 Hummingbird preference of number of flowers in cluster
Calculation of the average flower cluster feed rate, relative to the flower cluster size (carried out in Study 1 - section 2.3.3) was repeated in Study 2. The same statistical analysis was undertaken to produce results comparable to each other. From the resulting graph (Figure 11), the trends identified and points for discussion are as follows:
a. The most common flower cluster size tended to be between 4 and 8 flowers.
There was a roughly curved-shaped trend line within flower cluster size occurrences, peaking at 7.
b. A hummingbird preference for the medium-to-large flower clusters (7-10),
despite medium sizes (4-8) being more populous. Again, a roughly curved-shaped trend line, but further to the right than the ‘average number of flower clusters’ trend line.
Figure 11.

Page 27 of 52
3.3.3 Influence of proximity to neighbouring flower clusters
A new measurement was included in Study 2 to determine if the proximity of a flower cluster to other flower clusters affected hummingbird selection. In other words, do hummingbirds tend to go for tightly grouped flower clusters, or prefer ones more spaced apart? Or does it have little influence on their feeding behaviour? Figures 12 and 13 show the average feed rate relative to neighbouring flower clusters with a 15cm and 30cm range, respectively. Discussion points identified were as follows:
a. Within both 15cm and 30cm ranges, the average feed rate was fairly consistent regardless of the number of neighbouring flower clusters.
b. Within 15cm of a flower cluster, the vast majority have a low average number of neighbouring flower clusters (0.1-0.5 neighbours). Within 30cm of a flower cluster, the majority have between 1 and 4 neighbouring flower clusters, with 1-1.9 neighbours the most common.
Figure 12.

Page 28 of 52
Figure 13.

Page 29 of 52
3.3.4 Hummingbird species feeding behaviour
Figure 14 shows data related to the four individual species recorded feeding on the monitored flowers. For each species, the graph shows the following:
● the average number of flower clusters fed upon per single visit; ● the average number of individual flowers fed upon during a single visit; and ● the average number of flowers fed upon, per flower cluster.
The following discussion points can be observed:
a. The Green Violet-ear species had the highest average amount of flower clusters visited and the highest average amount of flowers fed upon.
b. The Stripe-Tailed hummingbird species had the lowest average amount of
flower clusters visited and the lowest average amount of flowers fed upon during a visit, but had the highest average amount of flowers fed upon in an individual flower cluster.
c. The White-throated Mountain Gem (Lampornis castaneoventris) species had
the lowest average amount of flowers fed upon in an individual flower cluster.
d. The White-tailed Emerald species has an average flower clusters visited between the Green Violet-ear and White-throated Mountain Gem, yet has a higher average flowers fed upon per cluster than both.
Figure 14.

Page 30 of 52
Figure 15 shows the total percentage of visits per species during the course of Study 2. The following trends can be identified:
e. The White-throated Mountain Gem species had the highest percentage of visits to the monitored flowers, closely followed by the Green Violet-ear.
f. The White-tailed Emerald was the third-most regular visitor.
g. The Stripe-tailed Hummingbird species had by far the lowest percentage of
visits to the monitored flowers.
Figure 15.

Page 31 of 52
3.4 Discussion
3.4.1 Hummingbird preference of flower cluster position on flower spike
The following is a discussion of the trends identified.
a. A general preference for flower cluster positions between 11% and 80%. In Study 1 we observed a general preference for flower cluster positions of between 31% and 80%. Now, in Study 2, the range is slightly larger, between 11% and 80%. The movement of the lower boundary can be attributed to a more even spread of flower positions sampled. As previously stated, we made a conscious effort to ensure flowers in the low positions were selected, something that was missing from Study 1, and this is reflected in the green ‘average number of flower clusters’ line in Figure 10. As in Study 1, the range here is very large and contains the vast majority of flowers. What is clear, however, is that at the extreme ends of the spike, the flower clusters are less popular. In flower cluster positions below 11% there were no recorded visits at all, and beyond 80% the feed rate falls off dramatically, much as it did in Study 1. The reason for the avoidance of flower clusters at these extreme ends of the positional scale seem quite obvious. Flower clusters in the first 10% are usually largest, but located deep within the bush and surrounded by the leaves at the base of the spike, making access an issue. Flowers at the opposite end of the spike are in the smallest clusters, often only 1 or 2 flowers strong, and thus offer less feeding opportunities than the middle-positioned flower clusters..
b. A specific preference for flowers clusters positions in the range of 41-50% (where there are large numbers of available flower clusters in this range). In Study 1 we observed a peak in feed rate at flower cluster positions of 31-40%. Here, we see a similar peak in popularity, but within the 41-50% range. Moreover, this range possesses the highest feed rate of all positions. Much as in Study 1, the discrepancy between the average number of flower clusters (green line) and feed rate is significant, which when considered with probability, strongly indicates hummingbirds are actively selecting flower clusters within this range. Not only is the feed rate highest, but there is a lower probability of selection due to lower numbers.
It is believed the change from the peak seen in Study 1 (31-40%) to the peak seen here (41-50%) can be attributed to an increased sample size, i.e. more data collected.

Page 32 of 52
c. A specific preference for flower cluster positions in the ranges of 11-20% and 61-80%, (despite small numbers of flower clusters in the former and large numbers of flower clusters in the latter).
Although less significant than the feed rate peak in the 41-50% range, the peak within the 11-20% range is interesting nonetheless. The numbers of flower clusters within this range are low, and yet the feed rate is noticeably high - again suggesting these lower positioned flower clusters are specifically targeted. We know that the position on the spike is directly related to flower cluster size, so it would follow that hummingbirds will choose to feed on the more lowly positioned clusters, simply because there are more flowers available, per flower cluster.
Another point of interest to come from Figure 10 is the peak around the 61-80% range. It was felt that this is easily explained by probability - here the flowers are clearly at their most numerous, so it was not surprising to have recorded many feeds at these ranges.
d. Generally, the feed rate line is further ‘left’ than in Study 1.
Why would this be? In Study 1, the feed rate was calculated using the data from all four sections - Low, Mid and High-level and Shaded. In Study 2, there was only one section, which was at a Low-to-mid-level. A possible reason for the shift in the popularity of the lower positional ranges may be due to the lower levels of of the bush providing better access to flower clusters near the start of the spike. The flowers which gain the most feeds in the upper sections of the bush are clearly the longer, more pronounced spikes. But at the sides, at low-to-mid-levels, the newer flower clusters are easier to access and tend to be targeted by the trap-ling species, who in trying to stay hidden stay within the safety of the bush.
3.4.2 Hummingbird preference of number of flowers in cluster
The following is a discussion of the trends identified.
a. The most common flower cluster size tended to be between 4 and 8 flowers.
In Figure 11 we see that the green line, representing the average number of flower clusters, is highest where the flower clusters are mid-sized, peaking between 4 and 8 (7 being the highest). Simply, this tells us that there were the most flowers sampled of this flower cluster size. In Study 1, the peak was between 3 and 6. This change is down to our flower selection process, where we intentionally selected a more even distribution of flower cluster positions across the ranges. By ensuring we selected more flower clusters in the lower positions, the spread of flowers in each range has moved ‘right’ on the graphs (Figures 4 and 11).
b. A hummingbird preference for the medium-to-large flower clusters (7-10),
despite medium sizes (4-8) being more populous.

Page 33 of 52
In Study 1 we identified that there was a preference for the mid-sized flower clusters, despite the small-to-medium-sized clusters being more numerous. In this study, we see that this trend has moved to the ‘right’, also. As discussed in the previous point, the mid-sized flower clusters were most populous, and in this study, we find that the medium-to-large flower cluster sizes are the most fed upon. So why is this? In 3.4.1 we saw that there is a preference for hummingbirds to target the less numerous, lower-positioned clusters. We also know that due to the direct relationship between position on the spike and flower cluster size, these lower-positioned clusters tend to be larger. It would therefore follow, that the most popular flower cluster sizes fed upon would be at the larger end of the spectrum - exactly what we see here. The difference between the findings in Study 1 and 2 is most likely explained by the reasoning of point D in 3.4.1 - namely that the monitored section in Study 2 most likely provides easier access to larger flower clusters and attracts more trap-lining species.
3.4.3 Influence of proximity to neighbouring flower clusters
The following is a discussion of the trends identified.
a. Within both 15cm and 30cm ranges, the average feed rate was fairly consistent regardless of the number of neighbouring flower clusters. The feed rates visible in Figures 12 and 13 show no obvious preference for proximity as the lines are fairly consistent and straight, only deviating by a maximum of 5%. Therefore, we can draw the conclusion that the proximity of neighbouring flower clusters does not have a large impact on hummingbirds’ choice of flowers. It is worth noting however, that the number of flowers sampled across the various ranges were very uneven (as seen in the green lines in Figures 12 and 13), most likely reflecting the nature of the bush. The vast majority of flower spikes fed upon had a small average number of neighbours - 0.1-0.5 within 15cm and 1-1.9 within 30cm. Probability dictates that it is more likely that a hummingbird would feed on one of these flowers than the remainder, due to their greater frequency. When you consider that all other ranges have a similar feed rate, despite smaller numbers of flowers and thus reduced probability, it could hint at a preference for flower clusters with more neighbours. However, from the data collected, there is no way to be sure. For certainty, a repeat study would need to be carried out, where an even number of flowers within each range of neighbours were sampled. This would provide a more balanced, albeit unnatural, sample to test.
b. Within 15cm of a flower cluster, the vast majority have a low average number of neighbouring flower clusters (0.1-0.5 neighbours). Within 30cm of a flower

Page 34 of 52
cluster, the majority have between 1 and 4 neighbouring flower clusters, with 1-1.9 neighbours the most common. In the previous point, we asserted that hummingbirds do not consider the proximity of neighbouring flower clusters, when selecting flowers to feed from. Purple Porterweed therefore stands to gain little by growing flower clusters very close together. In fact, it makes sense that the plant would not have evolved to grow flower clusters too close together. Tightly packing its flower clusters would make them less accessible to hummingbirds - one of its largest pollinators. Given the way the flowers grow evenly around the spike, covering 360o, it’s important that the plant naturally provides access from all angles - hence the protruding spikes. This also ensures good access to light for the leaves of each flower spike: critical for nectar production. Earlier in this report we saw that the bush naturally has a larger number of spikes with flower clusters in the latter half of their growth - where they tend to be longer and protrude from the bush more. This is most likely a device to ensure that the flower clusters are well spread.

Page 35 of 52
3.4.4 Hummingbird species feeding behaviour
The following is a discussion of the trends identified. During the course of Study 2, there was a noted change in the species of hummingbirds visiting the bush. The territorial Green Violet-ear pair that had been observed in Study 1 vacated the bush part way through Study 2. They were replaced by a male White-throated Mountain Gem who became the dominant territorial hummingbird of the bush. There is further discussion of this observed behaviour in Section 4 ‘Anecdotal and behavioural observations’.
Regarding Figure 14:
a. The Green Violet-ear species had the highest average number of flower clusters visited and the highest average number of flowers fed upon. A pair of Green Violet-ears were the dominant species for approximately half of Study 2. During this time, they were observed regularly feeding on the bush and sharing territorial duties, i.e. chasing off other nectar consuming birds and even large insects.
It was not unexpected to see the territorial species feeding on more flower clusters and individual flowers, due to their almost continuous presence at the bush.
A Green Violet-ear pair sharing the bush, could go someway towards explaining why they would have both the highest average number of flower clusters visited and the highest average number of flowers fed upon, per visit. By sharing territorial duties, they would be interrupted from feeds less often. They may also feel safer and confidently feed for longer. We also observed them being less vigilant in defending the bush than the subsequently dominant White-throated Mountain Gem. Indeed, we recorded many more visits to the bush during the Green Violet-ears’ tenure, than during the White-throated Mountain Gem’s.
b. The Stripe-Tailed hummingbird species had the lowest average amount of
flower clusters visited and the lowest average amount of flowers fed upon during a visit, but had the highest average amount of flowers fed upon in an individual flower cluster. There was only one recorded visit from a Stripe-tailed hummingbird during Study 2, therefore it could be misleading to draw any conclusions from its feeding behaviour when compared to the other species.

Page 36 of 52
c. The White-throated Mountain Gem species had the lowest average amount of flowers fed upon in an individual flower cluster. It is interesting that the White-throated Mountain Gem, another dominant species, had the lowest feeding averages, whilst the Green Violet-ears had the highest. As mentioned previously, the White-throated Mountain Gem was solitary and had to defend the entire bush. It was regularly witnessed chasing off other species, and generally was more vigilant in defending the bush. Because of this it was regularly interrupted from feeds. Of course, because its feeds were evidently shorter in length by choice or otherwise (less flowers and less flower clusters fed upon, on average per visit), it meant it had to feed more often. In contrast, the Green Violet-ears would feed for longer, but less often. It would be interesting to see if a White-throated Mountain Gem would feed for longer if the bush was smaller (and therefore easier to defend) or if it shared the bush with another of its species. It’s possible that this may make no difference and that this particular species is just more aggressive in its territorialism, perhaps because it is a slightly smaller bird than the Green Violet-ears.
d. The White-tailed Emerald species has an ‘average flower clusters visited’
between the Green Violet-ear and White-throated Mountain Gem, yet has a higher average flowers fed upon per cluster than both. The White-tailed Emerald is the one species that was consistently observed feeding on the monitored section throughout Study 2 (and Study 1). Although not ever-present, like the dominant species, it made regular appearances; clearly showing itself to be a trap-lining species.
In almost all instances, it was required to feed stealthily to avoid detection by the resident territorial bird(s). Many times it was observed being chased off. Crucially, however, when it did get to feed, it was observed making the most of the opportunity. The data collected shows that more than any other species, it recorded a mix or very short feeds (when chased away) and very long feeds (sometimes upwards of 60 flowers). It is therefore perhaps unsurprising that in terms of average feed length (number of flower clusters visited and flowers fed upon) it is down the middle.
One additional point is that the White-tailed Emerald possesses a higher flower cluster utilisation (3.8) than the two dominant species. In other words, it feeds more efficiently by feeding on more flowers per flower cluster. This lends further weight to the notion that the White-tailed Emerald must make the most of its feeding opportunities, being a subservient trap-lining species.
Regarding Figure 15:

Page 37 of 52
e. The White-throated Mountain Gem species had the highest percentage of visits to the monitored flowers, closely followed by the Green Violet-ear.
As a consequence of this ‘change over’ of the dominant territorial species, Figure 15 shows that the White-throated Mountain Gem had the most recorded visits on the bush (all recorded in the latter half of Study 2). The Green Violet-ears were slightly below this (their visits all recorded in the first half of Study 2). However, both of these species were the most numerous visitors to the labelled flowers due to their territorial behaviour.
f. The White-tailed Emerald was the third-most regular visitor
As mentioned in point D, the White-tailed Emerald is a trap-lining species. Because of this, it wasn’t a fixture at the bush but a fairly regular visitor. You would therefore expect it to have recorded many less visits than the territorial species. However, due to the change of dominance at the bush (from Green Violet-ears to White-throated Mountain Gem) and the consistent visits from the White-tailed Emerald, we observed only 9 less visits than the highest recorded visitor - the White-throated Mountain Gem.
g. The Stripe-tailed Hummingbird species had by far the lowest percentage of
visits to the monitored flowers.
There was only one recorded visit by a Stripe-tailed Hummingbird, therefore this easily explains its low percentage. It also only appeared towards the end of Study 2, when the White-throated Mountain Gem took over the bush. When the Stripe-tailed Hummingbird was observed on the bush (exhibiting trap-lining feeding behaviour), it tended to hug the right-hand side (outside of our monitored section) and was often chased off by the male White-throated Mountain Gem. As already stated, the White-throated Mountain Gem was more aggressive in defending the bush than the Green Violet-ear pair had been.
There is further discussion of all the observed behaviour mentioned above, in Section 4 ‘Anecdotal and behavioural observations’.

Page 38 of 52
4. Anecdotal and behavioural observations
4.1 Study 1 - Weeks 1 & 2
4.1.1 Green Violet-ears
During this period, the Gavilan bush was dominated by the Green Violet-ears. There were usually two in attendance (a suspected pair), but we did see up to 3 at once on the odd occassion. They seemed to vary in their levels of tolerance for each other; one minute happily feeding next to each other, the next chasing each other away. They were often seen perching above or near the bush resting before resuming another feeding session. They tended to choose different perching spots from each other, often returning to the same spot. Feeding intervals were usually between 5-10 minutes in length, unless called into territorial action, i.e. to chase off another species. Immediately after a chase, a feed would often ensue They consistently chased away the Scintillant and White-tailed Emerald. During this period, the Green Violet-ears tended to feed around the mid-level and high-level portions of the bush, very rarely venturing into the low-level.
4.1.2 White-tailed Emerald
The White-tailed Emerald would often hide in the bush and venture out to feed on the mid-level and lower-level flowers when the Green Violet-ears weren’t in attendance. Often though, it was seen and was chased off. Regularly, it was only a few seconds later that it would resume feeding. It’s intermittent attendance at the bush, suggests it is a trap-lining feeder. The White-tailed Emerald was witnessed chasing off the Scintillant hummingbird, suggesting a pecking order, perhaps defined by bird size.
4.1.3 Scintillant
The Scintillant hummingbird exhibited similar behaviour to the White-tailed Emerald, attempting to covertly feed on the flowers out of sight of sight of the Green Violet-ears. More so than the White-tailed Emerald, it fed almost exclusively on the low-level portion of the bush. Similar to the White-tailed Emerald, it appears to be a trap-lining feeder; visiting the bush far less frequently than the Green Violet-ears.
Page 39 of 52
4.2 Study 2 - Week 1
4.2.1 Green Violet-ears
During this initial period of Study 2, the Green Violet-ear pair continued to dominate the Gavilan bush. Interestingly, they were noticeably prepared to feed all over the bush, regularly visiting the low-level areas (unlike before) and recording many visits on our low-to-mid-level study section. They also appeared to have more-or-less divided the bush into two, with one bird perching, feeding and defending the left-hand side, and the other bird doing similar on the right.
4.2.2 Scintillant hummingbird
The Scintillant hummingbird became noticeable by its absence, as our data shows. Having been a regular visitor to the bush, its visits became less frequent, until it was hardly ever seen. Indeed, no visits were recorded for the Scintillant in the entirety of Study 2.
4.2.3 White-tailed Emerald
The White-tailed Emerald continued to behave as before, regularly managing feeds on the mid-to-low-level areas of the bush, in between being chased off by the Green Violet-ears. We recorded a good number of feeds from this species during this period.
4.3 Study 2 - Weeks 2 & 3
After the weekend of 29 and 30 August 2015, it was observed on Monday 31 August 2015 that a significant change had occurred on the bush.
4.3.1 Green Violet-ears
The Green Violet-ear hummingbirds were less present, indeed only one was seen on that Monday. On subsequent days, a solitary bird made an occasional appearance, but was subjected to territorial behaviour from the now-resident White-throated Mountain Gem. The Green Violet-ear appeared unconcerned about the White-throated Mountain Gem’s behaviour, continuing to feed regardless. On the next observation day (Wednesday 2 September), the Green Violet-ear hummingbirds were not present at all and seemed to have vacated their position as bosses of the bush and quit the immediate area.
4.3.2 White-throated Mountain Gem
A male White-throated Mountain Gem was first observed on the bush on Monday 31st August. He was exhibiting territorial behaviour, chasing off the White-tailed Emerald and, for the first few days, a Snowy-bellied Hummingbird (Amazilia edward). As mentioned above, it also attempted to chase off the Green Violet-ear that visited. Through the duration of this period, this solitary male White-throated Mountain Gem established himself as the new ‘boss’ of the bush, regularly and efficiently chasing off all-comers. He was observed feeding

Page 40 of 52
at all levels of the bush, although concentrating his efforts the left-hand side, where there are over-hanging trees for perching and shade. During the last few days of the study, a female White-throated Mountain Gem was also observed feeding at the bush. The dominant male chased her off, although she did manage some feeds, including some on the monitored flowers, as the data shows.
4.3.3 Snowy-bellied hummingbird
Very briefly, after the apparent shift of power that had occurred on the bush, a Snowy-bellied hummingbird made a few appearances. For the first two observation days (Monday 31 and Wednesday 2 September) it successfully fed on the bush and appeared to be sharing both the flowers and the territorial duties with the White-throated Mountain Gem, perhaps hoping to vie for control of the bush. However, it soon became the subject of the White-throated Mountain Gem’s territorial chases and after these two initial days, was no longer seen at the bush. It is possible, that the bird described in section 4.4 is the same individual as above - in which case it may have been trying, unsuccessfully, to ‘upgrade’ the bush it defends.
4.3.4 Stripe-tailed hummingbird
During the final 2 weeks of the observation, a Stripe-tailed hummingbird (Eupherusa eximia) was also present and attempting to feed; none having been observed on the bush before. The White-throated Mountain Gem was now the dominant territorial feeder and regularly chased off the Stripe-tailed. Owing to the size of the bush, and the fact that the Stripe-tailed hummingbird concentrated on the right-hand side of the bush (away from the White-throated Mountain Gem’s favoured left-hand side), it managed to feed regularly. It’s frequent appearances gave the impression it wasn’t trap-lining and was a non-dominant territorial feeder.
4.3.5 White-tailed Emerald
During this period of flux at the bush, the White-tailed Emerald continued to make appearances and feed. However, the single White-throated Mountain Gem was more effective at defending the bush than the previously dominant Green Violet-ears, so the White-tailed Emerald was less successful in its visits. Perhaps because of this, it made less appearances and we recorded less visits than we had before.
4.3.6 Other species
During this phase of study 2, there were sightings of a Green Hermit (Phaethornis guy) and Purple-crowned Fairy (Heliothryx barroti) around the monitored bush. However, it’s worth noting that they made no attempt to feed on the bush whatsoever, suggesting Purple Porterweed is not on their menu.

Page 41 of 52
4.4 Other sites: Behind Gavilan
Behind the Gavilan building (approximately 10 metres from the monitored bush), there is another, smaller, Purple Porterweed bush. Here, we observed a dominant Snowy-bellied hummingbird. During the entirety of Study 1 and the majority of Study 2, a Snowy-bellied hummingbird wasn’t seen feeding at the main bush. This suggests that although it clearly is a territorial feeder, due to its lower position in the ‘pecking order’, it can only defend a smaller bush. The Snowy-bellied hummingbird at this site was observed chasing off Scintillant, White-tailed Emerald and Strip-tailed hummingbirds.
4.5 Other sites: The Casita
Next to the Casita accommodation, is another Purple Porterweed bush. Here, we frequently witnessed territorial behaviour from a Snowy-bellied hummingbird, who appeared to ‘control’ this bush. For a period of approximately 4 weeks, it faced no competition from larger or higher-pecking order birds, only needing to chase off trap-liners. However, much as with our monitored bush, the status quo changed. For a day or two, a male White-throated Mountain Gem was seen fighting with the Snowy-bellied. The White-throated Mountain Gem appeared to be more dominant and soon established himself as the new ‘boss’ of the bush. The Snowy-bellied attempted to chase him off over a couple of days, but soon gave up and wasn’t seen on the bush again. For the remainder of our time in Cloudbridge, the male White-throated Mountain Gem continued to control this bush, defending it mainly from Snowy-bellied hummingbirds and others of the same species (including a female). Brief visits were observed by White-tailed Emeralds and Stripe-tailed Hummingbirds.

Page 42 of 52
5. Conclusion The following are conclusions drawn as a result of Study 1 and Study 2.
5.1 Purple Porterweed
1. The Purple Porterweed plant has a definitive link between the flower cluster position on a spike, and the flower cluster size. At the beginning of the spike, the flower clusters tend to be at their largest, getting smaller as they move along the length of spike.
2. At any given time, the plant has more spikes with flower clusters in advanced positions. We believe this is due to the life-cycle of a spike, where the progression of a flower cluster appears to slow due to the growth of the spike itself - which appears to be uneven. i.e. the second half of a spike’s life-cycle is longer than the first.
5.2 Feeding behaviour
3. Hummingbirds will feed on flower clusters of any size, and any position. There is a notable disfavor for flower cluster positions at the base of the spike and the tip, where flower cluster sizes are largest and smallest respectively.
4. Hummingbirds favour flower clusters which are in the low-to-mid positions (31-50%) on the spike, despite further advanced flower clusters being more numerous.
5. Hummingbirds favour flower clusters which are of medium-to-large flower cluster size (7-10 flowers), despite smaller flower clusters being more numerous.
6. Referring to points 4 and 5 above, the preferences identified are most likely due to compromise, offering a healthy balance between flower cluster size, spike position and availability and access.
7. Feeding utilisation (number of flowers fed on, per cluster) was measured lowest at the extreme ends of flower cluster size, with flower clusters of 9-10 flowers the least efficiently utilised.
8. Proximity to neighbouring flower clusters doesn’t appear to influence selection. There
is a likely preference for flowers bunched close enough to make moving between them convenient, but far enough apart to provide access. However, this is unproven and would require further study.

Page 43 of 52
5.3 Species behaviour
9. The length of the average feed differs per species. Green Violet-ears were observed feeding on the most flowers and visiting the most flower clusters during the average visit. Whereas, the White-throated Mountain Gem was observed feeding on less flowers and clusters. This was due to the Green Violet-ears dominating the bush as a pair and the White-throated Mountain Gem being more vigilant in chasing off rival feeders.
10. Some hummingbird species do favour particular parts of a flowering bush. The small
trap-lining species (Scintillant, White-tailed Emerald) prefer to feed on the low-level and mid-level sections where they can remain undetected by the territorial species. The territorial species (Green Violet-ear, White-throated Mountain Gem) tend to feed on the high-level and mid-level sections, most likely for convenience, but will feed anywhere. They also tend to favour certain sections of the bush, possibly due to the availability of perching positions.
11. The apparent hierarchy and resident population of a bush is dynamic. The dominant and subservient bird(s) or species will periodically be replaced by other bird or species. The dominant species ‘changing of the guard’ will also influence the subservient species which visit the bush, with some territorial species being more vigilant in defending the bush than others. It is thought these periodical changes are triggered primarily by the availability and production of nectar.

Page 44 of 52
6. Suggestions for further study The following are suggestions for possible improvements and/or extensions to our study:
● To measure the amount of nectar produced by the plant over a day, and at different flower cluster positions, which would help in interpreting the data produced.
● To study a number of other Purple Porterweed sites within the reserve to see if the trends identified are consistent.
● Any different sites monitored could also be across a range of altitudes to see if there are any trends different trends or species of hummingbird.
● To measure length of feeds and rests by territorial species to compare feeding and resting behaviours.
● To increase the amount of time spent monitoring hummingbirds, not only to produce more data but also to have sufficient time to process and analyse the data.
● A person conducting any further study would be advised to utilise better camera recording equipment to be able to record for longer (we were limited by using the video function on our photographic camera which can only record for 20 minutes and used the battery quickly).
● To study different plants fed on by hummingbirds. ● A possible extension would also be to electronically tag hummingbirds, particularly
the trap-lining species, to understand their distribution and favoured feeding sites across the reserve.
7. A sidenote - planting and/or using feeders to attract hummingbirds If Cloudbridge were to consider planting and/or using feeders to attract hummingbirds, from the observed behaviour during this study and also behaviour seen by us at other feeders in Monteverde, the following would be useful to consider:
● To always plant multiple flowering plants, spaced a few metres apart. If one large plant is planted, the risk is that only one territorial species will occupy the plant and visits from other species will be limited.
● To ensure that flower patches are available across the reserve to allow trap-liners to feed.
● To ensure sufficient diversity of plants which are accessible for feeding by long-billed hummingbirds and short-billed hummingbirds.
● To ensure that an area with feeders is also sufficiently planted with flowers so that natural feeding behaviour is not entirely discouraged.

Page 45 of 52
● To make sure that feeders are regularly cleaned to limit the risk of diseases, and limit the insects who will also utilise feeders (otherwise the bees and wasps become unbearable for hummingbirds and humans alike).
Appendix 1 - Data collection parameters and definitions
1. Data Collection Parameters - Session
Session (ID#) A session is one recording/monitoring period of 20 minutes. Each session is given a unique, ascending, ID number. Date (dd.mm.yyyy) Date the session is recorded/monitored. Location Site name (e.g. Gavilan) Section (ID#) Section number (e.g. 1 - Low, 2 - Mid, 3 -High, 4 - Shade) Time of start (hh:mm - 24 hr clock) Time session recording/monitoring begins Time of finish (hh:mm - 24 hr clock) Time session recording/monitoring ends Duration (h:mm:ss) Duration of session. i.e. 0:20:00. Conditions Weather conditions during session. Surveys are only conducted during good weather. If rain becomes heavy, abandon session. Conditions are entered as one of: Sunny; Cloudy; Sunny intervals; Light rain. Flowers per flower cluster Number of flowers on the spike. Do not count dead or shrivelled flowers. Also record total flowerheads in section. Length of spike (cm) Distance from the last leaf, to the tip of the stem. Round to nearest whole centimetre. Distance of lowest flower from spike base (cm) Distance from the last leaf, to the lowest flower’s base. Round to nearest whole centimetre. Flower cluster position (%)

Page 46 of 52
How far along the spike is the lowest flower, expressed as a percentage. Calculation: (Dist. of lowest flower from spike base / Length of spike) * 100 = Lowest flower position ratio No. of other flower clusters in 30cm radius (Study 2 only) Using the measuring string, how many other flower clusters fall within a 30cm radius of the flower cluster in question. Measured from the centre of one flower cluster to another. No. of other flower clusters in 15cm radius (Study 2 only) Using the measuring string, how many other flower clusters fall within a 15cm radius of the flower cluster in question. Measured from the centre of one flower cluster to another.
2. Data Collection Parameters - Visits
Definition: Visit A visit is defined as a hummingbird feeding on one or more monitored flower spikes, during a recording session. The hummingbird may visit other, non-monitored flower spikes during a single visit, provided a gap of no more than 10 seconds between feedings from monitored flower spikes occurs. Should a gap between it visiting monitored spikes exceed 10 seconds, for instance if it stops to rest, chases off another hummingbird or visits the other side of the bush, then returns, this is considered the start of a new visit. There is no limit to the number of flower spikes that a single hummingbird can feed on during a visit. Visit number (ID#) Each visit is given a unique ID number, per session. i.e. first visit of a new session is #1. Time (hh:mm - 24 hr clock) Time hummingbird first visits a monitored flower. Time of visit (hh:mm:ss) The time on the video when the hummingbird first feeds on a monitored flower spike. Length of visit (hh:mm:ss) The time elapsed between the Time of visit and when the hummingbird last feeds on a monitored flower spike, within the parameters of a visit (see above). Species The species of hummingbird feeding during the visit. Sequence of flowers visited (#) The order in which the hummingbird feeds on monitored flower spikes. e.g. if it feeds on flower G first, then a 1 is recorded under G. Also record the total count of monitored flower spikes fed from, for the duration of the visit.
Page 47 of 52
Number of flowers visited per spike (#) A best estimate of the number of individual flowers the hummingbird feeds from on each visited flower cluster. Video footage in slow-motion provides assistance. e.g. if it feeds on 4 flowers when visiting flower cluster G, record 4 under G. Note, it is assumed that if a hummingbird appears to feed on a flower, then it must be recorded as doing so, as we have no way of knowing for sure if it actually consumed nectar or not. Also record the total count of flowers visited, for the duration of the visit. Notes Record any of the following which occur:
● Any observations of interest relating to the hummingbird behaviour for the duration of the visit.
● Note if a hummingbird is chased off, or chases another mid-feed. ● Note if the hummingbird stops to rest between feeds.

Page 48 of 52

Page 49 of 52
Appendix 2 - References
1. 'Helm Field Guides - Birds of Costa Rica' by Richard Garrigues and Robert Dean. Published by Christopher Helm, 2007.
2. 'Hummingbirds. A Life-size Guide to Every Species' by Michael Fogden, Marianne Taylor & Sheri L.Williamson. Published by Ivy Press, 2014.
3. 'Birds of Tropical America' by Steven Hilty. Published by University of Texas Press, 2005.
4. 'The Complete Book of Hummingbirds' by Tony Tilford. Published by Thunder Bay Press.
5. 'Tropical Plants of Costa Rica' by Willow Zuchowski. Published by Zona Tropical, 2007.
6. 'A Field Guide to Plants of Costa Rica' by Margaret B.Gargiullo, Barabara Magnuson and Larry Kimball. Published by Zona Tropical, 2008.
7. Blue Porterweed - University of Florida: http://lee.ifas.ufl.edu/Hort/GardenPubsAZ/Blue_porterweed.pdf
8. http://digital.lib.usf.edu/SFS0001254/00001 9. http://www.scielo.br/scielo.php?pid=S0085-56262006000400010&script=sci_arttext

Page 50 of 52
Appendix 3 - Sample data recording sheets Next two pages. First is Study 1 data sheet, then Study 2 data sheet.

Page 51 of 52

Page 52 of 52