hungary - international university of japan territory at the second battle of mohacs in 1687,...
TRANSCRIPT
Country Profile 2003
HungaryThis Country Profile is a reference work, analysing thecountry�s history, politics, infrastructure and economy. It isrevised and updated annually. The Economist IntelligenceUnit�s Country Reports analyse current trends and provide atwo-year forecast.
The full publishing schedule for Country Profiles is nowavailable on our website at http://www.eiu.com/schedule
The Economist Intelligence Unit15 Regent St, London SW1Y 4LRUnited Kingdom

The Economist Intelligence Unit
The Economist Intelligence Unit is a specialist publisher serving companies establishing and managingoperations across national borders. For over 50 years it has been a source of information on businessdevelopments, economic and political trends, government regulations and corporate practice worldwide.
The Economist Intelligence Unit delivers its information in four ways: through its digital portfolio, where itslatest analysis is updated daily; through printed subscription products ranging from newsletters to annualreference works; through research reports; and by organising seminars and presentations. The firm is amember of The Economist Group.
LondonThe Economist Intelligence Unit15 Regent StLondonSW1Y 4LRUnited KingdomTel: (44.20) 7830 1007Fax: (44.20) 7830 1023E-mail: [email protected]
New YorkThe Economist Intelligence UnitThe Economist Building111 West 57th StreetNew YorkNY 10019, USTel: (1.212) 554 0600Fax: (1.212) 586 0248E-mail: [email protected]
Hong KongThe Economist Intelligence Unit60/F, Central Plaza18 Harbour RoadWanchaiHong KongTel: (852) 2585 3888Fax: (852) 2802 7638E-mail: [email protected]
Website: www.eiu.com
Electronic deliveryThis publication can be viewed by subscribing online at www.store.eiu.com
Reports are also available in various other electronic formats, such as CD-ROM, Lotus Notes, on-line databasesand as direct feeds to corporate intranets. For further information, please contact your nearest EconomistIntelligence Unit office
Copyright© 2003 The Economist Intelligence Unit Limited. All rights reserved. Neither this publication norany part of it may be reproduced, stored in a retrieval system, or transmitted in any form or by any means,electronic, mechanical, photocopying, recording or otherwise, without the prior permissionof The Economist Intelligence Unit Limited.
All information in this report is verified to the best of the author's and the publisher's ability. However, theEconomist Intelligence Unit does not accept responsibility for any loss arising from reliance on it.
ISSN 0269-6061
Symbols for tables�n/a� means not available; �-� means not applicable
Printed and distributed by Patersons Dartford, Questor Trade Park, 151 Avery Way, Dartford, Kent DA1 1JS, UK.
Country Profile 2003 www.eiu.com © The Economist Intelligence Unit Limited 2003
Hungary 1
© The Economist Intelligence Unit Limited 2003 www.eiu.com Country Profile 2003
Contents
3 Basic data
4 Politics4 Political background5 Recent political developments8 Constitution, institutions and administration10 Political forces15 International relations and defence
18 Resources and infrastructure18 Population19 Education20 Health22 Natural resources and the environment23 Transport, communications and the Internet24 Energy provision
27 The economy27 Economic structure28 Economic policy35 Economic performance38 Regional trends
38 Economic sectors38 Agriculture40 Mining and semi-processing40 Manufacturing42 Construction43 Financial services45 Other services
45 The external sector45 Trade in goods47 Invisibles and the current account48 Capital flows and foreign debt49 Foreign reserves and the exchange rate
51 Appendices51 Membership of regional organisations53 Sources of information54 Reference tables55 Labour force55 Transport statistics55 Structure of energy sources (production plus imports)56 Central state budget56 Money supply57 Gross domestic product57 Gross domestic product by expenditure58 Gross value added by sector58 Prices58 Volume indices of sales of agricultural products
2 Hungary
Country Profile 2003 www.eiu.com © The Economist Intelligence Unit Limited 2003
59 Livestock numbers59 Output of energy, minerals and mineral products59 Industrial production by sector60 Construction60 Budapest Stock Exchange60 Retail sales61 Imports61 Main trading partners62 Balance of payments63 External debt, World Bank estimates64 Foreign reserves64 Exchange rates
Hungary 3
© The Economist Intelligence Unit Limited 2003 www.eiu.com Country Profile 2003
Hungary
Basic data
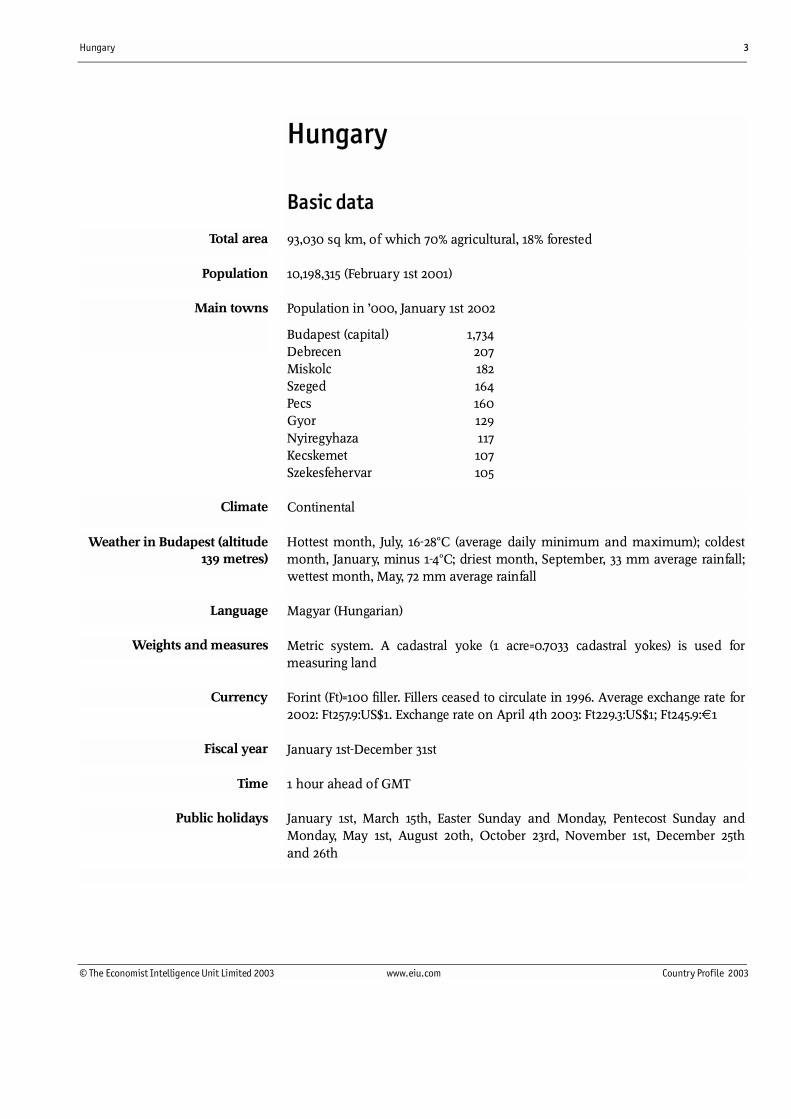
93,030 sq km, of which 70% agricultural, 18% forested
10,198,315 (February 1st 2001)
Population in �000, January 1st 2002
Budapest (capital) 1,734Debrecen 207Miskolc 182Szeged 164Pecs 160Gyor 129Nyiregyhaza 117Kecskemet 107Szekesfehervar 105
Continental
Hottest month, July, 16-28°C (average daily minimum and maximum); coldestmonth, January, minus 1-4°C; driest month, September, 33 mm average rainfall;wettest month, May, 72 mm average rainfall
Magyar (Hungarian)
Metric system. A cadastral yoke (1 acre=0.7033 cadastral yokes) is used formeasuring land
Forint (Ft)=100 filler. Fillers ceased to circulate in 1996. Average exchange rate for2002: Ft257.9:US$1. Exchange rate on April 4th 2003: Ft229.3:US$1; Ft245.9:€1
January 1st-December 31st
1 hour ahead of GMT
January 1st, March 15th, Easter Sunday and Monday, Pentecost Sunday andMonday, May 1st, August 20th, October 23rd, November 1st, December 25thand 26th
Total area
Population
Weights and measures
Currency
Fiscal year
Time
Public holidays
Main towns
Climate
Language
Weather in Budapest (altitude139 metres)
4 Hungary
Country Profile 2003 www.eiu.com © The Economist Intelligence Unit Limited 2003
Politics
The head of state is the president, currently Ferenc Madl, who was elected byparliament for a five-year term on June 6th 2000, although power rests mostlywith parliament. A centre-left coalition government, comprising the HungarianSocialist Party and the liberal Alliance of Free Democrats, took office in May2002, and is led by the prime minister, the Socialists� Peter Medgyessy. TheSocialists and Free Democrats also co-operated in government in 1994-98 andreplace a right-of-centre coalition, led by the Fidesz-Hungarian Civic Party(commonly referred to as �Fidesz�). Since the end of communist rule, reform-minded centre-right and centre-left coalitions have alternated in power.
Political background
Magyar tribes from the region between the Volga, Kama and Belaya rivers andthe Ural mountains, now in Russia, settled in the Carpathian Basin towards theend of the ninth century. The date of settlement is traditionally commemoratedas 896. The foundation of the Hungarian state is dated to 1000, when King(later Saint) Stephen also adopted Christianity. The medieval Hungariankingdom suffered a catastrophic defeat at the hands of the Ottomans in thebattle of Mohacs in 1526 and was partitioned between Austria, the Ottomansand a nominally independent Transylvania. The Austrians drove the Turks fromHungarian territory at the second battle of Mohacs in 1687, allowing Austria totake control of all of Hungary under the 1699 Treaty of Karlowitz.
National and social tensions under Austrian rule led to a nationalist/liberaluprising as part of the pan-European 1848 revolutions. Lajos Kossuthestablished an independent national government, but this was crushed in 1849with Russian help. However, the Compromise (Ausgleich) of 1867 reorganisedthe Habsburg empire as the Dual Monarchy of Austria and Hungary, allowingMagyar domination of Hungarian lands and German domination of Austrianlands, with Slav-inhabited areas divided between the two. The last quarter ofthe nineteenth century saw political stability, an economic boom and muchsocial and infrastructural modernisation, with the newly-unified Budapestacquiring many of its major public buildings.
The military defeat of the Austro-Hungarian monarchy in 1918 led to a dramaticreduction in the area and population of Hungary. The 1920 Trianon Treatyreduced Hungary�s territory from 288,000 sq km to 93,000 sq km, and thepopulation from 18.2m to 7.6m, leaving sizeable Hungarian minorities inneighbouring Czechoslovakia, Romania and the future Yugoslavia. Acommunist-dominated revolutionary government in March-August 1919 gaveway to a long period of conservative rule under the regency of Admiral MiklosHorthy. In the 1930s Hungary grew increasingly close to Germany, allying itselfwith the Nazi power in the hopes of regaining territory from Czechoslovakia,Romania and Yugoslavia. It allied itself with the German side in the secondworld war. Germany occupied Hungary from March 1944 until the Soviet RedArmy pushed out its troops in early 1945.
Early history
Austro-Hungary

Hungary 5
© The Economist Intelligence Unit Limited 2003 www.eiu.com Country Profile 2003
A free election in November 1945 resulted in a majority for the Smallholders�Party, but another�this time flawed�election in 1947 gave the largest vote shareto the Communist Party, which established one-party rule and nationalisedproperty. Stalinism dominated Hungary until 1953. A revolution began inBudapest on October 23rd 1956. The reform communist prime minister, ImreNagy, declared Hungary�s neutrality and withdrawal from the Warsaw Pact,prompting a Soviet Red Army invasion on November 4th. By mid-December allresistance had been crushed and Janos Kadar, the general secretary of therestyled Hungarian Socialist Workers� Party (MSZMP), began the task ofpolitical consolidation.
The regime relaxed its political stance somewhat from the early 1960s onwards,with a final amnesty for the revolutionaries declared in March 1963. In 1968Hungary introduced the New Economic Mechanism, a reform packagedesigned to increase enterprise autonomy and the role of markets in economicdecision-making. The more liberal system resulted in a boom in agriculturaland consumer goods production, but income inequality increased and globalrecessions following the 1973 and 1979 oil price shocks undermined the reformefforts. Worsening terms of trade, combined with excessive imports of Westerntechnology and consumption goods, increased the country�s foreign debt toalmost US$11bn by the early 1980s. Signs of social difficulties appeared, such asthe start of population decline on the back of high death and low birth rates.
Recent political developments
When the 13th Congress of the MSZMP in 1985 failed to bring substantialchanges in policy, unrest among reformers within the party and state apparatusbegan to increase. Karoly Grosz replaced Mr Kadar as general secretary of theMSZMP in May 1988, and reformists (led by Imre Pozsgay and the architect ofthe 1968 economic reform, Rezso Nyers) gained control of the party in 1989. Theprime minister, Miklos Nemeth, also enacted political liberalisation. In adramatic break with the past, Imre Nagy, who had been secretly executedfollowing the 1956 revolution, was given a public funeral and reburial in June1989. The MSZP joined with opposition groups in national roundtablenegotiations about establishing democracy and, in October 1989, transformeditself into the Hungarian Socialist Party.
Post-communist Hungary has benefited from a high level of political stability.Despite often bitter conflict between government and opposition, democraticprocedures have become accepted and ensure a smooth and orderly transfer ofpower. The four democratic parliamentary elections since 1990 have eachbrought changes in direction�an alternation between centre-right and centre-left�with all three previous governments retaining a working majority andserving out their four-year term. The current Socialist-liberal coalition lookslikely to do the same. Party politics has also been relatively stable, with all fourparties represented in the current parliament present in the legislature since1990. Political stability has been reinforced by negotiations for EU membershipsince 1998 and accession to NATO in March 1999.
The communist takeover
Post-communist Hungary
End of the communist era

6 Hungary
Country Profile 2003 www.eiu.com © The Economist Intelligence Unit Limited 2003
In the March-April 1990 parliamentary election the opposition HungarianDemocratic Forum emerged as the most popular party and formed a coalitiongovernment with two other conservative parties, the IndependentSmallholders� Party and the Christian Democratic People�s Party. The liberalparties, the Alliance of Free Democrats and the Federation of Young Democrats(Fidesz), joined the Socialists in opposition. Jozsef Antall, the president of theHungarian Democratic Forum, became the prime minister and made a post-election deal with the Free Democrats that increased his powers, as well aseliminating the two-thirds majority requirement on most legislation. Althoughthe government set some important institutional reforms in motion, in 1993-94it pursued an undisciplined spending programme that left the budget in severedeficit and had a negative effect on the current-account deficit.
The May 1994 election returned the Socialists to power. Despite having anabsolute majority, the Socialists formed a coalition government with the FreeDemocrats. The government introduced an austerity programme (the �BokrosPackage�) in March 1995 designed to curb the government deficit and theexternal account imbalances. Economic growth decelerated and real wages fellsharply as a result, but by 1997 the government�s policies began to yield results,with real GDP growth hitting a post-communist high. However, economicrecovery came too late for the Socialist-led government, which was punishedby voters for the effects of its earlier austerity measures. Fidesz�which by thistime had added the Hungarian Civic Party to its official name and had evolvedinto a right-of-centre party�emerged the clear winner in the 1998 parliamentaryelection and formed a new coalition government with two other right-wingopposition parties, the Hungarian Democratic Forum and the IndependentSmallholders� Party. Like both its predecessors, this government served out itsfour-year term, while continuing with economic reform.
The April 2002 parliamentary election resulted in another change ingovernment, but only after an emotional and often negative campaign�dominated by the Socialists and Fidesz�divided the country sharply betweenleft and right. The Socialists and the Free Democrats, which had formed anelection alliance, emerged after the second and final round of the election witha slim, ten-seat majority in Hungary�s 386-seat parliament. Two parties from theprevious, conservative government, Fidesz and the Hungarian DemocraticForum, went into opposition. No other party won more than 5% of the vote,the threshold for parliamentary representation.
Local elections in October 2002 and the tactics of the right ensured thatHungarian society remained highly politicised for most of 2002. As well asraising doubts about the validity of the April election results, albeit withoutever challenging them directly, Viktor Orban, the prime minister in the1998-2002 government and de facto leader of Fidesz, encouraged grassrootsorganisations�the so-called civic circles�to take to the streets and demonstrateagainst the Socialist-led government. Demonstrations reached a peak in themiddle of the year, which also saw the emergence of a controversy, centring onthe past of the new prime minister, Peter Medgyessy. The opposition pressrevealed that Mr Medgyessy was a counter-intelligence officer in the secret
Power alternates betweencentre-right and centre-left
Bruising election politicisesHungarian society in 2002
Hungary 7
© The Economist Intelligence Unit Limited 2003 www.eiu.com Country Profile 2003
service of the former communist regime. Subsequent investigations seemed toback up Mr Medgyessy�s account of his past�he never spied on any fellowHungarians�while also implicating politicians from previous governments,both centre-left and centre-right.
Despite Mr Orban�s tactics and the revelations concerning Mr Medgyessy�s past,support for the government grew steadily throughout most of the year,culminating in a landslide victory in the October local elections. This, alongwith the successful completion of EU accession negotiations in December,strengthened the hand of the government at the national level and sent theopposition into disarray, from which it has yet to recover. Despite its slimmajority, the Socialist-liberal government looks likely to serve out its term,which runs until mid-2006.
Important recent events
July 1997
Hungary is invited to begin accession negotiations with the EU and NATO. EUaccession negotiations begin in 1998.
May 1998
The Fidesz-Hungarian Civic Party (Fidesz) wins the general election and forms aright-wing coalition government under Viktor Orban.
March 1999
Hungary, the Czech Republic and Poland join NATO.
January 2001
Industrial trade with the EU becomes fully liberalised.
May 2001
Preparations begin for full convertibility of the forint, after the currency�s exchange-rate bands are widened.
October 2001
The forint becomes fully convertible.
April 2002
The Hungarian Socialist Party wins the general election and forms a centre-leftcoalition government under Peter Medgyessy.
December 2002
Hungary completes accession negotiations with the EU and receives a formalinvitation to join at the EU�s Copenhagen summit.
December 2002
The government permits the US to train members of the Iraqi opposition at theTaszar air base.
January 2003
Mr Medgyessy signs the �Gang of Eight� letter in support of US policy on Iraq,joining leaders from the UK, Spain, Italy, Portugal, Denmark, Poland and theCzech Republic.
8 Hungary
Country Profile 2003 www.eiu.com © The Economist Intelligence Unit Limited 2003
March 2003
The government permits US-led coalition forces to use Hungarian airspace and airbases as part of the war in Iraq.
April 2003
Hungarians vote overwhelmingly in favour of EU membership in a referendum..
Constitution, institutions and administration
The constitution is a heavily amended version of the communist constitutionintroduced in 1949. A multiparty committee worked on a comprehensive newconstitution between 1994 and 1998, but divisions between parties and withinthe government prevented parliament from approving a new document. Thereis no state religion, but recognised religions receive state funding. Hungary is aparliamentary democracy with a single-chamber National Assembly.
The electoral system is complex, combining elements of majority andproportional voting. Of the 386 seats in the National Assembly, 176 are electedfrom individual electoral constituencies, where voters cast two votes in the firstround, one for the local MP by name, and one for the local party list. Anabsolute majority is required for election to an individual district in the firstround. The top three candidates, or all candidates achieving more than 15% inthe first round, advance to the second round of voting, where a pluralitysuffices for victory. Candidates are not required to reside in the district in whichthey run. The remaining 210 seats are distributed proportionally after the firstround according to the party-list vote�a maximum of 152 seats on the basis oflocal party lists, with a national list (for which citizens do not vote) operating asa top-up mechanism. In 1990 there was a 4% minimum threshold (of the party-list vote) for parties to enter parliament. The threshold was raised to 5% beforethe 1994 election.
The president, elected by parliament for a five-year term, has few formalpowers. The position is responsible for the nomination of certain posts, but islargely ceremonial. Mr Madl took office in August 2000. The constitutionpermits a maximum of two terms.
Until recently the judiciary was a three-tier system, involving local, county andhigh courts. A 1997 constitutional amendment added an additional tier, a courtof appeal, but the 1998-2002 government failed to provide funding for itsimplementation. In accordance with constitutional requirements, the presentgovernment established in June 2002 five regional courts of appeal, which willhear appeals to county court decisions that are currently being heard by theSupreme Court. The regional courts of appeal will begin operating in July 2003(2004 for the courts in Gyor and Debrecen) and are expected to help toalleviate the serious backlog of cases currently before the Supreme Court. Thereis also a Constitutional Court, which is modelled on the powerful Germanmodel and has been highly activist. It has the power to review and invalidateparliamentary acts.
Reform of the legal system has generally been based on west European norms,with a view to preparing the judiciary for EU entry. In its progress reports the
The president and judiciary

Hungary 9
© The Economist Intelligence Unit Limited 2003 www.eiu.com Country Profile 2003
European Commission has noted that although the judiciary functionssatisfactorily and the training of judges in EU law has progressed�nearly three-quarters of all judges have received training�there are still many problemareas, related primarily to a lack of budgetary resources. The previous, Fidesz-led government was particularly prone to cutting spending proposals needed tobring the judiciary up to Western levels. Low pay remains a problem, and thewhole system is handicapped by the lack of adequate investment in buildingsand information systems. Staff numbers are still insufficient to keep up withincreasing caseloads.
The current government has taken steps to address the pay issue, and byestablishing the regional courts of appeal it has removed a major hurdle toincreased efficiency. It is also in the process of finalising legislation that wouldincrease the judiciary�s financial independence. According to the Commission�slast progress report, �the constitutional and legislative guarantees of judicialindependence are well-established in Hungary and the system of judicial self-administration functions efficiently�.
Despite extensive formal decentralisation to the local level, the central govern-ment retains strong powers. Local governments are small and fragmented,numbering over 3,000, and remain heavily dependent on the centre for funds.The 19 county governments (and the Budapest city government) are directlyelected but lack policymaking and fund-raising powers. The seven new regionalbodies set up to participate in EU structural fund programmes are purelyadministrative, lack independent funds and consist of government appointeesand local delegates. Under the 1993 minority rights law, there are national and,where relevant, local governments for ethnic minorities.
The national government centres on a powerful position of prime minister. Theprime minister can be replaced only by a so-called positive vote of noconfidence, which requires the naming of an alternative candidate at the time ofthe vote. Individual ministers in the government are not subject to parliamen-tary votes of confidence, but only to the prime minister�s authority. Ministriescan be powerful through the use of orders and decrees to implement policy. Thetraditionally conservative Ministry of Finance is regarded as first among equalsamong the ministries (although its status was downgraded momentarily duringthe Fidesz administration, in favour of the Ministry of Economy and Transport).
The use of close personal networks in policymaking and administration iscommon and probably inevitable in a country with such a small elite.Government is still seen to some extent as an opportunity for patronage. Thevarious ombudsmen and the State Audit Office have achieved a goodreputation for independence.
Policymaking in the current cabinet
A greater emphasis on consensus
An important aspect of the cabinet under Peter Medgyessy, the current primeminister, is that its power is less centralised than under the previous government.Under the previous, conservative administration, there was often debate on issues ofpolicy within the government, but these nearly always came to an immediate end
Central and local government
10 Hungary
Country Profile 2003 www.eiu.com © The Economist Intelligence Unit Limited 2003
once the then prime minister, Viktor Orban, took a public stand on an issue. Bycontrast, Mr Medgyessy does not wield the strong �final arbiter� role of hispredecessor, preferring a more participatory, consensus-based management style.The epicentre of the government�s economic policy is the Ministry of Finance, andthe seemingly omnipresent finance minister, Csaba Laszlo, takes a hands-on role.The influence of Mr Laszlo, ostensibly a fiscal moderate, has been demonstrated inbudget plans that see the fiscal deficit being slashed to just 3% of GDP by 2006. Thisdid not keep him, however, from supporting the government�s expansionary first�100 days� programme, which shows he is not above putting state funds to workfor political ends. Although favouring anti-inflationary policies, Mr Laszlo placesgreater stress on growth and a reduction in state price intervention. He has alsosucceeded in gaining the acquiescence of the National Bank of Hungary (NBH, thecentral bank) for a 2007-08 target date for joining European economic and monetaryunion (EMU), rather than the bank�s preferred date of 2006. He is likely to haveplayed a behind-the-scenes role in the NBH�s recent decision to abandon inflation-targeting temporarily.If Mr Laszlo and his finance ministry is instrumental in setting the financialframework for government policy, much of the implementation is left in the handsof Istvan Csillag, who heads the Ministry of Economy and Transport. This isparticularly true of areas of public-private importance�in particular, the regulatoryenvironment, investment incentives, promotion of small and medium-sizedenterprises (SMEs), and infrastructure development. Mr Csillag was delegated by theliberal Alliance of Free Democrats. Like his predecessors at the head of the economyministry, Gyorgy Matolcsy and Attila Chikan, Mr Csillag comes from a moreacademically oriented background as a research economist.The policy role of the Prime Minister�s Office (PMO), unofficially known as theChancellery, should not be underestimated. The PMO has an immense institutionalrole and is responsible for inter-ministerial co-ordination on all aspects of thegovernment�s programme, and has primary responsibility in the areas of governmentthat do not fall under the aegis of other ministries. One of its main duties will be toco-ordinate all matters relating to the use of EU funds, giving it and the responsibleofficials wide-ranging power over the purse strings. In addition, the PMO overseesthe state privatisation agency, APV. It was led, until recently, by Elemer Kiss�likeMr Csillag, not a member of any party�who resigned in February when it wasrevealed that his law firm had illegally won a tender from Malev, the national airline,which is administered by the APV. He has been replaced by Peter Kiss (no relation).Although Mr Medgyessy is prime minister, he is not a member of the HungarianSocialist Party. The highest-ranking party official in the government is thereforeLaszlo Kovacs, the foreign minister and also party president. He and his Ministry ofForeign Affairs thus play an important role in the current cabinet, with Mr Kovacsserving as the Socialists� voice in government. In the event that Mr Medgyessy wereunable to continue in office for any reason, Mr Kovacs would probably becomeprime minister.
Political forces
Hungarian public life is strongly polarised around a historically and culturallyrooted split between the left and the right. In the Hungarian context, the liberalFree Democrats are in effect on the left, because of their internationalist,
Political polarisation
Hungary 11
© The Economist Intelligence Unit Limited 2003 www.eiu.com Country Profile 2003
universalist and progressive outlook. Government-opposition conflict is oftenbitter, but opposition parties have sometimes been willing to co-operate overmore technical issues of bipartisan concern. Under normal circumstances, theneed for a two-thirds majority to amend some laws can give the oppositionsome leverage.
The Hungarian Socialist Party, the name the ruling MSZMP adopted in October1989 after agreeing to democratic politics, has steadily transformed itself into atraditional social-democratic party. Under the leadership of the former MSZMP�sreformist wing, the party received only 11% of the proportional vote in 1990 andwent into opposition. After the election the former foreign minister, Gyula Horn,became party chairman and united the party�s various factions: liberaleconomists who sought radical reform of the state-centred economy, socialdemocrats, trade unionists and middle- and lower-level officials from theprevious regime. Mr Horn led the Socialists to victory in the 1994 election.Austerity measures implemented by the Socialist-led government provokedpopular dissatisfaction with the party, dooming it to defeat in the 1998 election.Mr Horn retired and was replaced by his protégé, Laszlo Kovacs (the foreignminister in both the previous and the current Socialist-led governments).Unable to expand the Socialists� appeal among voters, Mr Kovacs remained asparty leader but stepped aside in June 2001 to allow Peter Medgyessy to benominated as the party�s compromise candidate for the post of prime minister.Mr Medgyessy, who was a finance minister for part of the 1994-98administration and is not even a member of the party, led the Socialists tovictory partly by moving their policies ever closer to the centre. The party hasrecently considered changing its name to the Hungarian Social Democratic Party,another signal of the continued marginalisation of the party�s traditional tradeunionist wing in favour of those espousing a more liberal view of the economy.
The Fidesz-Hungarian Civic Party (commonly known as Fidesz), the seniorgovernment party in 1998-2002, is the main right-wing force in Hungary. It wasformed in 1988 by students in the law faculty at Budapest�s Eotvos University.During the conservative government of 1990-94, Fidesz espoused a liberalideology and often co-operated with the Free Democrats in opposition. Underthe leadership of Viktor Orban, the party began to transform itself into aconservative party, which resulted in the departure of its more liberal leaders in1993. Remaining in opposition after the 1994 election, Mr Orban made attemptsto broaden the party�s appeal. Having already dropped its upper age limit of 35in 1993, Fidesz added Hungarian Civic Party to its name in 1995. The same year,in effort to change its image as a �youth� movement, the party officiallydropped �Federation of Young Democrats� from its name, adopting instead itsHungarian acronym �Fidesz�.
Mr Orban became prime minister after Fidesz�s victory in the May 1998election, but his abrasive style of governing corresponded with a fall in theparty�s popularity. Nevertheless, Mr Orban and Fidesz pursued an increasinglypopulist and confrontational style of politics that energised right-wing votersbut also limited the party�s ability to reach out beyond its core supporters. Sincegoing into opposition after a close defeat in April 2002, those who are
Hungarian Socialist Party
Fidesz-Hungarian Civic Party
12 Hungary
Country Profile 2003 www.eiu.com © The Economist Intelligence Unit Limited 2003
sympathetic to the party�s message have shown little compunction abouttaking to the streets in protest against the current government�s policies.Mr Orban relinquished the party leadership in 1999, but he remains Fidesz�s defacto leader and is tipped to return as party president in May 2003. Like theSocialists, Fidesz has considered a name change, as it continues its quest toconsolidate the right under its auspices.
The Alliance of Free Democrats is the country�s main liberal party. It has itsroots in the dissident democratic opposition of the 1980s, which was prominentin the political transformation of 1988-89. In the 1990 election the FreeDemocrats finished a strong second to the Hungarian Democratic Forum. In1994 the Free Democrats again finished second, but entered what turned out tobe a difficult coalition with the Socialists, who did not need the liberals�support to stay in government. By the 1998 election the party�s support haddropped substantially and has subsequently failed to recover. Some voters,especially those with ties to the dissident movement under the previousregime, have never forgiven the Free Democrats for entering into governmentwith a party descended from the communists. However, in current politicalcircumstances, the Socialists remain the party�s natural partner, and the twohave once again formed a ruling coalition, although this time more of apartnership of equals than the 1994-98 coalition. The Free Democrats draw theirmain support from wealthier, well-educated urban voters, which explains theirhold on the Budapest mayoralty, with Gabor Demszky in the post since 1990.Mr Demszky�s attempt to combine his Budapest post with the party leadershipin 2001 was unhappy and short-lived; the party leadership has now reverted toformer interior minister Gabor Kuncze.
Once the leading force in government, but now a minor partner of Fidesz onthe right, the Hungarian Democratic Forum was formed in 1987 by a group ofpopulist-oriented intellectuals and cultural figures. As prime minister and partyleader, Jozsef Antall consolidated control over the party and moved it awayfrom its more populist roots and towards a more conservative and ChristianDemocratic profile. This change angered many radicals within the DemocraticForum, which had difficulty regaining unity after the expulsion of one of itsfounders, the ultra-nationalist Istvan Csurka, and the subsequent death ofMr Antall. After a heavy defeat in the 1994 election, many moderates left toform their own party.
The Hungarian Democratic Forum�s political viability is totally beholden to itsalliance with Fidesz. Without Fidesz co-operation the party would not havesecured a presence in the 1998-2002 parliament�it failed to gain representationbased on the proportional party-list vote in the 1998 election. For the 2002election the Democratic Forum abandoned all hope of achieving parliamentaryrepresentation alone and in effect merged with Fidesz for electoral purposes, asthe two parties stood on the first joint regional lists in Hungary�s post-communist electoral history. After the election, a merger of the two parties wasmooted, but the Democratic Forum�s chairwoman, Ibolya David, continues toreject Fidesz�s attempts at consolidation, instead positioning her party as a trueconservative alternative to the more populist Fidesz.
Alliance of Free Democrats
Hungarian Democratic Forum

Hungary 13
© The Economist Intelligence Unit Limited 2003 www.eiu.com Country Profile 2003
Parliamentary election results1998 2002
% vote forparty list
Districtswon
Seats inparliament % of seats
% vote forparty list
Districtswon
Seats inparliament % of seats
Alliance of Free Democrats 7.6 2 24 6.2 5.6 3 20 5.2Fidesz-Hungarian Civic Party (Fidesz)a 29.4 90 148 38.3 41.1 95 188 48.7
Hungarian Democratic Foruma 2.8 17 17 4.4 - - - -Hungarian Justice and Life Party 5.5 0 14 3.6 4.4 0 0 0.0
Hungarian Socialist Party 32.9 54 134 34.7 42.1 78 178 46.1Independent Smallholders� Party 13.2 12 48 12.4 0.8 0 0 0.0
Other parties 8.6 0 0 0.0 6.0 0 0 0.0Independent candidates - 1 1 0.3 - 0 0 0.0Total 100.0 176 386 100.0 100.0 176 386 100.0Memorandum itemTotal votes cast 4,547,682 - - - 5,616,750 - - -
a Fidesz and Democratic Forum ran 78 joint candidates in 1998 and all joint lists and candidates in 2002. Fidesz now holds 164 seats, theDemocratic Forum 24.
Source: National Election Office
Main political figures
Peter Medgyessy
A minister in the last years of communist rule and the last finance minister of thegovernment led by the Hungarian Socialist Party in 1994-98. In the latter role, hepresided over the pension reform and the improvements in growth, inflation andexternal accounts that followed the implementation of his predecessor�s �BokrosPackage�. He held senior posts in the private financial sector and worked as aconsultant after 1998, before returning to the political stage after being chosen as theHungarian Socialist Party�s prime ministerial candidate in 2001. He is not a memberof parliament or the party. His liberal economic record and business links helped hisemergence as a compromise candidate for the party�s nomination, especially as itappeared increasingly likely that the Socialists would need a repeat partnership withthe liberal Alliance of Free Democrats in order to govern again. Investigations in 2002into Mr Medgyessy�s past as a counter-intelligence officer during the communist erafailed to turn up any further damaging information�for instance, evidence that hespied on his fellow citizens contrary to his claims that he did not�but the revelationswere serious enough that the Free Democrats, with their roots in the 1980s dissidentmovement, almost left government.
Viktor Orban
Prime minister in the last conservative government (1998-2002) and leading figure ofthe Fidesz-Hungarian Civic Party (Fidesz), although he gave up the party leadershipat the end of 1999. From the fiery speech at the reburial of Imre Nagy in 1989demanding the withdrawal of Soviet troops with which he first made his mark,Mr Orban has often courted controversy with outspoken rhetoric. Under hisunchallenged leadership since 1993, Fidesz has shed its liberal political identity andmoved steadily to the right. He was an energetic prime minister, but his imperiousstyle alienated many. After his party�s narrow defeat in the April 2002 election,Mr Orban receded from party and parliamentary politics. As part of his continuingefforts to consolidate the right, he actively encouraged supporters to organise intosmall local groups, called �civic circles�, to be mobilised for street protests. Mr Orban
14 Hungary
Country Profile 2003 www.eiu.com © The Economist Intelligence Unit Limited 2003
remains the unofficial leader of the civic circle movement, dubbed �Hajra,Magyarorszag!� (�Go Hungary!�)�a popular football chant and Mr Orban�s own sign-off at public speaking appearances since the campaign season. It is also a deliberateecho of Italy�s �Forza Italia!�, a similar political movement led by Silvio Berlusconi,the Italian prime minister. Since mid-2002 Mr Orban has adopted a more Eurosceptictone, and more recently an anti-US stance as part of his open criticism of thegovernment�s support for the US�s war effort in Iraq. His rhetoric, however, tends tobe much more radical than the actions of his party in parliament.
Laszlo Kovacs
The most senior Socialist in the government is the foreign minister and party�spresident. A high-ranking member of the communist party before the transition,Mr Kovacs has remained a key figure throughout the transition period, also servingas foreign minister in the 1994-98 Socialist-led administration. Mr Kovacs is widelyexpected to become prime minister if Mr Medgyessy cannot continue for anyreason�for example, if earlier reports of health problems prove substantial enoughthat he must later leave office. Mr Kovacs, a seasoned diplomat and skilled partypolitician, is said to lack a strong leadership hand, managing through delegation andconsensus rather than hands-on decision-making. Although these characteristicsreportedly cost him his party�s nomination as prime minister, Mr Medgyessy�s styleis similar�if events eventually put Mr Kovacs in the prime minister�s post,substantive continuity could be expected.
Csaba Laszlo
The voice of the government�s economic policy is the finance minister, a fiscalmoderate who favours responsible budget policies. Mr Laszlo�s background is mainlywith the Ministry of Finance, with a brief foray into the private sector before takingthe reins at the ministry himself. He started his career in the pre-transition financeministry in 1986, and by 1989 had reached a position of some responsibility as adepartment head. His successful upward career path at the ministry moved onthrough successive right- and left-wing governments, and he became deputy statesecretary for budget affairs during the tenure of the previous Socialist prime minister,Gyula Horn, and then administrative state secretary during the Orbanadministration. Mr Laszlo left the ministry in 1999, reportedly over disagreements onbudget policy. He went on to become deputy chief executive officer (CEO) andmember of the board at the local subsidiary of the Dutch bank ABN AMRO, andlater at K&H Bank after its merger with ABN AMRO. Although Mr Medgyessy ishimself a former finance minister, he gives Mr Laszlo a wide berth to form policywithin the framework of the government�s programme.
Zsigmond Jarai
Appointed governor of the National Bank of Hungary (NBH, the central bank) for asix-year term in March 2001, after serving almost three years as finance minister inthe Orban administration. His tenure as finance minister followed a career insenior private- and public-sector finance posts. His previous relations with theFidesz-led government probably explains his tolerance of pre-election fiscalloosening and his often contentious relations with the current government. Beforethe Socialists returned to power, Mr Jarai saw the adoption of a new central bankact that enhanced its independence and enshrines price stability as its overridinggoal. Mr Jarai was also responsible for the surprising widening of the forint�s

Hungary 15
© The Economist Intelligence Unit Limited 2003 www.eiu.com Country Profile 2003
exchange-rate band in May 2001, which helped to halve inflation within a year.However, the NBH�s strong forint policy elicited strong criticism from groupsworried about the competitiveness of Hungarian exports, mostly employers�organisations with strong ties to the current government. This only added to thestrong political backdrop to monetary policy, with the current government eventhreatening to curb the NBH�s independence before the European Commissionintervened in mid-2002. Mr Jarai has received praise for the NBH�s successfuldefence of the exchange-rate regime, which thwarted speculative interest in theforint in early 2003, but he has also received criticism for the damage done in theprocess to the NBH�s inflation-fighting credentials.
Ferenc Madl
Mr Madl began his first five-year presidential term in August 2000. After a career asan academic lawyer, he ran previously as the right�s candidate for the post in 1995.He was nominated again in 2000 as a compromise candidate intended to bridge arift between Fidesz and a junior coalition partner, the Independent Smallholders�Party. Mr Madl seems to have been accepted by the opposition as a non-partisanhead of state.
International relations and defence
The presence of large Hungarian minorities in neighbouring countries has beena source of problems for Hungary since the 1920 Treaty of Trianon, whichreallocated more than two-thirds of the country�s pre-first world war territory(mostly to Romania, Czechoslovakia and Yugoslavia). During the 1980s thedifficulties faced by Hungarian minorities, particularly in Romania, were animportant mobilising element for the opposition parties. Since the collapse ofcommunist rule, Hungarian governments have sought to balance the need tobuild constructive relations with neighbours with the wish to extend greatersupport to the Hungarian minorities. There are perhaps 2.7m-3.3m Hungariansin Hungary�s neighbouring states, including upwards of 1.6m in Romania andaround 500,000 in Slovakia. Generally, the Hungarian left has prioritised state-to-state relations, whereas the right has given greater weight to the claims ofthe minorities.
Relations with Romania and Slovakia, in particular, improved steadily underthe 1994-98 Socialist-led regime�basic treaties were signed guaranteeing existingborders as well as minority rights�but were again put under severe strain bythe so-called Status Law, passed by the Hungarian parliament in June 2001. Thelegislation offered Hungarians living in Hungary�s neighbouring states theopportunity to apply for a Hungarian identity card that would entitle them toeducation, healthcare, travel and cultural discounts, and short-term workopportunities in Hungary. Romania and Slovakia, however, regarded the StatusLaw as discriminatory and extra-territorial and feared that quasi-citizenshipamong Hungarian minorities could lead to territorial claims in the future. Abilateral memorandum in late 2001 that involved significant Hungarianconcessions, most notably the extension of the short-term employmentopportunity to all Romanian citizens, was attacked by the Socialists forthreatening the Hungarian labour market.
Minorities and neighbours
16 Hungary
Country Profile 2003 www.eiu.com © The Economist Intelligence Unit Limited 2003
Despite the Socialists� return to power and the continuing important role playedby ethnic Hungarian parties in Slovakia and Romania, these two countries havenot backed down from their demands that the Status Law be amended further.They have been joined in their criticism by EU and NATO officials. The EU, inparticular, remains concerned about one member passing laws that affect thestatus of another member�s citizens�both Slovakia and Hungary are set to jointhe EU in May 2004. Further amendments of the Status Law are inevitable,however, in essence turning it into a mutually agreed framework for work andstudy exchanges.
Hungary was developing links with international bodies well before the 1991dissolution of the Warsaw Pact (established in 1955) and the Council for MutualEconomic Assistance (CMEA, or Comecon; 1949). It joined the UN in 1955, andthe IMF and the World Bank in 1982. Entry into the General Agreement onTariffs and Trade (GATT) in 1973 allowed it to become a founding member ofthe World Trade Organisation (WTO). Hungary signed a trade and co-operationagreement with the European Community in 1988 and was a founding memberof the European Bank for Reconstruction and Development (EBRD) in 1991. In1991 Hungary, Poland and Czechoslovakia formed the Central European Free-Trade Agreement (CEFTA). Hungary was invited to join the OECD in 1996, andjoined the International Energy Agency (IEA) in 1997.
Hungary is set to join the EU on May 1st 2004. Hungary first applied to join theEU in March 1994, and accession talks began in 1998. Throughout negotiationsHungary often proved itself more willing to make compromises in order toreach agreement earlier than other candidates. Negotiations only truly gainedmomentum, however, in the course of 2001, once the EU adopted enlargementin 2004 as an objective and named Hungary as one of ten states scheduled tojoin at that date. Hungarians� commitment to EU membership was confirmedin a referendum on April 12th 2003, four days before Mr Medgyessy signed thefinal accession treaty at the EU�s Athens summit.
Admission talks with NATO began in September 1997, and Hungary formallyjoined the alliance, along with Poland and the Czech Republic, on March 12th1999. Close co-operation between NATO and Hungarian armed forces has beenfostered by Hungary�s participation in the NATO-led Stabilisation Force (SFOR)and the earlier Implementation Force (IFOR) in Bosnia and Hercegovina (BiH).Hungary also served as a forward base for both operations.
Alone of the three most recent NATO members, however, Hungary has beencriticised for its lack of material commitment to the alliance. Hungary�sperformance as a NATO ally became the focus of attention in November 2002,when an article in a US journal, Foreign Affairs, quoted allegations that Hungarywas the �most disappointing new member of NATO� and �would have alreadybeen expelled [from the alliance] if an expulsion were possible�. The author ofthe article argued that Hungary�s example was a signal for caution in acceptingnew members to the alliance. In subsequent statements the defence minister,Ferenc Juhasz, confirmed that Lord Robertson, the NATO secretary-general, hadvehemently demanded that Hungary fulfil its pledges to modernise its forces.
Growing internationalintegration
Hungary set to join the EU
Defence
Hungary 17
© The Economist Intelligence Unit Limited 2003 www.eiu.com Country Profile 2003
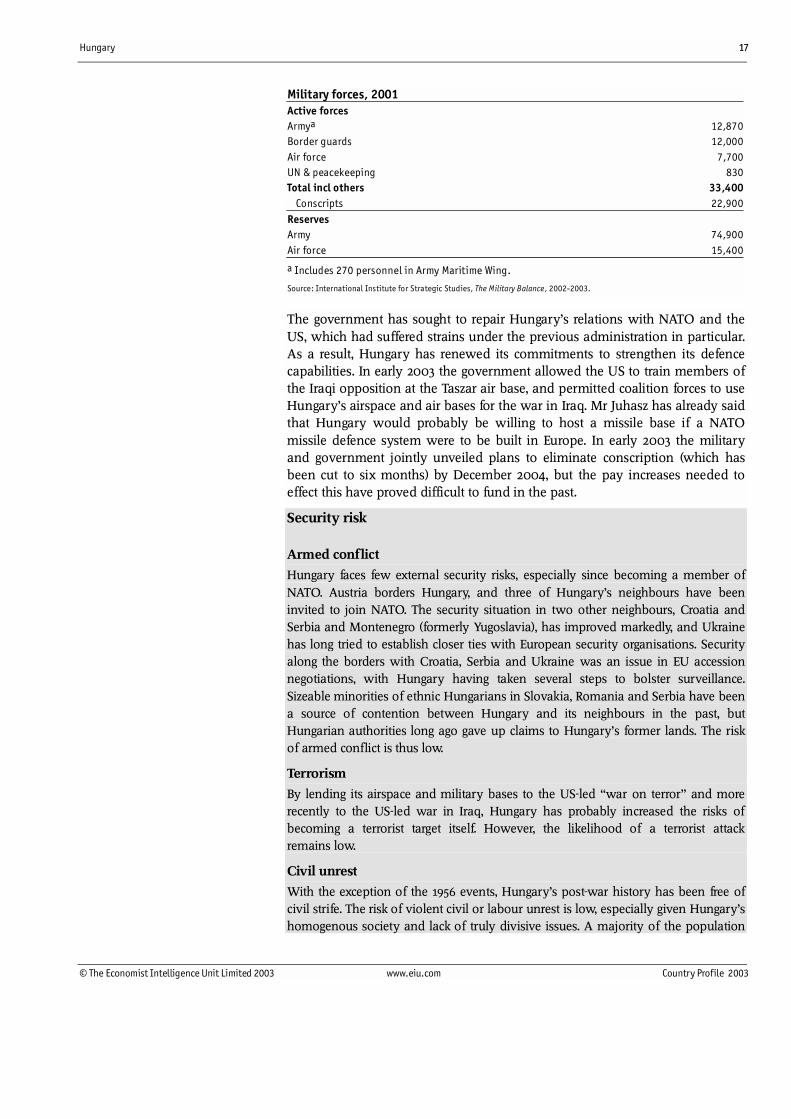
Military forces, 2001Active forcesArmya 12,870Border guards 12,000Air force 7,700UN & peacekeeping 830Total incl others 33,400 Conscripts 22,900ReservesArmy 74,900Air force 15,400
a Includes 270 personnel in Army Maritime Wing.
Source: International Institute for Strategic Studies, The Military Balance, 2002-2003.
The government has sought to repair Hungary�s relations with NATO and theUS, which had suffered strains under the previous administration in particular.As a result, Hungary has renewed its commitments to strengthen its defencecapabilities. In early 2003 the government allowed the US to train members ofthe Iraqi opposition at the Taszar air base, and permitted coalition forces to useHungary�s airspace and air bases for the war in Iraq. Mr Juhasz has already saidthat Hungary would probably be willing to host a missile base if a NATOmissile defence system were to be built in Europe. In early 2003 the militaryand government jointly unveiled plans to eliminate conscription (which hasbeen cut to six months) by December 2004, but the pay increases needed toeffect this have proved difficult to fund in the past.
Security risk
Armed conflict
Hungary faces few external security risks, especially since becoming a member ofNATO. Austria borders Hungary, and three of Hungary�s neighbours have beeninvited to join NATO. The security situation in two other neighbours, Croatia andSerbia and Montenegro (formerly Yugoslavia), has improved markedly, and Ukrainehas long tried to establish closer ties with European security organisations. Securityalong the borders with Croatia, Serbia and Ukraine was an issue in EU accessionnegotiations, with Hungary having taken several steps to bolster surveillance.Sizeable minorities of ethnic Hungarians in Slovakia, Romania and Serbia have beena source of contention between Hungary and its neighbours in the past, butHungarian authorities long ago gave up claims to Hungary�s former lands. The riskof armed conflict is thus low.
Terrorism
By lending its airspace and military bases to the US-led �war on terror� and morerecently to the US-led war in Iraq, Hungary has probably increased the risks ofbecoming a terrorist target itself. However, the likelihood of a terrorist attackremains low.
Civil unrest
With the exception of the 1956 events, Hungary�s post-war history has been free ofcivil strife. The risk of violent civil or labour unrest is low, especially given Hungary�shomogenous society and lack of truly divisive issues. A majority of the population
18 Hungary
Country Profile 2003 www.eiu.com © The Economist Intelligence Unit Limited 2003
looks forward to joining the EU, and an overwhelming majority maintains a pro-Western outlook.
Violent crime
Violent crime is not much of a problem in Hungary, although petty crime is aconcern and has been growing in frequency since the fall of communism. Touristsareas are especially the targets of petty criminals, pickpockets and scam artists. Theftof, and from, vehicles is also common. Although decreasing in number, incidents stilloccur infrequently in certain bars and restaurants in Budapest where tourists arecharged exorbitant prices.
Drug smuggling and organised crime
If Hungary faces any substantial security risks, they emanate from the activities oforganised crime in the country, particularly that of the Russian mafia. Since the fallof communism in the region, organised crime has risen significantly, especially thatof Russian, Italian, ethnic Albanian, Nigerian, and Chinese criminal gangs andColombian drug-trafficking groups. Hungary shares a border with seven countriesand its well-developed transportation network makes it a logical transit zone forsmuggling. Recent evidence shows that it also is a transit point on one of thepathways for smuggling heroin to western Europe from Afghanistan and other partsof Central Asia. Authorities have tightened border controls, altering smugglingmethods, but having little discernible impact on the extent of traffic.
Resources and infrastructure
Population
According to data from the February 2001 census, the population is 10,198,315, afigure that is higher than was previously thought after years of decline. Thecapital city, Budapest, is home to 17% of the population, with the next eightlargest cities accounting for just over 12% of the population. The vast majorityof Hungarians live in what are classified as urban areas. The age structure ofthe population is typical for Europe, with 17% of the population below the ageof 15 and 20% aged 60 or above in 2000. In ethnic terms, the population isrelatively homogeneous, relative to many other countries in the region. The2001 census confirmed that previous population surveys had beenundercounting ethnic minorities, which now account for almost 8% of thepopulation. The largest minority by far are the Roma (189,984), although theEuropean Roma Rights Centre claims that there are more than half a millionRoma in Hungary, or 5% of the population. Hungarian minorities inneighbouring countries are much larger, at least 3m, and thus have a higherpolitical profile than domestic minorities, who are mostly assimilated. Politicalmobilisation by Hungary�s Roma, however, has become increasingly visible.
The population has been falling steadily since 1981, when the death rate beganto exceed the birth rate. This trend accelerated at the beginning of the transition,but lately has begun to stabilise. As late as 1991, the birth rate stood at 12.3 per1,000 population, but this declined steadily over the next eight years, and sincethen has recorded only modest gains. It stood at a preliminary 9.5 per 1,000 in2002. The death rate peaked at 14.5 per 1,000 in 1993, before falling gradually, to
Population is small,homogeneous and ageing
Hungary 19
© The Economist Intelligence Unit Limited 2003 www.eiu.com Country Profile 2003
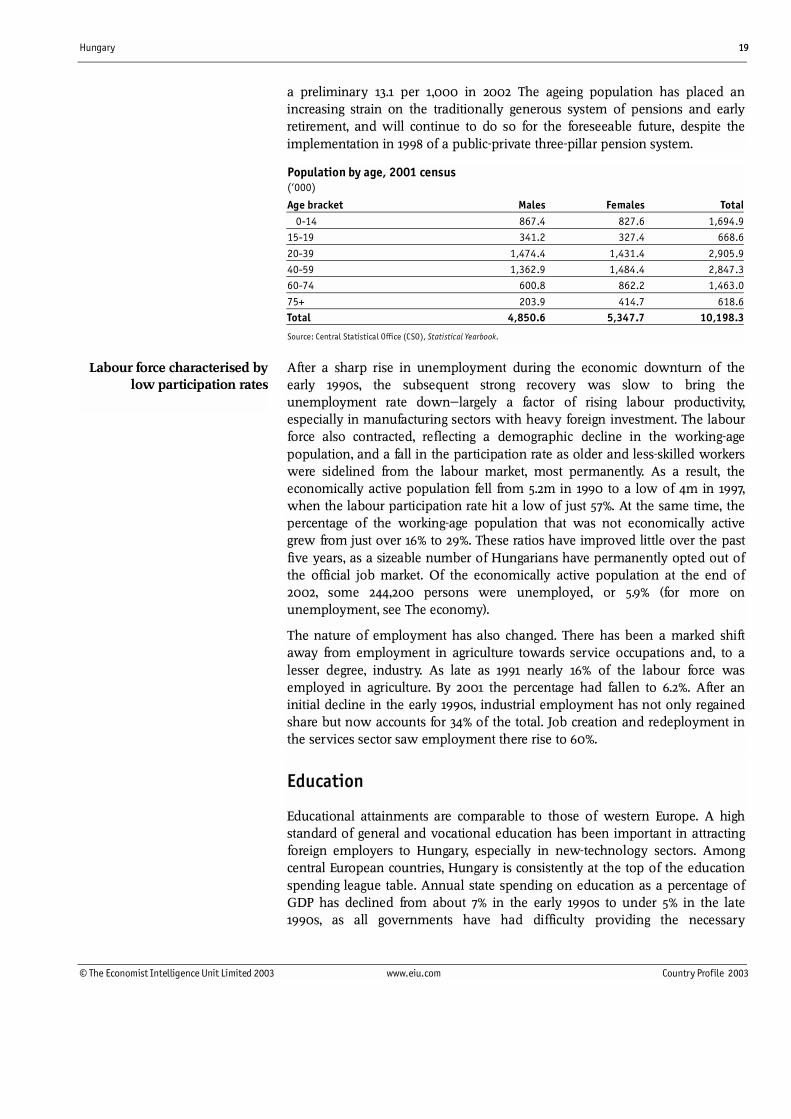
a preliminary 13.1 per 1,000 in 2002 The ageing population has placed anincreasing strain on the traditionally generous system of pensions and earlyretirement, and will continue to do so for the foreseeable future, despite theimplementation in 1998 of a public-private three-pillar pension system.
Population by age, 2001 census(�000)
Age bracket Males Females Total 0-14 867.4 827.6 1,694.915-19 341.2 327.4 668.6
20-39 1,474.4 1,431.4 2,905.940-59 1,362.9 1,484.4 2,847.360-74 600.8 862.2 1,463.0
75+ 203.9 414.7 618.6Total 4,850.6 5,347.7 10,198.3
Source: Central Statistical Office (CSO), Statistical Yearbook.
After a sharp rise in unemployment during the economic downturn of theearly 1990s, the subsequent strong recovery was slow to bring theunemployment rate down�largely a factor of rising labour productivity,especially in manufacturing sectors with heavy foreign investment. The labourforce also contracted, reflecting a demographic decline in the working-agepopulation, and a fall in the participation rate as older and less-skilled workerswere sidelined from the labour market, most permanently. As a result, theeconomically active population fell from 5.2m in 1990 to a low of 4m in 1997,when the labour participation rate hit a low of just 57%. At the same time, thepercentage of the working-age population that was not economically activegrew from just over 16% to 29%. These ratios have improved little over the pastfive years, as a sizeable number of Hungarians have permanently opted out ofthe official job market. Of the economically active population at the end of2002, some 244,200 persons were unemployed, or 5.9% (for more onunemployment, see The economy).
The nature of employment has also changed. There has been a marked shiftaway from employment in agriculture towards service occupations and, to alesser degree, industry. As late as 1991 nearly 16% of the labour force wasemployed in agriculture. By 2001 the percentage had fallen to 6.2%. After aninitial decline in the early 1990s, industrial employment has not only regainedshare but now accounts for 34% of the total. Job creation and redeployment inthe services sector saw employment there rise to 60%.
Education
Educational attainments are comparable to those of western Europe. A highstandard of general and vocational education has been important in attractingforeign employers to Hungary, especially in new-technology sectors. Amongcentral European countries, Hungary is consistently at the top of the educationspending league table. Annual state spending on education as a percentage ofGDP has declined from about 7% in the early 1990s to under 5% in the late1990s, as all governments have had difficulty providing the necessary
Labour force characterised bylow participation rates
20 Hungary
Country Profile 2003 www.eiu.com © The Economist Intelligence Unit Limited 2003
resources. The 1998-2002 government, led by the Fidesz-Hungarian Civic Party,encouraged an expansion in higher education in particular�the number ofuniversity graduates each year grew by nearly 30% during this period�butwithout any major rise in education spending, which remained just above 5%of GDP in 1999-2001.
Schooling is compulsory for children between the ages of six and 16. Underthe communist regime, education in a general elementary school was usuallyfollowed by four types of outcomes: exit from school; apprentice school forskilled workers� training; vocational secondary school; and gymnasium orgeneral secondary school. The gymnasium was the primary feeder ofstudents to the universities, although other institutions of higher educationaccepted students from vocational secondary schools. This system haspersisted since 1989, and completion rates for general elementary schoolremain quite high. Apprentice schools have declined as a destination amongsecondary students. In 1990/91 almost half of those completing elementaryschool continued to apprentice schools; currently only about one-quarter doso. The percentage continuing to vocational secondary schools increased from28% in 1990/1991 to over 40% in 2001/2002, and the percentage continuing togymnasium rose from 21% to around 35%. Gymnasium schooling in gradesfive to eight has also re-emerged.
University and college education expanded rapidly in the 1990s. In 1990/91only 8.5% of the population aged 18-22 was attending university or college,applicants� success rate being 36%. By 2000/01 enrolment had almost trebled,with more than 20% of the university-age population in full-time study andacceptance rates reaching almost 60%. Expansion in the late 1990s was helpedby the Fidesz-led government�s elimination of the tuition fees for first-degreeprogrammes introduced by its predecessor. However, Fidesz has been accusedof opening the doors to university education wider to compensate for a lack ofreal employment opportunities for young Hungarians. University educationlasts for five years, and college-level programmes can range from three to four.The 89 universities, colleges and other institutions of higher education retaintheir traditional subject specialisms.
Health
Despite a high share of healthcare spending in GDP, Hungarians have the lowestlife expectancy among OECD member countries. The health of the Hungarianpopulation has been poor by international standards for several decades, andthe death rate from cardiovascular diseases is one of the highest in the world,according to the World Health Organisation (WHO). In 2001 life expectancy atbirth was 68 years for men and 76 years for women. The figure for men hasnow surpassed its 1964 peak, after hitting a low of 64.5 in 1993. The suicide rateis one of the highest in the world, at just less than 30 per 100,000 inhabitants,although the rate is gradually declining. Infant mortality has continued todecline, from 47.6 per 1,000 live births in 1960 to 8.1 per 1,000 in 2001.
Higher education expandsrapidly
Hungary 21
© The Economist Intelligence Unit Limited 2003 www.eiu.com Country Profile 2003
Hungary�s healthcare system is underfunded and in urgent need ofrestructuring. Rising costs in the sector, especially for pharmaceuticals, continueto put severe pressure on government budgets. In recent years the NationalHealth Insurance Fund (OEP) has covered roughly three-quarters of thecountry�s drug expenses. Hungarians grew accustomed to cheap medicationduring the communist era, and cutting government subsidies has not beenpolitically viable. Average annual drug consumption is the second highest inEurope after France; the Economist Intelligence Unit estimates that the drugs billaccounts for nearly 30% of state healthcare spending, compared with the usualrate of 10-15% seen in similar countries. As Hungary tackles healthcarefinancing, especially in preparation for EU membership, improvements inhealth will only be slight, and gains in life expectancy will lag behind those inthe EU and the US.
The main issues facing Hungary, however, have little to do with physicalcapacity or numbers of personnel, but are directly related to the need to re-orient the sector from institutional care towards care at the primary level. Somereorientation has begun, but the process is slow, with inertia coming fromlobbies in the industry as well as from the general population. The number ofhospital beds per 1,000 population dropped from 11 at the beginning of the1990s to just over eight in 1998, remaining broadly at this level in 2001. This isslightly lower than the ratio in Germany, on a par with that in France anddouble that in the UK and the US. Earnings in the healthcare sector relative tothe total economy ranked among the lowest in the OECD in 1996, and thecontinued erosion of pay against private-sector counterparts makes competentstaff hard to retain. The hospital sector has been hit by numerous cash crisesand threatened strikes in recent years.
Healthcare
Funding
Basic health services are available through the National Health Insurance Fund(OEP), part of the social security system. The OEP acts as purchaser of services ofdoctors, hospitals, and other providers. It has substantial autonomy, but was broughtunder closer supervision of the Ministry of Finance by the government led by theFidesz-Hungarian Civic Party in 1998 after a ballooning of the deficit. The OEPreceives a combination of employer and employee contributions, with peopleoutside the labour force covered by state contributions.Local governments are largely responsible for service provision, providing mostprimary healthcare and operating a majority of hospitals. Local district doctorsprovide basic healthcare services and make referrals to specialists. All services,including hospital care, are in theory free to the patient. Primary care is reimbursedby flat fees per patient, which are adjusted according to the age profile of the patientsand the qualifications of the doctors treating them. Outpatient treatment is paid onthe basis of a points system, and hospital care is reimbursed according to diagnosticgroup. However, tipping of doctors in the state system is common, particularly foradvanced services such as surgery. In addition, doctors receive private patients intheir free time, both in separate private practices and occasionally at their officialpractice. This informal system supplements the low salaries received by medicalprofessionals and encourages a de facto fee-for-service system. Medicines are heavily
Poorly structured healthcaresystem
22 Hungary
Country Profile 2003 www.eiu.com © The Economist Intelligence Unit Limited 2003
subsidised, although price caps on prescribed drugs since 1999 have helped to reducethe resultant OEP deficit.
Systemic reform delayed
Responsibility for healthcare planning is divided between the OEP, the Ministry ofHealth and the finance ministry, with the Ministry of Economy and Transport andthe Prime Minister�s Office also involved. Turf wars between bureaucracies, thestrong lobbying efforts of doctors, and political conflict within the government andwith the opposition caused large-scale reform to stall under the Fidesz-ledgovernment. One step taken by Fidesz was to pass a law giving 7,000 generalpractitioners (GPs), paediatricians and dentists the right to practise free of charge.Currently these practitioners are contractors with the OEP and have been selectedthrough tenders offered by local councils. The legislation also set up a loan guaranteeprogramme for doctors to allow them to purchase offices and equipment from localcouncils. However, more drastic reform is needed, something that the newgovernment, led by the Hungarian Socialist Party, is keenly aware of. Fiscalconstraints, however, have limited all but the most modest proposals.
Natural resources and the environmentHungary has a land area of 93,030 sq km and a population in February 2001 of10,198,315, which gives the country a population density of 109.6 per sq km,similar to that of France and Poland. The country is a low-lying plain dividedroughly into three equal parts by two rivers running north-south, the morewesterly Danube and the Tisza towards the east. The land is generally fertile,with about 70% suitable for agriculture. Hungary lacks extensive domesticenergy resources and raw materials, except for bauxite.
There are three primary geographic regions. Transdanubia, the area lying westof the Danube, is a hilly region extending to the foothills of the Austrian Alps.It is primarily an agricultural area with crops, livestock and viticulture. TheGreat Plain (Nagy Alfold), lying east of the Danube and including the Tiszariver basin, contains about half of the country and includes regions of fertilesoil, sandy areas and wetlands. Drainage projects in the late 19th centurycurbed the traditional floods and opened the land for cultivation, although theflood problem has returned to the region in recent years. The northern hills runfrom north of Budapest to the north-east along the Slovak border. Thecountry�s limited mineral deposits (and the Tokay wine region) are largelylocated in this area, which was the location for most of the heavy industries ofthe communist era.
There are a few moderately high ranges of mountains, but only 2% of thecountry reaches heights of 300 metres or more. The highest peak is Kekes at1,014 metres. Lake Balaton in Transdanubia is the largest lake in central Europe,measuring 78 km in length and between 3 km and 14 km in width. The hillssurrounding the lake are an important site of viticulture. Budapest and much ofthe remainder of the country have numerous thermal spas. The climate issubject to dramatic changes. Average daytime temperatures in Budapest rangefrom minus 1-4°C in January to 16-28°C in July. There is a slight variation in the
Three main regions
Hungary 23
© The Economist Intelligence Unit Limited 2003 www.eiu.com Country Profile 2003
climate across the country, with the south slightly warmer and the north andeast slightly cooler.
Transport, communications and the InternetDecades of underinvestment during the socialist period left rail, road andtelephone systems dilapidated. The trend has been reversed since 1989 assignificant inflows of international capital have been directed towardsinfrastructure. Public finance constraints, however, have led to the scaling-downor cancellation of some long-awaited projects.
Since the early 1990s upgrading of the motorway network has been one ofHungary�s main infrastructure priorities, although only one motorway so far�that connecting Budapest to Vienna�has been extended to one of Hungary�sborders. In 2000 the government approved a seven-year roadbuildingprogramme, involving the construction of 702km of roads, that was laterextended to 15 years and expanded to include other infrastructure projects. Thecurrent government has vowed to continue its predecessor�s programme, withpreference still being given to routes that form part of European transportcorridors. With support from the European Bank for Reconstruction andDevelopment (EBRD) and the EU�s instrument for structural policies for pre-accession (Ispa), the M3 motorway (running north-east from Budapest) is due toreach the border by 2004. The motorways running south-west and south-eastfrom Budapest are also under development, as are several bridges over theDanube and Tisza, and non-motorway inter-city roads and ring-roads.
Road transport has replaced railways as the primary form of freight haulage,reflecting both the improvements in main road provision and past lack ofinvestment in the state-owned railway, MAV. Waterway shipping began torecover in 1996 after the lifting of sanctions against Serbia and Montenegro(formerly Yugoslavia), but growth slowed in 1997-98 and another reversal wasinflicted by damage to bridges over the Danube at Novi Sad in Vojvodina duringNATO�s air strikes against Serbia in 1999. Although most of the debris had beencleared by mid-2000, temporary pontoon bridges continued to disrupt rivertraffic. Air cargo plays a minor role in the freight system, although smallvolumes of higher value-added products are imported and exported this way.
Although the dominant form of long-distance passenger traffic is still bus travel,the private car plays an important role in Hungarian life. Car ownershipincreased from 188 per 1,000 of the population in 1990 to 246 per 1,000 in2002. Air passenger traffic has grown rapidly in the past five years, but it stillmakes only a small contribution to total long-distance passenger traffic.Capacity at Budapest Ferihegy, the international airport, rose to 5.5m passengersper year after a recent expansion.
Nearly US$6bn in telecommunications investment, US$3bn of this from foreigninvestors, has transformed the moribund telecoms system inherited from thecommunist era into one of the best in the region. At the start of the 1990sHungary had one of Europe�s least-developed telecoms systems, with an
Freight haulage
Passenger transport
Motorway construction
Telecommunications progresshas slowed
24 Hungary
Country Profile 2003 www.eiu.com © The Economist Intelligence Unit Limited 2003
installed base of less than 1m main lines, a penetration rate of only nine linesper 100 inhabitants, and a call completion rate of less than 40%. Thegovernment soon transformed the fixed-line monopoly, Matav, into a joint-stock company, which oversaw the overhaul of the system. Full automationwas achieved in 1996 and digitalisation has reached over 90%. The number offixed lines has quadrupled over the past ten years. Matav, now controlled byDeutsche Telekom (Germany), still dominates the Hungarian fixed-linetelephone system, but a new telecoms law has opened the local, domestic andinternational markets in fixed-line phone services to competition. However,alternative telecoms providers were already on the scene, because voice overInternet protocol (VOIP) services were deemed not to violate monopolyconcessions. There is free competition in non-public fixed-line services, such asintra-company or data networks. Number portability, important to the easyswitching of customer accounts, is not envisaged until 2004.
The well-developed cellular telephone market has pushed Matav to improve.The number of mobile telephone service subscribers continued to grow rapidlyin 2002, with the market penetration rate increasing to above 55%, well beyondthat of the fixed-line market. The current market leader is Westel 900, a unit ofMatav, which now owns the mobile telephone operator outright, after taking anoption to purchase the 49% stake previously held by Matav�s parent company,Deutsche Telekom. The second largest operator is Pannon GSM, in which theDutch company KPN holds a 45% share. The latest entrant to the market,Vodafone, which started providing services on 1800 MHz in 1999, is the localunit of the UK mobile company of the same name, in a joint venture withAntenna Hungaria and RWE Telliance of Germany. All three service providersoffer wireless application protocol (WAP) services, although less than 10% ofsubscribers currently have WAP phones. General packet radio services (GPRS)facilities were introduced in 2001.
Matav�s hold over the country�s main telecoms networks has been difficult tobreak, and this is partly responsible for a loss of momentum in recent yearsthat has left Hungary with some of the region�s highest call and Internet accesscharges. Official figures showing 21 people per 100 population using theInternet probably overstate the numbers with access to the web�the numberof regular Internet users is probably about 1m. Besides the high cost of access,one of the main obstacles to the growth of Internet use is the relatively lownumbers of personal computers for home use.
Energy provision
Hungary is poorly endowed with natural resources, and has to import morethan half of its energy needs. Indigenous oil reserves, estimated at 58m tonnes,enabled domestic primary production of 1.8m tonnes in 2001, about one-fifthof refining input. Oil production declined steadily through the 1990s, afteraveraging around 2m tonnes/year before 1989. No new major oil discoveriesare expected. Estimated gas reserves are around 113bn cu metres, with domesticproduction now meeting around one-fifth of consumption, down from almosttwo-thirds of consumption in 1980. This reflects rising domestic consumption
Internet usage hindered bycosts and computer access
Mobile telephone penetrationsurpasses fixed-line market
Domestic resources are limited
Hungary 25
© The Economist Intelligence Unit Limited 2003 www.eiu.com Country Profile 2003
of gas, especially as a substitute for the less environmentally friendly coal, anda steady decline in domestic gas production from the 6.2bn cu metres recordedin 1989. There are natural gas deposits near Szeged, Miskolc and in easternHungary, and smaller crude oil deposits near Szeged, Zala county (westernHungary) and in other areas. Although there are small uranium deposits, themain mining company based near Pecs has closed after unsuccessful attemptsto sell the enterprise, leaving the Paks nuclear power plant (in central Hungary)dependent on imports.
Although energy consumption is forecast to rise as the economy expands, itsgrowth has so far been held down by sharp improvements in industrial energyefficiency. Electricity consumption growth is estimated to have been around 2%per annum in 1997-2001, even as overall economic growth was running atabout 4%. Under communism, energy use per unit of GDP was around2.5 times the OECD average. The 1989 level of industrial production wasregained during 1999 with around 25% less fuel use. Savings were achievedmainly through the closure of inefficient enterprises, motivated by a rise inindustrial fuel prices as subsidies were withdrawn.
As elsewhere in Europe, oil and natural gas had replaced coal as the primarysource of energy by the end of the 1970s. Gas already accounts for about 40%of Hungary�s electricity production, and most households and businesses relyon gas for heat. Hungary�s dependence on natural gas from the former SovietUnion was broken in 1996, when a pipeline between Gyor and Baumgartenlinked it to Austria�s gas grid for the first time. Oil supply has also started todiversify, with the opening of a pipeline to the Adriatic.
Gas sector
The National Oil and Gas Trust (MOL)
MOL, the Hungarian oil and gas company, was privatised in 1994, and the sixregional gas distribution companies (GDCs) in 1995. A subsequent share offering in1997 reduced the state stake in MOL from 59% to 25% plus one golden share, withforeign investors holding more than 30%. However, this did not mean an end topolitical influence on the company�s activities. MOL is the sole domestic producer,dominates imports (which account for 85% of Hungary�s gas needs), owns a networkof high-pressure gas transport and collection pipelines, is Hungary�s largest companyin terms of sales and is the sole distributor to the regional gas suppliers.The company�s distribution network must be open to competition if Hungary is toconform to the EU gas directive (which took effect in 2000), but progress towards thisand a liberalised price regime has been slow. Gas liberalisation raises the politicallysensitive problem that prices to industry and households will rise, owing to thewithdrawal of subsidy, before greater competition and efficiency leads to a fall. Thedate for full market liberalisation has been delayed several times, but liberalisationcould begin as early as mid-2003. Fearing the impact on inflation, and on poorerhouseholds� welfare, of a sharp rise in residential gas prices, governments past andpresent have usually restricted these to below inflation. The persistent lossesinflicted by these price controls have prompted attempts by MOL to sell itswholesale gas business. It has also prepared for eventual liberalisation of the sector,
26 Hungary
Country Profile 2003 www.eiu.com © The Economist Intelligence Unit Limited 2003
by seeking stakes in the GDCs, and has invested aggressively in pipelines andutilities in other countries in the region.After choosing to refocus on upstream production and downstream fuel retailing,MOL has undertaken a number of projects to diversify its supply bases, joiningconsortia seeking to produce oil and natural gas in Russia, Greece, Syria and otherlocations in the Middle East. Aware that the domestic market is too small, MOL isexpanding its processing operations regionally. It acquired a strategic stake in Slovakrefiner Slovnaft in 2001, and completed its majority takeover in March 2003. Amerger with Croatia�s INA has long been under discussion. However, MOL and INAare also open to acquisition by a larger multinational, with Austria�s OMV a possiblebidder. Downstream, MOL operates a network of more than 325 retail petrol outletsand plans to expand this to 400 in the coming years. It also has retail operations inneighbouring Romania and has recently announced a regional expansion plan. Thecurrent government has mooted plans to sell its remaining share, but no timetablehas been set.
Hungary continues to pursue reform of its energy and electricity markets,which has proceeded in fits and starts since partial privatisation of the sector inthe mid-1990s. Power generators and distributors are now foreign-owned, but astate-run entity, MVM, still owns and operates the national power grid,maintaining a monopoly in the wholesale market. As of January 1st 2003,however, about one-third of the retail electricity market has been liberalised, asthe government allowed roughly 200 firms to begin choosing their supplier.These large consumers are only able to buy 50% of their power from foreignsuppliers (Hungary currently imports only a small portion of its electricityconsumption annually), at least until Hungary joins the EU, at which pointelectricity imports will be fully liberalised. This is just the beginning of whatHungarian authorities see as a ten-year process to reform the sector fully.
Electricity sector
Hungarian Electricity Works (MVM)
State-owned MVM operates the electricity grid and is the dominant exporter,importer and wholesaler of electricity. Vertical separation between these functionsmust be achieved to satisfy EU directives. MVM�s privatisation has also beenpromised, but is unlikely to take place quickly. Deregulation, to allow regionaldistributors to buy from (and generators to sell to) companies other than MVM, andusers to choose their distributor, has picked up momentum recently, with a littlemore than 30% of the market liberalised as of January 1st 2003. The liberalisation islimited to large consumers, who will only be allowed to buy half of their powerfrom foreign suppliers.MVM, like MOL, the Hungarian oil and gas concern, will need to have its networkopened to upstream and downstream competition before EU energy directives aresatisfied. In principle, deregulation could reduce power prices, because of the surpluscapacity that would be forced into greater competition. However, the governmentfears that this could render MVM�s present purchase agreements with domesticgenerators uneconomic (especially the Paks plant). The risk of new electricity marketarrangements making peak-time supplies unavailable, or prohibitively expensive, hasalso induced some heavy users to install their own reserve generating capacity.
Electricity: reform comesslowly
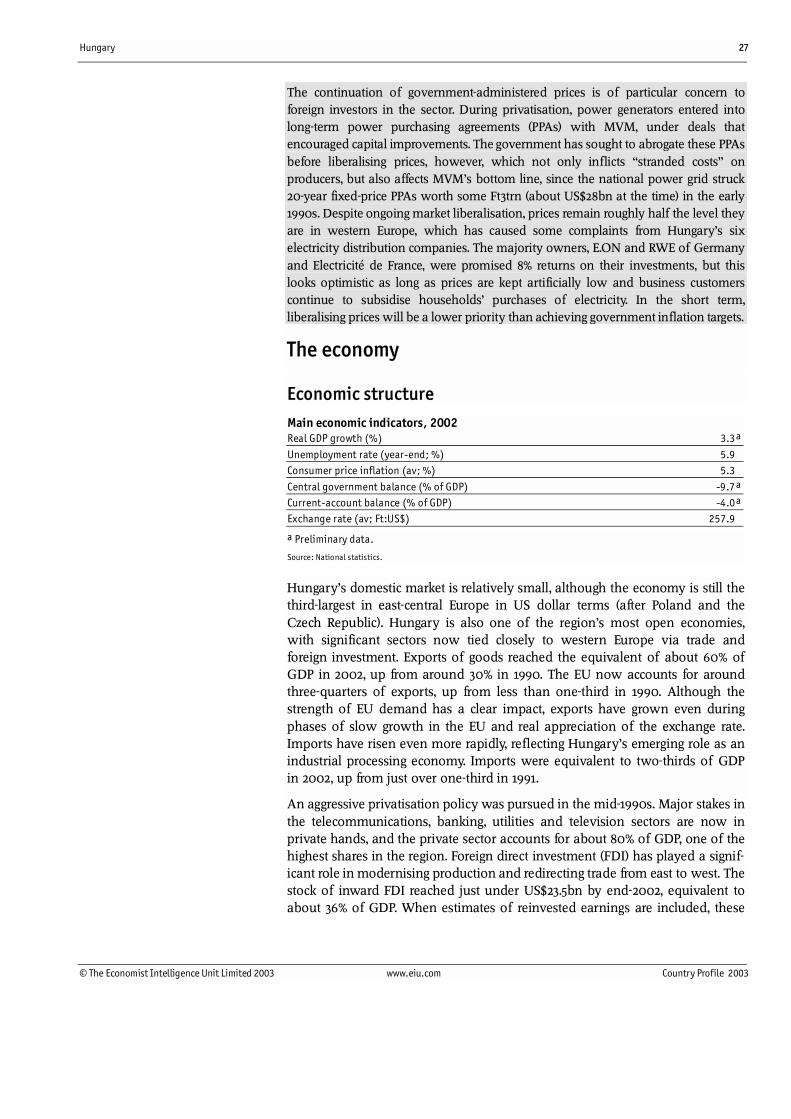
Hungary 27
© The Economist Intelligence Unit Limited 2003 www.eiu.com Country Profile 2003
The continuation of government-administered prices is of particular concern toforeign investors in the sector. During privatisation, power generators entered intolong-term power purchasing agreements (PPAs) with MVM, under deals thatencouraged capital improvements. The government has sought to abrogate these PPAsbefore liberalising prices, however, which not only inflicts �stranded costs� onproducers, but also affects MVM�s bottom line, since the national power grid struck20-year fixed-price PPAs worth some Ft3trn (about US$28bn at the time) in the early1990s. Despite ongoing market liberalisation, prices remain roughly half the level theyare in western Europe, which has caused some complaints from Hungary�s sixelectricity distribution companies. The majority owners, E.ON and RWE of Germanyand Electricité de France, were promised 8% returns on their investments, but thislooks optimistic as long as prices are kept artificially low and business customerscontinue to subsidise households� purchases of electricity. In the short term,liberalising prices will be a lower priority than achieving government inflation targets.
The economy
Economic structureMain economic indicators, 2002Real GDP growth (%) 3.3a
Unemployment rate (year-end; %) 5.9Consumer price inflation (av; %) 5.3
Central government balance (% of GDP) -9.7a
Current-account balance (% of GDP) -4.0a
Exchange rate (av; Ft:US$) 257.9
a Preliminary data.
Source: National statistics.
Hungary�s domestic market is relatively small, although the economy is still thethird-largest in east-central Europe in US dollar terms (after Poland and theCzech Republic). Hungary is also one of the region�s most open economies,with significant sectors now tied closely to western Europe via trade andforeign investment. Exports of goods reached the equivalent of about 60% ofGDP in 2002, up from around 30% in 1990. The EU now accounts for aroundthree-quarters of exports, up from less than one-third in 1990. Although thestrength of EU demand has a clear impact, exports have grown even duringphases of slow growth in the EU and real appreciation of the exchange rate.Imports have risen even more rapidly, reflecting Hungary�s emerging role as anindustrial processing economy. Imports were equivalent to two-thirds of GDPin 2002, up from just over one-third in 1991.
An aggressive privatisation policy was pursued in the mid-1990s. Major stakes inthe telecommunications, banking, utilities and television sectors are now inprivate hands, and the private sector accounts for about 80% of GDP, one of thehighest shares in the region. Foreign direct investment (FDI) has played a signif-icant role in modernising production and redirecting trade from east to west. Thestock of inward FDI reached just under US$23.5bn by end-2002, equivalent toabout 36% of GDP. When estimates of reinvested earnings are included, these
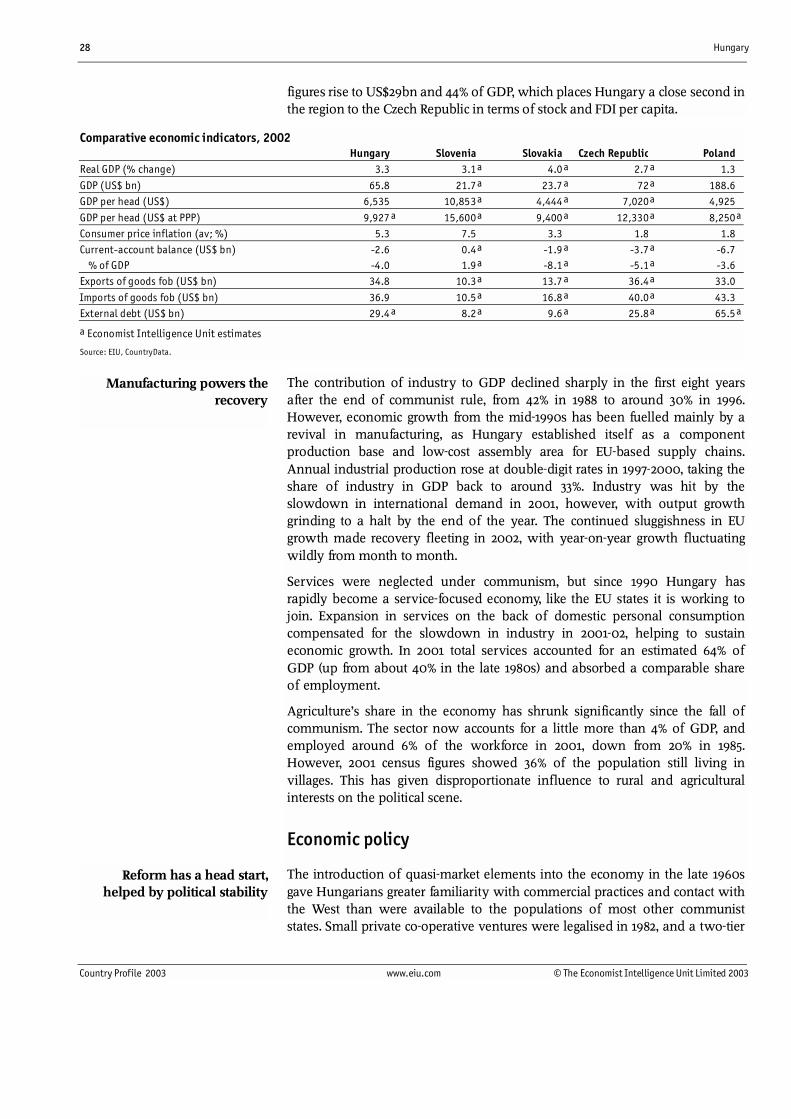
28 Hungary
Country Profile 2003 www.eiu.com © The Economist Intelligence Unit Limited 2003
figures rise to US$29bn and 44% of GDP, which places Hungary a close second inthe region to the Czech Republic in terms of stock and FDI per capita.
Comparative economic indicators, 2002Hungary Slovenia Slovakia Czech Republic Poland
Real GDP (% change) 3.3 3.1a 4.0 a 2.7a 1.3
GDP (US$ bn) 65.8 21.7a 23.7 a 72a 188.6GDP per head (US$) 6,535 10,853a 4,444 a 7,020a 4,925
GDP per head (US$ at PPP) 9,927 a 15,600a 9,400 a 12,330a 8,250a
Consumer price inflation (av; %) 5.3 7.5 3.3 1.8 1.8Current-account balance (US$ bn) -2.6 0.4a -1.9 a -3.7a -6.7 % of GDP -4.0 1.9a -8.1 a -5.1a -3.6Exports of goods fob (US$ bn) 34.8 10.3a 13.7 a 36.4a 33.0
Imports of goods fob (US$ bn) 36.9 10.5a 16.8 a 40.0a 43.3External debt (US$ bn) 29.4 a 8.2a 9.6 a 25.8a 65.5a
a Economist Intelligence Unit estimates
Source: EIU, CountryData.
The contribution of industry to GDP declined sharply in the first eight yearsafter the end of communist rule, from 42% in 1988 to around 30% in 1996.However, economic growth from the mid-1990s has been fuelled mainly by arevival in manufacturing, as Hungary established itself as a componentproduction base and low-cost assembly area for EU-based supply chains.Annual industrial production rose at double-digit rates in 1997-2000, taking theshare of industry in GDP back to around 33%. Industry was hit by theslowdown in international demand in 2001, however, with output growthgrinding to a halt by the end of the year. The continued sluggishness in EUgrowth made recovery fleeting in 2002, with year-on-year growth fluctuatingwildly from month to month.
Services were neglected under communism, but since 1990 Hungary hasrapidly become a service-focused economy, like the EU states it is working tojoin. Expansion in services on the back of domestic personal consumptioncompensated for the slowdown in industry in 2001-02, helping to sustaineconomic growth. In 2001 total services accounted for an estimated 64% ofGDP (up from about 40% in the late 1980s) and absorbed a comparable shareof employment.
Agriculture�s share in the economy has shrunk significantly since the fall ofcommunism. The sector now accounts for a little more than 4% of GDP, andemployed around 6% of the workforce in 2001, down from 20% in 1985.However, 2001 census figures showed 36% of the population still living invillages. This has given disproportionate influence to rural and agriculturalinterests on the political scene.
Economic policy
The introduction of quasi-market elements into the economy in the late 1960sgave Hungarians greater familiarity with commercial practices and contact withthe West than were available to the populations of most other communiststates. Small private co-operative ventures were legalised in 1982, and a two-tier
Manufacturing powers therecovery
Reform has a head start,helped by political stability
Hungary 29
© The Economist Intelligence Unit Limited 2003 www.eiu.com Country Profile 2003
banking system and the beginnings of a Western-style tax system were also inplace by the late 1980s. In 1988-89 the government led by the Hungarian SocialistWorkers� Party (MSZMP) created an opening for privatisation and foreigninvestment by passing new legislation on joint ventures, foreign investment andthe transformation of state enterprises into shareholding companies.
This early reform experience gave Hungary an institutional and cultural headstart as the east-central European countries pursued marketisation and Westernintegration after 1990. Hungary�s post-communist economic policy has beenaided by political stability. Hungary has consistently been ranked among theleading transition economies in EU, OECD and other multilateral progressreports. High foreign debt, limited public finances, the openness of theeconomy and the comparatively large private (especially foreign) stake in theeconomy have left Hungary�s post-communist governments relatively littleroom to deviate from a reformist, liberalising path. The external paymentsdifficulties of the mid-1990s ultimately accelerated the pace of privatisation, andthe 1998-99 Russian recession spurred exporters� efforts to diversify into higher-income EU and North American markets.
Hungary�s drive to join the EU, on which there is a strong cross-partyconsensus, has also increasingly become a pressure for institutional reform. Likeother current candidates, Hungary must eventually meet the Maastricht criteriafor adopting the euro. Hungary will join the EU in 2004 and hopes to adopt theeuro in 2007-08. The key macroeconomic policy challenge facing all Hungary�spost-communist governments has been balancing the need to curb inflationand public deficits against the desire for growth, aimed at raising livingstandards to Western levels. Each government has loosened fiscal policy in therun-up to elections.
In several spheres there was a continuity in reform from the late communistperiod into the tenure of the first post-communist government, elected in 1990and led by the Hungarian Democratic Forum. The conservative administrationset out an economic programme in March 1991 that included liberalising foreigntrade, freeing prices, reducing subsidies and improving the position of theprivate sector.
In the wake of the reforms and the collapse of the integrated, old Soviet-bloctrade system, real GDP and industrial output contracted and unemploymentincreased. Fixed investment also declined, despite large inflows of foreigninvestment. The country soon faced structural problems resulting from thegovernment�s failure to reduce its expenditure. Central government deficitsbetween 1991 and 1995 were 5.5-6.5% of GDP. There was a dramatic increase inthe trade deficit. Even when the current account went into a large deficit in1993, the conservative government failed to adjust its policies in the run-up tothe 1994 parliamentary election.
The government elected in 1994, comprising the Hungarian Socialist Party andliberal Alliance of Free Democrats, eventually implemented a toughstabilisation programme in 1995-97. The �Bokros Package�, named after thefinance minister who devised it, included social spending cuts to reduce the
Early liberalisation
The austerity programme
30 Hungary
Country Profile 2003 www.eiu.com © The Economist Intelligence Unit Limited 2003
fiscal deficit, a 9% devaluation, an 8% import surcharge and a strict incomespolicy. The macroeconomic aspects of the package were closely linked tostructural changes, including a medium-term reduction in the size of the publicsector and an ambitious programme of privatisation of state enterprises andstate-owned commercial banks. The programme also introduced the exchange-rate system used until 2001, involving a pre-announced monthly crawling-pegdevaluation rate. The Bokros Package led to major improvements in internaland external balances, although it also fuelled inflation in the short term.Inflows from a sustained privatisation programme were used for substantialreduction of the burden of public debt. However, the social hardships imposedby the Bokros Package contributed to the Socialist-liberal government�s electiondefeat in 1998.
The Fidesz-Hungarian Civic Party (Fidesz) won the May 1998 election partly onan �anti-Bokros� ticket, with promises of restored and increased family andwelfare benefits, faster growth, lower taxes and more health and highereducation spending. The overall aim was to promote Hungary�s convergencewith west European wealth levels as fast as possible, by accelerating economicgrowth. Fidesz also sought to make a strong contrast with its predecessor�spolicies, while pursuing specific social and economic goals�principally creatingjobs, encouraging more child-bearing and supporting a new middle class.Despite its expansionist rhetoric, Fidesz at first refrained from jeopardising fiscalstability. For example, the government held back from some increases inspending in 1999 when the economic balances worsened, and the 7% real GDPgrowth rate promised before the election was in effect abandoned. Deficitreduction targets, however, were modest given the strength of the economy.The 2000 budget targeted a reduction to 3.5% of GDP for the public-sectordeficit, and the two-year consolidated budget for 2001 and 2002 aimed fordeficits of 3.4% and 3.2%, respectively. Both the 2000 and 2001 targets were met,according to official statistics at the time.
In retrospect, however, fiscal policy loosened significantly under the Fideszadministration during its last two years in office. First of all, many of thegovernment�s prized infrastructure projects�in particular roadbuilding andother elements of its Szechenyi Plan, a national development programmenamed in honour of an entrepreneurial nineteenth-century aristocrat�werenever on the budget. The importance of this was revealed when both theMinistry of Finance and the EU began releasing estimates of fiscal deficits usingEU methodology. Previously, the finance ministry had calculated budget dataaccording to accounting methodology (GFS-86) developed by the IMF, whichomits a number of items, notably commitments and loan guarantees toinfrastructure projects, the inclusion of which result in a substantially higherversion of public-sector deficits. These off-budget items are included in the EU�saccounting system (ESA 95), which Hungary had to adopt before accession in2004. According to the latest EU progress report, Hungary�s fiscal deficit (usingESA 95 methodology) averaged 5.4% in 1997-2001. The OECD estimates that the2001 fiscal deficit reached 5.1% of GDP, according to methodology roughlyequivalent to ESA 95.
Fidesz goes for growth
Fiscal policy loosenssubstantially in 2001-02

Hungary 31
© The Economist Intelligence Unit Limited 2003 www.eiu.com Country Profile 2003
Besides the usual election-year spending, the slowing global economy and long-standing structural problems explain the widening of fiscal deficits prior toFidesz leaving office. For example, pensioners and public-sector workersreceived major increases in payments, and the minimum wage rose by 75%.Ostensibly to counteract the effects of the global economic slowdown, theFidesz government announced in September 2001 its so-called �Szechenyi Plus�programme, which involved the expansion of the existing Szechenyi Plan andthe bringing forward of some planned investments. Furthermore, a severeoverrun at the Social Security Fund, which oversees healthcare expenditure,also impaired budgetary performance (see below.)
Fiscal policy
Tackling the structural fiscal deficit
International praise for Hungary�s fiscal consolidation and public debt reductionafter 1995 has given way to criticism for the recent deterioration in public finances,and the way this was concealed through expanding off-budget transactions. Thewidening of the public-sector deficit since 2000 was presented by the previousgovernment as a deliberate policy choice, to stimulate the economy. It has now beenrevealed as the unintended consequence of failing to tackle longer-running structuralproblems, which will not go away even when the growth rate quickens again. Theextent of the loss of fiscal discipline is exposed by calculations of the National Bankof Hungary (NBH, the central bank) that show the impact of general governmentexpenditure on aggregate demand: from a contractionary effect equivalent to 0.6% ofGDP in 1999 and 2000, this swung to an expansionary effect of 2.5% of GDP in 2001.Although it may have shielded the economy from a more serious downturn asexport and investment growth slowed after mid-2001, this expansionary stancecontributed to the deterioration of the external balance and the slower decline ininflation in 2002. By triggering monetary tightening, which raised interest rates andstrengthened the exchange rate, fiscal loosening on this scale may even haveneutralised its inflationary effects by further deterring investment and curbing netexport demand.
State social funds the main concern
One source of the fiscal imbalance, the state social funds, has been a long-standingproblem, which the previous Hungarian Socialist Party-Alliance of Free Democratsadministration (1994-98) sought to tackle through pension reform, and which thepresent administration will seek to resolve through matching healthcare reform.However, the pension changes�involving compulsory contributions to a top-upprivate scheme for those now entering the workforce�have initially worsened theexcess of state pay-outs over revenue, and are still a long way from building the�funded� retirement savings base that would allow the reductions in socialinsurance contributions promised by the outgoing government. Although pensionreform initially promised to save public money, the unexpected scale of voluntaryopting out of the public scheme has not only caused a larger diversion of payroll taxreceipts than anticipated, but has also created possible private pension financingproblems, which may force extra government outlays at a later stage. This is because,before steps were taken to limit the degree of opting-out, large numbers of workersopted into part-private arrangements. Many of these workers earn too little or are tooold to build up savings sufficiently to substitute for a state pension.
32 Hungary
Country Profile 2003 www.eiu.com © The Economist Intelligence Unit Limited 2003
These early problems with the pension reform were one reason why the outgoingFidesz government never made progress on its promised plans for healthcare reform.It is not yet clear whether the new coalition will tackle the issue more decisively,despite the need for a sharp reduction in current spending obligations. The two mainoptions for reducing state healthcare subsidy costs�more charging for services andexpansion of private insurance as a partial substitute for state provision�are highlyrisky to the government�s popularity, especially as a sizeable number of voterscontinue to expect services to be formally free, even though many already pay extra(sometimes under the table) for better or faster treatment.The switch to part-privatised pensions and healthcare is especially problematic forHungary because, to avoid charging the present workforce twice (for its own futureprovision as well as the present demands of the older generation), the normalprocedure would be for the government to issue more debt to cover the transitionalrevenue gap as payroll taxes are diverted into new private funds. As public debt isalready close to 60% of GDP, the maximum allowed to qualify for Europeaneconomic and monetary union (EMU), the government is reluctant to interrupt thesteady net debt reduction of the past six years.
The Socialist-led government that came into office in May 2002 had its own setof spending priorities. In addition to last-minute rises in the minimum wageand pensions approved by the outgoing Fidesz administration, the Socialistsscrapped the personal income tax on the minimum wage and gave pay rises ofup to 50% to most public-sector employees. As a result, the general governmentbudget recorded an unprecedented deficit of Ft1.6trn (US$6.3bn) in 2002,equivalent to 9.7% of GDP. Besides the rise in the state-sector wage bill andanother severe overshoot of the planned social security fund deficit, theadoption of EU-compatible accounting methodology explains roughly three-fifths of the rise in the deficit on 2001. Even according to the oldermethodology (GFS-86), however, the general government deficit would�onofficial calculations�still have reached 5.7% of GDP in 2002.
The radical overhaul of the tax system promised by Fidesz during the 1998election campaign never was realised, and fiscal constraints have hampered theSocialists in fulfilling their promises to lower the tax burden since coming tooffice. Fidesz did manage to reduce the number of personal income-tax bracketsto three in 1999, but large cuts in personal tax rates became stalled. Employers�social security contributions were similarly reduced, but only modestly, to 29%by the start of 2002. Overall, personal and employers� taxes remain high. Value-added tax (VAT), at 25% for most products, is among the highest in the OECD(and some products currently enjoying lower rates will have to move into thehigher bracket to meet EU conditions).
Earlier Socialists� plans to reduce the basic income-tax rate from 20% to 19%, andthe middle rate, levied on annual incomes of at least Ft650,000 (aroundUS$2,500), from 30% to 25%, have been deferred indefinitely. The top rate (40%)now applies to annual incomes above Ft1.35bn, although this is not muchhigher than the current average wage. The need to raise tax revenue, so as toachieve fiscal deficit reduction without improbably large and painful spendingcuts, was also recognised in changes to VAT, which resulted in some itemsmoving from the concessionary rate (12%) to the standard one (25%). Although
Tax reform postponed
Socialists have their ownspending priorities
Hungary 33
© The Economist Intelligence Unit Limited 2003 www.eiu.com Country Profile 2003
employers continue to be promised a reduction in their social fundcontributions as healthcare reform gets under way, payroll taxes are rising thisyear in de facto terms, a result of changes in governing pension contributions.
With a former Fidesz finance minister, Zsigmond Jarai, at the head of theNational Bank of Hungary (NBH, the central bank) from March 2001, relationsbetween the government and the central bank over policy were relativelytension-free, and probably allowed the administration greater fiscal latitude inthe run-up to the election. Seven base-rate cuts between September 2001 andMarch 2002, taking the rate down by 275 basis points, to 8.5%, were supportiveof the government�s growth aims. Monetary loosening was encouraged byslowing growth and inflation, and by the currency strengthening that followedthe widening of the forint�s exchange-rate band in May 2001 to ±15% on eitherside of a �crawling peg� to the euro. The widening of the forint�s band wasfollowed in October 2001 by the abandonment of the crawling-peg exchange-rate system. The NBH no longer formally targets the exchange rate, following ashift to direct inflation-targeting. However, the NBH has had to maintain aninformal de facto exchange-rate target, with a view towards the officiallyannounced inflation target.
Following the April 2002 general election, the NBH tightened monetary policy,a direct reaction to the worsening picture on the fiscal and external accounts.Given Mr Jarai�s link to the previous government and his apparent tolerance offiscal loosening prior to the election, relations between the NBH and theSocialist-led government deteriorated, particularly as higher interest rates wereseen as hindering the Socialists plan to lower fiscal deficits through highergrowth. The government even threatened to curb the NBH�s independence,before backing off after pressure from the EU.
The rise in interest rates, at a time when other east-central European countrieswere lowering theirs, attracted strong inflows of portfolio capital, thus drivingup the value of the forint. By late 2002 the removal of the last major hurdles toHungary joining the EU in 2004 and favourable spreads between forint-denominated debt and comparable euro zone instruments�some of the highestin the region�attracted inflows of speculative capital, betting that the centralbank would have to either revalue the forint�s central rate versus the euro, orabandon the exchange-rate regime altogether and allow the currency to float.
After two small interest-rate cuts in late 2002, the NBH made an about-turn inpolicy�towards a substantial monetary loosening�after the conflict between itsanti-inflation objectives and currency target became irreconcilable in January2003. A swift, sharp reduction in interest rates was implemented to preventspeculative capital inflows pushing the forint through the stronger end of itsfluctuation band, even though the NBH�s inflation outlook would normallyhave persuaded it to keep interest rates on hold. Mr Jarai has admitted thatyear-end inflation will exceed the NBH�s ceiling of 4.5% in 2003, confirming ade facto end to the central bank�s official policy of targeting inflation.
Speculative pressure forces theNBH�s hand
34 Hungary
Country Profile 2003 www.eiu.com © The Economist Intelligence Unit Limited 2003
Monetary policy
The central bank�s about-face
The challenge faced by the National Bank of Hungary (NBH, the central bank) in2002 and early 2003 was that it had two anchors for monetary policy. It was tryingto target inflation aggressively while simultaneously maintaining the exchange-ratewithin a trading band of 15% on either side of a central rate against the euro�andthese goals proved to be incompatible. To achieve the first goal of reducing the rateof inflation, the NBH had to rely on a strong appreciation of the currency, with theforint gaining some 15% in nominal terms against the euro between May 2001(when the band was widened from 2%) and January 13th 2003, when the forintactually breached the strong end of its trading band.
NBH tries to wrong-foot the market
Before January 2003 the central bank remained beholden to its ambitious targets forinflation�all the more ambitious given record-high fiscal deficits and wage rises�justas inflows of foreign capital put more pressure on the forint to strengthen beyond itsupper limit. Portfolio inflows had been strong throughout most of 2002, as investorswere attracted by the highest real interest rates in the region. However, the realisationin October 2002 that EU membership for Hungary was all but assured as early as2004, led portfolio investors to see only upside potential to the forint.In reaction, central bank policy departed from its usual transparency. Instead, theNBH�s Monetary Council proceeded on a course of easing speculative pressure bytrying to insert uncertainty into an otherwise stable market. This was done bymaking policy statements that directly contradicted central bank actions, evenhinting at rate hikes just hours before a rate cut, but policy pronouncements stronglysupporting inflation-targeting�coupled with small interest-rate cuts�seemed only tofuel further speculative inflows.
The NBH wins, and Hungary wins
In the end, the NBH was forced to fend off investors by intervening heavily in theforeign-exchange markets, cutting interest rates by another 200 basis points andrestricting access to its short-term deposit facilities. For its efforts, the NBH hasreceived commendations, particularly from foreign media. The EconomistIntelligence Unit would concur that keeping the forint from appreciating further wasa battle worth fighting. With unit labour costs rising by around 50% in US dollarterms over the past two years, Hungarian exporters could little afford a further risein the forint.
A Pyrrhic victory?
However, the NBH has paid a high price. Its policy of targeting inflation is now ashambles, and its efforts to add instability to the markets has been a blow to thebank�s credibility. Although financial markets are likely to be forgiving of the NBH�ifanything, portfolio investors probably admire the NBH�s pluck in defending aweaker forint, and are likely to forget the episode in a few months�the central bankwill have a hard time regaining the confidence of rank-and-file Hungarians. Centralbank officials have long admitted that one reason for the record wage rises in 2002was that employers� organisations and labour unions had little faith in NBH inflationtargets. These same parties will have only less faith now, making disinflation moredifficult for some time to come.
Hungary 35
© The Economist Intelligence Unit Limited 2003 www.eiu.com Country Profile 2003
A privatisation law was approved by parliament in May 1995, consolidating theexisting state asset and management companies into the Privatisation and StateAsset Company (APV). Under pressure to reduce public debt, the 1994-98Socialist-led administration speeded up privatisation: the forint value ofprivatised state assets tripled from Ft158bn in 1994 to more than Ft480bn in1995. Receipts remained strong over the next three years as the focus shifted tolarger companies, including MOL (gas), electricity generators and distributors,commercial banks, and remaining shares in Matav (telecoms). The 1995privatisation law designated 93 companies to stay in long-term minority,majority or total state ownership. Parliament also passed �golden share�legislation aimed at maintaining special veto rights for the state in another50 companies. At the end of 2000 the APV still had 175 companies under itssupervision; some sales took place in 2001-02, but the value of companiesunder the APV still stood at close to Ft700bn at the end of 2002.
Although state-asset sales essentially stalled under Fidesz, the new Socialist-ledgovernment has plans to jump-start privatisation, with plans to bring inrevenue worth Ft200bn in 2003. It has already launched plans to privatise theretail bank Postabank and the land credit and mortgage bank FHB, and alsohopes to sell the last state-owned bank, Konsumbank, later in the year.However, other remaining major assets will remain in state hands, such asnational electricity grid operator MVM, broadcaster Antenna Hungaria (whichhas long-term plans to derive half of its turnover from telecoms), and nationalairline Malev (which failed to attract any buyers when offered in 2000, andcontinues to receive state bail-outs). The sale of the state�s share in MOL, theHungarian oil and gas company, has been mooted but looks to be delayedbeyond 2003.
Economic performance
In the 1970s Hungary�s economy experienced by regional standards highannual growth rates (averaging about 4%), as the government borrowedinternationally to finance investment, hoping to generate sufficient exports topay back the debt. Misallocation of funds and a hostile international climateprevented this, and external hard-currency debt had grown to around 70% ofGDP by the end of the 1980s.
The economic transition was accompanied by sharp contractions in real GDPand industrial output (of 18% and 25%, respectively) between 1989 and 1993. Theeconomy began to grow again in 1994, when it expanded by 2.9%. The return togrowth was accompanied by a fiscal imbalance and a large current-accountdeficit. The stabilisation measures introduced in 1995 succeeded in reducingthese deficits, but they also had the effect of slowing growth. In 1995 and 1996GDP growth rates were more modest, averaging 1.4%. However, the economyrecovered strongly in 1997-2000 on the back of rapid growth in manufacturedexports, with growth averaging 4.7% per year. A peak in year-on-year growthrates was reached in the first quarter of 2000, at 6.5%, with a subsequentslowdown restricting growth to 5.2% for the year as a whole.
Unfavourable legacies
Privatisation

36 Hungary
Country Profile 2003 www.eiu.com © The Economist Intelligence Unit Limited 2003
Gross domestic product(% change; constant prices)
Annual average2002 a 1997-2001
Private consumption 8.8 3.7
Government consumption 1.5 1.8Gross fixed investment 5.8 7.3
Exports of goods & services 3.8 17.4Imports of goods & services 6.8 17.4GDP 3.3 4.5
a Preliminary official figures from the Central Statistical Office (KSH).
Source: Economist Intelligence Unit.
The global economic slowdown caused growth to slow continuously through2001, taking full-year growth to 3.8%. Growth hit a six-year low of 2.9% in thefirst quarter of 2002, before accelerating slowly to average 3.3% for the year.With the sluggish recovery in Hungary�s EU markets, growth has beensustained by strong domestic demand, partly fuelled by a strong fiscal stimulus.This has led to ever widening fiscal and external deficits�the return ofHungary�s familiar twin deficits problem.
Gross investment fell sharply during the 1990-91 recession and again under theausterity programme of 1995-96. Investment growth picked up strongly during1997-98 as the privatisation programme picked up speed, but fell back in1999-2001. The slowdown in year-on-year investment growth to 3.1% in 2001was primarily a response to cautious demand expectations and highlighted thecontinued constraints on firms� capital budgets, as import competition andregulation squeezed profit margins, and banks remained cautious in theircommercial lending activity. As in the early 1990s, the slowdown in investmentpointed to an ongoing slowdown in production growth, and a danger ofdomestic demand shifting too far towards consumption. A strong fiscalstimulus caused investment to rise by just under 6% in 2002.
The stabilisation measures of 1995 had a negative impact on privateconsumption, which fell sharply in 1995-96. Private consumption graduallypulled out of recession in 1997, before recovering strongly in 1998-99. After abrief slowdown in 2000, as higher than expected inflation eroded wagegrowth, private consumption growth recovered in 2001. The government�s largerises in the minimum wage and the fall in inflation helped. Privateconsumption growth boomed in 2002, as real wage growth exceeded 12%. Realwages fell sharply as a result of the austere Bokros Package, but recordedaverage growth of around 3.5% in 1997-2000.
Extensive industrial modernisation, financed mainly by inward investment, hassubstantially improved the quantity and quality of goods sold abroad. Exportgrowth has been positive in real terms since 1992 and in double digits in1994-2000. The slowdown in global demand hit exports hard in 2001-02,reducing the sector�s share in driving growth. The slowdown in growth, to 3.8%in 2001, has been especially worrying and has raised questions about the
Investment
Private consumption
Exports
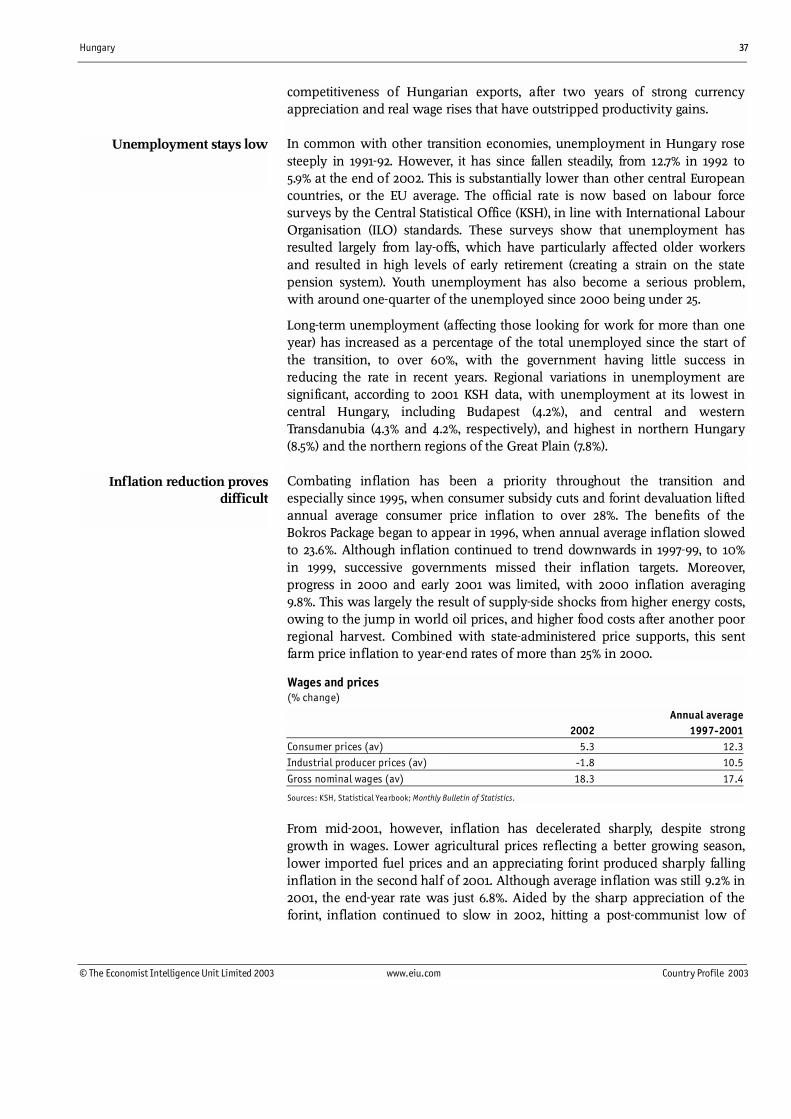
Hungary 37
© The Economist Intelligence Unit Limited 2003 www.eiu.com Country Profile 2003
competitiveness of Hungarian exports, after two years of strong currencyappreciation and real wage rises that have outstripped productivity gains.
In common with other transition economies, unemployment in Hungary rosesteeply in 1991-92. However, it has since fallen steadily, from 12.7% in 1992 to5.9% at the end of 2002. This is substantially lower than other central Europeancountries, or the EU average. The official rate is now based on labour forcesurveys by the Central Statistical Office (KSH), in line with International LabourOrganisation (ILO) standards. These surveys show that unemployment hasresulted largely from lay-offs, which have particularly affected older workersand resulted in high levels of early retirement (creating a strain on the statepension system). Youth unemployment has also become a serious problem,with around one-quarter of the unemployed since 2000 being under 25.
Long-term unemployment (affecting those looking for work for more than oneyear) has increased as a percentage of the total unemployed since the start ofthe transition, to over 60%, with the government having little success inreducing the rate in recent years. Regional variations in unemployment aresignificant, according to 2001 KSH data, with unemployment at its lowest incentral Hungary, including Budapest (4.2%), and central and westernTransdanubia (4.3% and 4.2%, respectively), and highest in northern Hungary(8.5%) and the northern regions of the Great Plain (7.8%).
Combating inflation has been a priority throughout the transition andespecially since 1995, when consumer subsidy cuts and forint devaluation liftedannual average consumer price inflation to over 28%. The benefits of theBokros Package began to appear in 1996, when annual average inflation slowedto 23.6%. Although inflation continued to trend downwards in 1997-99, to 10%in 1999, successive governments missed their inflation targets. Moreover,progress in 2000 and early 2001 was limited, with 2000 inflation averaging9.8%. This was largely the result of supply-side shocks from higher energy costs,owing to the jump in world oil prices, and higher food costs after another poorregional harvest. Combined with state-administered price supports, this sentfarm price inflation to year-end rates of more than 25% in 2000.
Wages and prices(% change)
Annual average2002 1997-2001
Consumer prices (av) 5.3 12.3Industrial producer prices (av) -1.8 10.5
Gross nominal wages (av) 18.3 17.4
Sources: KSH, Statistical Yearbook; Monthly Bulletin of Statistics.
From mid-2001, however, inflation has decelerated sharply, despite stronggrowth in wages. Lower agricultural prices reflecting a better growing season,lower imported fuel prices and an appreciating forint produced sharply fallinginflation in the second half of 2001. Although average inflation was still 9.2% in2001, the end-year rate was just 6.8%. Aided by the sharp appreciation of theforint, inflation continued to slow in 2002, hitting a post-communist low of
Unemployment stays low
Inflation reduction provesdifficult
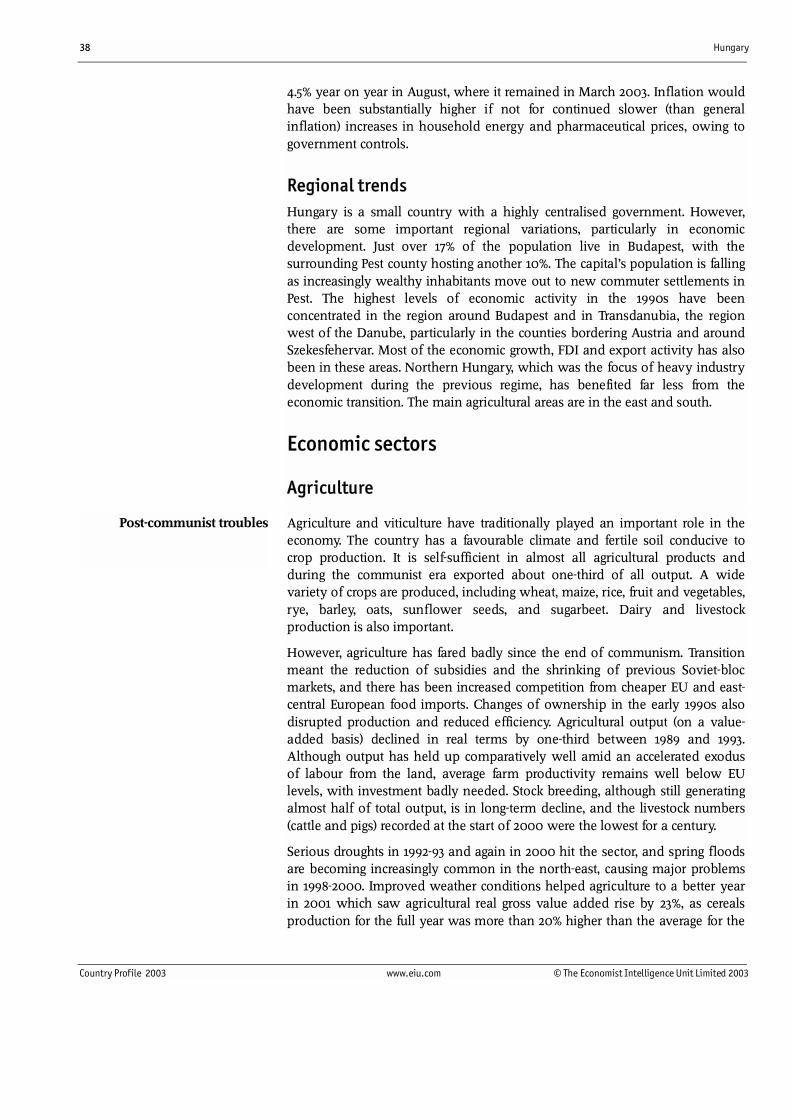
38 Hungary
Country Profile 2003 www.eiu.com © The Economist Intelligence Unit Limited 2003
4.5% year on year in August, where it remained in March 2003. Inflation wouldhave been substantially higher if not for continued slower (than generalinflation) increases in household energy and pharmaceutical prices, owing togovernment controls.
Regional trendsHungary is a small country with a highly centralised government. However,there are some important regional variations, particularly in economicdevelopment. Just over 17% of the population live in Budapest, with thesurrounding Pest county hosting another 10%. The capital�s population is fallingas increasingly wealthy inhabitants move out to new commuter settlements inPest. The highest levels of economic activity in the 1990s have beenconcentrated in the region around Budapest and in Transdanubia, the regionwest of the Danube, particularly in the counties bordering Austria and aroundSzekesfehervar. Most of the economic growth, FDI and export activity has alsobeen in these areas. Northern Hungary, which was the focus of heavy industrydevelopment during the previous regime, has benefited far less from theeconomic transition. The main agricultural areas are in the east and south.
Economic sectors
Agriculture
Agriculture and viticulture have traditionally played an important role in theeconomy. The country has a favourable climate and fertile soil conducive tocrop production. It is self-sufficient in almost all agricultural products andduring the communist era exported about one-third of all output. A widevariety of crops are produced, including wheat, maize, rice, fruit and vegetables,rye, barley, oats, sunflower seeds, and sugarbeet. Dairy and livestockproduction is also important.
However, agriculture has fared badly since the end of communism. Transitionmeant the reduction of subsidies and the shrinking of previous Soviet-blocmarkets, and there has been increased competition from cheaper EU and east-central European food imports. Changes of ownership in the early 1990s alsodisrupted production and reduced efficiency. Agricultural output (on a value-added basis) declined in real terms by one-third between 1989 and 1993.Although output has held up comparatively well amid an accelerated exodusof labour from the land, average farm productivity remains well below EUlevels, with investment badly needed. Stock breeding, although still generatingalmost half of total output, is in long-term decline, and the livestock numbers(cattle and pigs) recorded at the start of 2000 were the lowest for a century.
Serious droughts in 1992-93 and again in 2000 hit the sector, and spring floodsare becoming increasingly common in the north-east, causing major problemsin 1998-2000. Improved weather conditions helped agriculture to a better yearin 2001 which saw agricultural real gross value added rise by 23%, as cerealsproduction for the full year was more than 20% higher than the average for the
Post-communist troubles
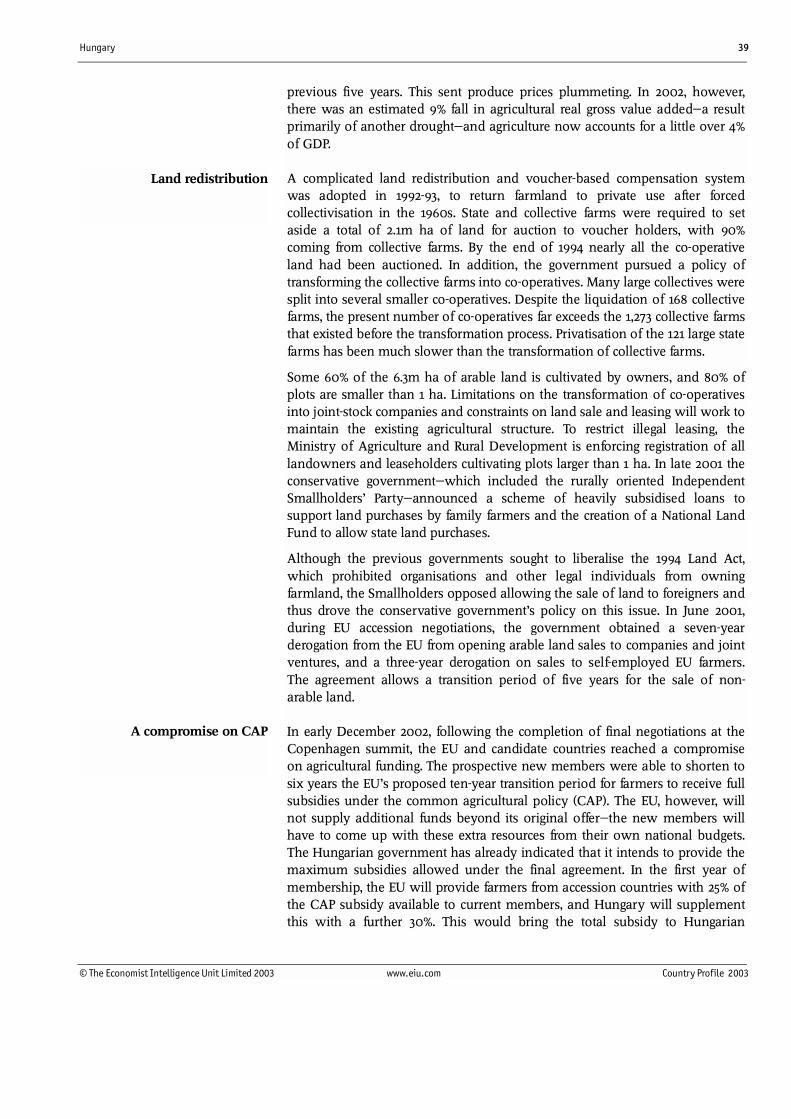
Hungary 39
© The Economist Intelligence Unit Limited 2003 www.eiu.com Country Profile 2003
previous five years. This sent produce prices plummeting. In 2002, however,there was an estimated 9% fall in agricultural real gross value added�a resultprimarily of another drought�and agriculture now accounts for a little over 4%of GDP.
A complicated land redistribution and voucher-based compensation systemwas adopted in 1992-93, to return farmland to private use after forcedcollectivisation in the 1960s. State and collective farms were required to setaside a total of 2.1m ha of land for auction to voucher holders, with 90%coming from collective farms. By the end of 1994 nearly all the co-operativeland had been auctioned. In addition, the government pursued a policy oftransforming the collective farms into co-operatives. Many large collectives weresplit into several smaller co-operatives. Despite the liquidation of 168 collectivefarms, the present number of co-operatives far exceeds the 1,273 collective farmsthat existed before the transformation process. Privatisation of the 121 large statefarms has been much slower than the transformation of collective farms.
Some 60% of the 6.3m ha of arable land is cultivated by owners, and 80% ofplots are smaller than 1 ha. Limitations on the transformation of co-operativesinto joint-stock companies and constraints on land sale and leasing will work tomaintain the existing agricultural structure. To restrict illegal leasing, theMinistry of Agriculture and Rural Development is enforcing registration of alllandowners and leaseholders cultivating plots larger than 1 ha. In late 2001 theconservative government�which included the rurally oriented IndependentSmallholders� Party�announced a scheme of heavily subsidised loans tosupport land purchases by family farmers and the creation of a National LandFund to allow state land purchases.
Although the previous governments sought to liberalise the 1994 Land Act,which prohibited organisations and other legal individuals from owningfarmland, the Smallholders opposed allowing the sale of land to foreigners andthus drove the conservative government�s policy on this issue. In June 2001,during EU accession negotiations, the government obtained a seven-yearderogation from the EU from opening arable land sales to companies and jointventures, and a three-year derogation on sales to self-employed EU farmers.The agreement allows a transition period of five years for the sale of non-arable land.
In early December 2002, following the completion of final negotiations at theCopenhagen summit, the EU and candidate countries reached a compromiseon agricultural funding. The prospective new members were able to shorten tosix years the EU�s proposed ten-year transition period for farmers to receive fullsubsidies under the common agricultural policy (CAP). The EU, however, willnot supply additional funds beyond its original offer�the new members willhave to come up with these extra resources from their own national budgets.The Hungarian government has already indicated that it intends to provide themaximum subsidies allowed under the final agreement. In the first year ofmembership, the EU will provide farmers from accession countries with 25% ofthe CAP subsidy available to current members, and Hungary will supplementthis with a further 30%. This would bring the total subsidy to Hungarian
Land redistribution
A compromise on CAP
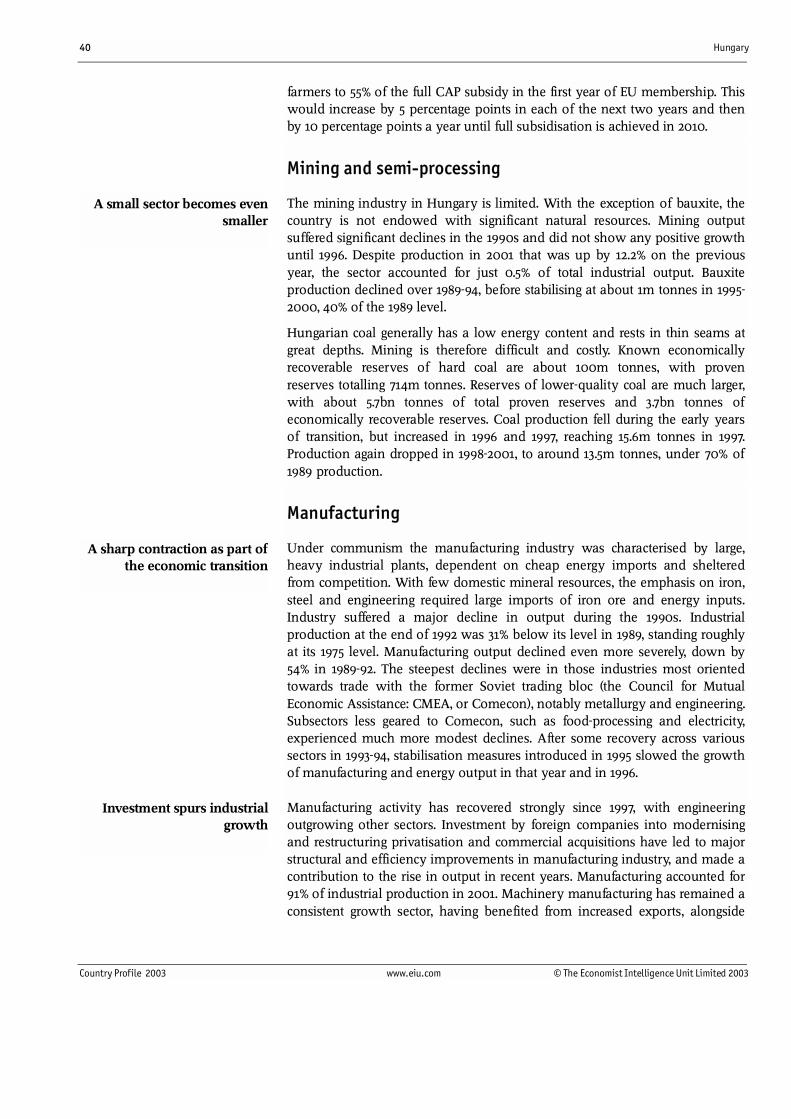
40 Hungary
Country Profile 2003 www.eiu.com © The Economist Intelligence Unit Limited 2003
farmers to 55% of the full CAP subsidy in the first year of EU membership. Thiswould increase by 5 percentage points in each of the next two years and thenby 10 percentage points a year until full subsidisation is achieved in 2010.
Mining and semi-processing
The mining industry in Hungary is limited. With the exception of bauxite, thecountry is not endowed with significant natural resources. Mining outputsuffered significant declines in the 1990s and did not show any positive growthuntil 1996. Despite production in 2001 that was up by 12.2% on the previousyear, the sector accounted for just 0.5% of total industrial output. Bauxiteproduction declined over 1989-94, before stabilising at about 1m tonnes in 1995-2000, 40% of the 1989 level.
Hungarian coal generally has a low energy content and rests in thin seams atgreat depths. Mining is therefore difficult and costly. Known economicallyrecoverable reserves of hard coal are about 100m tonnes, with provenreserves totalling 714m tonnes. Reserves of lower-quality coal are much larger,with about 5.7bn tonnes of total proven reserves and 3.7bn tonnes ofeconomically recoverable reserves. Coal production fell during the early yearsof transition, but increased in 1996 and 1997, reaching 15.6m tonnes in 1997.Production again dropped in 1998-2001, to around 13.5m tonnes, under 70% of1989 production.
Manufacturing
Under communism the manufacturing industry was characterised by large,heavy industrial plants, dependent on cheap energy imports and shelteredfrom competition. With few domestic mineral resources, the emphasis on iron,steel and engineering required large imports of iron ore and energy inputs.Industry suffered a major decline in output during the 1990s. Industrialproduction at the end of 1992 was 31% below its level in 1989, standing roughlyat its 1975 level. Manufacturing output declined even more severely, down by54% in 1989-92. The steepest declines were in those industries most orientedtowards trade with the former Soviet trading bloc (the Council for MutualEconomic Assistance: CMEA, or Comecon), notably metallurgy and engineering.Subsectors less geared to Comecon, such as food-processing and electricity,experienced much more modest declines. After some recovery across varioussectors in 1993-94, stabilisation measures introduced in 1995 slowed the growthof manufacturing and energy output in that year and in 1996.
Manufacturing activity has recovered strongly since 1997, with engineeringoutgrowing other sectors. Investment by foreign companies into modernisingand restructuring privatisation and commercial acquisitions have led to majorstructural and efficiency improvements in manufacturing industry, and made acontribution to the rise in output in recent years. Manufacturing accounted for91% of industrial production in 2001. Machinery manufacturing has remained aconsistent growth sector, having benefited from increased exports, alongside
A small sector becomes evensmaller
A sharp contraction as part ofthe economic transition
Investment spurs industrialgrowth
Hungary 41
© The Economist Intelligence Unit Limited 2003 www.eiu.com Country Profile 2003
chemicals and the food industry. Increases in output were led by subsidiaries ofWestern firms operating in Hungary.
Starting almost from scratch at the beginning of the 1990s, the vehicle manufac-turing sector has become a vital source of foreign investment and now accountsfor 13% of industrial output. Three major greenfield investments account forHungary�s output of passenger cars: Magyar Suzuki, Opel Hungary and AudiHungaria. Audi Hungaria has been the main engine supplier to Germany�sVolkswagen group since 1994, and makes well over 1m engines annually.
With the advent of vehicle manufacturing in Hungary, a thriving network ofsuppliers and components manufacturers has also developed. Car parts salesare an estimated US$1bn annually, and components account for anotherUS$1.5bn. Many suppliers from the EU, the US and Japan have set up shop inHungary. Success stories also include home-grown firms such as Raba�theGyor-based manufacturer was previously known primarily for producingheavy goods vehicles, but moved strongly into components supply and nowaccounts for one-quarter of sectoral sales. North American Bus Industries(NABI) has become a globally recognised bus manufacturer, producingprimarily for the US market.
The future of Hungary�s vehicle manufacturing sector looks bright. Althoughproducers still struggle to find local content�Audi hopes to double its share oflocally sourced parts to 20% over the next three years�competition with thebooming automotive sector in the Czech Republic, a fellow aspirant to EU entry,will limit production and further expansion of Hungary�s supplier network.
Hungary inherited an important pharmaceuticals industry from the communistperiod. The country�s pharmaceutical companies are too small to run researchprogrammes on a scale that can reliably generate new proprietary drugs, andnew competition from Western firms has hit the sector, driving domestic firms�market share down to around 40%. However, the size of the market in Hungarymade the sector an attractive target for foreign investors; five of the six majorpharmaceutical firms are majority foreign-owned. Hungary has become animportant low-cost production base for patented compounds manufacturedunder licence, and high-quality branded generic substitutes for out-of-patentdrugs. Domestic firms have benefited from the liberalisation of the growingover-the-counter market, the retail value of which has tripled since the mid-1990s in US dollar terms. Multinationals have also assigned contract research tolocal companies. Hungary�s pharmaceuticals sector now accounts for morethan 5% of the country�s exports and holds a 2% share in world production.
Chemicals production has undergone rapid rationalisation since privatisation,with two companies�Borsodchem and TVK�emerging as principal rivals insome bulk chemicals markets, while still holding complementary buyer-sellerroles in others. In late 2000 a battle for strategic control of the industry broke outbetween MOL, which had built up a controlling stake in TVK, and its Russiancounterpart, Gazprom, which acquired a similar hold on Borsodchem throughassociated company stakes. Gazprom and its Russian allies have the upper handin being major suppliers of petrochemicals feedstock. Vertical supply-chain links
The car industry
Chemicals andpharmaceuticals

42 Hungary
Country Profile 2003 www.eiu.com © The Economist Intelligence Unit Limited 2003
between Borsodchem and TVK will force them to keep working together despiteparent company rivalries. Chemicals production fell by just over 4% in 2001, butstill accounted for 6.2% of total industrial production.
The availability of comparatively cheap, technically skilled labour and nearbyEU markets has attracted a number of leading electronics and software firms toHungary, and encouraged a large number of domestic start-ups in this area. AnOECD survey from 2000 put Hungary among the countries with a highintensity of information and communications technology in its productionprofile, having measured the relative importance of the sector in employment,value added, research and development (R&D), and trade. Mobile telephonemaker Nokia (Finland) has chosen Budapest for its largest softwaredevelopment centre outside Finland, encouraging similar moves by Ericsson(Sweden) and Motorola (US). Among indigenous firms, specialists such asGraphisoft, which has become the world�s third largest supplier of architecturalsoftware, are generally perceived to have a more stable future than thosecompeting directly with major multinationals. Systems integrator Synergon, themost prominent of these, has had some success as an exporter within theregion, but came under strong pressure from EU- and US-based rivals,especially after the downturn in contracts and investor confidence in 2000-01.Over 95% of information technology (IT) production is exported.
Rising labour costs and a strong forint have raised competitiveness concernsin the midst of the global recession in the IT and telecommunicationsindustry. The efforts of Microsoft (US) to enter the world computer-gamemarket, through the X-Box video console, had been centred on Hungary,through a deal with Singapore-based Flextronics, but this facility was closedin 2002 in favour of locations in China. In the same year IBM (US) closed itsfactory in Szekesfehervar, which in 2001 had accounted for almost 7% ofHungary�s total exports.
Construction
Residential and commercial construction were neglected under communism, atrend that continued through the early 1990s, as neither public nor privatesectors could raise the necessary investment funds. As beneficiaries of liberal-isation began to sink their wealth into property, dwelling construction rose by18% in 1995 and 15% in 1996. However, austerity measures halted this progress,and house completions fell by 28% (to 20,300) in 1998 and 5% (to 19,300) in1999. A key part of the Szechenyi Plan (see The economy) was to acceleratehouse completions to 40,000, which the 1998-2002 government calculated asnecessary to meet demand. This target was still below the 43,800 units built in1990 and the 72,500 built in 1985, but required a significant improvement inavailability and affordability of mortgage loans, so that ordinary householdscould join the �new rich� as buyers of new property. Initial indications are thatthe government�s support for the construction and mortgage sector was havingan effect: production by construction firms rose by 5.8% in 2000 and 10% in2001. Some 60% of the 81,500 construction firms registered at the end of 2000were individual entrepreneurs.
Information andcommunication technology
Hungary 43
© The Economist Intelligence Unit Limited 2003 www.eiu.com Country Profile 2003
Financial services
After an early recapitalisation programme followed by comprehensiveprivatisation that brought in foreign strategic partners, Hungary has one of theregion�s most advanced banking sectors. Competition is intense, with morethan 20 foreign-invested banks competing for new commercial and retailbusiness. This ensures an improving service for borrowers, with increasingnumbers of businesses able to turn to banks for additional capital. It alsomakes further consolidation inevitable, especially with rapidly growingtelephone and Internet banking raising the pressure to close under-usedbranches. The sale by ING (Netherlands) of retail banking interests to Citigroup(US) in 2000, and the merger of the Hungarian operations of ABN-Amro(Netherlands) and KBC (Belgium) in 2001, are the latest steps in this direction.
Hungary began to transform its banking sector in 1987, when the monopoly ofthe National Bank of Hungary (NBH, the central bank) was abolished and atwo-tier system was created. The two main credit sections of the NBH weretransformed into two commercial banks, Hungarian Credit Bank andCommercial and Credit (K&H) Bank. A third major bank, Budapest Bank, wasalso created as a result of these reforms. From 1989 all banks were allowed tohandle all areas of banking including foreign exchange, which had until thenremained a monopoly of the NBH. An interbank foreign-exchange market wasintroduced in 1992. Additional reforms of the banking sector introduced in 1992included the incorporation of Bank for International Settlements (BIS)guidelines and the requirement of an 8% capital-adequacy ratio. Furtherrestructuring of the banking system took place in 1994, as the governmentrecapitalised the banks through a combination of enlarged equity positions andsubordinated loans.
These successful consolidation attempts paved the way for the privatisation ofthe major banks. This was virtually complete by the end of 1996. The state stillretains a large minority share in the largest bank, National Savings Bank (OTP),and is in the process of selling a number of medium-sized and smaller banks,as well as Postabank, which it had to bail out, at an eventual cost of Ft153bn(US$800m), after a run on its deposits in March 1997. The trend of decliningstate shareholdings has been accompanied by a corresponding increase inforeign ownership, from 14.9% in 1994 to 67.6% by 2000.
Improved legal regulation and foreign banks� presence has greatly improvedsector competitiveness. As of January 1st 1997 banks were allowed to trade ingovernment securities. Reserve requirements were reduced to an EU-comparable 7% (from 11%) in early 2001. Competition is becoming more focusedon the provision of services to retail customers, with developing credit card andpersonal loan segments. OTP, sold in stages to institutional investors between1995 and 1999, has also emerged as the strongest bank financially. This mainlyreflects its avoidance of politically directed industrial lending before the reformsand its rapid adoption of new techniques and technologies since. Havingresisted political pressure to take over Postabank, OTP is now in the midst ofinternational expansion plans.
Substantial foreign ownership
Slow but sure restructuring
44 Hungary
Country Profile 2003 www.eiu.com © The Economist Intelligence Unit Limited 2003
Hungary has developed a competitive insurance sector with the participationof many large foreign companies. Allami (owned by Aegen) is the largestinsurer. Allianz (Germany) holds a dominant stake in Hungaria Insurance.Hermes Kreditversicherung, also of Germany, is in a consortium with Frenchand Austrian partners. Generali (Italy) also has a strong presence. The change inthe pension system to allow private pension funds presents a number of newopportunities for insurance and other financial companies.
Hungarian public debt is issued and managed by the Government DebtManagement Agency (AKK). The central state budget and the social securityfunds finance their deficits through the AKK. The domestic bond marketcontinues to be dominated by government securities. Maturities have beensteadily extended, with the AKK introducing a 15-year bond in November 2001,but Treasury bills of up to one year in maturity still predominate. Corporatebond issues remain scarce and mainly take the form of floating bonds issuedby foreign-owned companies backed by parent companies. Non-residentinvestors may purchase government bills or bonds with a maturity at issue ofone year or greater.
The Budapest Stock Exchange (BSE) was reopened on June 21st 1990, with sharetrading for eight major companies. The stockmarket boomed in 1996 and 1997,with some of the fastest growth rates among emerging markets. On April 23rd1998 the index reached an all-time high of 9,016, up by 12.7% from end-1997.After more than a year in the doldrums following the Russian crisis of August1998, which hit emerging markets generally and especially those centralEuropean markets regarded as having links with Russia, the BSE came back intofavour among emerging-market investors. Foreigners account for the bulk ofactive trading on the BSE (more than 50%, compared with 30% in Warsaw),which accounts for the great volatility in the market in the wake of the Russiancrisis and the exchange�s general vulnerability to international marketsentiment. Non-resident foreigners held 72% of the value of listed companies.
The BSE�s recovery since 1999 has been uneven. Equity prices started revivingtowards the end of that year, but after a boom in early 2000 (with the BUXindex closing at a record 10,493 on March 10th) the general trend was againdownwards, as investors became more pessimistic about the telecommun-ications, pharmaceutical and financial stocks that dominate the index. Equitytrading volumes (which account for 85% of the exchange�s business) haveremained low, at a total of Ft3,027bn for 2002, compared with aroundFt6,800bn in 1999-2000; the number of equities transactions fell by 20% in2002 after a fall of 59% in 2001. The number of quoted shares peaked at 66 in1999, but had fallen to 48 by the end of 2002. The BSE�s total average dailyturnover in 2001 was Ft14.8bn from 2,967 transactions�both roughly 45% oftheir 2000 levels. The BSE�s total capitalisation was equivalent to 50% of GDP atthe end of 2002, with equities worth around 20% of GDP. Low liquidity,compounded by loss of listings as older companies are acquired bymultinationals and new ones float internationally, has forced the BSE to discussalliances with other exchanges, notably London.
The bond market
The equity market
A competitive insurance sector

Hungary 45
© The Economist Intelligence Unit Limited 2003 www.eiu.com Country Profile 2003
Other services
Tourism generates at least 5% of GDP and is estimated to have added a positivebalance of US$3.2bn to the current account in 2002. When unofficial dealingswith tourists (such as private room rental) and the indirect impact of the sectorare taken into account, some calculations put tourism�s contribution as high as12% of GDP. Using these calculations, one in eight Hungarian workers isemployed in the travel and tourism industry. Tourism appears again to havemade a significant contribution to the economy in 2001, despite the generallyunfavourable international climate by the end of the year. Hotel occupancyrates and the number of tourist nights held virtually steady from 2000.
Hungary has not only been seeing rising visitor numbers but also, moreimportantly, higher spending per tourist. Government and major traveloperators are working together to shed Hungary�s earlier image as a budgetalternative to EU destinations, so as to continue to attract more higher-incomevisitors and extract more expenditure from them. Upgrading of tourismfacilities and the development of specialist attractions such as spa tourism are akey part of the Szechenyi Plan. Budapest and Lake Balaton are the leadingdestinations for foreign visitors. Modern hotels, a conference centre andattractive prices have helped the capital to become a major location forinternational conferences.
The external sector
Trade in goods
Foreign trade by commodity group, 2002Exports (fob) Imports (cif) Balance
US$ m % changea US$ m % changea (US$ m)Food, beverages & tobacco 2,337.3 2.1 1,132.9 15.5 1,204.4Raw materials 691.8 14.3 751.9 10.7 -60.1
Fuels & electricity 562.7 -4.8 2,810.6 1.7 -2,247.9Processed goods 10,560.6 11.7 13,345.4 12.2 -2,784.8Machinery & equipment 20,184.2 15.0 19,571.1 12.7 613.1
Total 34,336.6 12.6 37,611.9 11.7 -3,275.3
a Year on year.
Source: Central Statistical Office (KSH).
Hungary is an open economy, with trade (exports and imports of goods andservices) accounting for around 130% of GDP. Rapid industrial transformationhas substantially altered the composition of exports, more than half of which(by value) are now of machinery and equipment, with electrical goods makingup around one-quarter. Import composition has adjusted to reflect this, withrising imports of raw and semi-processed materials. Exports have consistentlyoutgrown imports over recent years and were the main force behind the strongeconomic recovery. Tourism has been the most dynamic service export, butthere has been success in domestic substitution of service imports, especially offinancial and business services. The government is now working to reduce the
Tourism upgrades supporteconomy
46 Hungary
Country Profile 2003 www.eiu.com © The Economist Intelligence Unit Limited 2003
comparatively large proportion of exports derived from regions and sectorsenjoying tax concessions, many of which must be phased out to satisfy EUentry requirements.
Until 1992 the trade balance was largely neutral, but from 1993 the balance onthe trade and current accounts became negative. The dramatic deterioration inthe trade balance in 1993-94�deficits averaged around US$4bn�was a result ofa precipitate decline in exports at a time when imports continued to increaserapidly. The increase in the external deficit was instrumental in thegovernment�s decision to introduce the Bokros stabilisation package, whichincluded import controls, in 1995 (see The economy). This, combined withstrong export growth, resulted in a narrowing of the trade deficit to aboutUS$1.5bn in 1995 and a stabilisation thereafter, except for an upturn caused byhigher imported fuel prices in 2000. In 2001-02 the trade deficit narrowed, toUS$2.1bn in 2002, helped by lower oil prices in late 2001 and early 2002 andthe strength of the forint and euro versus the US dollar�most of Hungary�simports are denominated in US dollars, whereas exports are mostly in euro.
Main trading partners, 2002(% of total value, in forint terms)
Exports to: Imports from:Germany 35.5 Germany 24.3Austria 7.1 Italy 7.5
Italy 5.8 Austria 6.9France 5.7 Russia 6.1
UK 4.7 France 4.8Sweden 4.3 Japan 4.2Netherlands 4.3 US 3.7
Source: KSH.
Foreign trade has been substantially redirected towards Western markets since1991. EU partners accounted for almost three-quarters of exports and 58% ofimports in 2001. Exports to EU countries in 2001 increased by 7.3% year on yearin US dollar terms, and EU imports grew by 3.8%. Germany is the country�smost important trading partner, accounting for 35.6% of exports and one-quarterof imports in 2001. Austria and Italy are also important trading partners. Russiais a key import source; its place in Hungary�s overall ranking tends to vary withthe price of oil.
Food remains an important component of exports, but its share in the total hasfallen below 8%. The composition of foreign trade has been transformedduring the economic transition. Apparel and clothing accessories, automobileparts, and machinery and equipment have become important exports, withthe re-export of processed imports playing a particularly important part inthese categories.
Hungary has taken a number of steps to promote exports. In accordance withan agreement with the OECD, there are officially supported export credits.Certain interest subsidies to small and medium-sized enterprises (SMEs) may ineffect result in export subsidies. Import duties may be reclaimed byre-exporters, although agreements with the EU and the Central European Free-Trade Agreement (CEFTA) have limited this practice since July 1st 1997. The
Hungary 47
© The Economist Intelligence Unit Limited 2003 www.eiu.com Country Profile 2003
export of a number of agricultural products and food items is also subsidised,and Hungary ended its 11-year membership of the Cairns group of the WorldTrade Organisation (WTO) because of its opposition to further subsidyreduction. In October 1997 the WTO agreed to allow Hungary to supportagricultural exports directly until 2002, ending a two-year dispute.
Hungary started early on trade liberalisation, but proceeded at a moremeasured pace than most other countries in the region. The 8% importsurcharge introduced in March 1995 was eliminated in July 1997. The EUassociation agreement and membership of the WTO limit the scope foradopting protectionist measures. The Customs Law and the Customs Tariff Act,which both came into force in April 1996, brought 70% of Hungarian customsregulations into line with those of the EU. Tariff harmonisation with the EU isnow complete, with industrial trade fully liberalised from January 1st 2001.
Invisibles and the current account
The current account was in deficit throughout the 1980s, with the exception of1983-84. The deficit reached crisis proportions in 1989, when interest paymentscombined with a deterioration in the tourism account to produce a deficit ofalmost US$600m (2% of GDP), a small sum by the standards of today but anunmanageable burden at the time. In 1990-92 the current-account balance waspositive, thanks to positive trade balances in 1990-91 and positive services andincomes balances in 1992. By 1993 the trade deficit reached US$4bn,contributing to a current-account deficit of US$4.3bn. A current-account deficitof US$4.1bn in 1994 provided the context for the introduction of the 1995stabilisation programme. As a result of reforms, the current-account deficit wasreduced to US$1.6bn in 1995 and US$1.2bn in 1996. A substantial improvementin 1997, to a deficit of US$656m, resulted from a reduction in the trade deficit.The current-account deficit increased substantially in 1998, to US$2.2bn, as aresult of a US$500m worsening of the trade deficit component and an erosionof the services and income component.
In early 2003 the National Bank of Hungary, (NBH, the central bank) revised itscurrent-account data for 1995-2002 to include methodological changes and toincorporate customs trade data provided by the Central Statistical Authority(KSH) in place of the bank�s traditional balance-of-payments method. Thiscaused the deficit for 2002 to be lower than originally anticipated, with thetrade deficit actually shrinking in US dollar terms. However, for most previousyears the new methodology resulted in a widening of the current-accountdeficit. In particular, the data for 1999-2000 showed a deterioration wherebefore there had been a steady improvement, with the current-account balancereaching US$2.9m in 2000, or 6.2% of GDP. Despite an improved tourismsurplus and a lower investment-income deficit, the trade gap widened byUS$800m. The worsening global economic environment has had little impacton the overall trade deficit, which has continued to shrink, but it has greatlyaffected Hungary�s tourism industry�tourism accounts for over half of allservices credits�with the services surplus cut by more than half in 2002. Lowermargins in home markets have also resulted in a higher repatriation rate by
The current account improves
NBH makes changes tomethodology

48 Hungary
Country Profile 2003 www.eiu.com © The Economist Intelligence Unit Limited 2003
foreign-owned companies, causing the income deficit to expand. In 2002, thiscaused the current-account to reach US$2.6bn, or 4% of GDP.
Current account, 2002(US$ m)
Merchandise exports fob 34,832
Merchandise imports fob -36,917Trade balance -2,084Net services 602
Net income -1,588Net transfers 456
Current-account balance -2,615
Note. Based on preliminary euro figures.
Source: National Bank of Hungary.
Capital flows and foreign debt
Hungary entered transition with the heaviest foreign debt burden in centralEurope. The external debt declined in the early 1990s, but rose again with thedramatic increase in current-account deficits in 1993-94, to reach US$31.6bn (71%of GDP) at the end of 1995. Unlike Poland, Hungary did not default so did notsecure a reduction and rescheduling from creditors. As a result, external debtwas still more than 60% of GDP in 1998, compared with less than 44% forPoland and less than 10% for the Czech Republic. Falling interest rates and agrowing domestic investor base have allowed extensive repayment of foreign-currency with forint-denominated debt, with external debt levels remainingremarkably steady at around US$29bn in 1998-2002. As a result, debt/GDPratios and debt-servicing as a percentage of total exports have declinedprecipitously. In 2002, aided by the weakening of the US dollar versus both theeuro and forint, total external debt was less than 45% of GDP.
Lower servicing costs, achieved through better credit ratings and internationalinterest-rate cuts, have been a major factor in the falling debt burden. In 2002the debt-service ratio fell to an estimated 15.8%. More than 80% of medium- andlong-term debt is owed to commercial creditors. Although the major share ofthe debt is owed by the NBH and the government, the share of non-guaranteedprivate debt has been increasing rapidly. The share of short-term debt has fallensteadily since the 1980s, and was estimated by the Economist Intelligence Unitat about 14% of the total external debt stock at end-2002.
Hungary has been one of the most accommodating countries in eastern Europefor foreign investors. Until recently, no other country has been as prepared tosell majority stakes in sensitive sectors, such as banking or energy, to foreigninvestors. The free repatriation of after-tax profit and capital is guaranteed. Noindustrial or service sectors are entirely off-limits to foreign investment, butforeigners are formally barred from buying farmland. Some areas, such asdefence, transport, telecommunications, pipelines, electric power and gambling,can be entered only under the terms of a specific concession. Majorinvestments in banking, securities trading and insurance are also subject togovernment approval.
Containing the debt
A regional leader in FDI

Hungary 49
© The Economist Intelligence Unit Limited 2003 www.eiu.com Country Profile 2003
Many of the earlier incentives have been phased out. Those remaining apply todomestic and foreign companies. They include an investment tax preference of50% (100% in priority areas), subject to the value and value added of exportsproduced, and a reduction based on a percentage of future taxes to be paid,subject to the share capital invested, environmental factors and exportpotential. These tax incentives are being phased out to comply with EU norms,although most companies that had already received preferences are no worseoff. There are also certain beneficial deduction and depreciation allowances forplant and machinery, as well as tax preferences for offshore companiesregistered in Hungary. Companies operating in free-trade zones are exempt fromcustoms and indirect taxes. Tax holidays are available for investments in thedepressed east of the country. According to the IMF, Hungary grants the mosttax and import duty allowances for greenfield projects in the region.
Hungary lost its regional lead to Poland in 1997 in terms of absolute inflows offoreign direct investment (FDI), and was surpassed by the Czech Republic in2002. However, Hungary remains far ahead of Poland on a per-capita basis,with a stock of inward FDI of US$2,327 per head in 2002, compared with anestimated US$1,212 for Poland. It has fallen behind the Czech Republic on a per-capita basis. The exceptional US$4.5bn inflow Hungary recorded in 1995resulted from large foreign investments in various utility privatisations. As theprivatisation programme comes to an end, FDI has fallen, with inflows fallingto US$1.6bn in 2000. Despite the sharp decline in global foreign investment in2001, inflows of FDI into Hungary actually reached a six-year high of US$2.4bn,before shrinking to less than US$1bn. Although FDI is expected to stay aboveUS$2bn in the medium term, it will increasingly depend on greenfield andfollow-on investment rather than privatisations.
A decline in FDI in 2002 could be expected, given the exhaustion of largeprivatisation opportunities, and the general slowdown in crossborder capitalflows to emerging markets during 2001-02. However, it also reflects the longer-term loss of appeal to foreign investors of a country whose real wage rateshave recently outgrown productivity, and whose business environment is nowsuffering from the curtailment in the 1990s of public investment in education,training, transport, housing and other infrastructures.
Foreign reserves and the exchange rate
Largely as a result of foreign debt payments, Hungary�s foreign-exchangereserves (excluding gold) declined during the 1990s. However, the NBH hadrebuilt them to US$11bn at end-2000, largely as a result of foreign-currencypurchases needed to keep the forint within its narrow exchange-rate band priorto May 2001. Reserves fell gradually over the next two years, to US$10.4bn in2002. Gold reserves decreased from a high of US$45m at end-1993 to US$28m atend-2002.
An essential element of the 1995 stabilisation programme was a one-offdevaluation of the forint, followed by the introduction of a crawling-peg regimeutilising narrow fluctuation bands. The policy was designed to stabilise thecurrency and serve as a nominal anchor, protecting it against speculative attack.
Reserves have been falling
The crawling-peg regime

50 Hungary
Country Profile 2003 www.eiu.com © The Economist Intelligence Unit Limited 2003
Successive reductions in the crawling-peg devaluation rate, from its initial 1.8%per month to 0.2% on April 1st 2001, maintained a gradual real appreciation ofthe currency, helping to discipline inflation without endangering trade-sectorcompetitiveness.
The narrow-band policy was relaxed in May 2001, when the forint�s permittedvariation around its central euro rate was widened to ±15% from ±2.25%.Recognising that it cannot fine-tune the exchange rate now that monetarypolicy is targeted at inflation, the NBH abandoned the crawling-peg currencysystem from October 1st 2001. The NBH is now to indicate a rough exchange-rate goal compatible with its overriding inflation target (see The economy:economic policy).
The forint has been convertible in current-account transactions since January 1st1996. Inbound long-term capital-account transactions are basically unrestricted.Hungary undertook to phase out remaining restrictions on capital flows whenit joined the OECD in March 1996. Further steps towards full convertibility weretaken at the beginning of 1998, when trade in investment-grade securities fromOECD countries, including participation in investment funds, was liberalised.Foreigners were allowed to invest without limit in Hungarian open-endedfunds. Hungarians were given the right to buy real estate abroad withoutrestriction (barring a reporting requirement). Greater restrictions apply tooutbound capital-account transactions and to short-term inflows.
Fluctuation bands widenbefore forint is floated

Hungary 51
© The Economist Intelligence Unit Limited 2003 www.eiu.com Country Profile 2003
Appendices
Membership of regional organisations
The Central European Free-Trade Agreement (CEFTA) was signed in December1992 by Hungary, Poland, the Czech Republic and Slovakia. They were joined bySlovenia in 1996, Romania in 1997, Bulgaria in 1998, and Croatia in 2003. TheBaltic states, Macedonia and even Russia and Ukraine have expressed interest inCEFTA membership. The initial impetus for setting up CEFTA was to counteractthe collapse in inter-regional trade after the Council for Mutual EconomicAssistance (CMEA, or Comecon) trading system was abolished. The signatoriescommitted themselves to the �gradual introduction of a free-trade area�.
Trade in industrial products among CEFTA members, now a market of almost90m people, was fully liberalised on January 1st 2000, with the exception ofthe export of cars to Poland, which was liberalised on January 1st 2002.However, trade in agricultural goods remains subject to barriers, which in somecases have been increased. Nonetheless, CEFTA has enabled its members torestore trade links severed in the early 1990s. CEFTA membership also hassignificant symbolic political features. As all the members are candidates for EUmembership, CEFTA membership has become a symbol of belonging to theadvance guard of the transition. CEFTA members must already have anassociation agreement with the EU.
The Central European Initiative (CEI), originally known as the Quadragonale,was established in 1989 by Austria, Hungary, Italy and the Socialist FederalRepublic of Yugoslavia (SFRY). Membership has since risen to 16 and from 1992the organisation has been known under its present name. The current membersare: Austria (1989), Italy (1989), Hungary (1989), Poland (1991), Croatia (1992),Slovenia (1992), Bosnia-Hercegovina (BiH; 1992), Macedonia (1992), the CzechRepublic (1993), Slovakia (1993), Albania (1996), Belarus (1996), Bulgaria (1996),Moldova (1996), Romania (1996), Ukraine (1996) and then Yugoslavia (nowSerbia and Montenegro, 2000). The CEI, which aims to promote pan-Europeanintegration and co-operation, provides its members with a flexible and notoverly institutionalised forum to discuss important regional issues.
CEI activities are agreed at annual meetings of prime ministers and foreignministers. The activities of the organisation have evolved over the past tenyears. Initial goals included improving regional co-operation between theformer communist bloc and western Europe, supporting the transition process,and assistance in preparing infrastructure and commercial developmentprojects. In recent years the CEI�s focus has shifted to assisting EU enlargement,in co-operation with the European Bank for Reconstruction and Development(EBRD) and the EU.
The European Bank for Reconstruction and Development (EBRD) was set up in1991 to help finance the development of central and eastern Europe after thefall of communism. By contrast with most other multilateral organisationsinvolved in the region, the EBRD�s mandate compelled it to focus on the private
Central European Free-TradeAgreement
Central European Initiative
EBRD
52 Hungary
Country Profile 2003 www.eiu.com © The Economist Intelligence Unit Limited 2003
sector, as it was allowed to commit no more than 40% of its funds to public-sector projects. It received an initial capital of Ecu10bn (US$12bn at 1991 averageexchange rates), which was doubled in 1997. The EBRD initially found it difficultto carve out a niche for itself, and was in its early years beset by scandals and aleadership crisis. Although it recovered from these, in 1998 the Russian financialcrisis resulted in heavy losses for the Bank. Russia has been the EBRD�s largestclient, accounting for one-fifth of all funding in 1991-2000.
Nevertheless, over the past decade the EBRD has invested substantial sums inthe region and has helped to encourage private-sector investors. By 2000 it hadrecovered from its 1998 losses, and by the end of 2000 had disbursed �12.1bn(US$11.5bn) of its �20bn capital, of which �1.2bn went to Hungary. If co-financing from other lenders and the private sector is added, the EBRD hasbeen responsible for investment worth US$3.5bn into Hungary. The Bank�sclientele has grown from just a handful of transition countries in the early1990s to 27 countries today, with Yugoslavia (now Serbia-Montenegro) being themost recent addition to the Bank�s list of potential beneficiaries. The EBRD hasfunded hundreds of projects, ranging from bank privatisation to roadbuilding.
The US has long wanted the Bank to shift its focus further east from the moreadvanced countries of east-central Europe to the Commonwealth ofIndependent States (CIS) and the Balkans. The east-central European countriesare seen to have �graduated�, to be able to rely on private-sector finance and tono longer need the EBRD�s support. However, west European governmentswant the Bank to stay engaged in central Europe and help these countries toprepare for EU accession. The EBRD was to boost its annual lending from�2.7bn in 2000 to �3.5bn in 2001 and thereafter. Whereas funding of theadvanced EU accession candidates is to remain constant, at around �1bn peryear, most new business will be directed to the CIS and the Balkans, where theBank has had trouble in the past in finding viable investment projects.
Initially a non-institutionalised multilateral forum for Cold War east-westdialogue, the Conference for Security and Co-operation in Europe (CSCE)gradually expanded in aim and strengthened its organisational structure in the1990s. Established in 1972, the CSCE served for almost twenty years as aconvenient and flexible arrangement for easing Cold War tensions. After theend of the Cold War the role of the CSCE started to change quickly, and inDecember 1994 the conference was officially renamed the Organisation forSecurity and Co-operation in Europe (OSCE). With 55 member states, the OSCEis the only inclusive pan-European security organisation. Canada and the USare also members of the organisation.
The OSCE has played a key role in conflict prevention and resolution, as wellas post-conflict reconstruction in Europe. Its activities embrace threedimensions: security, economy, and human rights. The OSCE is engaged inpreventive diplomacy, arms control and confidence-building activities. Itundertakes fact-finding and conciliation missions and crisis management. TheOSCE is a component of the European security architecture. It is a �regionalarrangement� in the sense of Chapter VIII of the UN Charter, which gives itauthority to try to resolve a conflict in the region before referring it to the UN
Organisation for Security andCo-operation in Europe
Hungary 53
© The Economist Intelligence Unit Limited 2003 www.eiu.com Country Profile 2003
Security Council. In the course of the 1990s the OSCE has been heavilyinvolved in the Balkans and the Transcaucasus.
The activities of the OSCE are performed by a web of specialised agencies. TheHigh Commissioner on National Minorities, based in The Hague, is the primarysource of �early warning�, with responsibility for identifying ethnic tensions thatmight endanger peace. The Office for Democratic Institutions and Human Rights(ODIHR), based in Warsaw, focuses on promoting human rights, democracy andthe rule of law. It monitors elections, assists at developing national electoral andlegal institutions, promotes the development of non-governmental organisations(NGOs) and civil society, and conducts meetings, seminars and special projects.The Office of the Representative on Freedom of the Media, based in Vienna,assesses the implementation of the member states� commitments concerningfreedom of journalism, broadcasting and access to information.
Sources of information
The Hungarian Central Statistical Office (KSH) has a deserved reputation as aprofessional organisation producing quality statistics and data. It is the mainsource of non-monetary statistics on the Hungarian economy. The KSHproduces a number of quality products, including the Statistical Yearbook andthe Monthly Bulletin of Statistics. These are produced in Hungarian and English.The yearbook is a 600-page volume with detailed economic data on mostareas; however, its timeliness could be improved.
The National Bank of Hungary (NBH, the central bank) publishes annual andmonthly reports that provide timely macroeconomic data and detailedfinancial statistics, as well as a commentary on domestic and external trends.
Budapest Business Journal is an English-language weekly providing businessnews and limited statistical data. A Hungarian-language newspaper, Figyelo,provides a comprehensive weekly review of economic activities. A daily,Vilaggazdasag, provides the best economics coverage.
The IMF, the World Bank and the OECD are the main international sources ofstatistics on the Hungarian economy.
IMF, International Financial Statistics (monthly)
OECD, Main Economic Indicators; Economic Survey of Hungary 1996-97 and2000-2001
World Bank, World Development Indicators; Trends in Developing Economies;Global Development Finance (formerly World Debt Tables)
David L Bartlett, The Political Economy of Dual Transformation: Market Reformand Democratisation in Hungary, University of Michigan Press, Ann Arbor, 1997.A detailed account of the economic and political transition in Hungary
Andras Gero, Modern Hungarian Society in the Making, Central EuropeanUniversity Press, Budapest and London, 1995. A historical insight into Hungaryin the 20th century
National statistics sources
International statistical sources
Select bibliography
54 Hungary
Country Profile 2003 www.eiu.com © The Economist Intelligence Unit Limited 2003
Nigel Swain, Hungary: the Rise and Fall of Feasible Socialism, Verso, London andNew York, 1992. An assessment of the failures of the socialist economic project,with a good historical overview of socialist economic policy
Rudolf Tokes, Hungary�s Negotiated Revolution: Economic Reform, Social Change,and Political Succession, 1957-1990, Cambridge University Press, Cambridge andNew York, 1996. An overview of the economic and political changes inHungary from the aftermath of the 1956 revolution to the end of communism
Andras Torok, Budapest: A Critical Guide, Corvin, Budapest, 1997. Thissecond revised edition of the best guidebook to the city is full of valuablecultural insights
The Hungarian government website provides information on governmentprocedures and responsibilities, and links to government ministries,departments and agencies: http//www.meh.hu (in Hungarian and English)
The KSH website provides latest monthly and quarterly data releases. Historicaland annual data are available in a searchable database on a subscription basis.There is little accompanying analysis, access is sometimes slow and navigationoften difficult: http//www.ksh.hu (in Hungarian and English)
The NBH website has a range of up-to-date statistical data, publications andcommentary, although it tends to be factual rather than analytical in nature.Recent changes have made navigation relatively simple: http//www.mnb.hu (inHungarian and English)
Reference tables
Reference table 1
Population1998 1999 2000 2001 2002
End-year population (m)a 10.09 10.04 10.01 10.18 10.15Annual growth (%) -0.4 -0.5 -0.4 n/a -0.3
Birth rate (per 1,000 population) 9.6 9.4 9.7 9.5 9.5Death rate (per 1,000 population) 13.9 14.2 13.5 13.0 13.1Rate of natural increase (per
1,000 population) -4.3 -4.8 -3.8 -3.4 -3.5
a Break in series after 2000 as a result of the 2001 census.
Source: Central Statistical Office (KSH), Monthly Bulletin of Statistics.
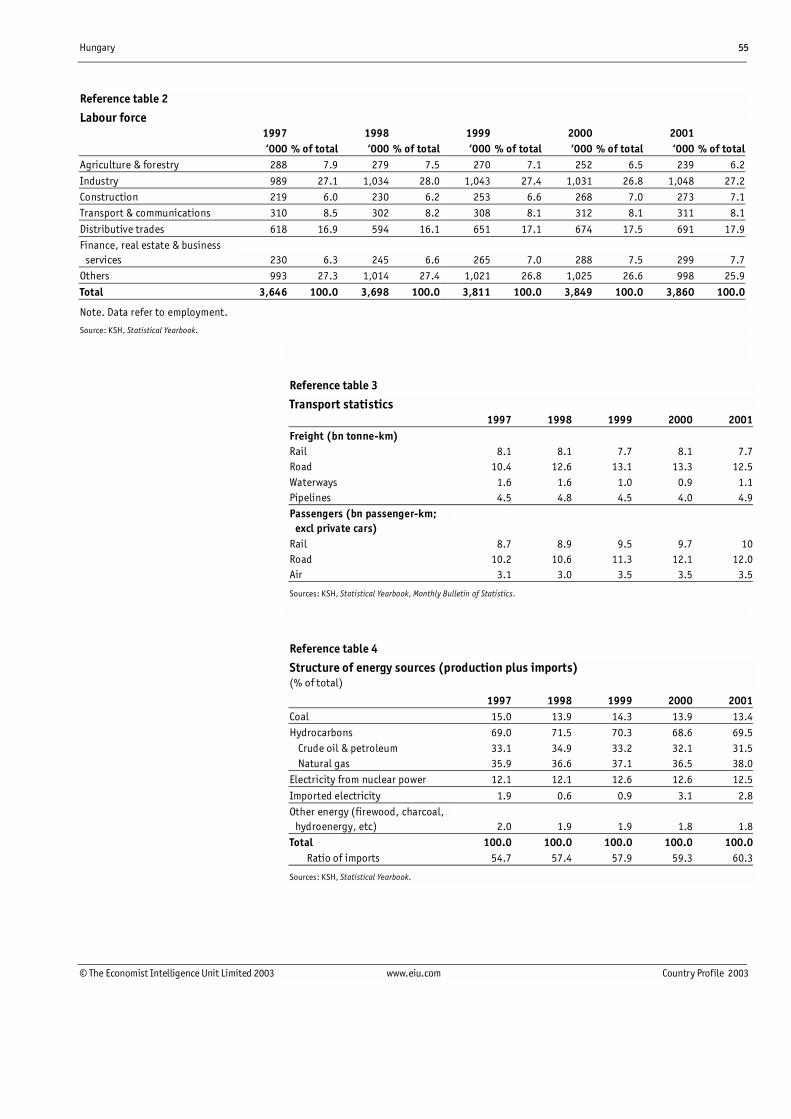
Hungary 55
© The Economist Intelligence Unit Limited 2003 www.eiu.com Country Profile 2003
Reference table 2
Labour force1997 1998 1999 2000 2001�000 % of total �000 % of total �000 % of total �000 % of total �000 % of total
Agriculture & forestry 288 7.9 279 7.5 270 7.1 252 6.5 239 6.2
Industry 989 27.1 1,034 28.0 1,043 27.4 1,031 26.8 1,048 27.2Construction 219 6.0 230 6.2 253 6.6 268 7.0 273 7.1Transport & communications 310 8.5 302 8.2 308 8.1 312 8.1 311 8.1
Distributive trades 618 16.9 594 16.1 651 17.1 674 17.5 691 17.9Finance, real estate & business
services 230 6.3 245 6.6 265 7.0 288 7.5 299 7.7Others 993 27.3 1,014 27.4 1,021 26.8 1,025 26.6 998 25.9
Total 3,646 100.0 3,698 100.0 3,811 100.0 3,849 100.0 3,860 100.0
Note. Data refer to employment.
Source: KSH, Statistical Yearbook.
Reference table 3
Transport statistics1997 1998 1999 2000 2001
Freight (bn tonne-km)Rail 8.1 8.1 7.7 8.1 7.7Road 10.4 12.6 13.1 13.3 12.5Waterways 1.6 1.6 1.0 0.9 1.1Pipelines 4.5 4.8 4.5 4.0 4.9Passengers (bn passenger-km;
excl private cars)Rail 8.7 8.9 9.5 9.7 10Road 10.2 10.6 11.3 12.1 12.0Air 3.1 3.0 3.5 3.5 3.5
Sources: KSH, Statistical Yearbook, Monthly Bulletin of Statistics.
Reference table 4
Structure of energy sources (production plus imports)(% of total)
1997 1998 1999 2000 2001Coal 15.0 13.9 14.3 13.9 13.4Hydrocarbons 69.0 71.5 70.3 68.6 69.5 Crude oil & petroleum 33.1 34.9 33.2 32.1 31.5 Natural gas 35.9 36.6 37.1 36.5 38.0Electricity from nuclear power 12.1 12.1 12.6 12.6 12.5
Imported electricity 1.9 0.6 0.9 3.1 2.8Other energy (firewood, charcoal,
hydroenergy, etc) 2.0 1.9 1.9 1.8 1.8Total 100.0 100.0 100.0 100.0 100.0 Ratio of imports 54.7 57.4 57.9 59.3 60.3
Sources: KSH, Statistical Yearbook.
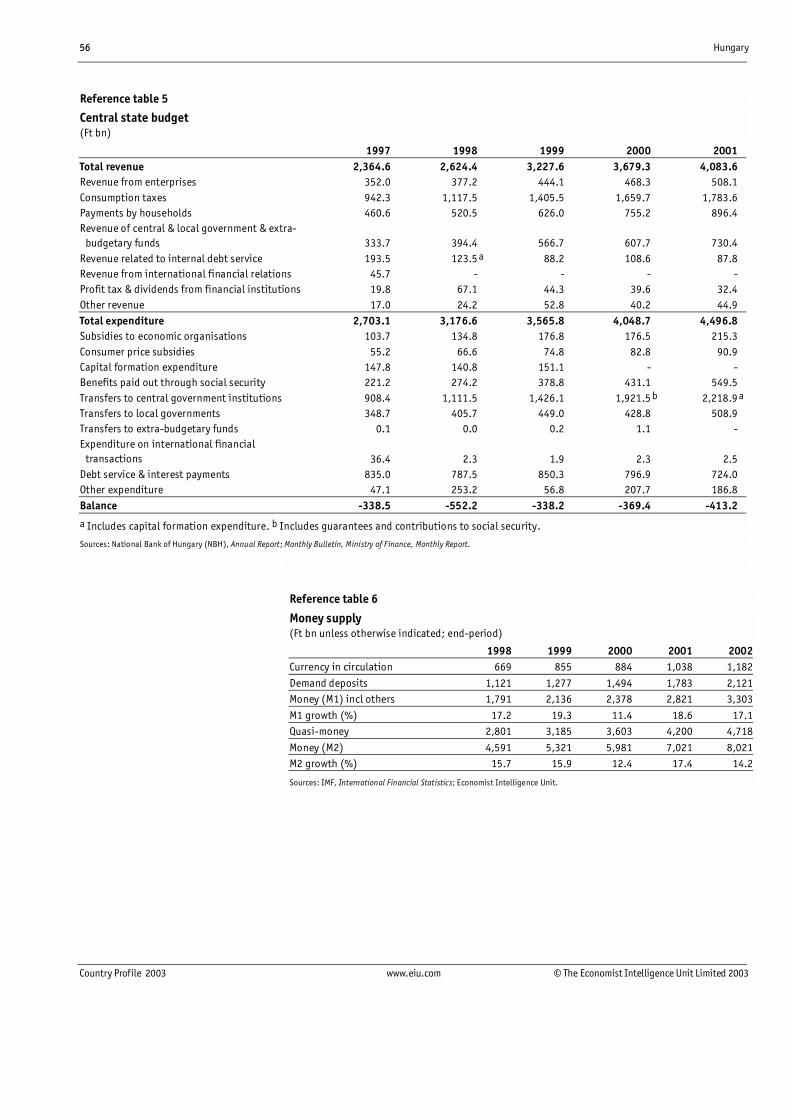
56 Hungary
Country Profile 2003 www.eiu.com © The Economist Intelligence Unit Limited 2003
Reference table 5
Central state budget(Ft bn)
1997 1998 1999 2000 2001Total revenue 2,364.6 2,624.4 3,227.6 3,679.3 4,083.6Revenue from enterprises 352.0 377.2 444.1 468.3 508.1Consumption taxes 942.3 1,117.5 1,405.5 1,659.7 1,783.6Payments by households 460.6 520.5 626.0 755.2 896.4Revenue of central & local government & extra-
budgetary funds 333.7 394.4 566.7 607.7 730.4Revenue related to internal debt service 193.5 123.5 a 88.2 108.6 87.8Revenue from international financial relations 45.7 - - - -Profit tax & dividends from financial institutions 19.8 67.1 44.3 39.6 32.4Other revenue 17.0 24.2 52.8 40.2 44.9Total expenditure 2,703.1 3,176.6 3,565.8 4,048.7 4,496.8Subsidies to economic organisations 103.7 134.8 176.8 176.5 215.3Consumer price subsidies 55.2 66.6 74.8 82.8 90.9Capital formation expenditure 147.8 140.8 151.1 - -Benefits paid out through social security 221.2 274.2 378.8 431.1 549.5Transfers to central government institutions 908.4 1,111.5 1,426.1 1,921.5 b 2,218.9 a
Transfers to local governments 348.7 405.7 449.0 428.8 508.9Transfers to extra-budgetary funds 0.1 0.0 0.2 1.1 -Expenditure on international financial
transactions 36.4 2.3 1.9 2.3 2.5Debt service & interest payments 835.0 787.5 850.3 796.9 724.0Other expenditure 47.1 253.2 56.8 207.7 186.8Balance -338.5 -552.2 -338.2 -369.4 -413.2
a Includes capital formation expenditure. b Includes guarantees and contributions to social security.
Sources: National Bank of Hungary (NBH), Annual Report; Monthly Bulletin, Ministry of Finance, Monthly Report.
Reference table 6
Money supply(Ft bn unless otherwise indicated; end-period)
1998 1999 2000 2001 2002Currency in circulation 669 855 884 1,038 1,182
Demand deposits 1,121 1,277 1,494 1,783 2,121Money (M1) incl others 1,791 2,136 2,378 2,821 3,303
M1 growth (%) 17.2 19.3 11.4 18.6 17.1Quasi-money 2,801 3,185 3,603 4,200 4,718
Money (M2) 4,591 5,321 5,981 7,021 8,021M2 growth (%) 15.7 15.9 12.4 17.4 14.2
Sources: IMF, International Financial Statistics; Economist Intelligence Unit.
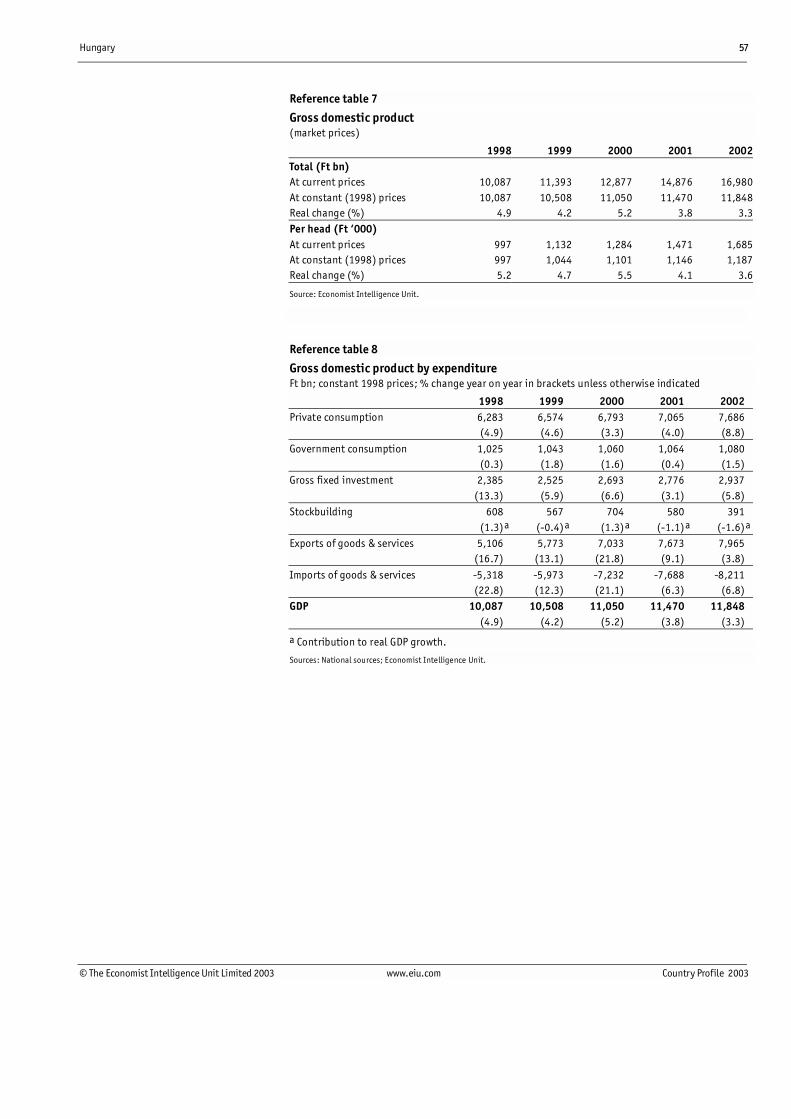
Hungary 57
© The Economist Intelligence Unit Limited 2003 www.eiu.com Country Profile 2003
Reference table 7
Gross domestic product(market prices)
1998 1999 2000 2001 2002Total (Ft bn)At current prices 10,087 11,393 12,877 14,876 16,980At constant (1998) prices 10,087 10,508 11,050 11,470 11,848Real change (%) 4.9 4.2 5.2 3.8 3.3Per head (Ft �000)At current prices 997 1,132 1,284 1,471 1,685At constant (1998) prices 997 1,044 1,101 1,146 1,187Real change (%) 5.2 4.7 5.5 4.1 3.6
Source: Economist Intelligence Unit.
Reference table 8
Gross domestic product by expenditureFt bn; constant 1998 prices; % change year on year in brackets unless otherwise indicated
1998 1999 2000 2001 2002Private consumption 6,283 6,574 6,793 7,065 7,686
(4.9) (4.6) (3.3) (4.0) (8.8)
Government consumption 1,025 1,043 1,060 1,064 1,080(0.3) (1.8) (1.6) (0.4) (1.5)
Gross fixed investment 2,385 2,525 2,693 2,776 2,937(13.3) (5.9) (6.6) (3.1) (5.8)
Stockbuilding 608 567 704 580 391(1.3)a (-0.4)a (1.3)a (-1.1)a (-1.6)a
Exports of goods & services 5,106 5,773 7,033 7,673 7,965(16.7) (13.1) (21.8) (9.1) (3.8)
Imports of goods & services -5,318 -5,973 -7,232 -7,688 -8,211(22.8) (12.3) (21.1) (6.3) (6.8)
GDP 10,087 10,508 11,050 11,470 11,848(4.9) (4.2) (5.2) (3.8) (3.3)
a Contribution to real GDP growth.
Sources: National sources; Economist Intelligence Unit.
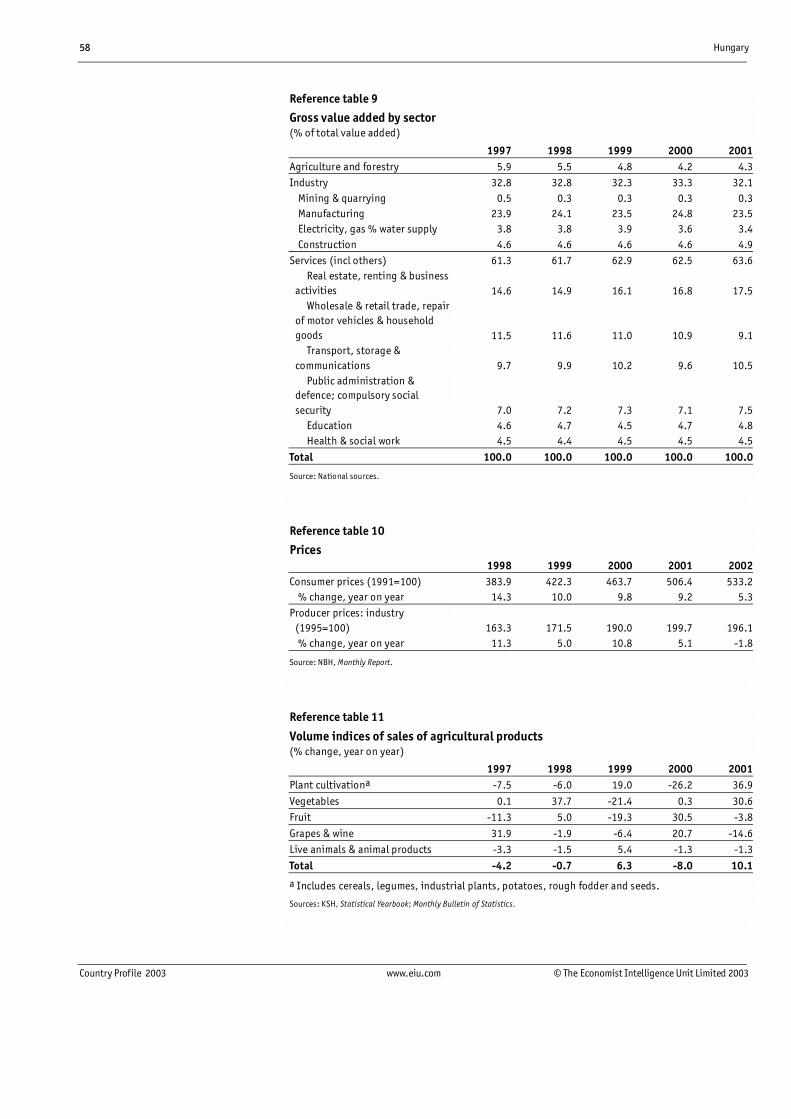
58 Hungary
Country Profile 2003 www.eiu.com © The Economist Intelligence Unit Limited 2003
Reference table 9
Gross value added by sector(% of total value added)
1997 1998 1999 2000 2001Agriculture and forestry 5.9 5.5 4.8 4.2 4.3Industry 32.8 32.8 32.3 33.3 32.1 Mining & quarrying 0.5 0.3 0.3 0.3 0.3 Manufacturing 23.9 24.1 23.5 24.8 23.5 Electricity, gas % water supply 3.8 3.8 3.9 3.6 3.4 Construction 4.6 4.6 4.6 4.6 4.9Services (incl others) 61.3 61.7 62.9 62.5 63.6 Real estate, renting & business
activities 14.6 14.9 16.1 16.8 17.5 Wholesale & retail trade, repair
of motor vehicles & householdgoods 11.5 11.6 11.0 10.9 9.1
Transport, storage &communications 9.7 9.9 10.2 9.6 10.5
Public administration &defence; compulsory socialsecurity 7.0 7.2 7.3 7.1 7.5
Education 4.6 4.7 4.5 4.7 4.8 Health & social work 4.5 4.4 4.5 4.5 4.5
Total 100.0 100.0 100.0 100.0 100.0
Source: National sources.
Reference table 10
Prices1998 1999 2000 2001 2002
Consumer prices (1991=100) 383.9 422.3 463.7 506.4 533.2 % change, year on year 14.3 10.0 9.8 9.2 5.3Producer prices: industry
(1995=100) 163.3 171.5 190.0 199.7 196.1 % change, year on year 11.3 5.0 10.8 5.1 -1.8
Source: NBH, Monthly Report.
Reference table 11
Volume indices of sales of agricultural products(% change, year on year)
1997 1998 1999 2000 2001Plant cultivationa -7.5 -6.0 19.0 -26.2 36.9
Vegetables 0.1 37.7 -21.4 0.3 30.6Fruit -11.3 5.0 -19.3 30.5 -3.8
Grapes & wine 31.9 -1.9 -6.4 20.7 -14.6Live animals & animal products -3.3 -1.5 5.4 -1.3 -1.3
Total -4.2 -0.7 6.3 -8.0 10.1
a Includes cereals, legumes, industrial plants, potatoes, rough fodder and seeds.
Sources: KSH, Statistical Yearbook; Monthly Bulletin of Statistics.
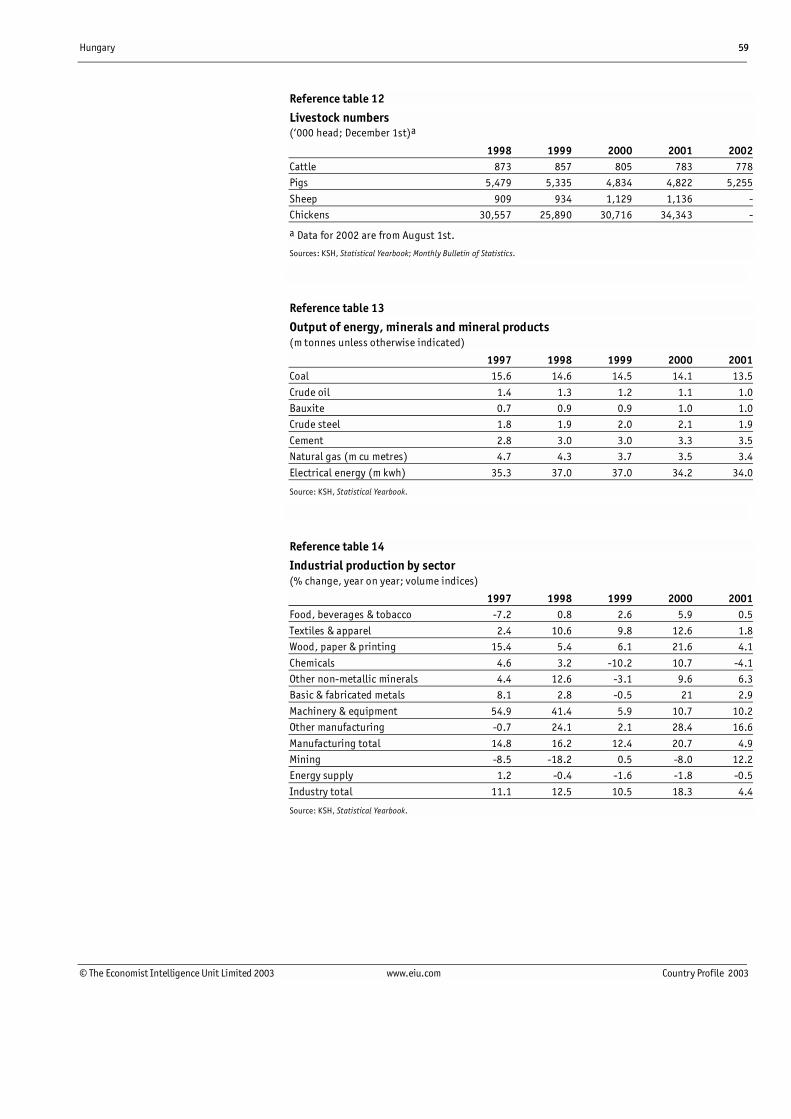
Hungary 59
© The Economist Intelligence Unit Limited 2003 www.eiu.com Country Profile 2003
Reference table 12
Livestock numbers(�000 head; December 1st)a
1998 1999 2000 2001 2002Cattle 873 857 805 783 778Pigs 5,479 5,335 4,834 4,822 5,255
Sheep 909 934 1,129 1,136 -Chickens 30,557 25,890 30,716 34,343 -
a Data for 2002 are from August 1st.
Sources: KSH, Statistical Yearbook; Monthly Bulletin of Statistics.
Reference table 13
Output of energy, minerals and mineral products(m tonnes unless otherwise indicated)
1997 1998 1999 2000 2001Coal 15.6 14.6 14.5 14.1 13.5
Crude oil 1.4 1.3 1.2 1.1 1.0Bauxite 0.7 0.9 0.9 1.0 1.0Crude steel 1.8 1.9 2.0 2.1 1.9
Cement 2.8 3.0 3.0 3.3 3.5Natural gas (m cu metres) 4.7 4.3 3.7 3.5 3.4
Electrical energy (m kwh) 35.3 37.0 37.0 34.2 34.0
Source: KSH, Statistical Yearbook.
Reference table 14
Industrial production by sector(% change, year on year; volume indices)
1997 1998 1999 2000 2001Food, beverages & tobacco -7.2 0.8 2.6 5.9 0.5
Textiles & apparel 2.4 10.6 9.8 12.6 1.8Wood, paper & printing 15.4 5.4 6.1 21.6 4.1
Chemicals 4.6 3.2 -10.2 10.7 -4.1Other non-metallic minerals 4.4 12.6 -3.1 9.6 6.3Basic & fabricated metals 8.1 2.8 -0.5 21 2.9
Machinery & equipment 54.9 41.4 5.9 10.7 10.2Other manufacturing -0.7 24.1 2.1 28.4 16.6
Manufacturing total 14.8 16.2 12.4 20.7 4.9Mining -8.5 -18.2 0.5 -8.0 12.2Energy supply 1.2 -0.4 -1.6 -1.8 -0.5
Industry total 11.1 12.5 10.5 18.3 4.4
Source: KSH, Statistical Yearbook.
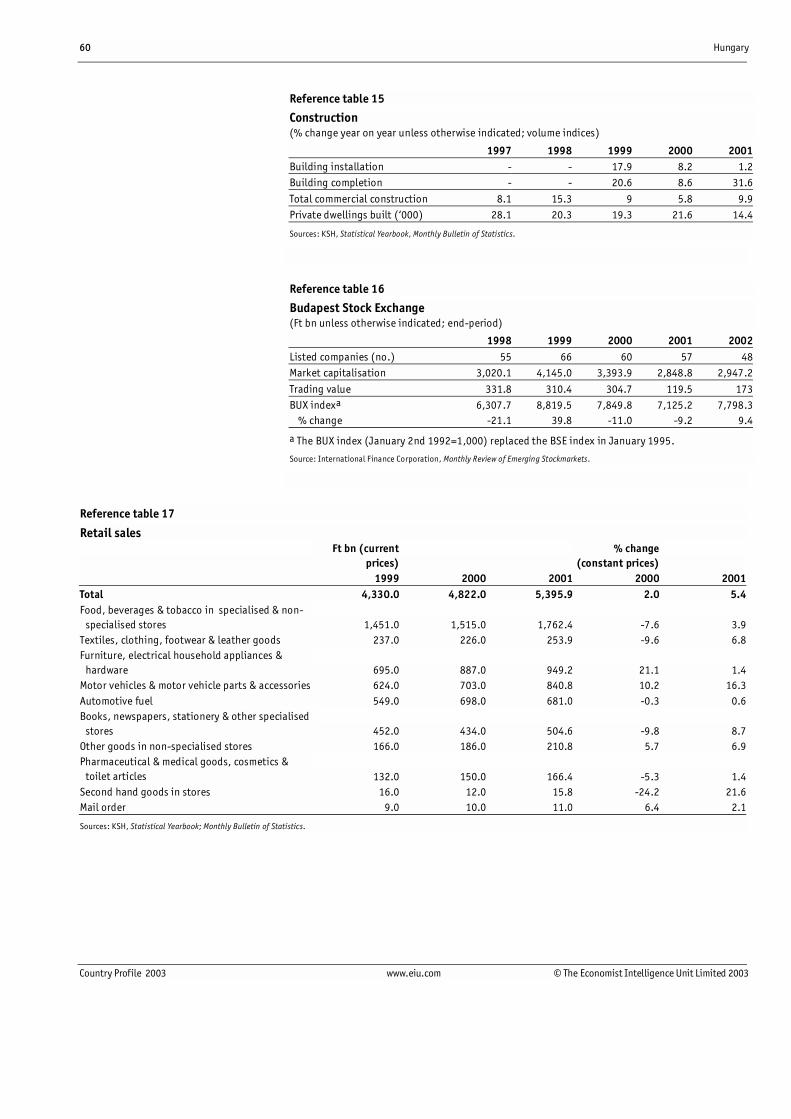
60 Hungary
Country Profile 2003 www.eiu.com © The Economist Intelligence Unit Limited 2003
Reference table 15
Construction(% change year on year unless otherwise indicated; volume indices)
1997 1998 1999 2000 2001Building installation - - 17.9 8.2 1.2Building completion - - 20.6 8.6 31.6
Total commercial construction 8.1 15.3 9 5.8 9.9Private dwellings built (�000) 28.1 20.3 19.3 21.6 14.4
Sources: KSH, Statistical Yearbook, Monthly Bulletin of Statistics.
Reference table 16
Budapest Stock Exchange(Ft bn unless otherwise indicated; end-period)
1998 1999 2000 2001 2002Listed companies (no.) 55 66 60 57 48Market capitalisation 3,020.1 4,145.0 3,393.9 2,848.8 2,947.2
Trading value 331.8 310.4 304.7 119.5 173BUX indexa 6,307.7 8,819.5 7,849.8 7,125.2 7,798.3 % change -21.1 39.8 -11.0 -9.2 9.4
a The BUX index (January 2nd 1992=1,000) replaced the BSE index in January 1995.
Source: International Finance Corporation, Monthly Review of Emerging Stockmarkets.
Reference table 17
Retail salesFt bn (current
prices)% change
(constant prices)1999 2000 2001 2000 2001
Total 4,330.0 4,822.0 5,395.9 2.0 5.4Food, beverages & tobacco in specialised & non-
specialised stores 1,451.0 1,515.0 1,762.4 -7.6 3.9Textiles, clothing, footwear & leather goods 237.0 226.0 253.9 -9.6 6.8Furniture, electrical household appliances &
hardware 695.0 887.0 949.2 21.1 1.4Motor vehicles & motor vehicle parts & accessories 624.0 703.0 840.8 10.2 16.3Automotive fuel 549.0 698.0 681.0 -0.3 0.6Books, newspapers, stationery & other specialised
stores 452.0 434.0 504.6 -9.8 8.7Other goods in non-specialised stores 166.0 186.0 210.8 5.7 6.9Pharmaceutical & medical goods, cosmetics &
toilet articles 132.0 150.0 166.4 -5.3 1.4Second hand goods in stores 16.0 12.0 15.8 -24.2 21.6Mail order 9.0 10.0 11.0 6.4 2.1
Sources: KSH, Statistical Yearbook; Monthly Bulletin of Statistics.
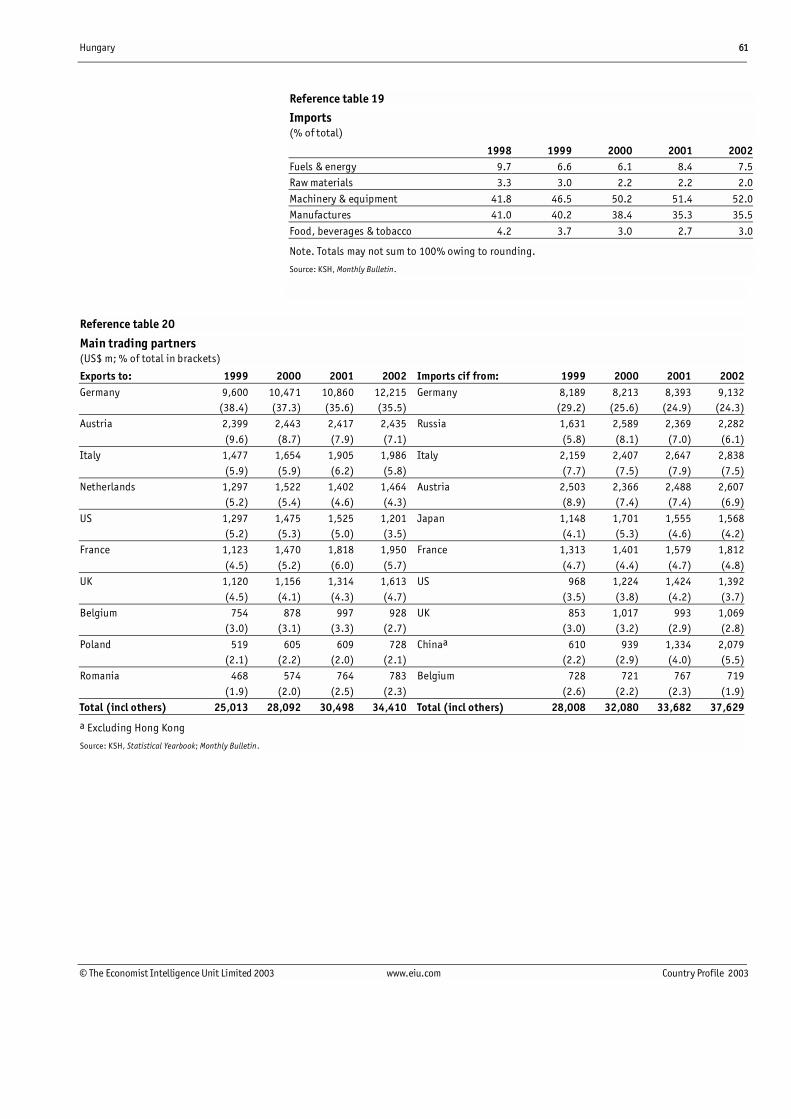
Hungary 61
© The Economist Intelligence Unit Limited 2003 www.eiu.com Country Profile 2003
Reference table 19
Imports(% of total)
1998 1999 2000 2001 2002Fuels & energy 9.7 6.6 6.1 8.4 7.5Raw materials 3.3 3.0 2.2 2.2 2.0
Machinery & equipment 41.8 46.5 50.2 51.4 52.0Manufactures 41.0 40.2 38.4 35.3 35.5
Food, beverages & tobacco 4.2 3.7 3.0 2.7 3.0
Note. Totals may not sum to 100% owing to rounding.
Source: KSH, Monthly Bulletin.
Reference table 20
Main trading partners(US$ m; % of total in brackets)
Exports to: 1999 2000 2001 2002 Imports cif from: 1999 2000 2001 2002Germany 9,600 10,471 10,860 12,215 Germany 8,189 8,213 8,393 9,132
(38.4) (37.3) (35.6) (35.5) (29.2) (25.6) (24.9) (24.3)Austria 2,399 2,443 2,417 2,435 Russia 1,631 2,589 2,369 2,282
(9.6) (8.7) (7.9) (7.1) (5.8) (8.1) (7.0) (6.1)Italy 1,477 1,654 1,905 1,986 Italy 2,159 2,407 2,647 2,838
(5.9) (5.9) (6.2) (5.8) (7.7) (7.5) (7.9) (7.5)Netherlands 1,297 1,522 1,402 1,464 Austria 2,503 2,366 2,488 2,607
(5.2) (5.4) (4.6) (4.3) (8.9) (7.4) (7.4) (6.9)
US 1,297 1,475 1,525 1,201 Japan 1,148 1,701 1,555 1,568(5.2) (5.3) (5.0) (3.5) (4.1) (5.3) (4.6) (4.2)
France 1,123 1,470 1,818 1,950 France 1,313 1,401 1,579 1,812(4.5) (5.2) (6.0) (5.7) (4.7) (4.4) (4.7) (4.8)
UK 1,120 1,156 1,314 1,613 US 968 1,224 1,424 1,392(4.5) (4.1) (4.3) (4.7) (3.5) (3.8) (4.2) (3.7)
Belgium 754 878 997 928 UK 853 1,017 993 1,069(3.0) (3.1) (3.3) (2.7) (3.0) (3.2) (2.9) (2.8)
Poland 519 605 609 728 Chinaa 610 939 1,334 2,079(2.1) (2.2) (2.0) (2.1) (2.2) (2.9) (4.0) (5.5)
Romania 468 574 764 783 Belgium 728 721 767 719(1.9) (2.0) (2.5) (2.3) (2.6) (2.2) (2.3) (1.9)
Total (incl others) 25,013 28,092 30,498 34,410 Total (incl others) 28,008 32,080 33,682 37,629
a Excluding Hong Kong
Source: KSH, Statistical Yearbook; Monthly Bulletin.
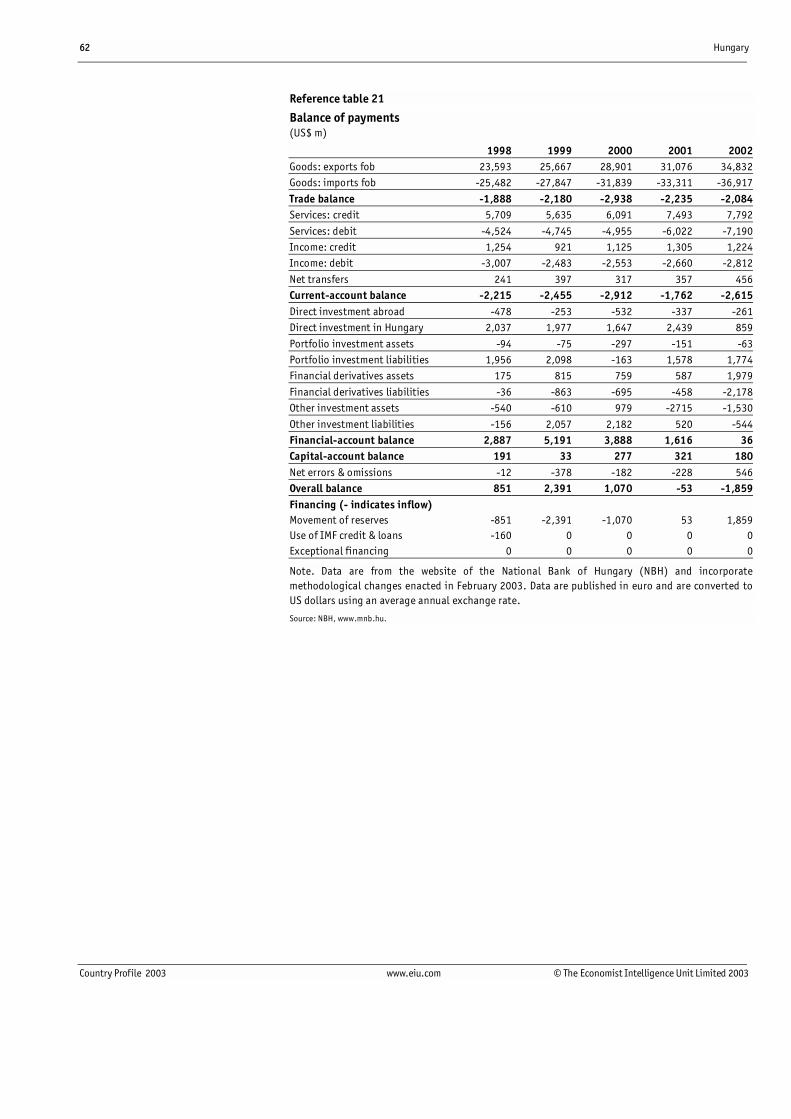
62 Hungary
Country Profile 2003 www.eiu.com © The Economist Intelligence Unit Limited 2003
Reference table 21
Balance of payments(US$ m)
1998 1999 2000 2001 2002Goods: exports fob 23,593 25,667 28,901 31,076 34,832Goods: imports fob -25,482 -27,847 -31,839 -33,311 -36,917
Trade balance -1,888 -2,180 -2,938 -2,235 -2,084Services: credit 5,709 5,635 6,091 7,493 7,792
Services: debit -4,524 -4,745 -4,955 -6,022 -7,190Income: credit 1,254 921 1,125 1,305 1,224Income: debit -3,007 -2,483 -2,553 -2,660 -2,812
Net transfers 241 397 317 357 456Current-account balance -2,215 -2,455 -2,912 -1,762 -2,615Direct investment abroad -478 -253 -532 -337 -261Direct investment in Hungary 2,037 1,977 1,647 2,439 859
Portfolio investment assets -94 -75 -297 -151 -63Portfolio investment liabilities 1,956 2,098 -163 1,578 1,774Financial derivatives assets 175 815 759 587 1,979
Financial derivatives liabilities -36 -863 -695 -458 -2,178Other investment assets -540 -610 979 -2715 -1,530
Other investment liabilities -156 2,057 2,182 520 -544Financial-account balance 2,887 5,191 3,888 1,616 36Capital-account balance 191 33 277 321 180Net errors & omissions -12 -378 -182 -228 546Overall balance 851 2,391 1,070 -53 -1,859Financing (- indicates inflow)Movement of reserves -851 -2,391 -1,070 53 1,859Use of IMF credit & loans -160 0 0 0 0Exceptional financing 0 0 0 0 0
Note. Data are from the website of the National Bank of Hungary (NBH) and incorporatemethodological changes enacted in February 2003. Data are published in euro and are converted toUS dollars using an average annual exchange rate.
Source: NBH, www.mnb.hu.
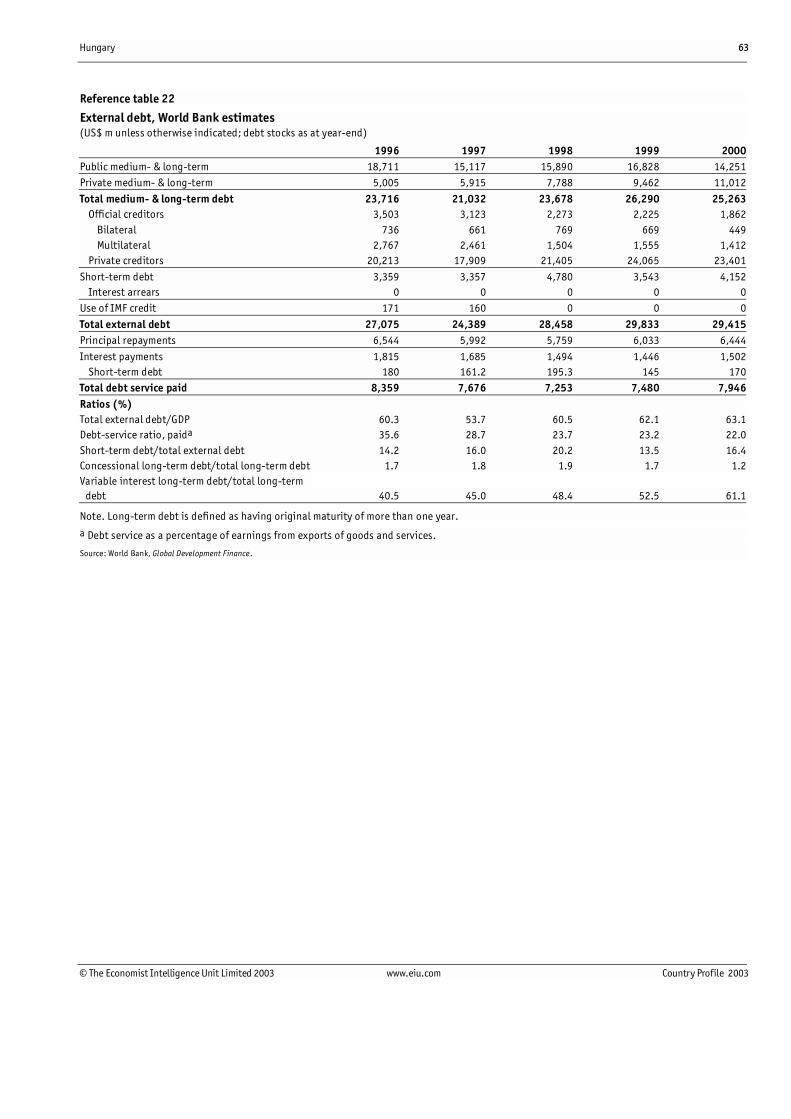
Hungary 63
© The Economist Intelligence Unit Limited 2003 www.eiu.com Country Profile 2003
Reference table 22
External debt, World Bank estimates(US$ m unless otherwise indicated; debt stocks as at year-end)
1996 1997 1998 1999 2000Public medium- & long-term 18,711 15,117 15,890 16,828 14,251Private medium- & long-term 5,005 5,915 7,788 9,462 11,012
Total medium- & long-term debt 23,716 21,032 23,678 26,290 25,263 Official creditors 3,503 3,123 2,273 2,225 1,862 Bilateral 736 661 769 669 449 Multilateral 2,767 2,461 1,504 1,555 1,412 Private creditors 20,213 17,909 21,405 24,065 23,401
Short-term debt 3,359 3,357 4,780 3,543 4,152 Interest arrears 0 0 0 0 0Use of IMF credit 171 160 0 0 0
Total external debt 27,075 24,389 28,458 29,833 29,415Principal repayments 6,544 5,992 5,759 6,033 6,444
Interest payments 1,815 1,685 1,494 1,446 1,502 Short-term debt 180 161.2 195.3 145 170Total debt service paid 8,359 7,676 7,253 7,480 7,946Ratios (%)Total external debt/GDP 60.3 53.7 60.5 62.1 63.1Debt-service ratio, paida 35.6 28.7 23.7 23.2 22.0Short-term debt/total external debt 14.2 16.0 20.2 13.5 16.4Concessional long-term debt/total long-term debt 1.7 1.8 1.9 1.7 1.2Variable interest long-term debt/total long-term
debt 40.5 45.0 48.4 52.5 61.1
Note. Long-term debt is defined as having original maturity of more than one year.
a Debt service as a percentage of earnings from exports of goods and services.
Source: World Bank, Global Development Finance.

64 Hungary
Country Profile 2003 www.eiu.com © The Economist Intelligence Unit Limited 2003
Reference table 23
Foreign reserves(US$ m unless otherwise indicated; end-period)
1998 1999 2000 2001 2002Foreign exchange 9,239 10,707 10,795 10,285 9,731SDRs 1 4 12 32 45
Reserve position in the IMF 79 242 263 403 593Total reserves excl gold 9,319 10,954 11,070 10,720 10,369Golda 28.5 28.5 28.5 28.5 28.5Memorandum itemsGoldb 29 29 28 28 35Gold (m fine troy oz) 0.101 0.101 0.101 0.101 0.101
a Valued at 75% of the fourth-quarter London price. b National valuation.
Source: IMF, International Financial Statistics.
Reference table 24
Exchange rates(Ft per unit of currency unless otherwise indicated; annual averages)
1998 1999 2000 2001 2002US$ 214.45 237.31 282.27 286.54 257.89DM 122.15 129.25 132.96 131.24 124.23
FFr 36.44 38.54 39.64 39.13 37.04£ 355.37 383.85 426.66 412.57 386.65Ecua 240.98 252.8 260.04 256.68 242.97
¥ (100) 164.64 209.59 261.93 236.23 205.87
a Euro from January 1st 2000.
Source: NBH, Monthly Report.
Editors: Mark Katzman (editor); Laza Kekic (consulting editor)Editorial closing date: April 16th 2003
All queries: Tel: (44.20) 7830 1007 E-mail: [email protected]