huntsville city schools - instructional guide 2017 – 2018 ... · huntsville city schools -...
TRANSCRIPT

Huntsville City Schools - Instructional Guide
2017 ndash 2018
Algebra 1 (NON-BLOCK SCHEDULE 7 PERIOD DAY) Grades 8-10
Table of Contents
Helpful Resources helliphelliphelliphelliphelliphelliphelliphelliphelliphelliphelliphelliphelliphelliphelliphelliphelliphelliphelliphelliphelliphelliphelliphelliphelliphelliphelliphelliphelliphelliphelliphelliphelliphelliphelliphelliphelliphelliphelliphelliphelliphelliphelliphelliphelliphelliphelliphelliphelliphellip2
IXL Correlationshelliphelliphelliphelliphelliphelliphelliphelliphelliphelliphelliphelliphelliphelliphelliphelliphelliphelliphelliphelliphelliphelliphelliphelliphelliphelliphelliphelliphelliphelliphelliphelliphelliphelliphelliphelliphelliphelliphelliphelliphelliphelliphelliphelliphelliphelliphelliphelliphelliphelliphellip3
Unit 1 - First 9 Weeks 4
Unit 2 - First 9 Weeks 5
Unit 3 - First 9 Weeks 6
Unit 4a - First 9 Weeks 6
Unit 4b - Second 9 Weeks 7
Unit 5 - Second 9 Weeks 8
Unit 6a - Second 9 Weeks 10
Unit 6b - Third 9 Weeks 12
Unit 7 - Third 9 Weeks 12
Unit 8 - Third 9 Weeks 13
Unit 9 - Fourth 9 Weeks 14
Unit 10 - Third 9 Weeks 16
Unit 11 - Fourth 9 Weeks 17
Unit 12 - Fourth 9 Weeks 18
Page 1 of 25
Overall Algebra 1 Helpful Resources
1 Mixed Reviews are at end of sections Helpful in teacher book for list of standards next to questions
2 wwwinteractmathcom wwwcommoncorepalcom and wwwpoweralgbracom are good resources for practice and review
3 Cumulative Standards Review are located at the end of each chapter for in-depth practice problems
Please Note For each chapter the ldquoTotal Daysrdquo includes one day for review and one day for testing of the chapter
Additional Resources
‐ Dan Meyer Resources o Blog
httpblogmrmeyercomcategory3acts o List of Activities
httpsdocsgooglecomspreadsheetccckey=0AjIqyKM9d7ZYdEhtR3BJMmdBWn M2YWxWYVM1UWowTEEgid=0
‐ Granite City Math Vocabulary o httpwwwgraniteschoolsorgmathvocabulary
‐ Wiki Space Classrooms o httpmrallenswikispacescomHouse+C+Mathematics
‐ Debbie Waggoner Resources o httpwwwdebbiewaggonercomsecondary-grades-6-12html
Page 2 of 25
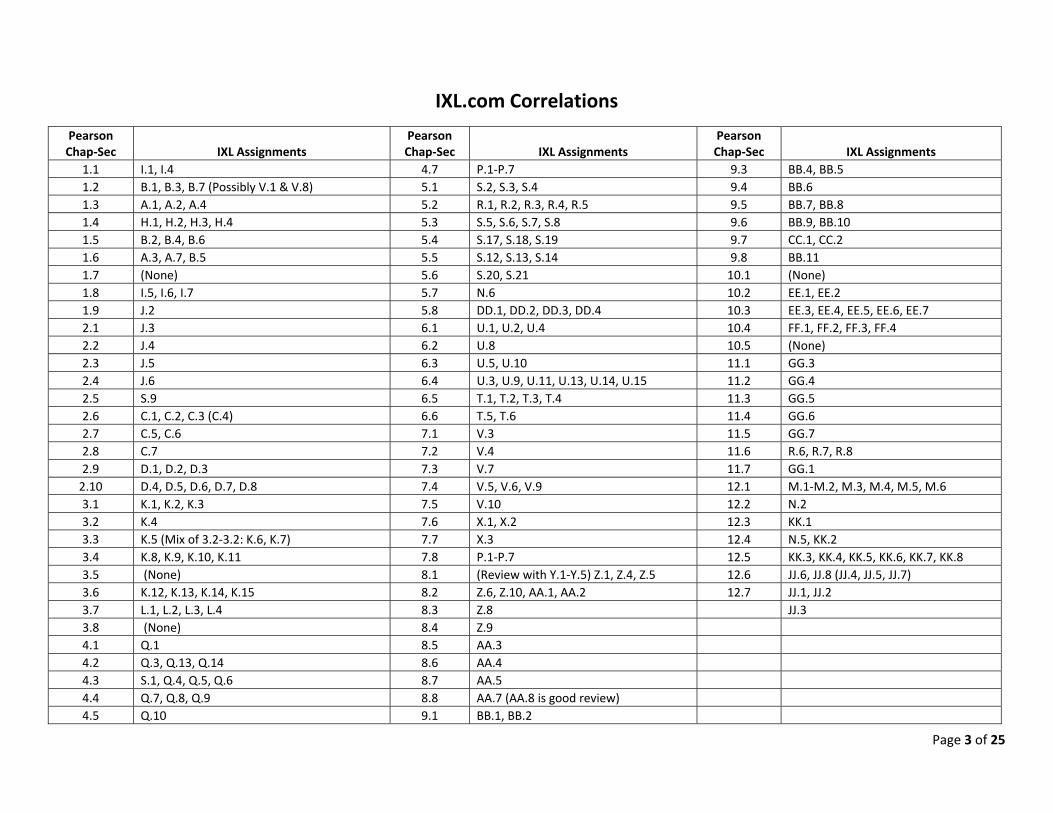
IXLcom Correlations Pearson Chap‐Sec IXL Assignments
Pearson Chap‐Sec IXL Assignments
Pearson Chap‐Sec IXL Assignments
11 I1 I4 47 P1‐P7 93 BB4 BB5 12 B1 B3 B7 (Possibly V1 amp V8) 51 S2 S3 S4 94 BB6 13 A1 A2 A4 52 R1 R2 R3 R4 R5 95 BB7 BB8 14 H1 H2 H3 H4 53 S5 S6 S7 S8 96 BB9 BB10 15 B2 B4 B6 54 S17 S18 S19 97 CC1 CC2 16 A3 A7 B5 55 S12 S13 S14 98 BB11 17 (None) 56 S20 S21 101 (None) 18 I5 I6 I7 57 N6 102 EE1 EE2 19 J2 58 DD1 DD2 DD3 DD4 103 EE3 EE4 EE5 EE6 EE7 21 J3 61 U1 U2 U4 104 FF1 FF2 FF3 FF4 22 J4 62 U8 105 (None) 23 J5 63 U5 U10 111 GG3 24 J6 64 U3 U9 U11 U13 U14 U15 112 GG4 25 S9 65 T1 T2 T3 T4 113 GG5 26 C1 C2 C3 (C4) 66 T5 T6 114 GG6 27 C5 C6 71 V3 115 GG7 28 C7 72 V4 116 R6 R7 R8 29 D1 D2 D3 73 V7 117 GG1 210 D4 D5 D6 D7 D8 74 V5 V6 V9 121 M1‐M2 M3 M4 M5 M6 31 K1 K2 K3 75 V10 122 N2 32 K4 76 X1 X2 123 KK1 33 K5 (Mix of 32‐32 K6 K7) 77 X3 124 N5 KK2 34 K8 K9 K10 K11 78 P1‐P7 125 KK3 KK4 KK5 KK6 KK7 KK8 35 (None) 81 (Review with Y1‐Y5) Z1 Z4 Z5 126 JJ6 JJ8 (JJ4 JJ5 JJ7) 36 K12 K13 K14 K15 82 Z6 Z10 AA1 AA2 127 JJ1 JJ2 37 L1 L2 L3 L4 83 Z8 JJ3 38 (None) 84 Z9 41 Q1 85 AA3 42 Q3 Q13 Q14 86 AA4 43 S1 Q4 Q5 Q6 87 AA5 44 Q7 Q8 Q9 88 AA7 (AA8 is good review) 45 Q10 91 BB1 BB2
Page 3 of 25
46 Q2 92 BB3
First Nine Weeks
Standard Resources
Approximate Pacing
Number of Days
UNIT 1 Foundations for Algebra
ALCOS 7a (6a) (A‐SSE1a) Interpret parts of an expression such as terms factors and coefficients
Ch 1112 Unit 1 Pacing 10 Days
(including 1st week of school
obligations) ALCOS 3 Explain why the sum or product of two rational numbers is rational that the sum of a rational number and an irrational number is irrational and that the product of a nonzero rational number and an irrational number is irrational [N‐RN3]
Ch 16
FAL Evaluating Statements About Radicals
ALCOS 7a (A‐SSE1a) Interpret parts of an expression such as terms factors and coefficients
Ch 17
ALCOS 22 (A‐REI10) Understand that the graph of an equation in two variables is the set of all its solutions plotted in the coordinate plane often forming a curve (which could be a line)
Ch 19 FAL Interpreting Algebraic Expressions FAL Solving Equations and Identities LTF Lessons none SMALLabs Constant Velocity
Review Ch 13 14 15 16 support N-RN3
Notes Pg 22 71 is the only explicit mention for cube roots A-REI1
Page 4 of 25
Ch 18 will be covered in Ch 21 Unit 2 Solving Equations
ALCOS 12 (A‐CED1) Create equations and inequalities in one Ch 21 Ch 23 Ch 24 Ch 28 Unit 2 Pacing variable and use them to solve problems Include equations rising from linear and quadratic functions and simple rational and exponential functions
17 days
ALCOS 17 (A‐REI3) Solve linear equations and inequalities in one variable including equations with coefficients represented by letters
Ch 22 Ch 27
FAL Building and Solving Complet Equations
Note Integrate geometry questions from Ch 22 ALCOS 15 (A‐CED4) Rearrange formulas to highlight a quantity of interest using the same reasoning as in solving equations Example Rearrange Ohmrsquos law V = IR to highlight resistance R ALCOS 16 (A‐REI1) Explain each step in solving a simple equation as following the equality of numbers asserted at the previous step starting from the assumption that the original equation has a solution Construct a viable argument to justify a solution method
Ch 25
FAL Modeling Motion Rolling Cups
ALCOS 4 (N‐Q1) Use units as a way to understand problems and to guide the solution of multistep problems choose and interpret units consistently in formulas choose and interpret the scale and the origin in graphs and data displays
Ch 26
ALCOS 6 (N‐Q3) Choose a level of accuracy appropriate to limitations on measurement when reporting quantities
Ch 29 Ch 210
LTF Lessons ALCOS 4 13 Connecting a Verbal Description to a Table or Graph (15 days) Walk the Line (2 days) also partially covers 8-F5 ALCOS 15 16 17 Literal Equations ndash Reviewing and Foreshadowing (1 day) ALCOS 12 15 Linear Functions (1 day)
Dan Meyer Circle-Square
Page 5 of 25
World Record Airbag Falling Glowsticks Falling Rocks
SMALLabs Constant Velocity Chemical Titration
Unit 3 Solving Inequalities
ALCOS 17 (A‐REI3) Solve linear equations and inequalities in one variable including equations with coefficients represented by letters
Ch 31 Ch 32 Ch 33 Ch 34 Ch 36 Unit 3 Pacing 9 days
ALCOS 12 (A‐CED1) Create equations and inequalities in one variable and use them to solve problems Include equations rising from linear and quadratic functions and simple rational and exponential functions
Ch 37
LTF Lessons None
Dan Meyer Circle-Square World Record Airbag Falling Glowsticks Falling Rocks
SMALLabs Constant Velocity
Unit 4 An Introduction to Functions
Preparation Ch 41 preparation for F‐IF4
ALCOS 22 (A‐REI10) Understand that the graph of an equation in two variables is the set of all its solutions plotted in the coordinate plane often forming a curve (which could be a line)
Ch 42 Ch 43
FAL Representing Functions of Everyday Situations
Unit 4a Pacing 5 days
Page 6 of 25
812 Compare properties of two functions each represented in a different way (algebraically graphically numerically in tables or by verbal descriptions) [8‐F2]
813 Interpret the equation y = mx + b as defining a linear function whose graph is a straight line give examples of functions that are not linear [8‐F3]
Ch 42 Ch 43
ALCOS 25 (F‐IF1) Understand that a function from one set (called the domain) to another set (called the range) assigns to each element of the domain exactly one element of the range If f is a function and x is an element of its domain then f(x) denotes the output of f corresponding to the input x The graph of f is the graph of the equation y = f(x)
Ch 42 Ch 43
LTF Lessons Introduction to Function Notation Connecting a Verbal Description to Table and Graph Using Tables and Graphs to Determine the Better Deal Connecting Table Graph and Function Notation Discrete and Continuous Data
Dan Meyer Taco Cart
SMALLabs Chemistry Titration Gear Ratio Game Constant Acceleration
Page 7 of 25
Second Nine Weeks
Standard Resources
Approximate Pacing
Number of Days
ALCOS 29 (F‐IF5) Relate the domain of a function to its graph and where applicable to the quantitative relationship it describes
Ch 44 Unit 4b Pacing 10 days
ALCOS 5 (N‐Q2) Define appropriate quantities for the purpose of descriptive modeling
Ch 45
FAL Modeling Population Growth Having Kittens ALCOS 25 (F‐IF1) Understand that a function from one set (called the domain) to another set (called the range) assigns to each element of the domain exactly one element of the range If f is a function and x is an element of its domain then f(x) denotes the output of f corresponding to the input x The graph of f is the graph of the equation y = f(x)
811 Understand that a function is a rule that assigns to each input exactly one output The graph of a function is the set of ordered pairs consisting of an input and the corresponding output (Function notation is not required in Grade 8) [8‐F1]
Ch 46
ALCOS 27 (F‐IF3) Recognize that sequences are functions sometimes defined recursively whose domain is a subset of the integers
ALCOS 35 (F‐BF2) Write arithmetic and geometric sequences both recursively and with an explicit formula use them to model situations and translate between the two forms
Ch 47
FAL Generalizing Patterns Table Tiles
ALCOS 26 (F‐IF2) Use function notation evaluate functions for inputs in their domains and interpret statements that use function notation in terms of a context
Ch 47
LTF Lessons Introduction to Function Notation Connecting a Verbal Description to Table and Graph Using Tables and Graphs to Determine the Better Deal
Page 8 of 25
Connecting Table Graph and Function Notation Discrete and Continuous Data Arithmetic Sequences (MG)
Dan Meyer Taco Cart
SMALLabs Chemistry Titration Gear Ratio Game Constant Acceleration
Unit 5 Linear Functions Helpful NotesResources for Ch 5 1Ch 56 is covered in Geometry
2 Step Functions and Piece Wise functions should be covered after 58 ALCOS 37b (F‐LE1b) Recognize situations in which one quantity Ch 51 changes at a constant rate per unit interval relative to another Unit 5 Pacing
ALCOS 30 (F‐IF6) Calculate and interpret the average rate of change of a function (presented symbolically or as a table) over a specified interval Estimate the rate of change from a graph
17 days
ALCOS 13 (A‐CED2) Create equations in two or more variables to represent relationships between quantities graph equations on coordinate axes with labels and scales
Ch 52
ALCOS 36 (F‐BF3) Identify the effect on the graph of replacing f(x) by f(x) + k kf(x) f(kx) and f(x + k) for specific values of k (both positive and negative) find the value of k given the graphs Experiment with cases and illustrate an explanation of the effects on the graph using technology Include recognizing even and odd functions from their graphs and algebraic expressions for them
ALCOS 31a (F‐IF7a) Graph linear and quadratic functions and show intercepts maxima and minima
Ch 53
FAL Representing Linear and Exponential Growth
ALCOS 38 (F‐LE2) Construct linear and exponential functions including arithmetic and geometric sequences given a graph a description of a relationship or two input‐output pairs (include reading these from a table)
Ch 54
Page 9 of 25
ALCOS 34a (F‐BF1) Write a function that describes a relationship between two quantities
Ch 55
Note Concept Byte- Inverse of a Linear Function (Immediately following Ch 55)
FAL Interpreting Data Muddying the Water
ALCOS 45c (S‐ID6c) Fit a linear function for a scatter plot that suggests a linear association
ALCOS 45 (S‐ID‐6) Represent data on two quantitative variables on a scatter plot and describe how the variables are related
ALCOS 45a (S‐ID6a) Fit a function to the data use functions fitted to data to solve problems in the context of the data Use given function or choose a function suggested by the context Emphasize linear quadratic and exponential models
ALCOS 46 (S‐ID7) Interpret the slope (rate of change) and the intercept (constant term) of a linear model in the context of the data
ALCOS 40 (F‐LE5) Interpret the parameters in a linear or exponential function in terms of a context
Ch 57
Note Concept Byte- Using Residuals (Immediately following Ch 57)
FAL Interpreting Data Muddying the Water
ALCOS 45b (S‐ID6b) Informally assess the fit of a function by plotting and analyzing residuals
ALCOS 31b (F‐IF7b) Graph square root cube root and piecewise‐defined functions including step functions and absolute value functions
Ch 58
Please note there are two days for this standard so that you can cover on Piecewise and step functions
LTF Lessons Walk the Line (MG) Average Rate of Change (MG) Calculating Average Rate of Change Slope Investigation Analysis of Functions Translations of Linear Functions
Page 10 of 25
Write the equation of the Line Review Piecewise functions
Dan Meyer Taco Cart Penny Circle
Unit 6 Systems of Equations and Inequalities
810 Analyze and solve pairs of simultaneous linear equations [8‐EE8]
a Understand that solutions to a system of two linear equations in two variables correspond to points of intersection of their graphs because points of intersection satisfy both equations simultaneously [8‐EE8a]
b Solve systems of two linear equations in two variables algebraically and estimate solutions by graphing the equations Solve simple cases by inspection [8‐EE8b]
c Solve real‐world and mathematical problems leading to two linear equations in two variables [8‐EE8c]
ALCOS 20 (A‐REI6) Solve systems of linear equations exactly and approximately (eg with graphs) focusing on pairs of linear equations in two variables
ALCOS 23 (A‐REI11) Explain why the x‐coordinates of the points where the graphs of the equations y = f(x) and y = g(x) intersect are the solutions of the equation f(x) ndash g(x) find the solutions approximately eg using technology to graph the functions make tables of values or find successive approximations Include cases where f(x) andor g(x) are linear polynomial rational absolute value exponential and logarithmic functions
Ch 61-63 Unit 6a Pacing 9 days
(first half)
ALCOS 19 (A‐REI5) Prove that given a system of two equations in two variables replacing one equation by the sum of that equation and a multiple of the other produces a system with the same solutions
LTF Lessons Literal equations- Reviewing and Foreshadowing Linear Functions (MG)
Page 11 of 25
Painting the House Solving systems of Linear Equations
Dan Meyer Circle-Square
SMALLabs Constant Velocity
Page 12 of 25
Third Nine Weeks
Standard Resources
Approximate Pacing
Number of Days
ALCOS 20 (A‐REI6) Solve systems of linear equations exactly and approximately (eg with graphs) focusing on pairs of linear equations in two variables
CH 64
FAL Maximizing Profit Selling Boomerangs
Unit 6b Pacing 8 days
(second half) ALCOS 24 (A‐REI12) Graph the solutions to a linear inequality in two variables as a half‐plane (excluding the boundary in the case of a strict inequality) and graph the solution set to a system of inequalities in two variables as the intersection of the corresponding half‐planes
Ch 65 and Ch 66
Note Immediately following Ch 66 Concept Byte using Graphing Calculators
LTF Lessons Maximizing Profit
Dan Meyer Circle-Square
SMALLabs Constant Velocity
Unit 7 Exponents and Exponential Functions
ALCOS 1 (N‐RN1) Explain how the definition of the meaning of rational exponents follows from extending the properties of integer exponents to those values allowing for a notation for radicals in terms of rational exponents
Ch 71 Ch 72 Ch 73 Ch 74 Unit 7 Pacing 17 days
ALCOS 2 (N‐RN2) Rewrite expressions involving radicals and rational exponents using the properties of exponents
Ch 75
ALCOS 33 (F‐IF9) Compare properties of two functions each represented in a different way (algebraically graphically numerically in tables or by verbal descriptions)
ALCOS 32b (F‐IF8b) Use the properties of exponents to interpret expressions for exponential functions
Ch 76 and CH 77
FAL Generating Polynomials from Patterns
FAL Representing Trigonometric Functions
Page 13 of 25
ALCOS 34 (F‐BF1) Write a function that describes a relationship between two quantities
ALCOS 7b [A‐SSE1b] Interpret complicated expressions by viewing one or more of their parts as a single entity Example Interpret P(1+r)n as the product of P and a factor not depending on P ALCOS 35 (F‐BF2) Write arithmetic and geometric sequences both recursively and with an explicit formula use them to model situations and translate between the two forms
Ch 78
LTF Lessons Exponential Function Exploration Exponential Growth (Found under Mathematical Foundations) How do you start and how do you change (Non LTF Lesson available on apluscollegereadycom) Writing Equations Using Sequences Limits- A Physical Approach (MG)
Dan Meyer Super Stairs Taco Cart
Unit 8 Polynomials and Factoring
ALCOS 10 (A‐APR1) Understand that polynomials form a system Ch 81 Ch 82 Ch 83 Ch 84 Unit 8 Pacing analogous to the integers namely they are closed under the operations of addition subtraction and multiplication add subtract and multiply polynomials
FAL Representing Polynomials Graphically 17 days
ALCOS 7a (A‐SSE1a) Interpret parts of an expression such as terms factors and coefficients
ALCOS 8 (A‐SSE2) Use the structure of an expression to identify ways to rewrite it Example See x4 ndash y4 as (x2)2 ndash (y2) 2 thus recognizing it as a difference of squares that can be factored as (x2 ndash y2)(x2 + y2)
Ch 85 Ch 86 Ch 87 Ch 88
Page 14 of 25
LTF Lessons None Dan Meyer None SMALLabs None
Page 15 of 25
Fourth Nine Weeks
Standard Resources
Approximate Pacing
Number of Days
Unit 9 Quadratic Functions and Equations
ALCOS 31a (F‐IF7a) Graph linear and quadratic functions and show intercepts maxima and minima
ALCOS 33 (F‐IF9) Compare properties of two functions each represented in a different way (algebraically graphically numerically in tables or by verbal descriptions)
ALCOS 34 (F‐BF1) Write a function that describes a relationship between two quantities
ALCOS 39 (F‐LE3) Observe using graphs and tables that a quantity increasing exponentially eventually exceeds a quantity increasing linearly quadratically or (more generally) as a polynomial function
Ch 91 and Ch 92 Unit 9 Pacing 17 days
ALCOS 18b (A‐REI4b) Solve quadratic equations by inspection (eg for x2 = 49) taking square roots completing the square and the quadratic formula and factoring as appropriate to the initial form of the equation Recognize when the quadratic formula gives complex solutions and write them as a + bi for real numbers a and b
ALCOS 9a (A‐SSE3a) Factor a quadratic expression to reveal the zeros of the function it defines
ALCOS 9b (A‐SSE3b) Factor a quadratic expression to reveal the zeros of the function it defines
ALCOS 9c (AL standard) Determine a quadratic equation when given its graph or roots
Ch 93 and Ch 94
FAL Solving Quadratic Equations
FAL Representing Quadratic Functions Graphically
Page 16 of 25
ALCOS 9d (A‐SSE3c) Use the properties of exponents to transform expressions for exponential functions Example The expression 115t can be rewritten as (115112)12t = 101212t to reveal the approximate equivalent monthly interest rate if the annual rate is 15 ALCOS 31a (F‐IF8a) Use the process of factoring and completing the square in a quadratic function to show zeros extreme values and symmetry of the graph and interpret these in terms of a context
Ch 95
ALCOS 18a (A‐RE14a) Use a method of completing the square to transform any quadratic equation in x into an equation of the form (x ndash p)2 = q that has the same solutions Derive the quadratic formula from this form
Ch 96
ALCOS 37a (F‐LE1a) Prove that linear functions grow by equal differences over equal intervals and that exponential functions grow by equal factors over equal intervals
ALCOS 37 (F‐LE1) Distinguish between situations that can be modeled with linear functions and with exponential functions
ALCOS 37c (F‐LE1c) Recognize situations in which a quantity grows or decays by a constant percent rate per unit interval relative to another
ALCOS 45a (S‐ID6a) Fit a function to the data use functions fitted to data to solve problems in the context of the data Use given function or choose a function suggested by the context Emphasize linear quadratic and exponential models
ALCOS 45b (S‐ID6b) Informally assess the fit of a function by plotting and analyzing residuals
Ch 97
FAL Representing Linear and Exponential Growth
ALCOS 21 (A‐REI7) Solve a simple system of linear equation and quadratic equations in two variables algebraically and graphically
ALCOS 14 (A‐CED3) Represent constraints by equations or inequalities and by systems of equations andor inequalities and interpret solutions as viable or non‐viable options in a modeling context
Ch 98
FAL Sorting Equations of Circles 1
Page 17 of 25
Example represent inequalities describing nutritional and cost constraints on combinations of different foods
LTF Lessons Investigation- Graphing Quadratic Functions Graphing Quadratics Functions (Example 1) Analyzing Quadratic Functions(MG) Quadratic Optimization Another Way to Look at Factoring Graphing Quadratic Functions (Example 2 and problems 12)
Unit 10 Radical Expressions and Equations
821 Explain a proof of the Pythagorean Theorem and its converse [8‐G6]
822 Apply the Pythagorean Theorem to determine unknown side lengths in right triangles in real‐world and mathematical problems in two and three dimensions [8‐G7]
823 Apply the Pythagorean Theorem to find the distance between two points in a coordinate system [8‐G8]
ALCOS 31b (F‐IF7b) Graph square root cube root and piecewise‐defined functions including step functions and absolute value functions
Ch 10 1 102 103 and 105 (104 is helpful but optional)
Please note 1 Section 101 is not required for high school 2 Section 105 can be taught after the End Of Course Exam 3Graphing Calculators are a great resource for
section 105
FAL Proving the Pythagorean Theorem
FAL Classifying Rational and Irrational Numbers
Unit 10 Pacing 7 days
LTF Lessons Pythagorean Theorem Applications Brenna Rescues Andrew
Unit 11 Rational Expressions and Functions
ALCOS 11 (A‐APR7) Understand that rational expressions form a Ch 111 112 113 and Ch 114 Unit 11 system analogous to the rational numbers closed under addition Please Note 111 is not a standard but prepares Pacing subtraction multiplication and division by a nonzero rational for 112 17 days expression add subtract multiply and divide rational expressions ALCOS 12 (A‐CED1) Create equations and inequalities in one variable and use them to solve problems Include equations rising
Ch 115
FAL Representing Inequalities Graphically Page 18 of 25
from linear and quadratic functions and simple rational and exponential functions ALCOS 29 (F‐IF5) Relate the domain of a function to its graph and where applicable to the quantitative relationship it describes
Ch 116
814 Construct a function to model a linear relationship between two quantities Determine the rate of change and initial value of the function from a description of a relationship or from two (x y) values including reading these from a table or from a graph Interpret the rate of change and initial value of a linear function in terms of the situation it models and in terms of its graph or a table of values [8‐F4]
815 Describe qualitatively the functional relationship between two quantities by analyzing a graph (eg where the function is increasing or decreasing linear or nonlinear) Sketch a graph that exhibits the qualitative features of a function that has been described verbally [8‐F5]
ALCOS 28 (F‐IF4) For a function that models a relationship between two quantities interpret key features of graphs and tables in terms of the quantities and sketch graphs showing key features given a verbal description of the relationship Key features include intercepts relative maximums and minimums symmetries end behavior and periodicity
Ch 117
LTF Lessons Analysis of Functions Quadratic Optimization Characteristics of Functions Transformations of Functions Explorations EvenOdd Functions
Dan Meyer Circle-Square
Unit 12 Data Analysis
ALCOS 41 (S‐ID1) Represent data with plots on the real number line (dot plots histograms and box plots)
Ch 122 Unit 12 Pacing 10 days
Page 19 of 25
ALCOS 42 (S‐ID2) Use statistics appropriate to the shape of the data distribution to compare center (median mean) and spread (interquartile range standard deviation) of two or more different data sets
Ch 123 and Ch 124
FAL Representing Data with Frequency Graphs
825 Construct and interpret scatter plots for bivariate measurement data to investigate patterns of association between two quantities Describe patterns such as clustering outliers positive or negative association linear association and nonlinear association [8‐SP1]
826 Know that straight lines are widely used to model relationships between two quantitative variables For scatter plots that suggest a linear association informally fit a straight line and informally assess the model fit by judging the closeness of the data points to the line [8‐SP2]
827 Use the equation of a linear model to solve problems in the context of bivariate measurement data interpreting the slope and intercept [8‐SP3]
828 Understand that patterns of association can also be seen in bivariate categorical data by displaying frequencies and relative frequencies in a two‐way table Construct and interpret a two‐way table summarizing data on two categorical variables collected from the same subjects Use relative frequencies calculated for rows or columns to describe possible association between the two variables [8‐SP4]
ALCOS 43 (S‐ID3) Interpret differences in shape center and spread in the context of the data sets accounting for possible effects of extreme data points (outliers)
ALCOS 44 (S‐ID5) Summarize categorical data for two categories in two‐way frequency tables Interpret relative frequencies in the context of the data (including joint marginal and conditional relative frequencies) Recognize possible associations and trends in the data
Ch 125
FAL Representing Data with Box Plots
FAL Devising a Measure Correlation
ALCOS 47 (S‐CP2) Understand that two events A and B are independent if the probability of A and B occurring together is the
Ch 128
Page 20 of 25
product of their probabilities and use this characterization to determine if they are independent
FAL Representing Conditional Probabilities 1
FAL Representing Conditional Probability Medical Testing
FAL Representing Conditional Probability 2 LTF Lessons Fitting a Line to Data Use Dotplots (Line Plots) to Determine Mean Median Mode and Range Analyzing Mean Median Mode and Range Describing Distributions Standard Deviation Movie Probability (MG) Does Gender Make a Difference
Dan Meyer Penny Circle
Page 21 of 25
Listed below are the technology standards for grades six through twelve You are to make every effort to incorporate the applicable standards into your daily classroom lessons These standards should be noted in your lesson plans
Alabama Technology Standards 6th ndash 8th Grades
Technology Operations and Concepts Students will
1 Appraise technology systems to determine software and hardware compatibility
2 Publish digital products that communicate curriculum concepts Examples Web pages videos podcasts multimedia presentations
3 Explain how network systems are connected and used Examples file sharing collaborating wireless networking
4 Determine basic troubleshooting strategies to correct common hardware and software problems Examples checking connections restarting equipment creating a backup copy of digital data Describing the importance of antivirus and security software
5 Use basic features of word processing spreadsheets databases and presentation software Examples word processingmdashreports letters brochures spreadsheetsmdashdiscovering patterns tracking spending creating budgets databasesmdashcontact list of addresses and telephone numbers presentation softwaremdashslideshow
6 Select specific digital tools for completing curriculum‐related tasks Examples spreadsheet for budgets word processing software for essays probes for data collection
7 Demonstrate correct keyboarding techniques
Page 22 of 25
Digital Citizenship
8 Identify safe uses of social networking and electronic communication Recognizing dangers of online predators Protecting personal information online
9 Practice responsible and legal use of technology systems and digital content Examples avoiding plagiarism complying with acceptable‐use policies copyright laws and fair use standards recognizing secure Web sites Identifying examples of computer crime and related penalties Examples computer crimemdashphishing spoofing virus and worm dissemination cyberbullying penaltiesmdashfines incarceration Citing sources of digital content
10 Describe advances in technology and effects of each on the workplace and society Examples agriculture manufacturing medicine warfare transportation communication education
Research and Information Fluency
11 Use digital tools and strategies to locate collect organize evaluate and synthesize information Examples locatingmdashBoolean searches graphic organizers spreadsheets databases collectingmdashprobeware graphing calculators organizingmdashgraphic organizers spreadsheets evaluatingmdashreviewing publication dates determining credibility synthesizingmdashword processing software concept‐mapping software
Communication and Collaboration
12 Use digital tools to communicate and collaborate at all levels from interpersonal to global Examples instant messages e‐mail blogs wikis collaborative authoring tools online learning communities Demonstrating digital file transfer Examples attaching uploading downloading
Critical Thinking Problem Solving and Decision Making
13 Use digital tools to formulate solutions to authentic problems Examples electronic graphing tools probes spreadsheets
Page 23 of 25
Creativity and Innovation
14 Use digital tools to generate new ideas products or processes Examples ideasmdashpredictions trends productsmdashanimation video processesmdashmodels simulations
Alabama Technology Standards 9th ndash 12th Grade
Operations and Concepts
Students will
2 Diagnose hardware and software problems Examples viruses error messages Applying strategies to correct malfunctioning hardware and software Performing routine hardware maintenance Describing the importance of antivirus and security software
3 Demonstrate advanced technology skills including compressing converting importing exporting and backing up files Transferring data among applications Demonstrating digital file transfer Examples attaching uploading downloading
4 Utilize advanced features of word processing software including outlining tracking changes hyperlinking and mail merging
5 Utilize advanced features of spreadsheet software including creating charts and graphs sorting and filtering data creating formulas and applying functions
6 Utilize advanced features of multimedia software including image video and audio editing
Digital Citizenship
9 Practice ethical and legal use of technology systems and digital content Explaining consequences of illegal and unethical use of technology systems and digital content Examples cyberbullying plagiarism Interpreting copyright laws and policies with regard to ownership and use of digital content
Page 24 of 25
Citing sources of digital content using a style manual Examples Modern Language Association (MLA) American Psychological Association (APA)
Research and Information Fluency
11 Critique digital content for validity accuracy bias currency and relevance
Communication and Collaboration
12 Use digital tools to publish curriculum‐related content Examples Web page authoring software coding software wikis blogs podcasts
13 Demonstrate collaborative skills using curriculum‐related content in digital environments Examples completing assignments online interacting with experts and peers in a structured online learning environment
Critical Thinking Problem Solving and Decision Making
14 Use digital tools to defend solutions to authentic problems Example disaggregating data electronically
Creativity and Innovation
15 Create a product that integrates information from multiple software applications Example pasting spreadsheet‐generated charts into a presentation
Page 25 of 25
Overall Algebra 1 Helpful Resources
1 Mixed Reviews are at end of sections Helpful in teacher book for list of standards next to questions
2 wwwinteractmathcom wwwcommoncorepalcom and wwwpoweralgbracom are good resources for practice and review
3 Cumulative Standards Review are located at the end of each chapter for in-depth practice problems
Please Note For each chapter the ldquoTotal Daysrdquo includes one day for review and one day for testing of the chapter
Additional Resources
‐ Dan Meyer Resources o Blog
httpblogmrmeyercomcategory3acts o List of Activities
httpsdocsgooglecomspreadsheetccckey=0AjIqyKM9d7ZYdEhtR3BJMmdBWn M2YWxWYVM1UWowTEEgid=0
‐ Granite City Math Vocabulary o httpwwwgraniteschoolsorgmathvocabulary
‐ Wiki Space Classrooms o httpmrallenswikispacescomHouse+C+Mathematics
‐ Debbie Waggoner Resources o httpwwwdebbiewaggonercomsecondary-grades-6-12html
Page 2 of 25
IXLcom Correlations Pearson Chap‐Sec IXL Assignments
Pearson Chap‐Sec IXL Assignments
Pearson Chap‐Sec IXL Assignments
11 I1 I4 47 P1‐P7 93 BB4 BB5 12 B1 B3 B7 (Possibly V1 amp V8) 51 S2 S3 S4 94 BB6 13 A1 A2 A4 52 R1 R2 R3 R4 R5 95 BB7 BB8 14 H1 H2 H3 H4 53 S5 S6 S7 S8 96 BB9 BB10 15 B2 B4 B6 54 S17 S18 S19 97 CC1 CC2 16 A3 A7 B5 55 S12 S13 S14 98 BB11 17 (None) 56 S20 S21 101 (None) 18 I5 I6 I7 57 N6 102 EE1 EE2 19 J2 58 DD1 DD2 DD3 DD4 103 EE3 EE4 EE5 EE6 EE7 21 J3 61 U1 U2 U4 104 FF1 FF2 FF3 FF4 22 J4 62 U8 105 (None) 23 J5 63 U5 U10 111 GG3 24 J6 64 U3 U9 U11 U13 U14 U15 112 GG4 25 S9 65 T1 T2 T3 T4 113 GG5 26 C1 C2 C3 (C4) 66 T5 T6 114 GG6 27 C5 C6 71 V3 115 GG7 28 C7 72 V4 116 R6 R7 R8 29 D1 D2 D3 73 V7 117 GG1 210 D4 D5 D6 D7 D8 74 V5 V6 V9 121 M1‐M2 M3 M4 M5 M6 31 K1 K2 K3 75 V10 122 N2 32 K4 76 X1 X2 123 KK1 33 K5 (Mix of 32‐32 K6 K7) 77 X3 124 N5 KK2 34 K8 K9 K10 K11 78 P1‐P7 125 KK3 KK4 KK5 KK6 KK7 KK8 35 (None) 81 (Review with Y1‐Y5) Z1 Z4 Z5 126 JJ6 JJ8 (JJ4 JJ5 JJ7) 36 K12 K13 K14 K15 82 Z6 Z10 AA1 AA2 127 JJ1 JJ2 37 L1 L2 L3 L4 83 Z8 JJ3 38 (None) 84 Z9 41 Q1 85 AA3 42 Q3 Q13 Q14 86 AA4 43 S1 Q4 Q5 Q6 87 AA5 44 Q7 Q8 Q9 88 AA7 (AA8 is good review) 45 Q10 91 BB1 BB2
Page 3 of 25
46 Q2 92 BB3
First Nine Weeks
Standard Resources
Approximate Pacing
Number of Days
UNIT 1 Foundations for Algebra
ALCOS 7a (6a) (A‐SSE1a) Interpret parts of an expression such as terms factors and coefficients
Ch 1112 Unit 1 Pacing 10 Days
(including 1st week of school
obligations) ALCOS 3 Explain why the sum or product of two rational numbers is rational that the sum of a rational number and an irrational number is irrational and that the product of a nonzero rational number and an irrational number is irrational [N‐RN3]
Ch 16
FAL Evaluating Statements About Radicals
ALCOS 7a (A‐SSE1a) Interpret parts of an expression such as terms factors and coefficients
Ch 17
ALCOS 22 (A‐REI10) Understand that the graph of an equation in two variables is the set of all its solutions plotted in the coordinate plane often forming a curve (which could be a line)
Ch 19 FAL Interpreting Algebraic Expressions FAL Solving Equations and Identities LTF Lessons none SMALLabs Constant Velocity
Review Ch 13 14 15 16 support N-RN3
Notes Pg 22 71 is the only explicit mention for cube roots A-REI1
Page 4 of 25
Ch 18 will be covered in Ch 21 Unit 2 Solving Equations
ALCOS 12 (A‐CED1) Create equations and inequalities in one Ch 21 Ch 23 Ch 24 Ch 28 Unit 2 Pacing variable and use them to solve problems Include equations rising from linear and quadratic functions and simple rational and exponential functions
17 days
ALCOS 17 (A‐REI3) Solve linear equations and inequalities in one variable including equations with coefficients represented by letters
Ch 22 Ch 27
FAL Building and Solving Complet Equations
Note Integrate geometry questions from Ch 22 ALCOS 15 (A‐CED4) Rearrange formulas to highlight a quantity of interest using the same reasoning as in solving equations Example Rearrange Ohmrsquos law V = IR to highlight resistance R ALCOS 16 (A‐REI1) Explain each step in solving a simple equation as following the equality of numbers asserted at the previous step starting from the assumption that the original equation has a solution Construct a viable argument to justify a solution method
Ch 25
FAL Modeling Motion Rolling Cups
ALCOS 4 (N‐Q1) Use units as a way to understand problems and to guide the solution of multistep problems choose and interpret units consistently in formulas choose and interpret the scale and the origin in graphs and data displays
Ch 26
ALCOS 6 (N‐Q3) Choose a level of accuracy appropriate to limitations on measurement when reporting quantities
Ch 29 Ch 210
LTF Lessons ALCOS 4 13 Connecting a Verbal Description to a Table or Graph (15 days) Walk the Line (2 days) also partially covers 8-F5 ALCOS 15 16 17 Literal Equations ndash Reviewing and Foreshadowing (1 day) ALCOS 12 15 Linear Functions (1 day)
Dan Meyer Circle-Square
Page 5 of 25
World Record Airbag Falling Glowsticks Falling Rocks
SMALLabs Constant Velocity Chemical Titration
Unit 3 Solving Inequalities
ALCOS 17 (A‐REI3) Solve linear equations and inequalities in one variable including equations with coefficients represented by letters
Ch 31 Ch 32 Ch 33 Ch 34 Ch 36 Unit 3 Pacing 9 days
ALCOS 12 (A‐CED1) Create equations and inequalities in one variable and use them to solve problems Include equations rising from linear and quadratic functions and simple rational and exponential functions
Ch 37
LTF Lessons None
Dan Meyer Circle-Square World Record Airbag Falling Glowsticks Falling Rocks
SMALLabs Constant Velocity
Unit 4 An Introduction to Functions
Preparation Ch 41 preparation for F‐IF4
ALCOS 22 (A‐REI10) Understand that the graph of an equation in two variables is the set of all its solutions plotted in the coordinate plane often forming a curve (which could be a line)
Ch 42 Ch 43
FAL Representing Functions of Everyday Situations
Unit 4a Pacing 5 days
Page 6 of 25
812 Compare properties of two functions each represented in a different way (algebraically graphically numerically in tables or by verbal descriptions) [8‐F2]
813 Interpret the equation y = mx + b as defining a linear function whose graph is a straight line give examples of functions that are not linear [8‐F3]
Ch 42 Ch 43
ALCOS 25 (F‐IF1) Understand that a function from one set (called the domain) to another set (called the range) assigns to each element of the domain exactly one element of the range If f is a function and x is an element of its domain then f(x) denotes the output of f corresponding to the input x The graph of f is the graph of the equation y = f(x)
Ch 42 Ch 43
LTF Lessons Introduction to Function Notation Connecting a Verbal Description to Table and Graph Using Tables and Graphs to Determine the Better Deal Connecting Table Graph and Function Notation Discrete and Continuous Data
Dan Meyer Taco Cart
SMALLabs Chemistry Titration Gear Ratio Game Constant Acceleration
Page 7 of 25
Second Nine Weeks
Standard Resources
Approximate Pacing
Number of Days
ALCOS 29 (F‐IF5) Relate the domain of a function to its graph and where applicable to the quantitative relationship it describes
Ch 44 Unit 4b Pacing 10 days
ALCOS 5 (N‐Q2) Define appropriate quantities for the purpose of descriptive modeling
Ch 45
FAL Modeling Population Growth Having Kittens ALCOS 25 (F‐IF1) Understand that a function from one set (called the domain) to another set (called the range) assigns to each element of the domain exactly one element of the range If f is a function and x is an element of its domain then f(x) denotes the output of f corresponding to the input x The graph of f is the graph of the equation y = f(x)
811 Understand that a function is a rule that assigns to each input exactly one output The graph of a function is the set of ordered pairs consisting of an input and the corresponding output (Function notation is not required in Grade 8) [8‐F1]
Ch 46
ALCOS 27 (F‐IF3) Recognize that sequences are functions sometimes defined recursively whose domain is a subset of the integers
ALCOS 35 (F‐BF2) Write arithmetic and geometric sequences both recursively and with an explicit formula use them to model situations and translate between the two forms
Ch 47
FAL Generalizing Patterns Table Tiles
ALCOS 26 (F‐IF2) Use function notation evaluate functions for inputs in their domains and interpret statements that use function notation in terms of a context
Ch 47
LTF Lessons Introduction to Function Notation Connecting a Verbal Description to Table and Graph Using Tables and Graphs to Determine the Better Deal
Page 8 of 25
Connecting Table Graph and Function Notation Discrete and Continuous Data Arithmetic Sequences (MG)
Dan Meyer Taco Cart
SMALLabs Chemistry Titration Gear Ratio Game Constant Acceleration
Unit 5 Linear Functions Helpful NotesResources for Ch 5 1Ch 56 is covered in Geometry
2 Step Functions and Piece Wise functions should be covered after 58 ALCOS 37b (F‐LE1b) Recognize situations in which one quantity Ch 51 changes at a constant rate per unit interval relative to another Unit 5 Pacing
ALCOS 30 (F‐IF6) Calculate and interpret the average rate of change of a function (presented symbolically or as a table) over a specified interval Estimate the rate of change from a graph
17 days
ALCOS 13 (A‐CED2) Create equations in two or more variables to represent relationships between quantities graph equations on coordinate axes with labels and scales
Ch 52
ALCOS 36 (F‐BF3) Identify the effect on the graph of replacing f(x) by f(x) + k kf(x) f(kx) and f(x + k) for specific values of k (both positive and negative) find the value of k given the graphs Experiment with cases and illustrate an explanation of the effects on the graph using technology Include recognizing even and odd functions from their graphs and algebraic expressions for them
ALCOS 31a (F‐IF7a) Graph linear and quadratic functions and show intercepts maxima and minima
Ch 53
FAL Representing Linear and Exponential Growth
ALCOS 38 (F‐LE2) Construct linear and exponential functions including arithmetic and geometric sequences given a graph a description of a relationship or two input‐output pairs (include reading these from a table)
Ch 54
Page 9 of 25
ALCOS 34a (F‐BF1) Write a function that describes a relationship between two quantities
Ch 55
Note Concept Byte- Inverse of a Linear Function (Immediately following Ch 55)
FAL Interpreting Data Muddying the Water
ALCOS 45c (S‐ID6c) Fit a linear function for a scatter plot that suggests a linear association
ALCOS 45 (S‐ID‐6) Represent data on two quantitative variables on a scatter plot and describe how the variables are related
ALCOS 45a (S‐ID6a) Fit a function to the data use functions fitted to data to solve problems in the context of the data Use given function or choose a function suggested by the context Emphasize linear quadratic and exponential models
ALCOS 46 (S‐ID7) Interpret the slope (rate of change) and the intercept (constant term) of a linear model in the context of the data
ALCOS 40 (F‐LE5) Interpret the parameters in a linear or exponential function in terms of a context
Ch 57
Note Concept Byte- Using Residuals (Immediately following Ch 57)
FAL Interpreting Data Muddying the Water
ALCOS 45b (S‐ID6b) Informally assess the fit of a function by plotting and analyzing residuals
ALCOS 31b (F‐IF7b) Graph square root cube root and piecewise‐defined functions including step functions and absolute value functions
Ch 58
Please note there are two days for this standard so that you can cover on Piecewise and step functions
LTF Lessons Walk the Line (MG) Average Rate of Change (MG) Calculating Average Rate of Change Slope Investigation Analysis of Functions Translations of Linear Functions
Page 10 of 25
Write the equation of the Line Review Piecewise functions
Dan Meyer Taco Cart Penny Circle
Unit 6 Systems of Equations and Inequalities
810 Analyze and solve pairs of simultaneous linear equations [8‐EE8]
a Understand that solutions to a system of two linear equations in two variables correspond to points of intersection of their graphs because points of intersection satisfy both equations simultaneously [8‐EE8a]
b Solve systems of two linear equations in two variables algebraically and estimate solutions by graphing the equations Solve simple cases by inspection [8‐EE8b]
c Solve real‐world and mathematical problems leading to two linear equations in two variables [8‐EE8c]
ALCOS 20 (A‐REI6) Solve systems of linear equations exactly and approximately (eg with graphs) focusing on pairs of linear equations in two variables
ALCOS 23 (A‐REI11) Explain why the x‐coordinates of the points where the graphs of the equations y = f(x) and y = g(x) intersect are the solutions of the equation f(x) ndash g(x) find the solutions approximately eg using technology to graph the functions make tables of values or find successive approximations Include cases where f(x) andor g(x) are linear polynomial rational absolute value exponential and logarithmic functions
Ch 61-63 Unit 6a Pacing 9 days
(first half)
ALCOS 19 (A‐REI5) Prove that given a system of two equations in two variables replacing one equation by the sum of that equation and a multiple of the other produces a system with the same solutions
LTF Lessons Literal equations- Reviewing and Foreshadowing Linear Functions (MG)
Page 11 of 25
Painting the House Solving systems of Linear Equations
Dan Meyer Circle-Square
SMALLabs Constant Velocity
Page 12 of 25
Third Nine Weeks
Standard Resources
Approximate Pacing
Number of Days
ALCOS 20 (A‐REI6) Solve systems of linear equations exactly and approximately (eg with graphs) focusing on pairs of linear equations in two variables
CH 64
FAL Maximizing Profit Selling Boomerangs
Unit 6b Pacing 8 days
(second half) ALCOS 24 (A‐REI12) Graph the solutions to a linear inequality in two variables as a half‐plane (excluding the boundary in the case of a strict inequality) and graph the solution set to a system of inequalities in two variables as the intersection of the corresponding half‐planes
Ch 65 and Ch 66
Note Immediately following Ch 66 Concept Byte using Graphing Calculators
LTF Lessons Maximizing Profit
Dan Meyer Circle-Square
SMALLabs Constant Velocity
Unit 7 Exponents and Exponential Functions
ALCOS 1 (N‐RN1) Explain how the definition of the meaning of rational exponents follows from extending the properties of integer exponents to those values allowing for a notation for radicals in terms of rational exponents
Ch 71 Ch 72 Ch 73 Ch 74 Unit 7 Pacing 17 days
ALCOS 2 (N‐RN2) Rewrite expressions involving radicals and rational exponents using the properties of exponents
Ch 75
ALCOS 33 (F‐IF9) Compare properties of two functions each represented in a different way (algebraically graphically numerically in tables or by verbal descriptions)
ALCOS 32b (F‐IF8b) Use the properties of exponents to interpret expressions for exponential functions
Ch 76 and CH 77
FAL Generating Polynomials from Patterns
FAL Representing Trigonometric Functions
Page 13 of 25
ALCOS 34 (F‐BF1) Write a function that describes a relationship between two quantities
ALCOS 7b [A‐SSE1b] Interpret complicated expressions by viewing one or more of their parts as a single entity Example Interpret P(1+r)n as the product of P and a factor not depending on P ALCOS 35 (F‐BF2) Write arithmetic and geometric sequences both recursively and with an explicit formula use them to model situations and translate between the two forms
Ch 78
LTF Lessons Exponential Function Exploration Exponential Growth (Found under Mathematical Foundations) How do you start and how do you change (Non LTF Lesson available on apluscollegereadycom) Writing Equations Using Sequences Limits- A Physical Approach (MG)
Dan Meyer Super Stairs Taco Cart
Unit 8 Polynomials and Factoring
ALCOS 10 (A‐APR1) Understand that polynomials form a system Ch 81 Ch 82 Ch 83 Ch 84 Unit 8 Pacing analogous to the integers namely they are closed under the operations of addition subtraction and multiplication add subtract and multiply polynomials
FAL Representing Polynomials Graphically 17 days
ALCOS 7a (A‐SSE1a) Interpret parts of an expression such as terms factors and coefficients
ALCOS 8 (A‐SSE2) Use the structure of an expression to identify ways to rewrite it Example See x4 ndash y4 as (x2)2 ndash (y2) 2 thus recognizing it as a difference of squares that can be factored as (x2 ndash y2)(x2 + y2)
Ch 85 Ch 86 Ch 87 Ch 88
Page 14 of 25
LTF Lessons None Dan Meyer None SMALLabs None
Page 15 of 25
Fourth Nine Weeks
Standard Resources
Approximate Pacing
Number of Days
Unit 9 Quadratic Functions and Equations
ALCOS 31a (F‐IF7a) Graph linear and quadratic functions and show intercepts maxima and minima
ALCOS 33 (F‐IF9) Compare properties of two functions each represented in a different way (algebraically graphically numerically in tables or by verbal descriptions)
ALCOS 34 (F‐BF1) Write a function that describes a relationship between two quantities
ALCOS 39 (F‐LE3) Observe using graphs and tables that a quantity increasing exponentially eventually exceeds a quantity increasing linearly quadratically or (more generally) as a polynomial function
Ch 91 and Ch 92 Unit 9 Pacing 17 days
ALCOS 18b (A‐REI4b) Solve quadratic equations by inspection (eg for x2 = 49) taking square roots completing the square and the quadratic formula and factoring as appropriate to the initial form of the equation Recognize when the quadratic formula gives complex solutions and write them as a + bi for real numbers a and b
ALCOS 9a (A‐SSE3a) Factor a quadratic expression to reveal the zeros of the function it defines
ALCOS 9b (A‐SSE3b) Factor a quadratic expression to reveal the zeros of the function it defines
ALCOS 9c (AL standard) Determine a quadratic equation when given its graph or roots
Ch 93 and Ch 94
FAL Solving Quadratic Equations
FAL Representing Quadratic Functions Graphically
Page 16 of 25
ALCOS 9d (A‐SSE3c) Use the properties of exponents to transform expressions for exponential functions Example The expression 115t can be rewritten as (115112)12t = 101212t to reveal the approximate equivalent monthly interest rate if the annual rate is 15 ALCOS 31a (F‐IF8a) Use the process of factoring and completing the square in a quadratic function to show zeros extreme values and symmetry of the graph and interpret these in terms of a context
Ch 95
ALCOS 18a (A‐RE14a) Use a method of completing the square to transform any quadratic equation in x into an equation of the form (x ndash p)2 = q that has the same solutions Derive the quadratic formula from this form
Ch 96
ALCOS 37a (F‐LE1a) Prove that linear functions grow by equal differences over equal intervals and that exponential functions grow by equal factors over equal intervals
ALCOS 37 (F‐LE1) Distinguish between situations that can be modeled with linear functions and with exponential functions
ALCOS 37c (F‐LE1c) Recognize situations in which a quantity grows or decays by a constant percent rate per unit interval relative to another
ALCOS 45a (S‐ID6a) Fit a function to the data use functions fitted to data to solve problems in the context of the data Use given function or choose a function suggested by the context Emphasize linear quadratic and exponential models
ALCOS 45b (S‐ID6b) Informally assess the fit of a function by plotting and analyzing residuals
Ch 97
FAL Representing Linear and Exponential Growth
ALCOS 21 (A‐REI7) Solve a simple system of linear equation and quadratic equations in two variables algebraically and graphically
ALCOS 14 (A‐CED3) Represent constraints by equations or inequalities and by systems of equations andor inequalities and interpret solutions as viable or non‐viable options in a modeling context
Ch 98
FAL Sorting Equations of Circles 1
Page 17 of 25
Example represent inequalities describing nutritional and cost constraints on combinations of different foods
LTF Lessons Investigation- Graphing Quadratic Functions Graphing Quadratics Functions (Example 1) Analyzing Quadratic Functions(MG) Quadratic Optimization Another Way to Look at Factoring Graphing Quadratic Functions (Example 2 and problems 12)
Unit 10 Radical Expressions and Equations
821 Explain a proof of the Pythagorean Theorem and its converse [8‐G6]
822 Apply the Pythagorean Theorem to determine unknown side lengths in right triangles in real‐world and mathematical problems in two and three dimensions [8‐G7]
823 Apply the Pythagorean Theorem to find the distance between two points in a coordinate system [8‐G8]
ALCOS 31b (F‐IF7b) Graph square root cube root and piecewise‐defined functions including step functions and absolute value functions
Ch 10 1 102 103 and 105 (104 is helpful but optional)
Please note 1 Section 101 is not required for high school 2 Section 105 can be taught after the End Of Course Exam 3Graphing Calculators are a great resource for
section 105
FAL Proving the Pythagorean Theorem
FAL Classifying Rational and Irrational Numbers
Unit 10 Pacing 7 days
LTF Lessons Pythagorean Theorem Applications Brenna Rescues Andrew
Unit 11 Rational Expressions and Functions
ALCOS 11 (A‐APR7) Understand that rational expressions form a Ch 111 112 113 and Ch 114 Unit 11 system analogous to the rational numbers closed under addition Please Note 111 is not a standard but prepares Pacing subtraction multiplication and division by a nonzero rational for 112 17 days expression add subtract multiply and divide rational expressions ALCOS 12 (A‐CED1) Create equations and inequalities in one variable and use them to solve problems Include equations rising
Ch 115
FAL Representing Inequalities Graphically Page 18 of 25
from linear and quadratic functions and simple rational and exponential functions ALCOS 29 (F‐IF5) Relate the domain of a function to its graph and where applicable to the quantitative relationship it describes
Ch 116
814 Construct a function to model a linear relationship between two quantities Determine the rate of change and initial value of the function from a description of a relationship or from two (x y) values including reading these from a table or from a graph Interpret the rate of change and initial value of a linear function in terms of the situation it models and in terms of its graph or a table of values [8‐F4]
815 Describe qualitatively the functional relationship between two quantities by analyzing a graph (eg where the function is increasing or decreasing linear or nonlinear) Sketch a graph that exhibits the qualitative features of a function that has been described verbally [8‐F5]
ALCOS 28 (F‐IF4) For a function that models a relationship between two quantities interpret key features of graphs and tables in terms of the quantities and sketch graphs showing key features given a verbal description of the relationship Key features include intercepts relative maximums and minimums symmetries end behavior and periodicity
Ch 117
LTF Lessons Analysis of Functions Quadratic Optimization Characteristics of Functions Transformations of Functions Explorations EvenOdd Functions
Dan Meyer Circle-Square
Unit 12 Data Analysis
ALCOS 41 (S‐ID1) Represent data with plots on the real number line (dot plots histograms and box plots)
Ch 122 Unit 12 Pacing 10 days
Page 19 of 25
ALCOS 42 (S‐ID2) Use statistics appropriate to the shape of the data distribution to compare center (median mean) and spread (interquartile range standard deviation) of two or more different data sets
Ch 123 and Ch 124
FAL Representing Data with Frequency Graphs
825 Construct and interpret scatter plots for bivariate measurement data to investigate patterns of association between two quantities Describe patterns such as clustering outliers positive or negative association linear association and nonlinear association [8‐SP1]
826 Know that straight lines are widely used to model relationships between two quantitative variables For scatter plots that suggest a linear association informally fit a straight line and informally assess the model fit by judging the closeness of the data points to the line [8‐SP2]
827 Use the equation of a linear model to solve problems in the context of bivariate measurement data interpreting the slope and intercept [8‐SP3]
828 Understand that patterns of association can also be seen in bivariate categorical data by displaying frequencies and relative frequencies in a two‐way table Construct and interpret a two‐way table summarizing data on two categorical variables collected from the same subjects Use relative frequencies calculated for rows or columns to describe possible association between the two variables [8‐SP4]
ALCOS 43 (S‐ID3) Interpret differences in shape center and spread in the context of the data sets accounting for possible effects of extreme data points (outliers)
ALCOS 44 (S‐ID5) Summarize categorical data for two categories in two‐way frequency tables Interpret relative frequencies in the context of the data (including joint marginal and conditional relative frequencies) Recognize possible associations and trends in the data
Ch 125
FAL Representing Data with Box Plots
FAL Devising a Measure Correlation
ALCOS 47 (S‐CP2) Understand that two events A and B are independent if the probability of A and B occurring together is the
Ch 128
Page 20 of 25
product of their probabilities and use this characterization to determine if they are independent
FAL Representing Conditional Probabilities 1
FAL Representing Conditional Probability Medical Testing
FAL Representing Conditional Probability 2 LTF Lessons Fitting a Line to Data Use Dotplots (Line Plots) to Determine Mean Median Mode and Range Analyzing Mean Median Mode and Range Describing Distributions Standard Deviation Movie Probability (MG) Does Gender Make a Difference
Dan Meyer Penny Circle
Page 21 of 25
Listed below are the technology standards for grades six through twelve You are to make every effort to incorporate the applicable standards into your daily classroom lessons These standards should be noted in your lesson plans
Alabama Technology Standards 6th ndash 8th Grades
Technology Operations and Concepts Students will
1 Appraise technology systems to determine software and hardware compatibility
2 Publish digital products that communicate curriculum concepts Examples Web pages videos podcasts multimedia presentations
3 Explain how network systems are connected and used Examples file sharing collaborating wireless networking
4 Determine basic troubleshooting strategies to correct common hardware and software problems Examples checking connections restarting equipment creating a backup copy of digital data Describing the importance of antivirus and security software
5 Use basic features of word processing spreadsheets databases and presentation software Examples word processingmdashreports letters brochures spreadsheetsmdashdiscovering patterns tracking spending creating budgets databasesmdashcontact list of addresses and telephone numbers presentation softwaremdashslideshow
6 Select specific digital tools for completing curriculum‐related tasks Examples spreadsheet for budgets word processing software for essays probes for data collection
7 Demonstrate correct keyboarding techniques
Page 22 of 25
Digital Citizenship
8 Identify safe uses of social networking and electronic communication Recognizing dangers of online predators Protecting personal information online
9 Practice responsible and legal use of technology systems and digital content Examples avoiding plagiarism complying with acceptable‐use policies copyright laws and fair use standards recognizing secure Web sites Identifying examples of computer crime and related penalties Examples computer crimemdashphishing spoofing virus and worm dissemination cyberbullying penaltiesmdashfines incarceration Citing sources of digital content
10 Describe advances in technology and effects of each on the workplace and society Examples agriculture manufacturing medicine warfare transportation communication education
Research and Information Fluency
11 Use digital tools and strategies to locate collect organize evaluate and synthesize information Examples locatingmdashBoolean searches graphic organizers spreadsheets databases collectingmdashprobeware graphing calculators organizingmdashgraphic organizers spreadsheets evaluatingmdashreviewing publication dates determining credibility synthesizingmdashword processing software concept‐mapping software
Communication and Collaboration
12 Use digital tools to communicate and collaborate at all levels from interpersonal to global Examples instant messages e‐mail blogs wikis collaborative authoring tools online learning communities Demonstrating digital file transfer Examples attaching uploading downloading
Critical Thinking Problem Solving and Decision Making
13 Use digital tools to formulate solutions to authentic problems Examples electronic graphing tools probes spreadsheets
Page 23 of 25
Creativity and Innovation
14 Use digital tools to generate new ideas products or processes Examples ideasmdashpredictions trends productsmdashanimation video processesmdashmodels simulations
Alabama Technology Standards 9th ndash 12th Grade
Operations and Concepts
Students will
2 Diagnose hardware and software problems Examples viruses error messages Applying strategies to correct malfunctioning hardware and software Performing routine hardware maintenance Describing the importance of antivirus and security software
3 Demonstrate advanced technology skills including compressing converting importing exporting and backing up files Transferring data among applications Demonstrating digital file transfer Examples attaching uploading downloading
4 Utilize advanced features of word processing software including outlining tracking changes hyperlinking and mail merging
5 Utilize advanced features of spreadsheet software including creating charts and graphs sorting and filtering data creating formulas and applying functions
6 Utilize advanced features of multimedia software including image video and audio editing
Digital Citizenship
9 Practice ethical and legal use of technology systems and digital content Explaining consequences of illegal and unethical use of technology systems and digital content Examples cyberbullying plagiarism Interpreting copyright laws and policies with regard to ownership and use of digital content
Page 24 of 25
Citing sources of digital content using a style manual Examples Modern Language Association (MLA) American Psychological Association (APA)
Research and Information Fluency
11 Critique digital content for validity accuracy bias currency and relevance
Communication and Collaboration
12 Use digital tools to publish curriculum‐related content Examples Web page authoring software coding software wikis blogs podcasts
13 Demonstrate collaborative skills using curriculum‐related content in digital environments Examples completing assignments online interacting with experts and peers in a structured online learning environment
Critical Thinking Problem Solving and Decision Making
14 Use digital tools to defend solutions to authentic problems Example disaggregating data electronically
Creativity and Innovation
15 Create a product that integrates information from multiple software applications Example pasting spreadsheet‐generated charts into a presentation
Page 25 of 25
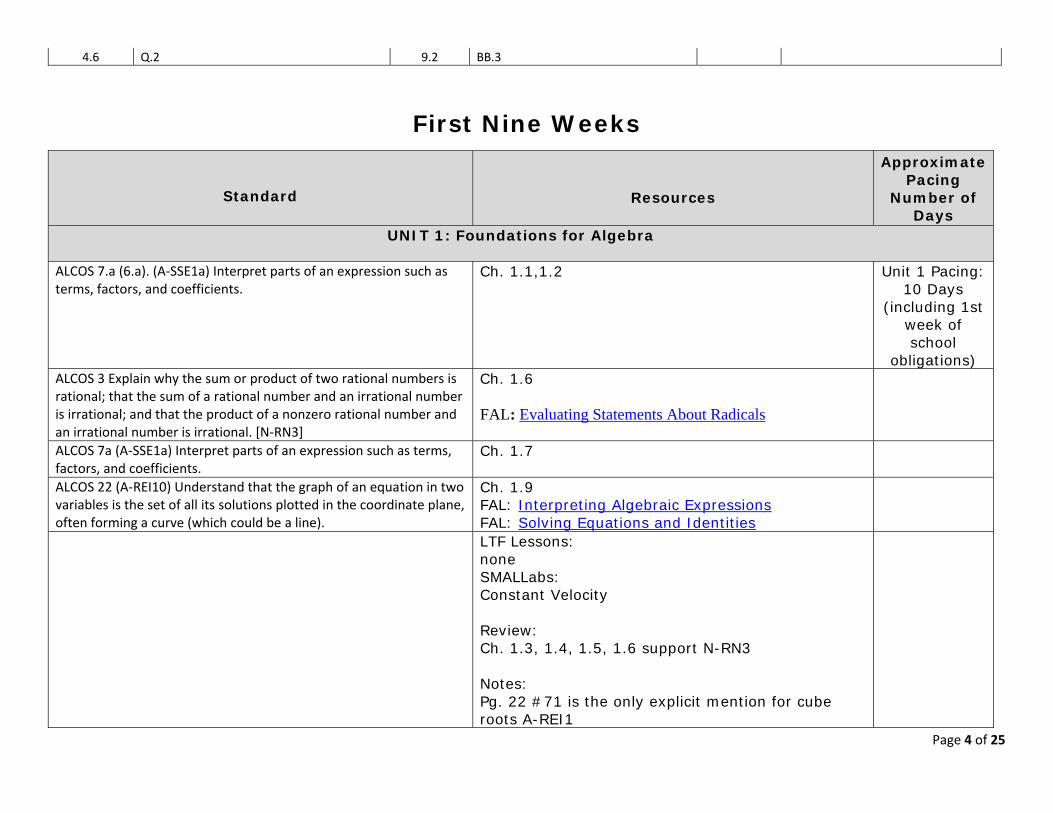
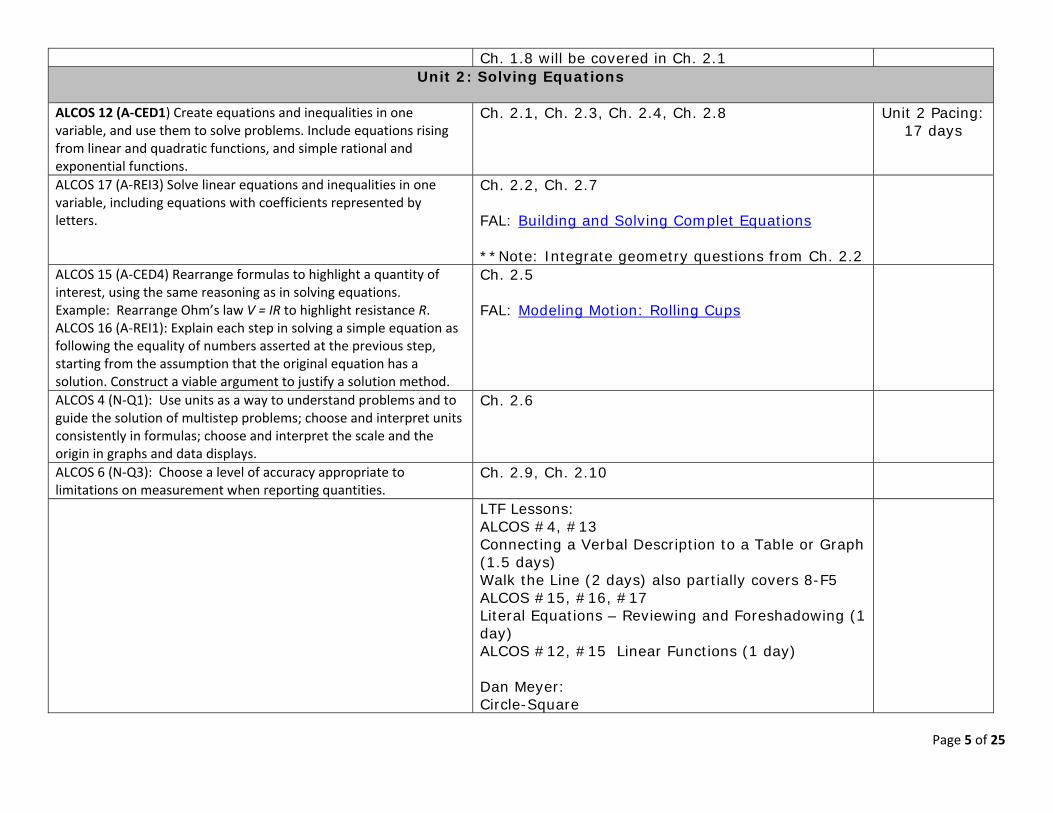
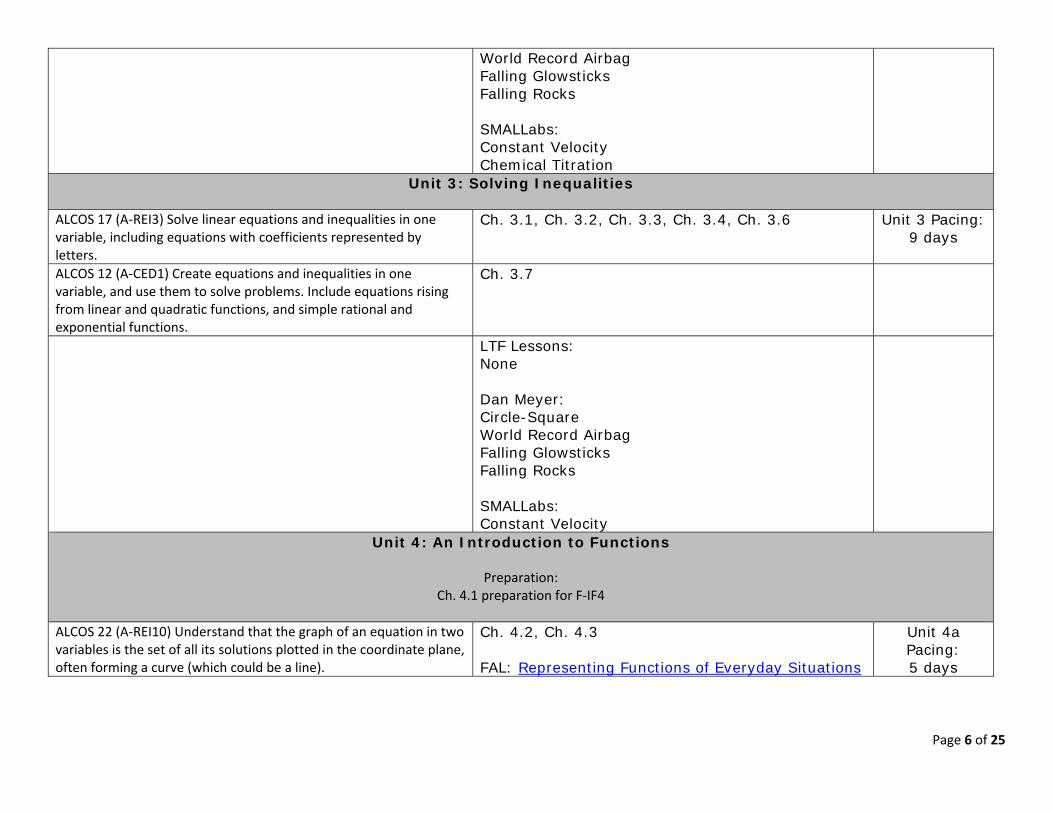
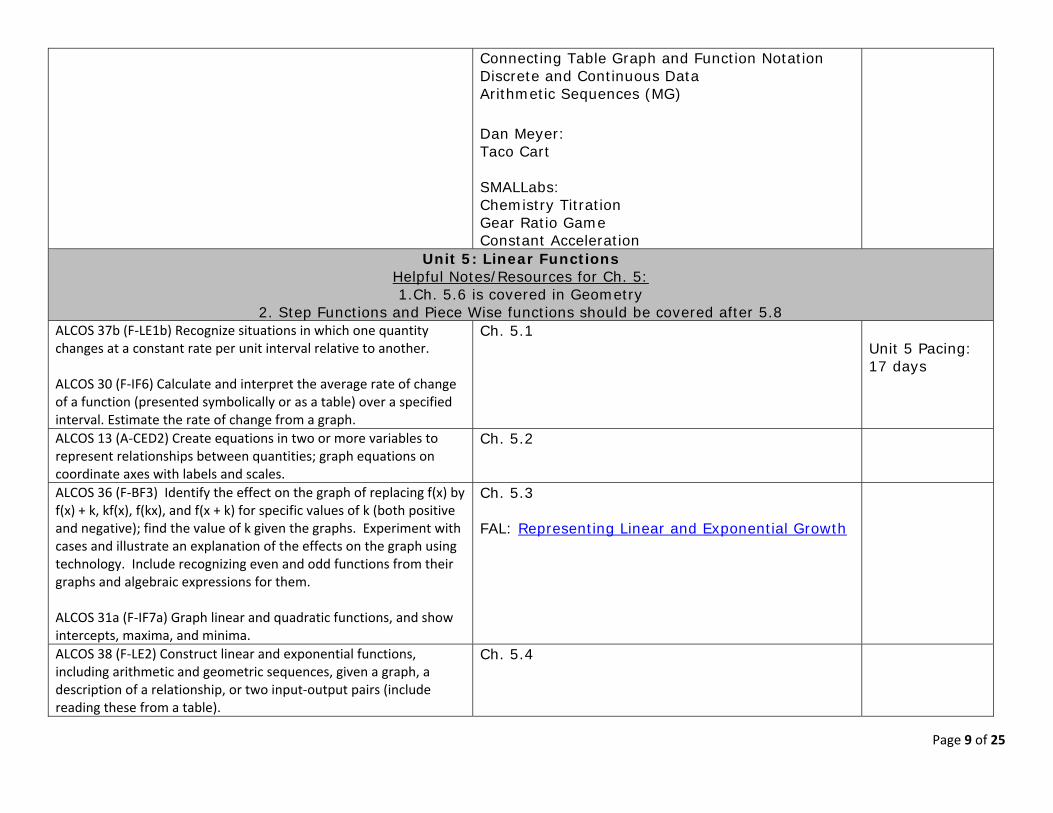
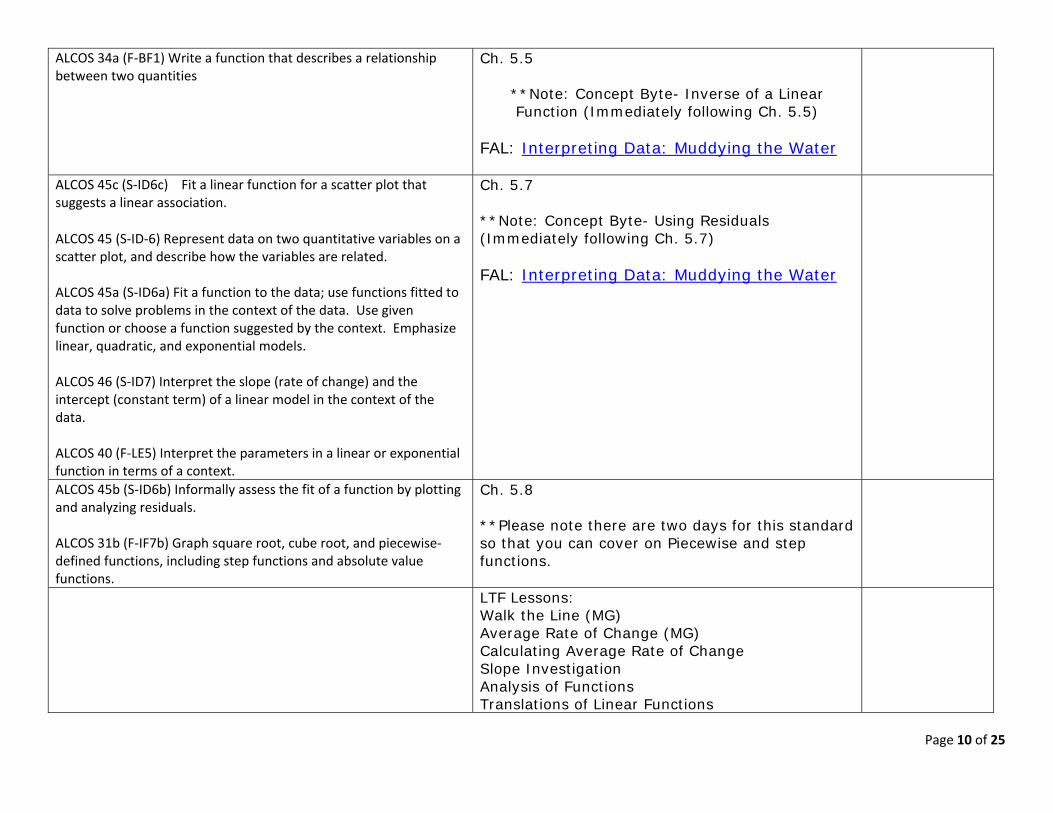
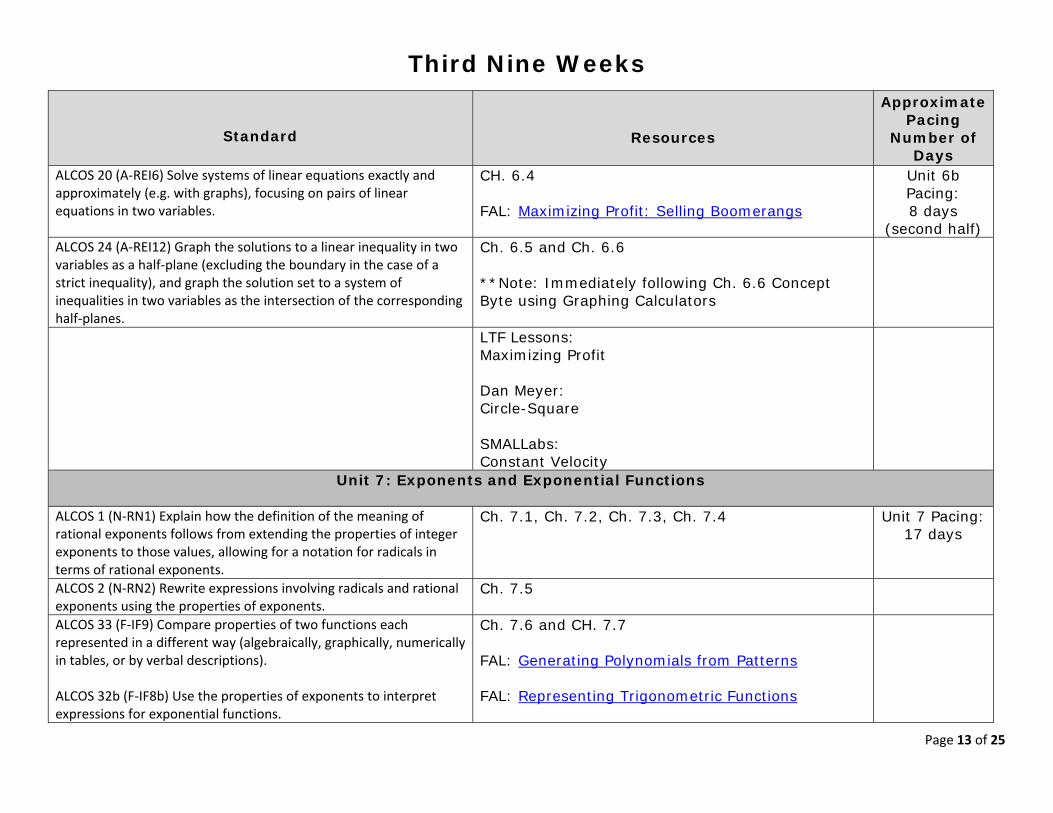
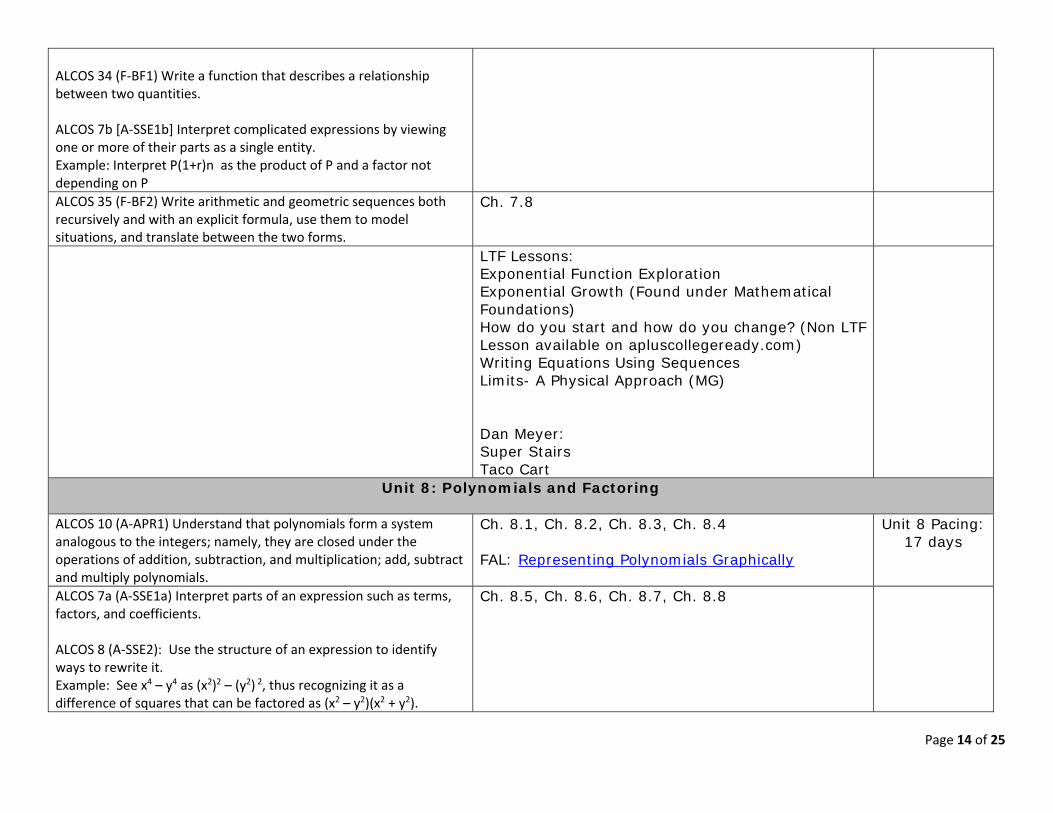
ALCOS 34 (F‐BF1) Write a function that describes a relationship between two quantities
ALCOS 7b [A‐SSE1b] Interpret complicated expressions by viewing one or more of their parts as a single entity Example Interpret P(1+r)n as the product of P and a factor not depending on P ALCOS 35 (F‐BF2) Write arithmetic and geometric sequences both recursively and with an explicit formula use them to model situations and translate between the two forms
Ch 78
LTF Lessons Exponential Function Exploration Exponential Growth (Found under Mathematical Foundations) How do you start and how do you change (Non LTF Lesson available on apluscollegereadycom) Writing Equations Using Sequences Limits- A Physical Approach (MG)
Dan Meyer Super Stairs Taco Cart
Unit 8 Polynomials and Factoring
ALCOS 10 (A‐APR1) Understand that polynomials form a system Ch 81 Ch 82 Ch 83 Ch 84 Unit 8 Pacing analogous to the integers namely they are closed under the operations of addition subtraction and multiplication add subtract and multiply polynomials
FAL Representing Polynomials Graphically 17 days
ALCOS 7a (A‐SSE1a) Interpret parts of an expression such as terms factors and coefficients
ALCOS 8 (A‐SSE2) Use the structure of an expression to identify ways to rewrite it Example See x4 ndash y4 as (x2)2 ndash (y2) 2 thus recognizing it as a difference of squares that can be factored as (x2 ndash y2)(x2 + y2)
Ch 85 Ch 86 Ch 87 Ch 88
Page 14 of 25
LTF Lessons None Dan Meyer None SMALLabs None
Page 15 of 25
Fourth Nine Weeks
Standard Resources
Approximate Pacing
Number of Days
Unit 9 Quadratic Functions and Equations
ALCOS 31a (F‐IF7a) Graph linear and quadratic functions and show intercepts maxima and minima
ALCOS 33 (F‐IF9) Compare properties of two functions each represented in a different way (algebraically graphically numerically in tables or by verbal descriptions)
ALCOS 34 (F‐BF1) Write a function that describes a relationship between two quantities
ALCOS 39 (F‐LE3) Observe using graphs and tables that a quantity increasing exponentially eventually exceeds a quantity increasing linearly quadratically or (more generally) as a polynomial function
Ch 91 and Ch 92 Unit 9 Pacing 17 days
ALCOS 18b (A‐REI4b) Solve quadratic equations by inspection (eg for x2 = 49) taking square roots completing the square and the quadratic formula and factoring as appropriate to the initial form of the equation Recognize when the quadratic formula gives complex solutions and write them as a + bi for real numbers a and b
ALCOS 9a (A‐SSE3a) Factor a quadratic expression to reveal the zeros of the function it defines
ALCOS 9b (A‐SSE3b) Factor a quadratic expression to reveal the zeros of the function it defines
ALCOS 9c (AL standard) Determine a quadratic equation when given its graph or roots
Ch 93 and Ch 94
FAL Solving Quadratic Equations
FAL Representing Quadratic Functions Graphically
Page 16 of 25
ALCOS 9d (A‐SSE3c) Use the properties of exponents to transform expressions for exponential functions Example The expression 115t can be rewritten as (115112)12t = 101212t to reveal the approximate equivalent monthly interest rate if the annual rate is 15 ALCOS 31a (F‐IF8a) Use the process of factoring and completing the square in a quadratic function to show zeros extreme values and symmetry of the graph and interpret these in terms of a context
Ch 95
ALCOS 18a (A‐RE14a) Use a method of completing the square to transform any quadratic equation in x into an equation of the form (x ndash p)2 = q that has the same solutions Derive the quadratic formula from this form
Ch 96
ALCOS 37a (F‐LE1a) Prove that linear functions grow by equal differences over equal intervals and that exponential functions grow by equal factors over equal intervals
ALCOS 37 (F‐LE1) Distinguish between situations that can be modeled with linear functions and with exponential functions
ALCOS 37c (F‐LE1c) Recognize situations in which a quantity grows or decays by a constant percent rate per unit interval relative to another
ALCOS 45a (S‐ID6a) Fit a function to the data use functions fitted to data to solve problems in the context of the data Use given function or choose a function suggested by the context Emphasize linear quadratic and exponential models
ALCOS 45b (S‐ID6b) Informally assess the fit of a function by plotting and analyzing residuals
Ch 97
FAL Representing Linear and Exponential Growth
ALCOS 21 (A‐REI7) Solve a simple system of linear equation and quadratic equations in two variables algebraically and graphically
ALCOS 14 (A‐CED3) Represent constraints by equations or inequalities and by systems of equations andor inequalities and interpret solutions as viable or non‐viable options in a modeling context
Ch 98
FAL Sorting Equations of Circles 1
Page 17 of 25
Example represent inequalities describing nutritional and cost constraints on combinations of different foods
LTF Lessons Investigation- Graphing Quadratic Functions Graphing Quadratics Functions (Example 1) Analyzing Quadratic Functions(MG) Quadratic Optimization Another Way to Look at Factoring Graphing Quadratic Functions (Example 2 and problems 12)
Unit 10 Radical Expressions and Equations
821 Explain a proof of the Pythagorean Theorem and its converse [8‐G6]
822 Apply the Pythagorean Theorem to determine unknown side lengths in right triangles in real‐world and mathematical problems in two and three dimensions [8‐G7]
823 Apply the Pythagorean Theorem to find the distance between two points in a coordinate system [8‐G8]
ALCOS 31b (F‐IF7b) Graph square root cube root and piecewise‐defined functions including step functions and absolute value functions
Ch 10 1 102 103 and 105 (104 is helpful but optional)
Please note 1 Section 101 is not required for high school 2 Section 105 can be taught after the End Of Course Exam 3Graphing Calculators are a great resource for
section 105
FAL Proving the Pythagorean Theorem
FAL Classifying Rational and Irrational Numbers
Unit 10 Pacing 7 days
LTF Lessons Pythagorean Theorem Applications Brenna Rescues Andrew
Unit 11 Rational Expressions and Functions
ALCOS 11 (A‐APR7) Understand that rational expressions form a Ch 111 112 113 and Ch 114 Unit 11 system analogous to the rational numbers closed under addition Please Note 111 is not a standard but prepares Pacing subtraction multiplication and division by a nonzero rational for 112 17 days expression add subtract multiply and divide rational expressions ALCOS 12 (A‐CED1) Create equations and inequalities in one variable and use them to solve problems Include equations rising
Ch 115
FAL Representing Inequalities Graphically Page 18 of 25
from linear and quadratic functions and simple rational and exponential functions ALCOS 29 (F‐IF5) Relate the domain of a function to its graph and where applicable to the quantitative relationship it describes
Ch 116
814 Construct a function to model a linear relationship between two quantities Determine the rate of change and initial value of the function from a description of a relationship or from two (x y) values including reading these from a table or from a graph Interpret the rate of change and initial value of a linear function in terms of the situation it models and in terms of its graph or a table of values [8‐F4]
815 Describe qualitatively the functional relationship between two quantities by analyzing a graph (eg where the function is increasing or decreasing linear or nonlinear) Sketch a graph that exhibits the qualitative features of a function that has been described verbally [8‐F5]
ALCOS 28 (F‐IF4) For a function that models a relationship between two quantities interpret key features of graphs and tables in terms of the quantities and sketch graphs showing key features given a verbal description of the relationship Key features include intercepts relative maximums and minimums symmetries end behavior and periodicity
Ch 117
LTF Lessons Analysis of Functions Quadratic Optimization Characteristics of Functions Transformations of Functions Explorations EvenOdd Functions
Dan Meyer Circle-Square
Unit 12 Data Analysis
ALCOS 41 (S‐ID1) Represent data with plots on the real number line (dot plots histograms and box plots)
Ch 122 Unit 12 Pacing 10 days
Page 19 of 25
ALCOS 42 (S‐ID2) Use statistics appropriate to the shape of the data distribution to compare center (median mean) and spread (interquartile range standard deviation) of two or more different data sets
Ch 123 and Ch 124
FAL Representing Data with Frequency Graphs
825 Construct and interpret scatter plots for bivariate measurement data to investigate patterns of association between two quantities Describe patterns such as clustering outliers positive or negative association linear association and nonlinear association [8‐SP1]
826 Know that straight lines are widely used to model relationships between two quantitative variables For scatter plots that suggest a linear association informally fit a straight line and informally assess the model fit by judging the closeness of the data points to the line [8‐SP2]
827 Use the equation of a linear model to solve problems in the context of bivariate measurement data interpreting the slope and intercept [8‐SP3]
828 Understand that patterns of association can also be seen in bivariate categorical data by displaying frequencies and relative frequencies in a two‐way table Construct and interpret a two‐way table summarizing data on two categorical variables collected from the same subjects Use relative frequencies calculated for rows or columns to describe possible association between the two variables [8‐SP4]
ALCOS 43 (S‐ID3) Interpret differences in shape center and spread in the context of the data sets accounting for possible effects of extreme data points (outliers)
ALCOS 44 (S‐ID5) Summarize categorical data for two categories in two‐way frequency tables Interpret relative frequencies in the context of the data (including joint marginal and conditional relative frequencies) Recognize possible associations and trends in the data
Ch 125
FAL Representing Data with Box Plots
FAL Devising a Measure Correlation
ALCOS 47 (S‐CP2) Understand that two events A and B are independent if the probability of A and B occurring together is the
Ch 128
Page 20 of 25
product of their probabilities and use this characterization to determine if they are independent
FAL Representing Conditional Probabilities 1
FAL Representing Conditional Probability Medical Testing
FAL Representing Conditional Probability 2 LTF Lessons Fitting a Line to Data Use Dotplots (Line Plots) to Determine Mean Median Mode and Range Analyzing Mean Median Mode and Range Describing Distributions Standard Deviation Movie Probability (MG) Does Gender Make a Difference
Dan Meyer Penny Circle
Page 21 of 25
Listed below are the technology standards for grades six through twelve You are to make every effort to incorporate the applicable standards into your daily classroom lessons These standards should be noted in your lesson plans
Alabama Technology Standards 6th ndash 8th Grades
Technology Operations and Concepts Students will
1 Appraise technology systems to determine software and hardware compatibility
2 Publish digital products that communicate curriculum concepts Examples Web pages videos podcasts multimedia presentations
3 Explain how network systems are connected and used Examples file sharing collaborating wireless networking
4 Determine basic troubleshooting strategies to correct common hardware and software problems Examples checking connections restarting equipment creating a backup copy of digital data Describing the importance of antivirus and security software
5 Use basic features of word processing spreadsheets databases and presentation software Examples word processingmdashreports letters brochures spreadsheetsmdashdiscovering patterns tracking spending creating budgets databasesmdashcontact list of addresses and telephone numbers presentation softwaremdashslideshow
6 Select specific digital tools for completing curriculum‐related tasks Examples spreadsheet for budgets word processing software for essays probes for data collection
7 Demonstrate correct keyboarding techniques
Page 22 of 25
Digital Citizenship
8 Identify safe uses of social networking and electronic communication Recognizing dangers of online predators Protecting personal information online
9 Practice responsible and legal use of technology systems and digital content Examples avoiding plagiarism complying with acceptable‐use policies copyright laws and fair use standards recognizing secure Web sites Identifying examples of computer crime and related penalties Examples computer crimemdashphishing spoofing virus and worm dissemination cyberbullying penaltiesmdashfines incarceration Citing sources of digital content
10 Describe advances in technology and effects of each on the workplace and society Examples agriculture manufacturing medicine warfare transportation communication education
Research and Information Fluency
11 Use digital tools and strategies to locate collect organize evaluate and synthesize information Examples locatingmdashBoolean searches graphic organizers spreadsheets databases collectingmdashprobeware graphing calculators organizingmdashgraphic organizers spreadsheets evaluatingmdashreviewing publication dates determining credibility synthesizingmdashword processing software concept‐mapping software
Communication and Collaboration
12 Use digital tools to communicate and collaborate at all levels from interpersonal to global Examples instant messages e‐mail blogs wikis collaborative authoring tools online learning communities Demonstrating digital file transfer Examples attaching uploading downloading
Critical Thinking Problem Solving and Decision Making
13 Use digital tools to formulate solutions to authentic problems Examples electronic graphing tools probes spreadsheets
Page 23 of 25
Creativity and Innovation
14 Use digital tools to generate new ideas products or processes Examples ideasmdashpredictions trends productsmdashanimation video processesmdashmodels simulations
Alabama Technology Standards 9th ndash 12th Grade
Operations and Concepts
Students will
2 Diagnose hardware and software problems Examples viruses error messages Applying strategies to correct malfunctioning hardware and software Performing routine hardware maintenance Describing the importance of antivirus and security software
3 Demonstrate advanced technology skills including compressing converting importing exporting and backing up files Transferring data among applications Demonstrating digital file transfer Examples attaching uploading downloading
4 Utilize advanced features of word processing software including outlining tracking changes hyperlinking and mail merging
5 Utilize advanced features of spreadsheet software including creating charts and graphs sorting and filtering data creating formulas and applying functions
6 Utilize advanced features of multimedia software including image video and audio editing
Digital Citizenship
9 Practice ethical and legal use of technology systems and digital content Explaining consequences of illegal and unethical use of technology systems and digital content Examples cyberbullying plagiarism Interpreting copyright laws and policies with regard to ownership and use of digital content
Page 24 of 25
Citing sources of digital content using a style manual Examples Modern Language Association (MLA) American Psychological Association (APA)
Research and Information Fluency
11 Critique digital content for validity accuracy bias currency and relevance
Communication and Collaboration
12 Use digital tools to publish curriculum‐related content Examples Web page authoring software coding software wikis blogs podcasts
13 Demonstrate collaborative skills using curriculum‐related content in digital environments Examples completing assignments online interacting with experts and peers in a structured online learning environment
Critical Thinking Problem Solving and Decision Making
14 Use digital tools to defend solutions to authentic problems Example disaggregating data electronically
Creativity and Innovation
15 Create a product that integrates information from multiple software applications Example pasting spreadsheet‐generated charts into a presentation
Page 25 of 25
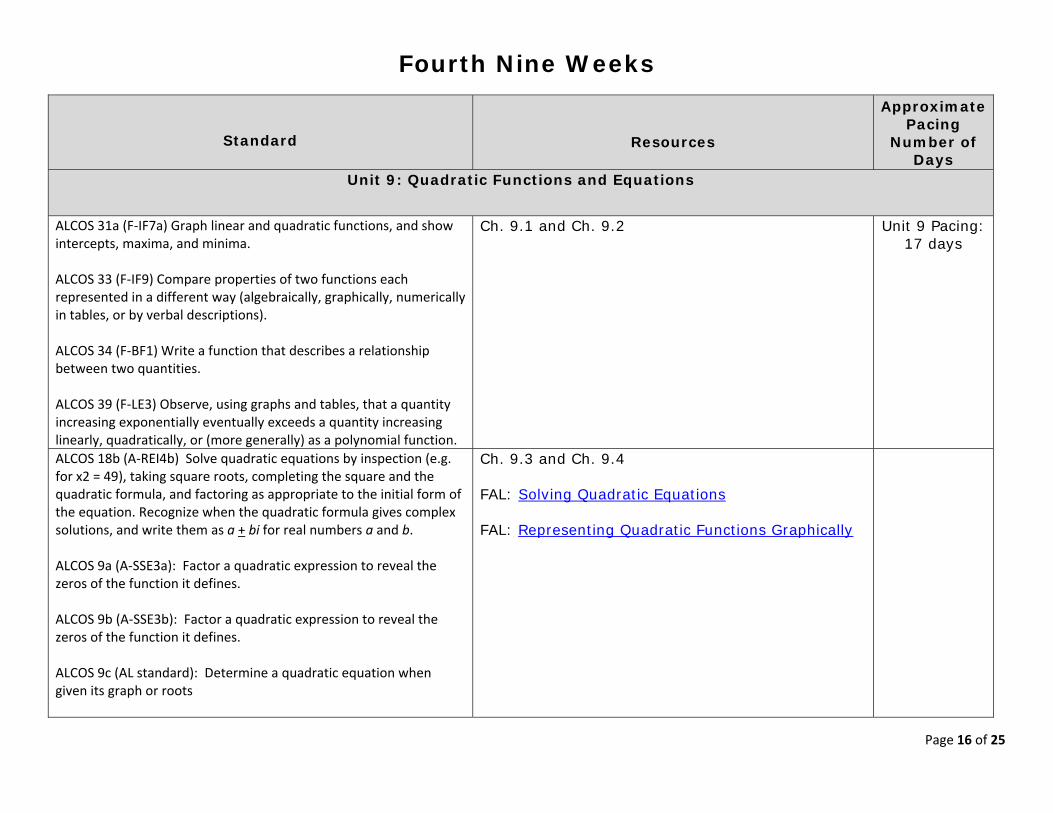
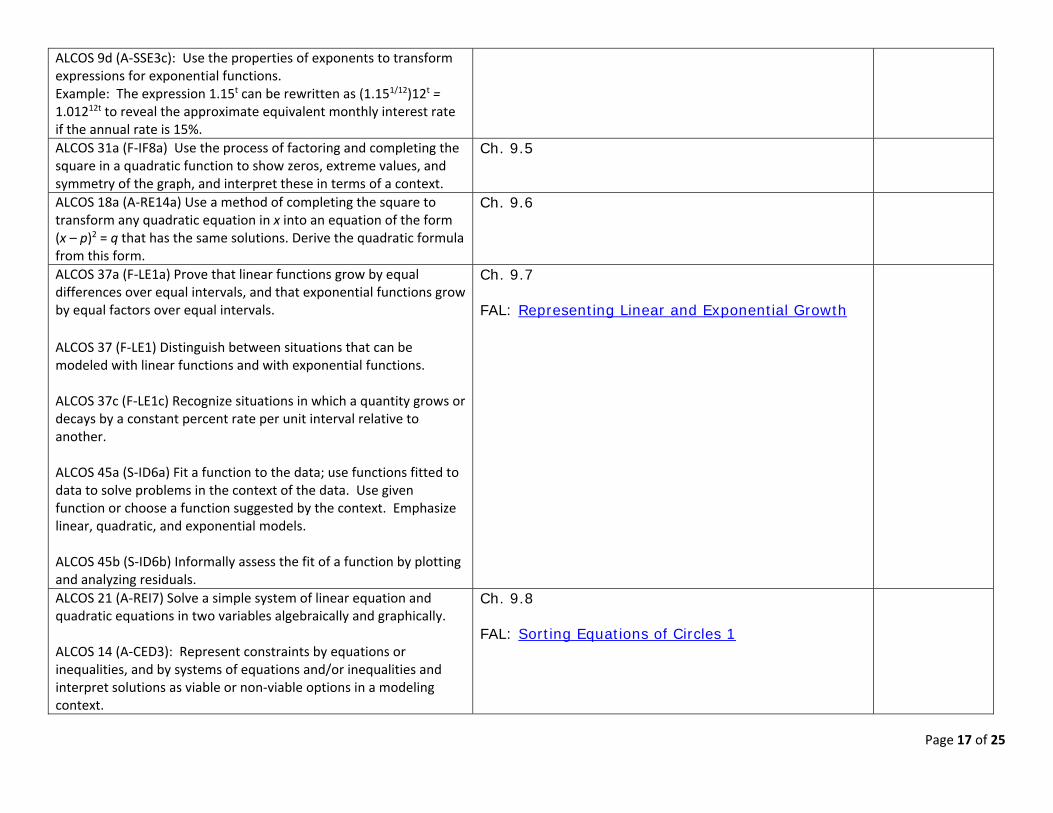
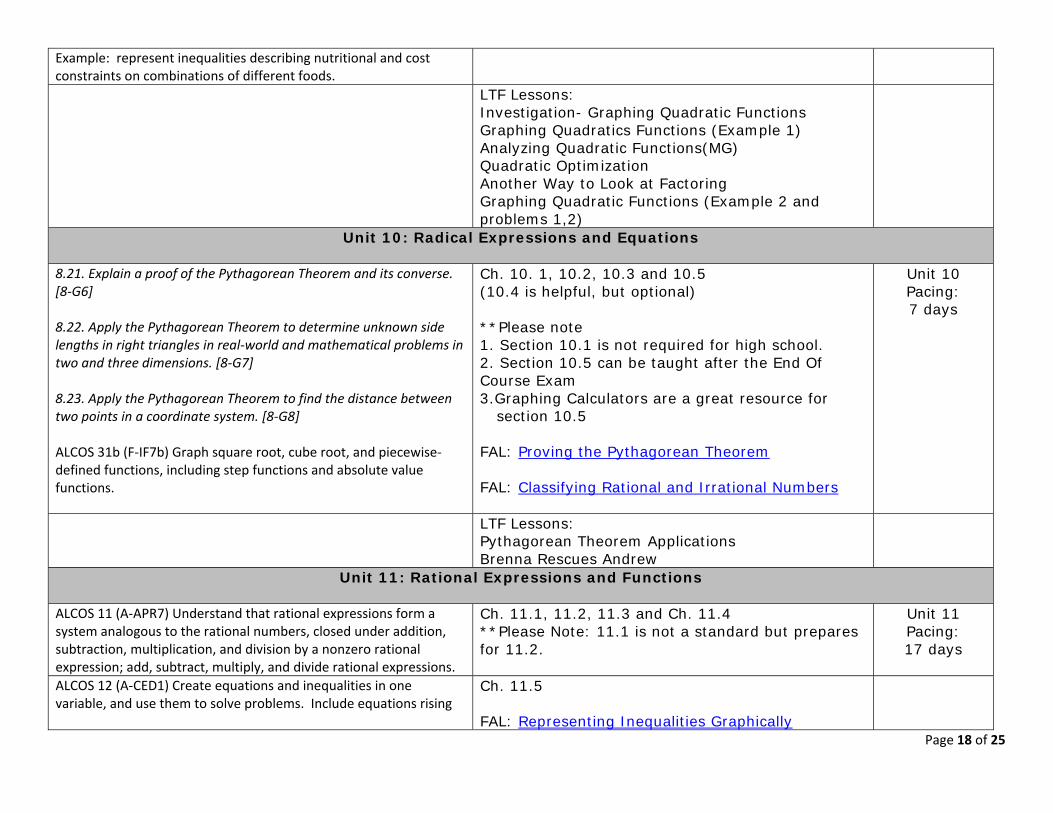
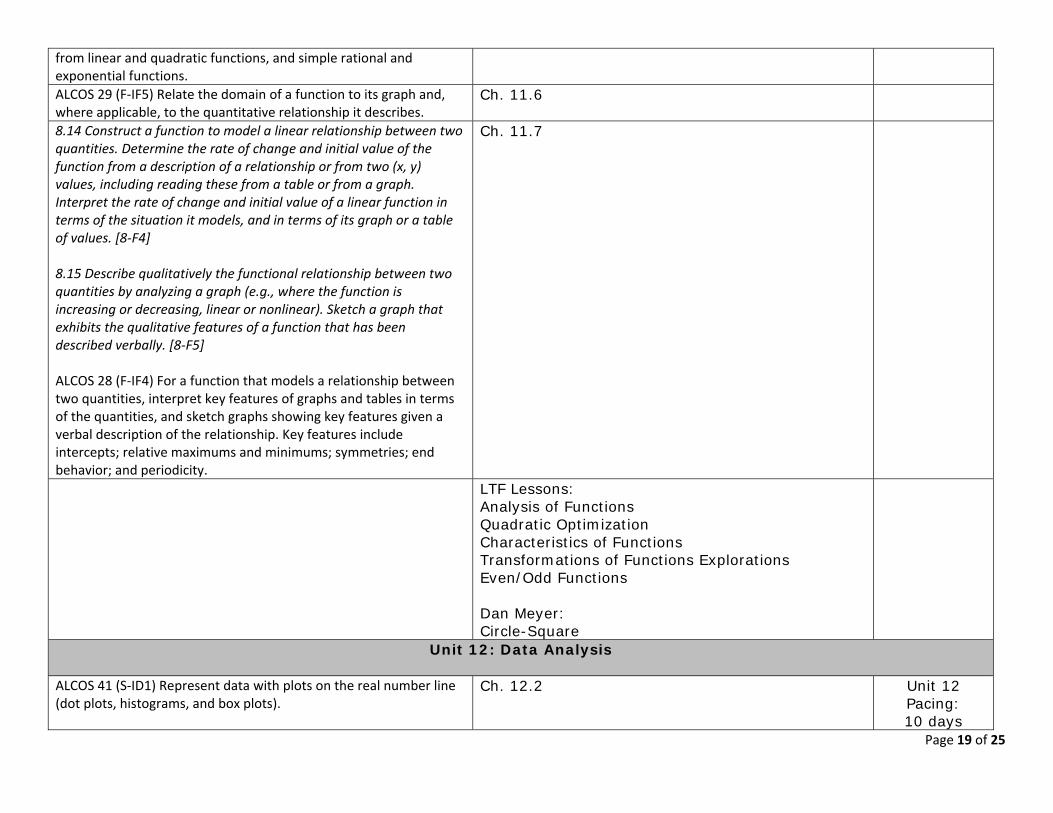
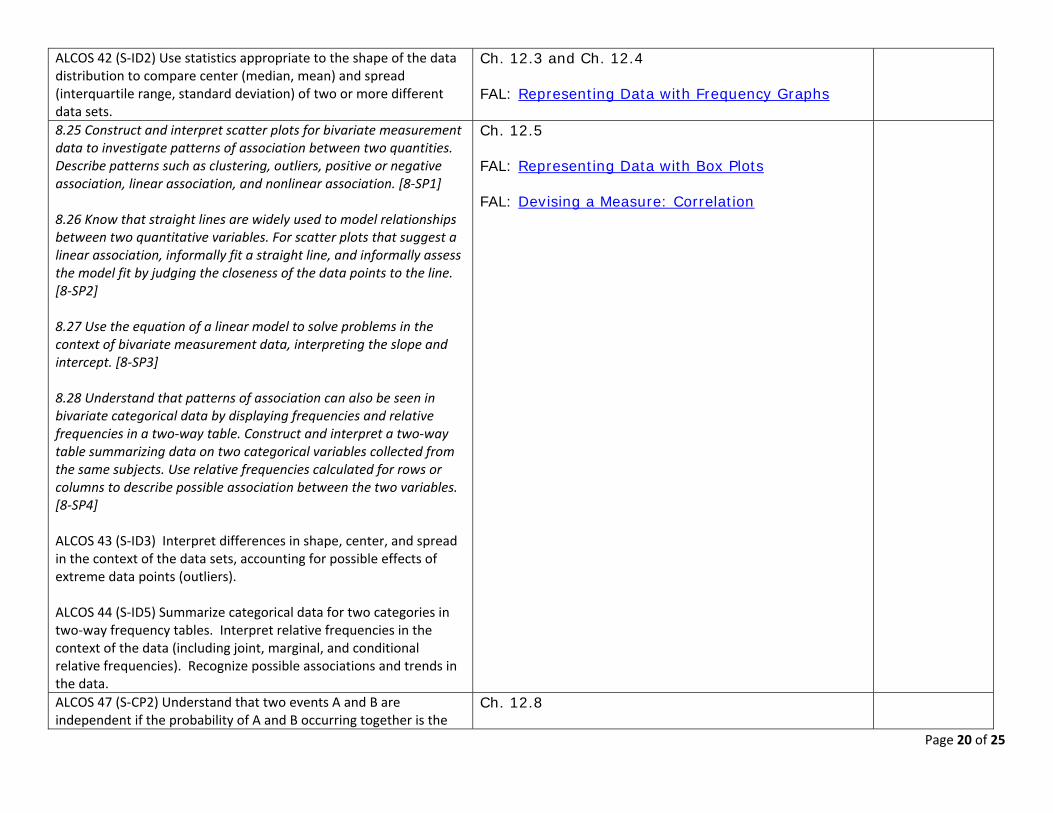
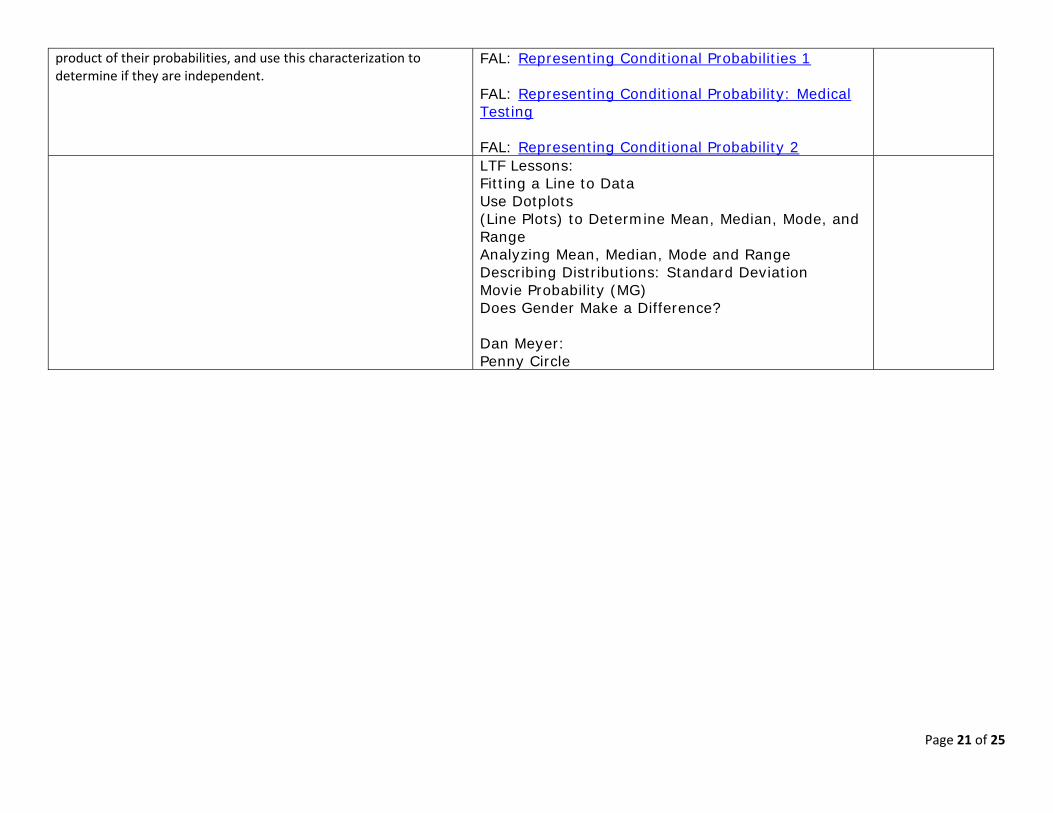

Digital Citizenship
8 Identify safe uses of social networking and electronic communication Recognizing dangers of online predators Protecting personal information online
9 Practice responsible and legal use of technology systems and digital content Examples avoiding plagiarism complying with acceptable‐use policies copyright laws and fair use standards recognizing secure Web sites Identifying examples of computer crime and related penalties Examples computer crimemdashphishing spoofing virus and worm dissemination cyberbullying penaltiesmdashfines incarceration Citing sources of digital content
10 Describe advances in technology and effects of each on the workplace and society Examples agriculture manufacturing medicine warfare transportation communication education
Research and Information Fluency
11 Use digital tools and strategies to locate collect organize evaluate and synthesize information Examples locatingmdashBoolean searches graphic organizers spreadsheets databases collectingmdashprobeware graphing calculators organizingmdashgraphic organizers spreadsheets evaluatingmdashreviewing publication dates determining credibility synthesizingmdashword processing software concept‐mapping software
Communication and Collaboration
12 Use digital tools to communicate and collaborate at all levels from interpersonal to global Examples instant messages e‐mail blogs wikis collaborative authoring tools online learning communities Demonstrating digital file transfer Examples attaching uploading downloading
Critical Thinking Problem Solving and Decision Making
13 Use digital tools to formulate solutions to authentic problems Examples electronic graphing tools probes spreadsheets
Page 23 of 25
Creativity and Innovation
14 Use digital tools to generate new ideas products or processes Examples ideasmdashpredictions trends productsmdashanimation video processesmdashmodels simulations
Alabama Technology Standards 9th ndash 12th Grade
Operations and Concepts
Students will
2 Diagnose hardware and software problems Examples viruses error messages Applying strategies to correct malfunctioning hardware and software Performing routine hardware maintenance Describing the importance of antivirus and security software
3 Demonstrate advanced technology skills including compressing converting importing exporting and backing up files Transferring data among applications Demonstrating digital file transfer Examples attaching uploading downloading
4 Utilize advanced features of word processing software including outlining tracking changes hyperlinking and mail merging
5 Utilize advanced features of spreadsheet software including creating charts and graphs sorting and filtering data creating formulas and applying functions
6 Utilize advanced features of multimedia software including image video and audio editing
Digital Citizenship
9 Practice ethical and legal use of technology systems and digital content Explaining consequences of illegal and unethical use of technology systems and digital content Examples cyberbullying plagiarism Interpreting copyright laws and policies with regard to ownership and use of digital content
Page 24 of 25
Citing sources of digital content using a style manual Examples Modern Language Association (MLA) American Psychological Association (APA)
Research and Information Fluency
11 Critique digital content for validity accuracy bias currency and relevance
Communication and Collaboration
12 Use digital tools to publish curriculum‐related content Examples Web page authoring software coding software wikis blogs podcasts
13 Demonstrate collaborative skills using curriculum‐related content in digital environments Examples completing assignments online interacting with experts and peers in a structured online learning environment
Critical Thinking Problem Solving and Decision Making
14 Use digital tools to defend solutions to authentic problems Example disaggregating data electronically
Creativity and Innovation
15 Create a product that integrates information from multiple software applications Example pasting spreadsheet‐generated charts into a presentation
Page 25 of 25

Creativity and Innovation
14 Use digital tools to generate new ideas products or processes Examples ideasmdashpredictions trends productsmdashanimation video processesmdashmodels simulations
Alabama Technology Standards 9th ndash 12th Grade
Operations and Concepts
Students will
2 Diagnose hardware and software problems Examples viruses error messages Applying strategies to correct malfunctioning hardware and software Performing routine hardware maintenance Describing the importance of antivirus and security software
3 Demonstrate advanced technology skills including compressing converting importing exporting and backing up files Transferring data among applications Demonstrating digital file transfer Examples attaching uploading downloading
4 Utilize advanced features of word processing software including outlining tracking changes hyperlinking and mail merging
5 Utilize advanced features of spreadsheet software including creating charts and graphs sorting and filtering data creating formulas and applying functions
6 Utilize advanced features of multimedia software including image video and audio editing
Digital Citizenship
9 Practice ethical and legal use of technology systems and digital content Explaining consequences of illegal and unethical use of technology systems and digital content Examples cyberbullying plagiarism Interpreting copyright laws and policies with regard to ownership and use of digital content
Page 24 of 25
Citing sources of digital content using a style manual Examples Modern Language Association (MLA) American Psychological Association (APA)
Research and Information Fluency
11 Critique digital content for validity accuracy bias currency and relevance
Communication and Collaboration
12 Use digital tools to publish curriculum‐related content Examples Web page authoring software coding software wikis blogs podcasts
13 Demonstrate collaborative skills using curriculum‐related content in digital environments Examples completing assignments online interacting with experts and peers in a structured online learning environment
Critical Thinking Problem Solving and Decision Making
14 Use digital tools to defend solutions to authentic problems Example disaggregating data electronically
Creativity and Innovation
15 Create a product that integrates information from multiple software applications Example pasting spreadsheet‐generated charts into a presentation
Page 25 of 25