hurricane katrina: perceptions of older people in a community accepting displaced victims yoshinori...
TRANSCRIPT

Hurricane Katrina:Perceptions of Older People in a Community Accepting
Displaced VictimsYoshinori Kamo, Tammy L. Henderson, &
Karen A. RobertoThe Annual Meeting of the Gerontological Society of
AmericaNov. 22, 2010, New Orleans, LA

Major Issues• Katrina landfall in August 29, 2005.• Baton Rouge (70 mi NW): a premiere destination for
displaced persons from New Orleans to flee.• Changes in perceptions of older people in the
receiving community.• Are they justified by demographic data?• Changes in the attitudes of older people toward
newcomers.• Did it change the community itself?• What determines the perceptions and attitudes?• Policy implications

Table 1. Characteristics of the Sample (N=85)
Mean S.D.Female .89 .31Black .72 .45Age 71.86 8.41Education 12.46 3.33Married .29 .46Income 17.59 11.97Health 3.07 1.15
Mean S.D.Disorder (T2) 3.78 1.10Crowding (T2) 3.79 .96
Disorder (T1) 3.99 1.05Crowding (T1) 3.99 .90
Acceptance 3.63 .93Disapproval 3.23 1.08

Table 2. Perception of Change Before Katrina
(Time 1) & immediately after (Time 2)
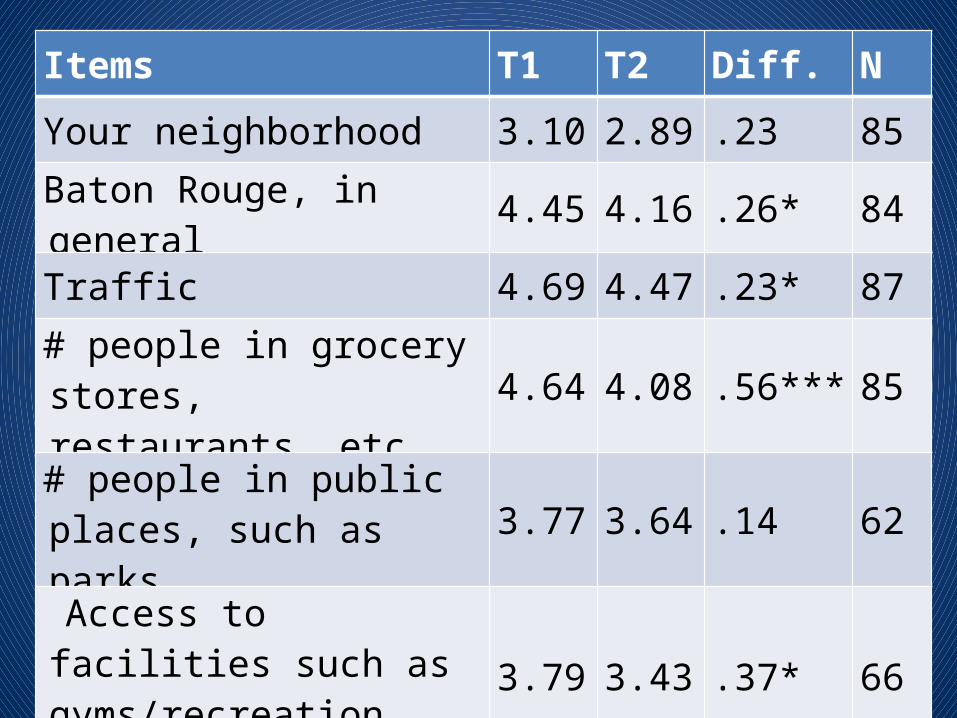
NOTE: Scores indicate “1=none” to “5=a great deal.”*** p<.001, ** p<.01, * p<.05, # p<.10 (or p<.05, one-tailed)
Items T1 T2 Diff. N
Your neighborhood 3.10 2.89 .23 85
Baton Rouge, in general 4.45 4.16 .26* 84
Traffic 4.69 4.47 .23* 87
# people in grocery stores, restaurants, etc.
4.64 4.08 .56*** 85
# people in public places, such as parks
3.77 3.64 .14 62
Access to facilities such as gyms/recreation centers
3.79 3.43 .37* 66

NOTE: Scores indicate “1=none” to “5=a great deal.”*** p<.001, ** p<.01, * p<.05, # p<.10 (or p<.05, one-tailed)
Items T1 T2 Diff. N
Litter, trash, & clutter 3.95 3.41 .55** 85
Security in stores 4.12 3.67 .46** 80
Visibility of police on the highways, neighborhoods, etc.
3.65 3.40 .25# 79
Violent crimes 3.80 3.98 -.12 77
Crimes such as theft & vandalism 3.88 3.88 .03 79

Items T1 T2 Diff. N
Drug trafficking 3.91 4.08 -.19 57
Gang activity 3.31 3.51 -.19 52
Rent, housing prices 4.22 4.40 -.20 75
Wait time for doctor dentist, etc. 3.11 3.04 .08 79
Wait time for auto/house hold repair services 3.57 3.33 .23 73
Mail service 3.24 2.74 .49** 84
NOTE: Scores indicate “1=none” to “5=a great deal.”*** p<.001, ** p<.01, * p<.05, # p<.10 (or p<.05, one-tailed)

Items T1 T2 Diff. N
Cell phone service 3.19 2.26 .95*** 56
Insurance premiums 2.96 3.29 -.38* 70
Difficulty in getting homeowner’s insurnc. 2.18 2.23 -.05 60
Wait time to S.S, Medicare, etc. 2.48 2.31 .15 60
Other 1.46 1.42 .07 67
NOTE: Scores indicate “1=none” to “5=a great deal.”*** p<.001, ** p<.01, * p<.05, # p<.10 (or p<.05, one-tailed)

Figure 1. Total Population Change in the New Orleans
and Baton Rouge Metropolitan Areas
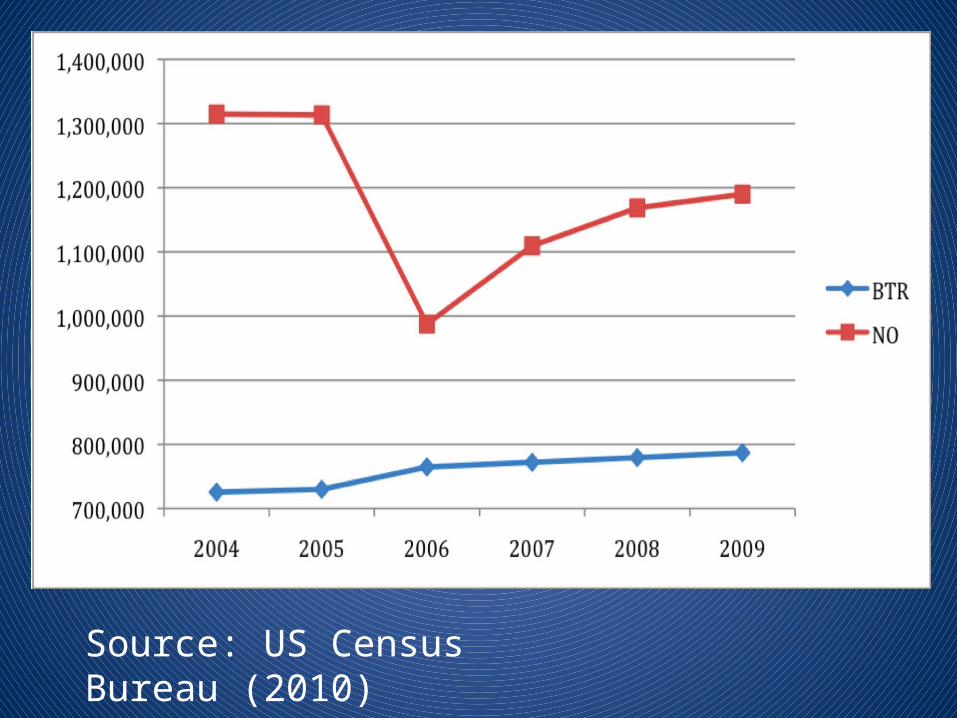
Source: US Census Bureau (2010)

Figure 2. Changes in Crimes in Baton Rouge

Sources: Federal Bureau of Investigation (2010), Baton Rouge Police Department (2010). NOTE: The number of each crime was converted to its ratio to the 2005 figure in respective crime.

Table 3. Perception of Other People Since
Hurricane Katrina (N=88)

NOTES: Scores indicate “1=a lot less” to “5=a lot more.”*** p<.001, ** p<.01, * p<.05, # p<.10 (or p<.05, one-tailed), for the difference between the mean value and 3.0.
Since Katrina, I am: Mean
Suspicious of others 3.40**
Trusting of others 2.86
Reserved with others 3.08
Tolerant of others 3.38**
Fearful of others 3.25#
Patient with others 3.69***
Frustrated with others 3.02
Friendly to others 3.81***
Table 4. Estimated Regression Equations for
Older Residents’ Perceptions of Changes in
Baton Rouge

NOTE: * p<.05, # p<.10 (or p<.05, one-tailed)
Dep. Variables
Social Disorder (N=85) Crowding (N=85)
Change between before
Katrina &
Weeks following
HKNow
Weeks following
HKNow
Predictors b Beta b Beta b Beta b Beta
Female-.16
4-.04
8 .216 .061-.07
2-.02
5-.01
2-.00
4African
American .031 .013 .450 .185 .066 .033.520
# .245
Age-.00
6-.04
6 .002 .012-.00
8-.07
8 .000-.00
5

Dep. Variables
Social Disorder (N=85) Crowding (N=85)
Education -.00
7-.02
2 .043 .129-.04
8-.17
5 .036 .123
Married .323 .141 .241 .100 .191 .097 .293 .140
Income -.017
-.188
-.032*
-.343
.000 .001 -.014
-.174
Health -.270*
-.294
-.166
-.173
-.137
-.174
-.186#
-.222
Constant5.63
93.61
25.56
83.75
2R2 .138 .224 .079 .150
NOTE: * p<.05, # p<.10 (or p<.05, one-tailed)

Table 5. Estimated Regression Equations for
Older Residents’ Acceptance and Disapproval of
Newcomers

Dep. Variables
Acceptance (N=85) Disapproval (N=85)
Predictors b Beta b Beta b Beta b Beta
Female.754
* .252.720
* .240-.67
6-.19
3-.739#
-.211
African American
.149 .073 .039 .019 .637*
.266 .488 .204
Age -.015
-.132
-.015
-.133
.023 .177 .022 .174
Education -.001
-.004
-.010
-.038
-.008
-.024
-.022
-.067
Married .108 .053 .048 .024 -.060
-.026
-.141
-.060
NOTE: * p<.05, # p<.10 (or p<.05, one-tailed)

Income-.01
7-.21
6-.01
1-.13
7 .008 .091 .018 .198
Health .110 .136 .150 .185-.15
0-.15
9-.09
5-.10
1
Disorder .162 .193.293
# .298
Crowding .070 .073 .033 .029
Constant3.82
72.97
82.16
9 .988
R2 .119 .167 .118 .197
NOTE: * p<.05, # p<.10 (or p<.05, one-tailed)