hurricane structure: theory and...
TRANSCRIPT
Hurricane Structure:
Theory and Diagnosis
National Hurricane Center, Miami
Chris Landsea
6 March, 2017
World Meteorological Organization Workshop

•Structure of Hurricanes – Dynamical and
thermodynamical
•How is size defined and measured?
•Exercise: Analyze size (tropical storm and
hurricane force winds)
Outline


INFLOW INFLOW
OUTFLOW OUTFLOW
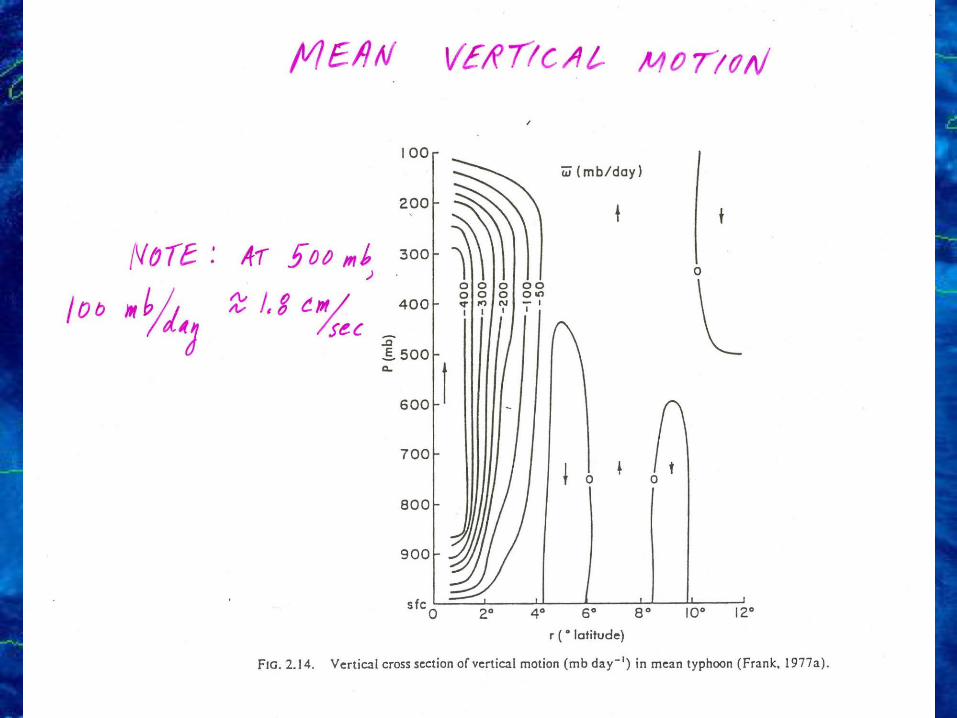
UPWARD
MOTION
UPWARD
MOTION
E
Y
E
W
A
L
L
E
Y
E
W
A
L
L
EYE
SINKING
MOTION
L
THE WARM CORE IS A CONSEQUENCE OF BOTH LATENT HEAT
RELEASE AND WARMING BY SUBSIDENCE

OUTFLOW OUTFLOW
EYE
SINKING
MOTION
L
HEAT & MOISTURE HEAT & MOISTURE
THE WARM CORE IS A CONSEQUENCE OF BOTH LATENT HEAT
RELEASE AND WARMING BY SUBSIDENCE

SYMMETRIC,
INWARD-SPRIALING
FLOW
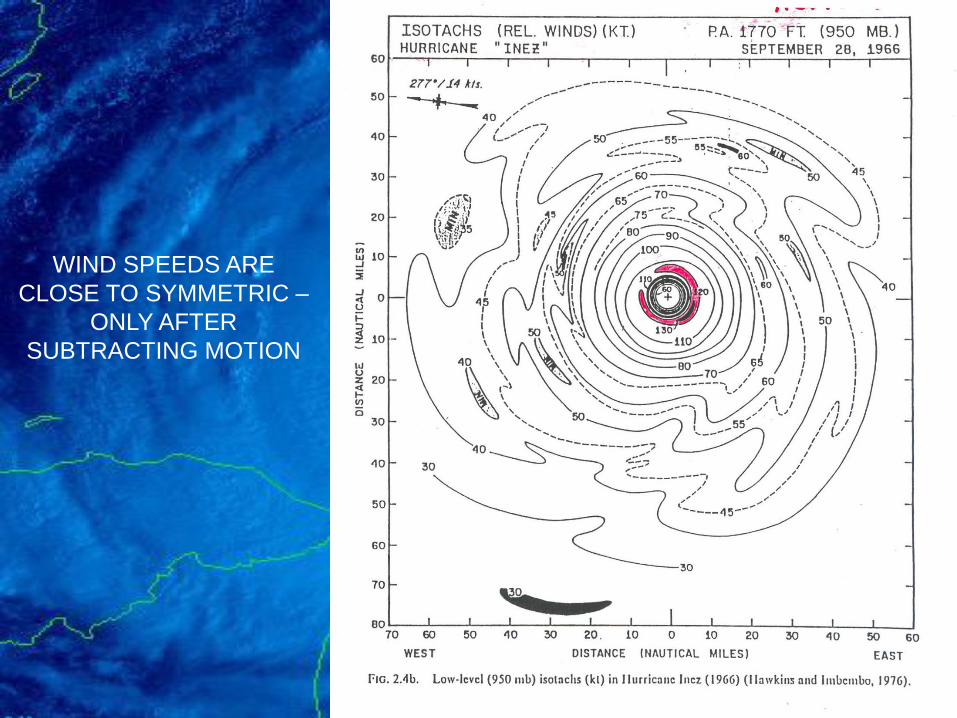
WIND SPEEDS ARE
CLOSE TO SYMMETRIC –
ONLY AFTER
SUBTRACTING MOTION

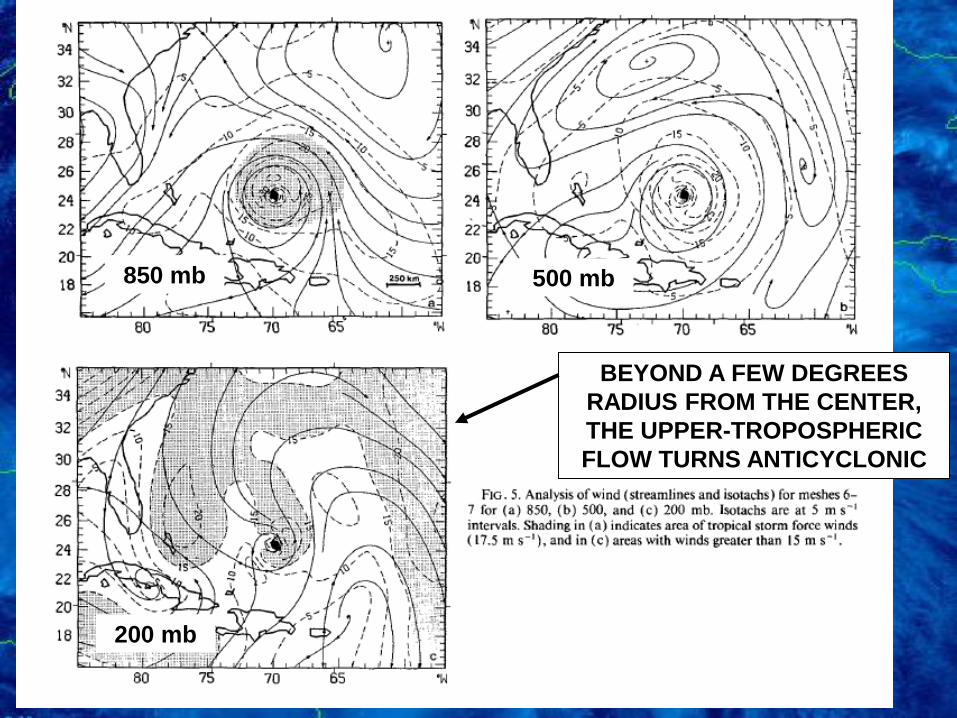
850 mb
200 mb
500 mb
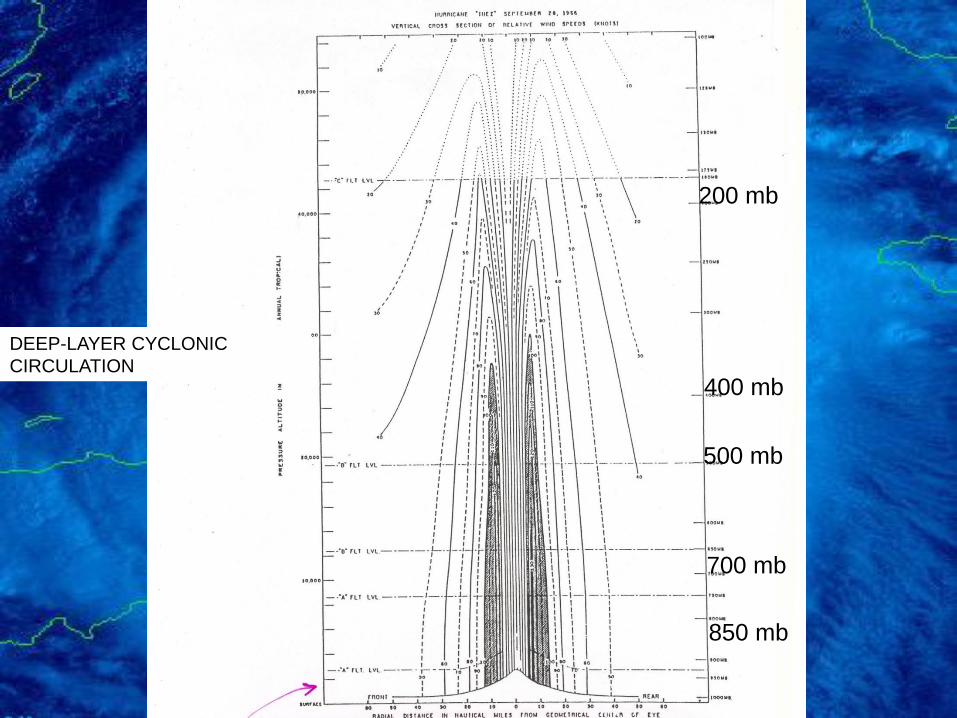
NOTE CYCLONIC CIRCULATION
AT UPPER-TROPOSPHERIC
LEVEL, WITHIN A FEW
DEGREES RADIUS OF THE
CENTER!
850 mb
200 mb
500 mb
BEYOND A FEW DEGREES
RADIUS FROM THE CENTER,
THE UPPER-TROPOSPHERIC
FLOW TURNS ANTICYCLONIC
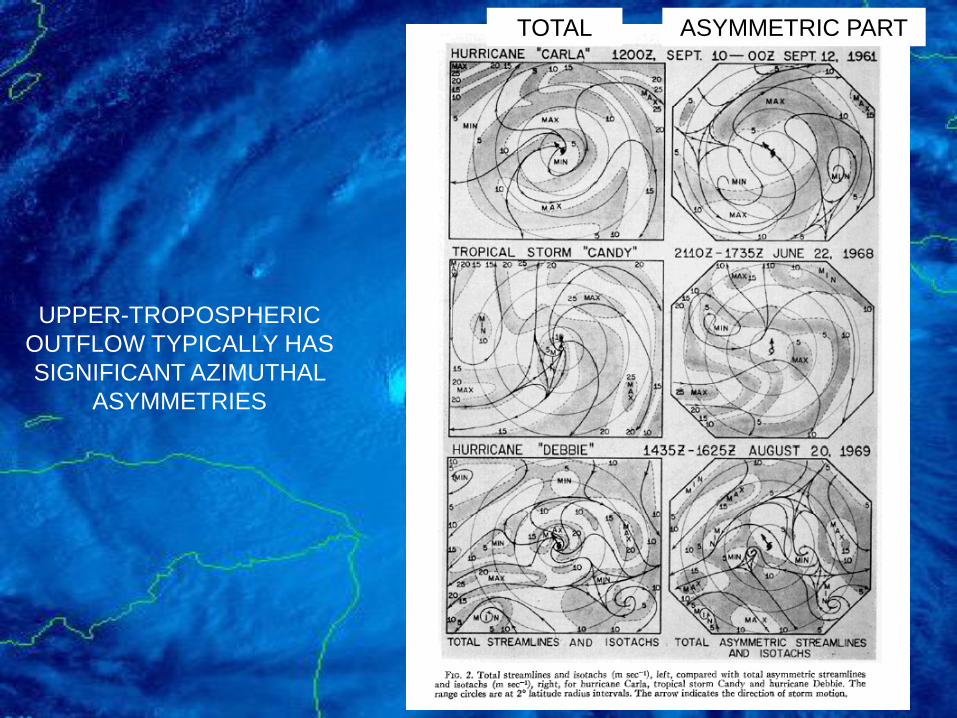
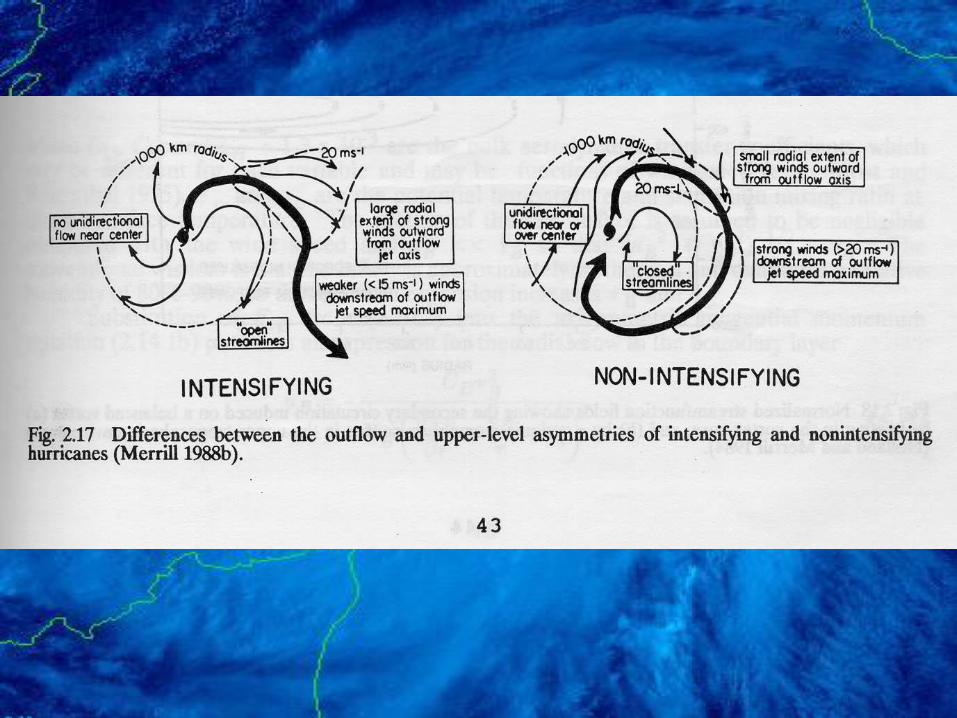
TOTAL ASYMMETRIC PART
UPPER-TROPOSPHERIC
OUTFLOW TYPICALLY HAS
SIGNIFICANT AZIMUTHAL
ASYMMETRIES
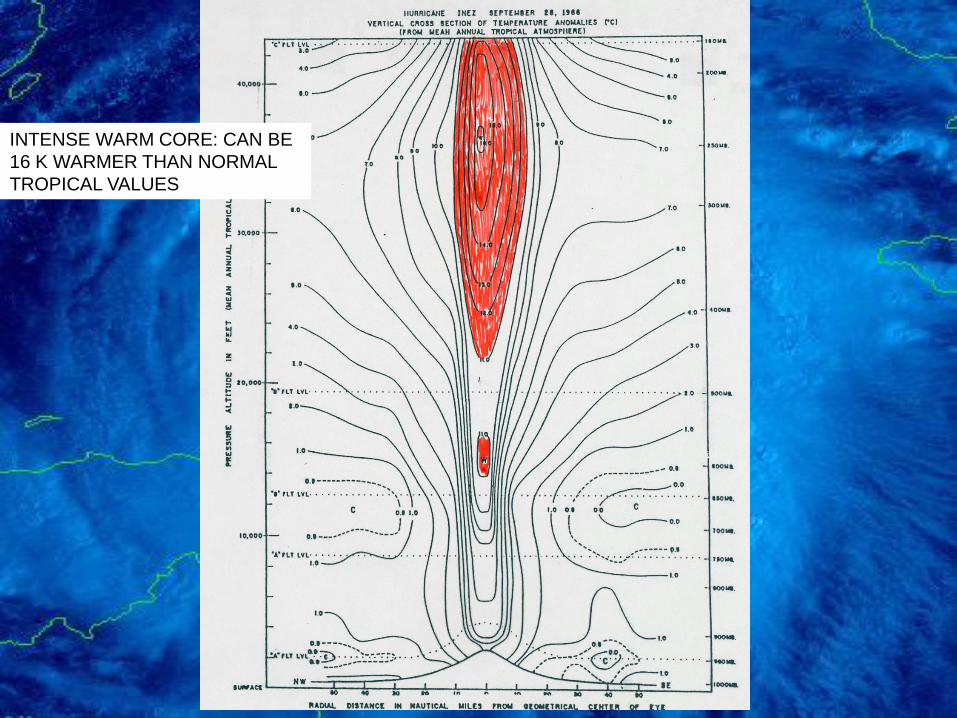
INTENSE WARM CORE: CAN BE
16 K WARMER THAN NORMAL
TROPICAL VALUES
400 mb
500 mb
700 mb
850 mb
200 mb
DEEP-LAYER CYCLONIC
CIRCULATION


THE MASS (PRESSURE, HEIGHT) AND WIND FIELDS OF A
TROPICAL CYCLONE ARE IN NEAR-GRADIENT OR (IN THE INNER
CORE REGION) NEAR-CYCLOSTROPHIC BALANCE
RELATIONSHIP BETWEEN MINIMUM CENTRAL PRESSURE AND
MAXIMUM WIND: IS THERE A UNIVERSAL ONE? MAYBE, IF
ENVIRONMENTAL PRESSURE AND SIZE IS TAKEN INTO ACCOUNT
WILLOUGHBY SUGGESTED THE FOLLOWING FORMULA:
pressurecentral
windmax
pressuretalenviornmen
density0
c
m
p
v
p
cm ppv
0
1
3
2
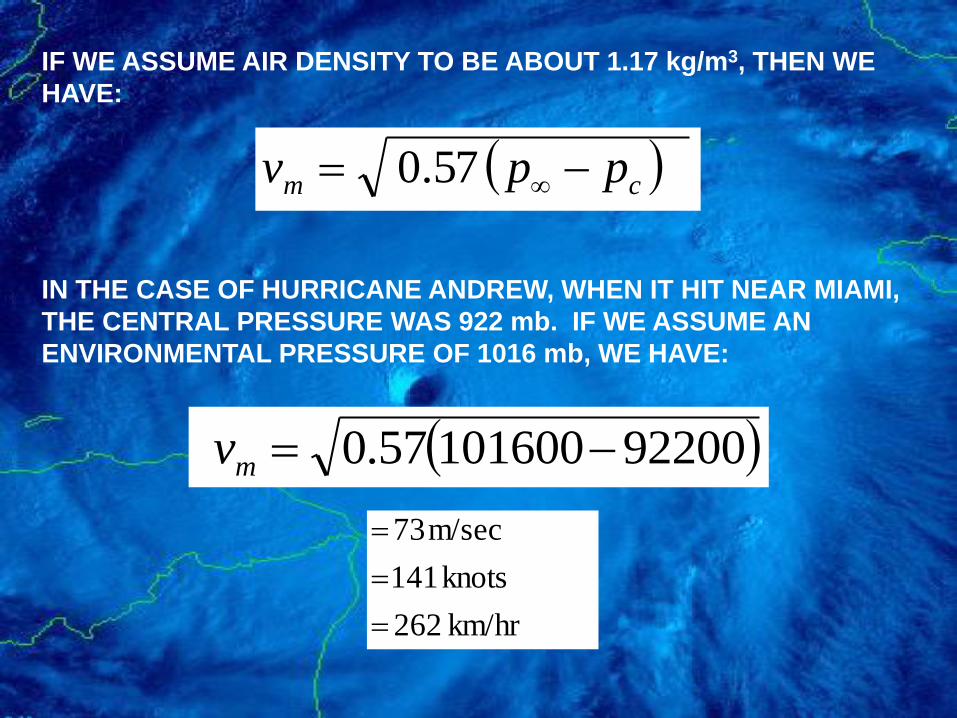
IF WE ASSUME AIR DENSITY TO BE ABOUT 1.17 kg/m3, THEN WE
HAVE:
IN THE CASE OF HURRICANE ANDREW, WHEN IT HIT NEAR MIAMI,
THE CENTRAL PRESSURE WAS 922 mb. IF WE ASSUME AN
ENVIRONMENTAL PRESSURE OF 1016 mb, WE HAVE:
cm ppv 57.0
km/hr 262
knots 141
m/sec73
9220010160057.0 mv

COMPREHENSIVE
PRESSURE-WIND RELATIONSHIP
Knaff and Zehr (2007)
MAXIMUM WIND = 18.633
-14.960xSIZE
-0.755xLATITUDE
-0.518x(ENV.-CENTRAL PRESSURE)
+9.738x(ENV.-CENTRAL PRESSURE)**0.5
+1.5(SPEED)**0.63
• For example, a small RMW TC with a central pressure of 963 mb in the lower latitudes (with average environmental pressure and translational velocity) would suggest a windspeed of 100 kt, while a large RMW TC with a central pressure of 948 mb in high latitude would also suggest also a maximum wind of 100 kt.

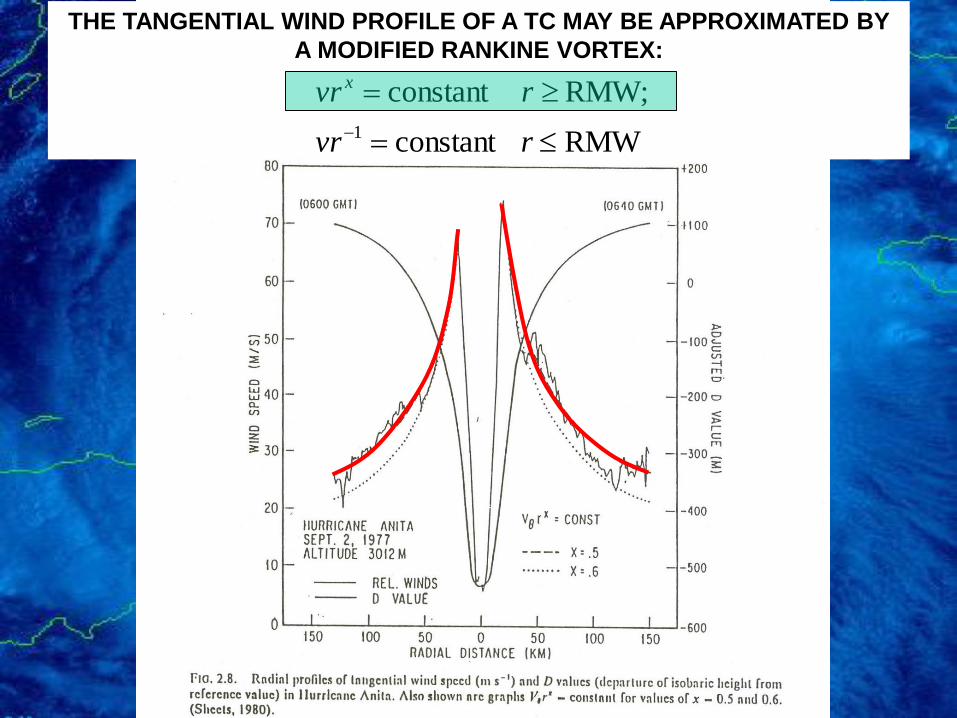
THE TANGENTIAL WIND PROFILE OF A TC MAY BE APPROXIMATED BY
A MODIFIED RANKINE VORTEX:
RMW constant
RMW; constant
1
rvr
rvr x
THE TANGENTIAL WIND PROFILE OF A TC MAY BE APPROXIMATED BY
A MODIFIED RANKINE VORTEX:
RMW constant
RMW; constant
1
rvr
rvr x


CONCENTRIC
EYEWALLS

Concentric Eyewall Cycle – from microwave satellite imagery (Hernan)

Concentric
Eyewall Cycle –
Tangential winds
(Gilbert)
Black & Willoughby
(1992)

CENTRAL PRESSURE VS. TIME FOR HURRICANE ALLEN, 1980: LARGE
FLUCTUATIONS LARGELY DUE TO EYEWALL REPLACEMENT CYCLES
CAT 3
CAT 4
CAT 5
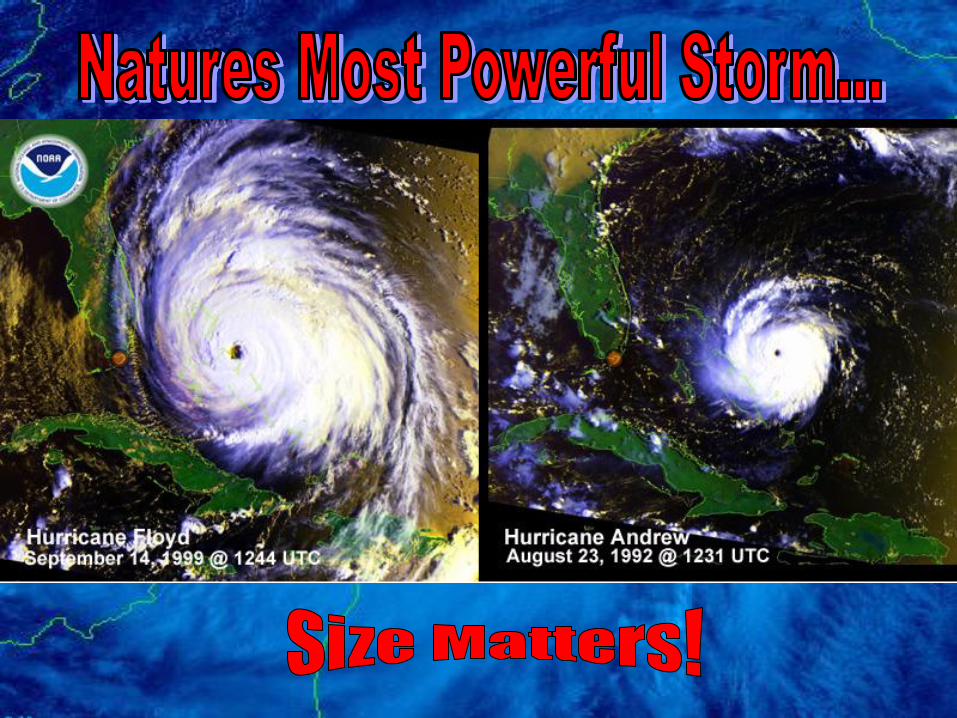
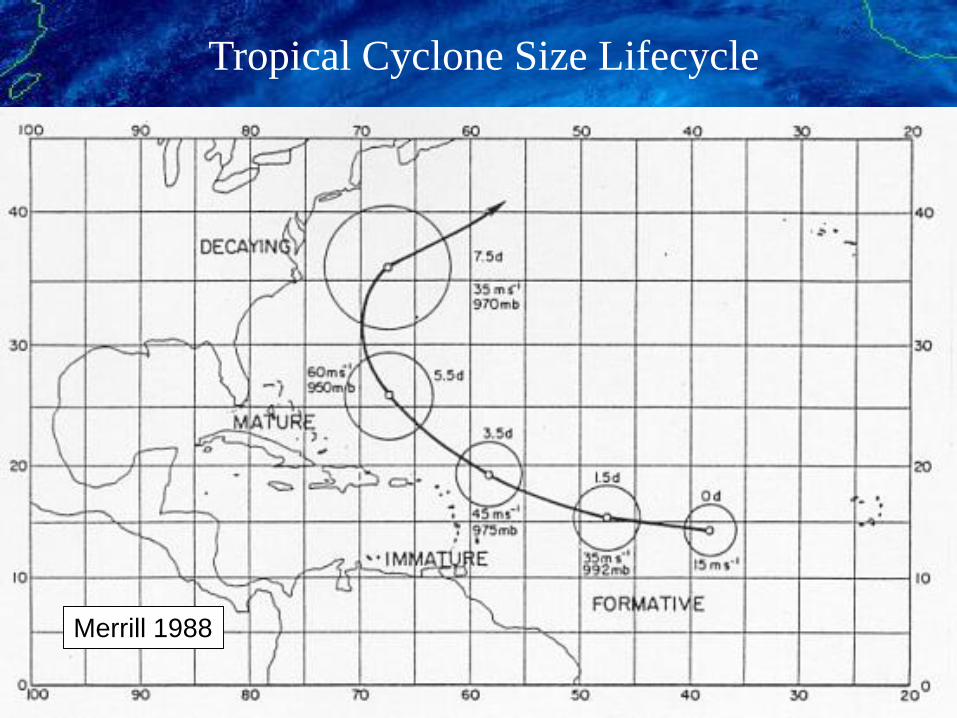
Tropical Cyclone Size Lifecycle
Merrill 1988

Size
versus
Intensity
Kimball and
Mulekar (2004)

Radius of
Tropical
Storm Force
Winds
versus
Location
Kimball and
Mulekar (2004)

Tropical Cyclones versus Extratropical Cyclones

Tropical Cyclone versus Extratropical Cyclone:
Non-frontal versus frontal
(Hart 2003)

Tropical
Cyclone
versus
Extratropical
Cyclone:
“Warm” and
“Cold” Cores
• (Hart 2003)

Cyclone Phase Space for Bill

Dvorak is
very useful
for position
and intensity,
but does
NOT provide
size
estimates.
Katrina August 24
Diagnosing Size…

-NHC estimates cyclone “size” via wind
radii in four quadrants
Tropical Cyclone Wind RadiiHow big is the storm?
NE
SESW
NW
radii represent the largest
distance from center in
particular quadrant
leads to an inherent over-
estimate of radii, especially
near land
•Wind radius = Largest distance from the center of the tropical cyclone of a particular sustained surface wind speed threshold (e.g., 34, 50, 64 kt) somewhere in a particular quadrant (NE, SE, SW, NW) surrounding the center and associated with the circulation at a given point in time
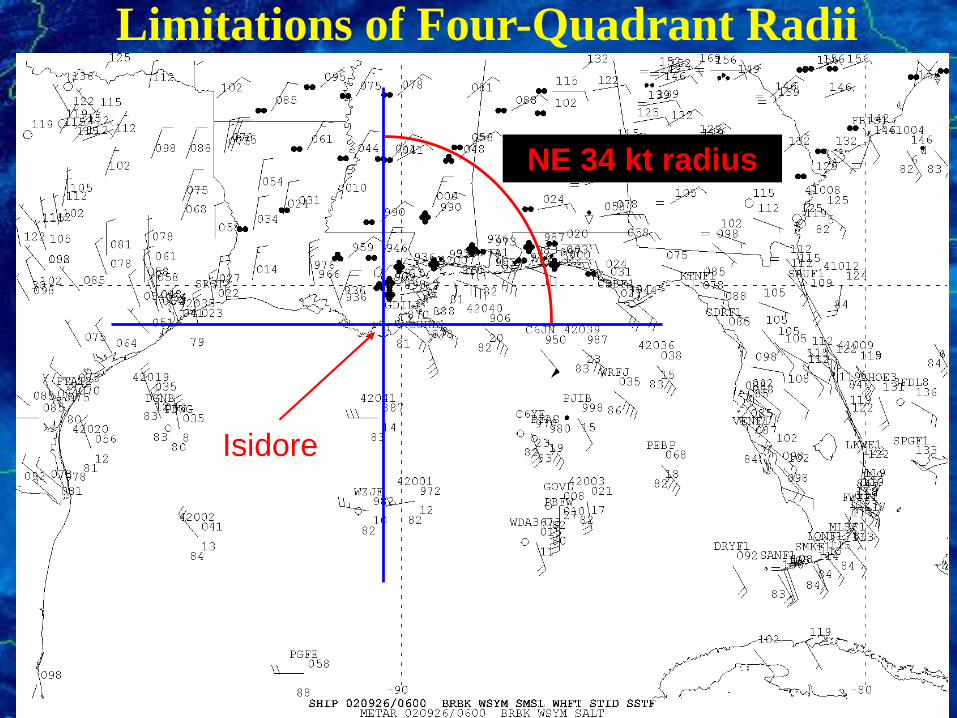
Isidore
NE 34 kt radius
Limitations of Four-Quadrant Radii
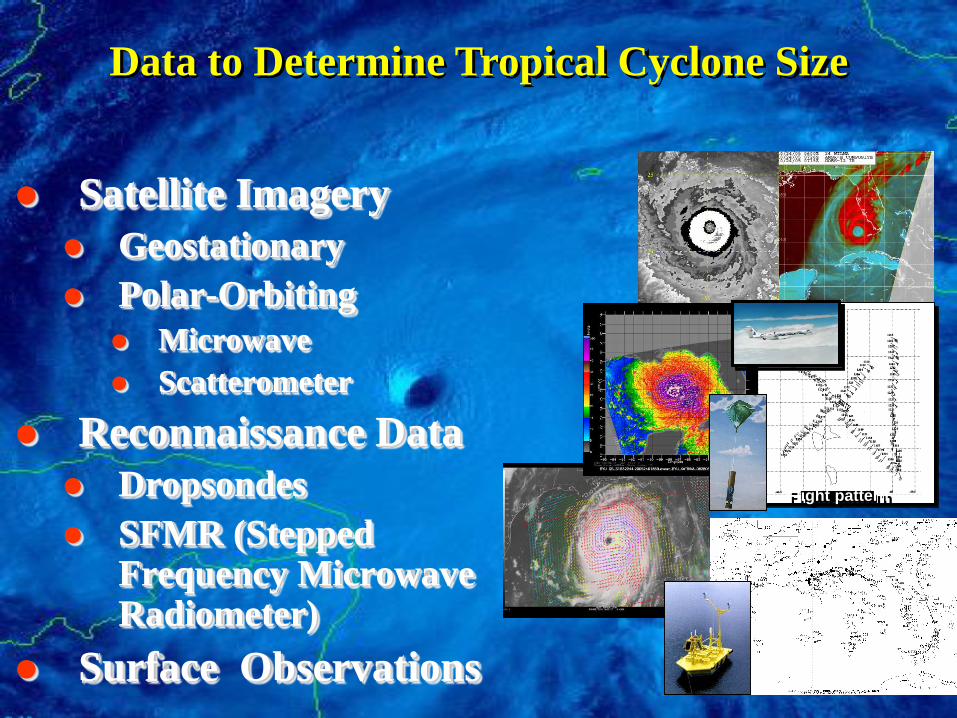
Satellite Imagery
Geostationary
Polar-Orbiting
Microwave
Scatterometer
Reconnaissance Data
Dropsondes
SFMR (Stepped Frequency Microwave Radiometer)
Surface Observations
Flight pattern
Data to Determine Tropical Cyclone Size

A Typical Day in 2017 –
Marine Data Available
around 12 UTC

Geostationary
satellite –
Low-level cloud
drift windsSatellite winds for nearby
environment and TC size

Low-Earth-Orbit Satellites
• Carry microwave imagers
and sounders that can see
through cloud tops and
reveal the structures
underneath
• Gaps in instrument
coverage between orbits,
which causes irregular
sampling of cyclones
Microwave location, structure, intensity, rainfall
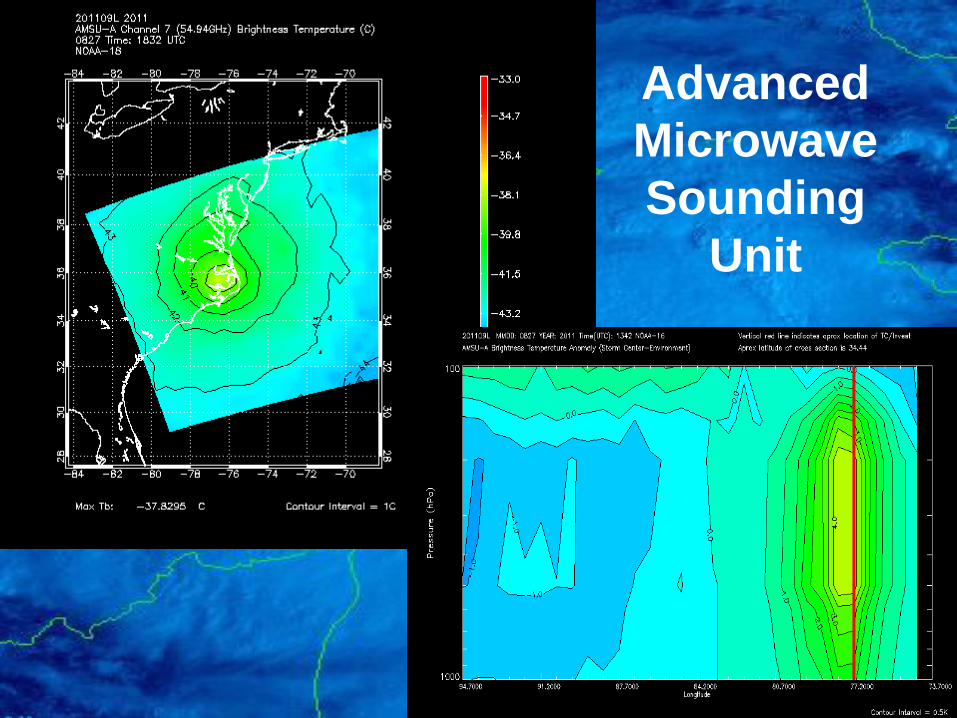
Advanced
Microwave
Sounding
Unit
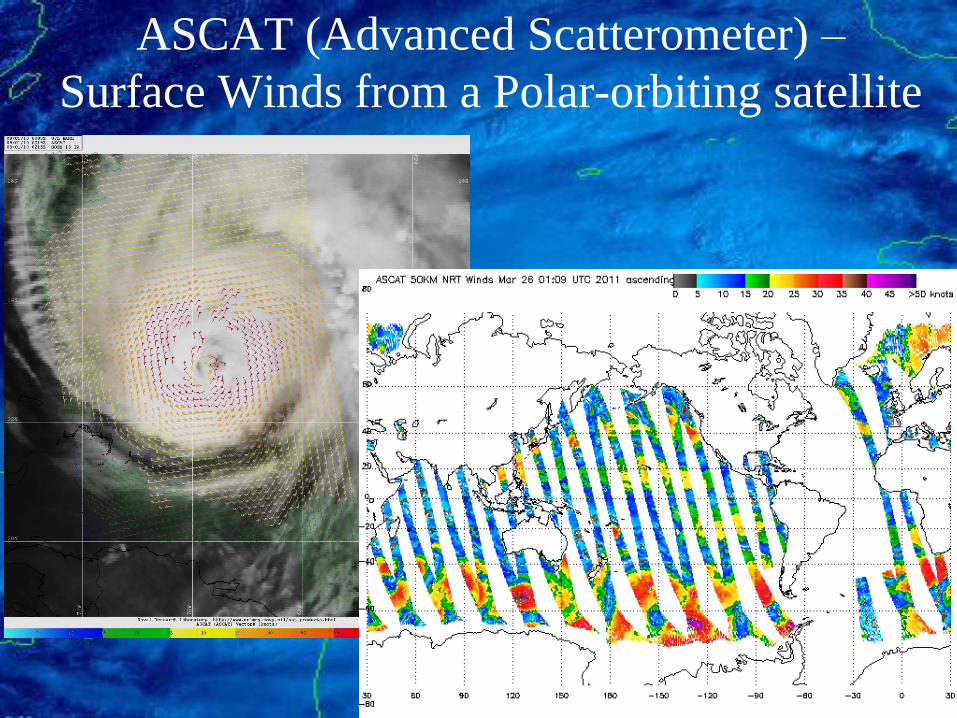
ASCAT (Advanced Scatterometer) –
Surface Winds from a Polar-orbiting satellite

Rain Contamination with scatterometer data
Brennan et al. 2009
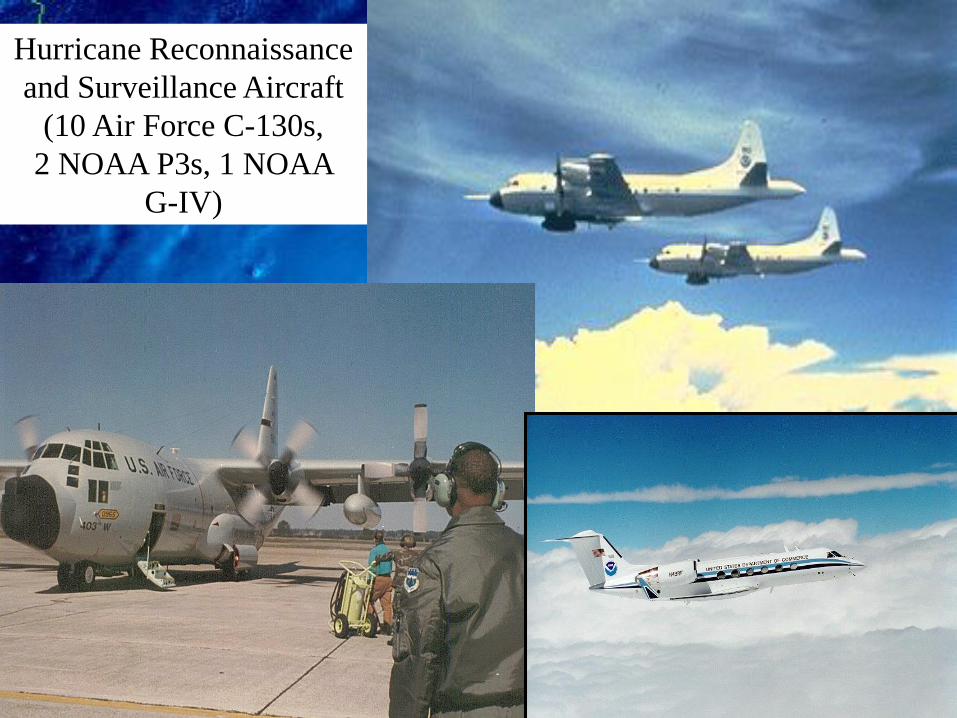
Hurricane Reconnaissance
and Surveillance Aircraft
(10 Air Force C-130s,
2 NOAA P3s, 1 NOAA
G-IV)

Primary Aircraft Data• Winds (along the aircraft track and dropsondes)
• Surface pressures (extrapolated and dropsonde)
• Surface winds from the Stepped Frequency Microwave
Radiometer
• Aircraft Doppler Radar winds (from the P-3’s)
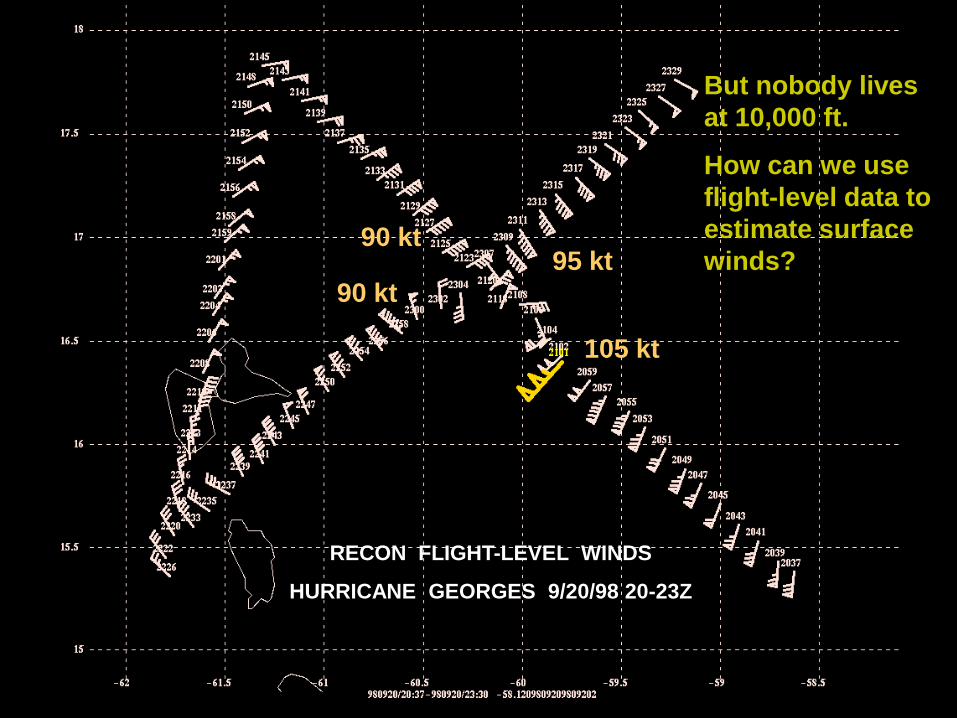
RECON FLIGHT-LEVEL WINDS
HURRICANE GEORGES 9/20/98 20-23Z
105 kt
90 kt
90 kt95 kt
But nobody lives
at 10,000 ft.
How can we use
flight-level data to
estimate surface
winds?

Franklin and Black (1999)
Mean Wind ProfileWind in Hurricane Georges
GPS Dropsondes
Measures the wind around and in hurricanes
from the aircraft to the ocean’s surface

A large sample of GPS dropsondes in the inner core of TCs
provides a way to determine surface wind radii from flight
level winds via the mean wind profile
Franklin (2001)
Surface wind analyses using flight level winds
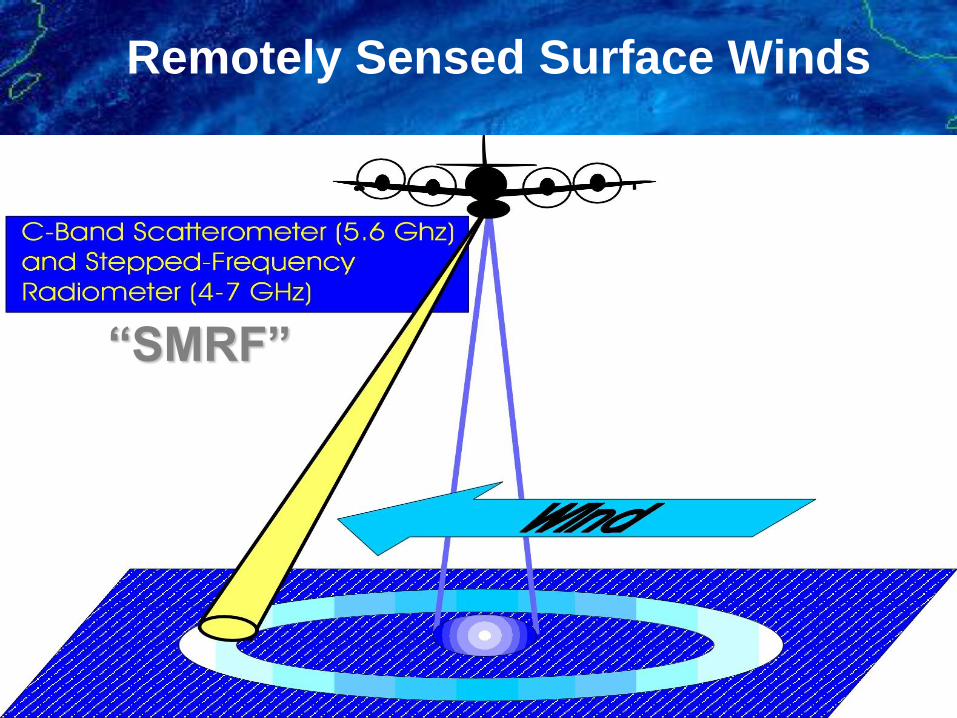
Remotely Sensed Surface Winds
“SMRF”

Multiplatform
Satellite
Surface Wind
Analysis –
CIRA
AMSU
Cloud
Drift
Winds
ASCAT
Infrared

Automated
Surface
Wind Field
in Tropical
Cyclones
Multiplatform
Satellite
Surface Wind
Analysis –
CIRA

Surface Wind Field

• Empirical ideas
– Is the storm strengthening or weakening?
– Is persistence appropriate, or are conditions changing?
– Is the storm becoming extratropical, causing wind field to expand?
– Will all or part of the circulation be passing over land, such that radii could decrease?
– Is the system accelerating, such that the storm could become more asymmetric?
• Guidance is essentially limited to climatology and persistence (CLIPER) models
• Occasionally can use dynamical models (not yet fully tested and verified for radii)
Wind Radii Forecast “Guidance”

Hurricane Structure:
Theory and Diagnosis
National Hurricane Center, Miami
Chris Landsea
6 March, 2017
World Meteorological Organization Workshop
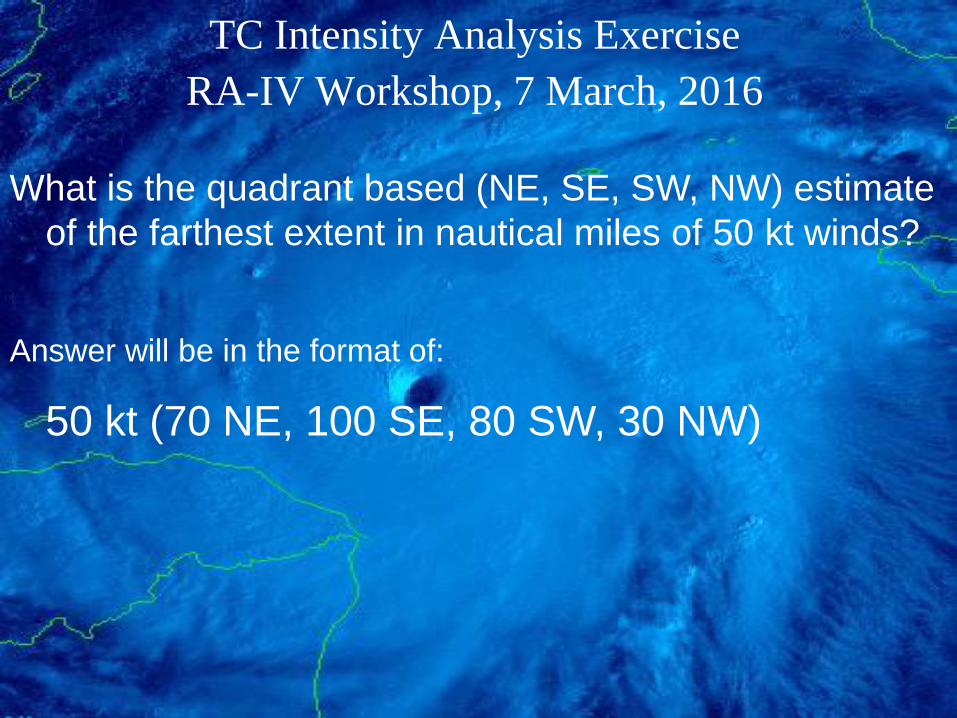
TC Intensity Analysis Exercise
RA-IV Workshop, 7 March, 2016
What is the quadrant based (NE, SE, SW, NW) estimate
of the farthest extent in nautical miles of 50 kt winds?
Answer will be in the format of:
50 kt (70 NE, 100 SE, 80 SW, 30 NW)

Ingrid – Sep. 14th, 18Z – 65 kt Intensity
How big is it?
100 nm

CIRA AMSU:
50 kt (49 NE, 52 SE, 44 SW, 42 NW)
50 nm
100 nm
Ingrid
Sep. 14th, 18Z
65 kt intensity
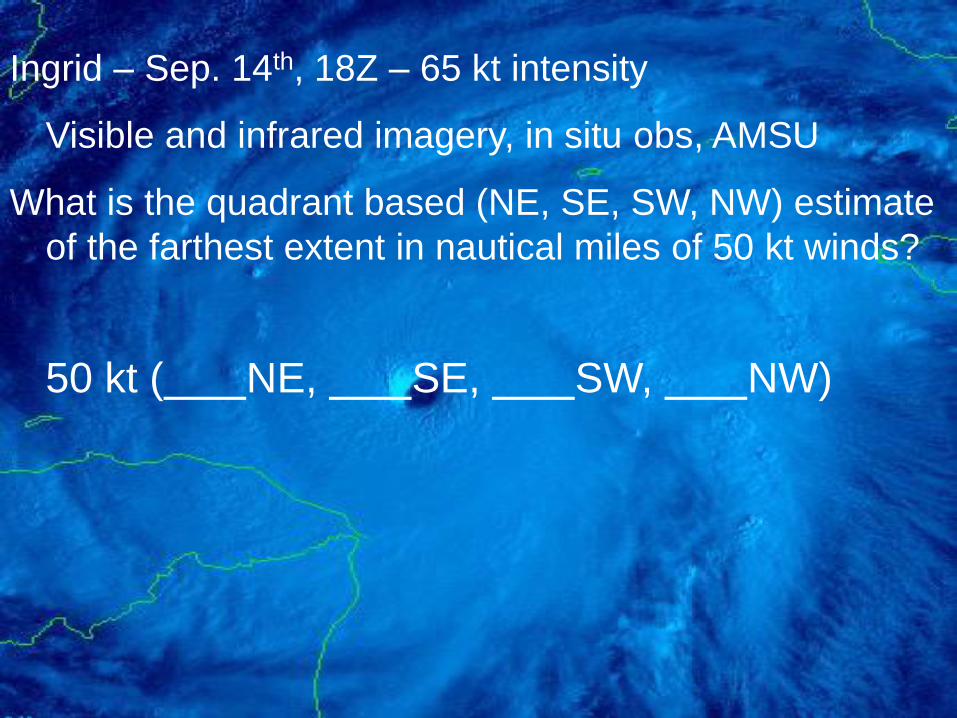
Ingrid – Sep. 14th, 18Z – 65 kt intensity
Visible and infrared imagery, in situ obs, AMSU
What is the quadrant based (NE, SE, SW, NW) estimate
of the farthest extent in nautical miles of 50 kt winds?
50 kt ( NE, SE, SW, NW)
100 nm
50 nm
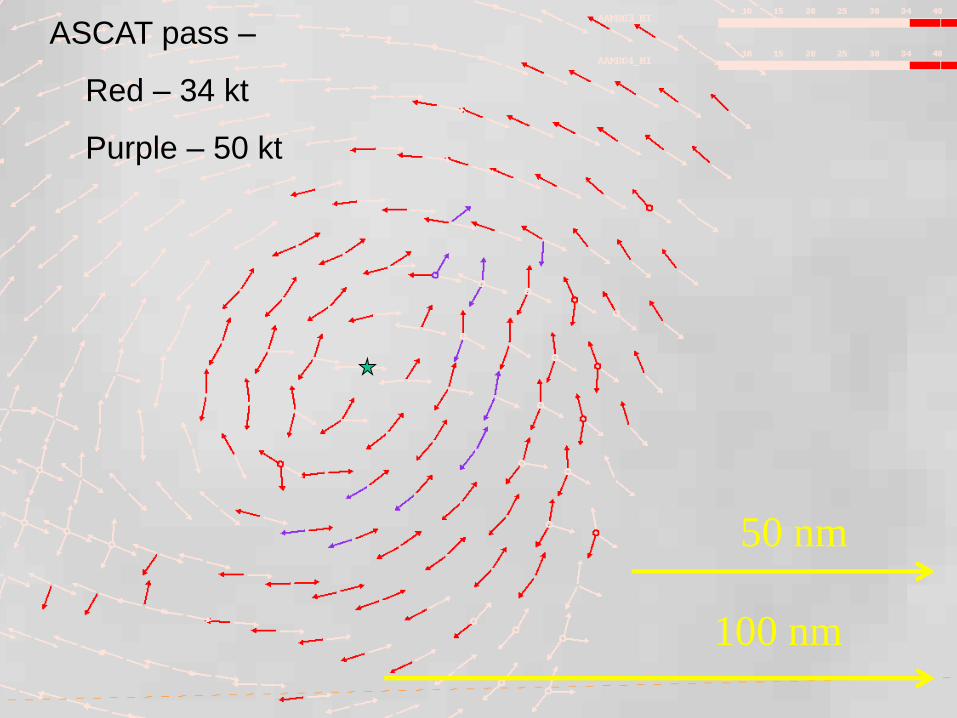
ASCAT pass –
Red – 34 kt
Purple – 50 kt

Ingrid – Sep. 14th, 18Z – 65 kt intensity
Visible and infrared imagery, in situ obs, AMSU, and
ASCAT
What is the quadrant based (NE, SE, SW, NW) estimate
of the farthest extent in nautical miles of 50 kt winds?
50 kt ( NE, SE, SW, NW)

100 nm
Ingrid – Sep. 16th, 00Z – 70 kt Intensity
How big is it?

50 nm
100 nm
Ingrid
Sep. 16th, 00Z
70 kt intensity

100 nm50 nm
Aircraft Reconnaissance:
Flight level winds (700mb) – Pink
SFMR - black
No
rth

Ingrid – Sep. 16th, 00Z – 70 kt intensity
Visible and infrared imagery, in situ obs, and aircraft
reconnaissance
What is the quadrant based (NE, SE, SW, NW) estimate
of the farthest extent in nautical miles of 50 kt winds?
50 kt ( NE, SE, SW, NW)