hurricane tracking - zimearth / frontpage
TRANSCRIPT
Activity taken from McDougal Littell Earth Science Laboratory Manual (2003) 1
Name_______________________________ Section__________________
Hurricane Tracking Like other Atlantic hurricanes, Andrew started as a low-pressure system in the tropics off the west coast of Africa. Warm water and moisture-laden air supplied the energy for it to strengthen into an ordinary and average tropical storm. Surface winds begin to move the storm westward. Although all tropical storms form and develop in this way, only a few intensify into hurricanes. Most encounter upper air winds moving in the opposite direction as the surface winds. As a result, these storms weaken and soon die out. Tropical Storm Andrew, on the other hand, encountered upper air winds moving in the same direction as the surface winds. These reinforcing winds caused Andrew to quickly strengthen into an unusually powerful hurricane. Andrew proved to be the most intense Atlantic hurricane of the 20th century. Objectives: Students will graph and interpret hurricane weather data, construct a hurricane track for Hurricane Andrew, and correlate a hurricane track with the weather data. Materials: colored pencils, and ruler Procedure:
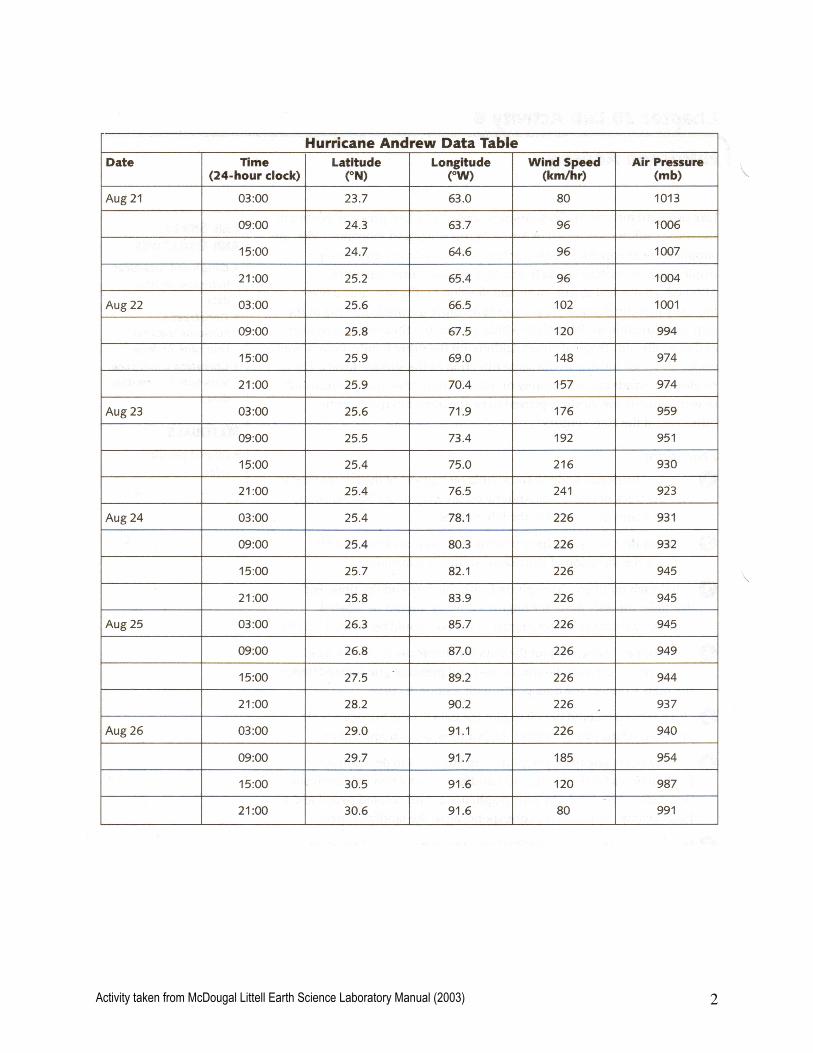
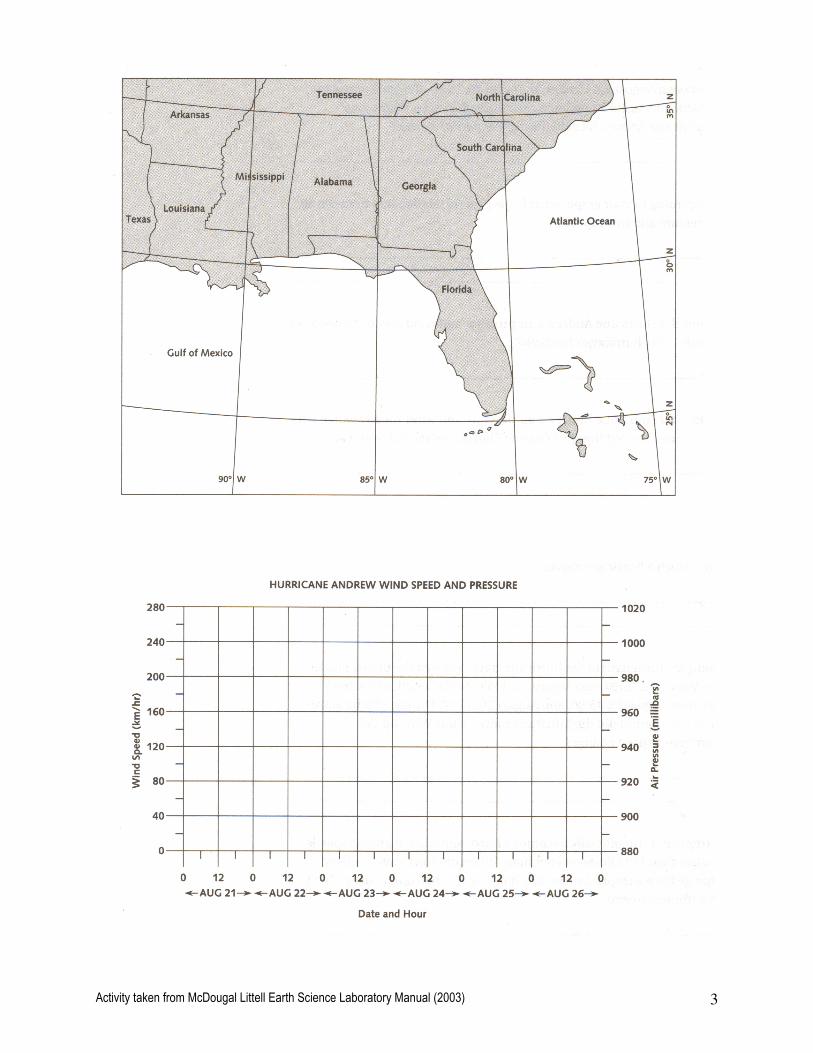
1. Use the latitude and longitude information from the Hurricane Andrew Data Table to plot the track of Hurricane Andrew on the map of the Southeastern United States.
2. Connect the points you have plotted, and draw an arrowhead to indicate the direction of Hurricane Andrew’s movement.
3. Label each point you have plotted with the date and the time. For example, the data point for August 21, 03:00, should be labeled 21/03, and the data point for August 21, 09:00, should be labeled 21/09.
4. Use a red colored pencil to plot the data for Hurricane Andrew’s wind speed versus time on the wind speed and pressure graph. Connect the data points with a smooth curve.
5. Use a blue colored pencil to plot the data for the hurricane’s air pressure versus time on the same graph. Connect the data points with a smooth curve.
6. Use the hurricane track you plotted on the map of the Southeastern United States to determine the landfall times for the hurricane. Landfall occurs when the hurricane first passes over land. On your graph, use a green colored pencil and a ruler to draw vertical lines corresponding to the landfall times.
7. Use an orange colored pencil to draw a vertical line to indicate when Hurricane Andrew passed back onto the water after being on land.
Activity taken from McDougal Littell Earth Science Laboratory Manual (2003) 2
Activity taken from McDougal Littell Earth Science Laboratory Manual (2003) 3
Activity taken from McDougal Littell Earth Science Laboratory Manual (2003) 4
Analysis and Conclusion Questions:
1. a. What is the difference between the highest and the lowest air pressure values
given in the data table?_________________________________________________
b. Would you expect this value to be more or less than the air pressure change
across a typical mid-latitude storm? ______________________________________
___________________________________________________________________
2. Between August 24, 15:00, and August 26, 03:00, the wind speed for Hurricane
Andrew remained essentially the same. Where was Hurricane Andrew located
during this period of time? ______________________________________________
3. According to your graph, what is the general relationship between air pressure and
wind speed? _________________________________________________________
4. How did Hurricane Andrew’s air pressure and wind speed change after both times it
made landfall? _______________________________________________________
___________________________________________________________________
5. How did Hurricane Andrew’s air pressure and wind speed change after the hurricane
left the west coast of Florida and moved over water? _________________________
___________________________________________________________________
6. a. Compare the length of the hurricane track between the points plotted for August
24, 15:00, and August 25, 15:00, to the length of the track between August 25,
15:00, and August 26, 15:00. During which twelve-hour time period did the hurricane
move faster? ________________________________________________________
b. Why did the hurricane’s speed change? _________________________________
___________________________________________________________________
7. a. A tropical storm officially becomes a hurricane when it reaches wind speeds
greater than 119 kilometers per hour. When did Hurricane Andrew change from a
tropical storm to a hurricane? ___________________________________________
b. When did it change back to a tropical storm? _____________________________