hvac equations, concepts, and definitions
TRANSCRIPT

Presented By:
HVAC Equations, Concepts, and Definitions
David Sellers
Senior Engineer; Facility Dynamics Engineering

A Few Acronyms and Definitions
Acronyms• AFD – Adjustable Frequency Drive• AHU – Air Handling Unit• ASHRAE – American Society of Heating Ventilating and Air
Conditioning Engineers• CV - Constant Volume• HVAC – Heating Ventilating and Air Conditioning• MOA – Minimum Outdoor Air• Psych Chart – Psychrometric Chart• VAV – Variable Air Volume• VFD – Variable Frequency Drive• VFD – (Adjustable Frequency Drive)• VSD – Variable Speed Drive• VFD – (Adjustable Frequency Drive)
• AFD Acronym Definition • AFD A Few Days • AFD Abbreviated Functional Description • AFD Accelerated Freeze-Drying (food processing) • AFD Accident Free Discount (insurance) • AFD Acid Fractionator Distillate • AFD Acoustic Flat Diaphragm (electronics) • AFD Acrofacial Dysostosis• AFD Acrofacial Dysostosis, Catania Type • AFD Active Format Descriptor • AFD Adaptive Flexible Defense • AFD Adaptive Flight Display • AFD Adjustable Frequency Drive • AFD Advanced Full-screen Debugger • AFD African Development Foundation • AFD African Development Fund • AFD Aft Flight Deck • AFD Agence Française de Développement (French Development Agency) • AFD Air Force Depot • AFD Airfield Database • AFD Airport Facilities Directory • AFD Alarm Format Definition • AFD Albany Fire Department • AFD Alcohol Free Day • AFD Alexandria Fire Department • AFD All Friggin' Day • AFD Alt.fan.dragons (Usenet newsgroup) • AFD Alternative Forms of Delivery (Canada) • AFD Amarillo Fire Department (Amarillo, TX) • AFD American Funds Distributors, Inc. • AFD Amsterdam Fire Department • AFD Ancillary Function Driver
• AFD Angwin Fire Department (Angwin, CA)• AFD Anticipatory Failure Determination • AFD Apical Fibrobullous Disease • AFD Approved for Design • AFD Approximately Finite Dimensional • AFD April Fool's Day • AFD April Fools Day • AFD Arc Fault Detection • AFD Arc-Fault Detection • AFD Architecture Flow Diagrams • AFD Area Forecast Discussion (US National Weather Service) • AFD Armed Forces Division • AFD Arming & Fusing Device • AFD Arming-Firing Device • AfD Articles for Deletion (Wikipedia) • AFD Ask for Details • AFD assign fixed directory (US DoD) • AFD Assistant Flight Director • AFD Association Franèaise des Diabétiques• AFD Athletic Field Design • AFD Atlanta Fire Department • AFD Austin Fire Department (Texas) • AFD Autómata Finito Determinista• AFD Automated File Designator • AFD Automated Forging Design • AFD Automatic Fault Detection • AFD Automatic File Distribution • AFD Automatic Fire Detection • AFD Average Fade Duration • AFD Away from Desk • AFD Axial Flux Density • AFD Axial Flux Difference • AFD Active Format Description • AFD Adaptive Forward Differencing • AFD Adjustable Frequency Drives • AFD Asus Foundation Drivers
DEFINITIONS AND USEFUL EQUATIONS 2

AFA2D
Acronyms• AFD – Adjustable Frequency Drive• AHU – Air Handling Unit• ASHRAE – American Society of Heating Ventilating and Air
Conditioning Engineers• CV - Constant Volume• HVAC – Heating Ventilating and Air Conditioning• MOA – Minimum Outdoor Air• Psych Chart – Psychrometric Chart• VAV – Variable Air Volume• VFD – Variable Frequency Drive (Adjustable Frequency Drive)• VSD – Variable Speed Drive (Adjustable Frequency Drive)
DEFINITIONS AND USEFUL EQUATIONS 3
AFA2D
Definitions• Sensible energy, QS (Btu’s, Btu’s/lb)
Energy that causes a temperature change we can feel
• Dry bulb temperature, Tdb (°F)An indication of sensible energy measured by a standard thermometer exposed to air; increasing dry bulb temperature = increasing sensible energy
DEFINITIONS AND USEFUL EQUATIONS 4
AFA2D
Definitions• Latent energy, QL (Btu’s, Btu’s/lb)
Energy that is used to keep water in a vapor state
• Wet bulb temperature, Twb (°F)An indication of latent energy measured by a standard thermometer with its bulb covered by a wick that is saturated with water and exposed to moving air; increasing wet bulb temperature = increasing latent energy
DEFINITIONS AND USEFUL EQUATIONS 5

AFA2D
Definitions• Dew point temperature, Tdp (°F)
The temperature at which water will begin to condense out of a given sample of air. Also an indication of moisture content; increasing dew point = increasing latent energy.At saturation Tdp = Twb = Tdb
DEFINITIONS AND USEFUL EQUATIONS 6

AFA2D
Definitions• Enthalpy, h (Btu/lbdry air)
A measure of the total energy content of air including both sensible and latent energy; increasing enthalpy = increasing energy content
DEFINITIONS AND USEFUL EQUATIONS 7

AFA2D
Definitions• Relative humidity, RH (%)
The amount of water vapor in the air at a given temperature relative to what it could hold at that temperature; 100% = saturation; increasing specific humidity = increasing moisture content, increasing dew point, and increasing wet bulb temperature.In Antarctica, the relative humidity approaches 100% much of the time, just like in Florida after a thunderstorm
DEFINITIONS AND USEFUL EQUATIONS 8

AFA2D
Definitions• Specific humidity, w (lbwater/lbdryair, grainswater/lbdryair)
The ratio of the mass of water to the mass of dry air in a given sample of air; increasing specific humidity = increasing moisture content, increasing dew point, and increasing wet bulb temperature.In Antarctica, the specific humidity at a relative humidity of 100% is very low. In Florida, the specific humidity at a relative humidity of 100% is quite high relative to Antarctica.
DEFINITIONS AND USEFUL EQUATIONS 9

AFA2D
Definitions• Psychrometrics
The field of engineering concerned with the determination of physical and thermodynamic properties of gas-vapor mixtures.
DEFINITIONS AND USEFUL EQUATIONS 10

BAROMETRIC PRESSURE: 29.921 in. HGATMOSPHERIC PRESSURE: 14.696 psia
ALTITUDE: SEA LEVEL
0 5 10 15 20 25
30
35
40
45
50
50
55
55
ENTHALPY - BTU PER POUND OF DRY AIR
0
5
10
15
20
25
30
35
40
45
ENTHALP
Y - BTU
PER P
OUND OF D
RY AIR
Chart by: AKTON PSYCHROMETRICS, www.aktonassoc.com
-5 0 5 10 15 20 25 30 35 40 45 50 55 60 65 70 75 80 85 90 95 100
105
110
115
120
DR
Y BU
LB T
EMPE
RAT
UR
E - °
F
.001
.002
.003
.004
.005
.006
.007
.008
.009
.010
.011
.012
.013
.014
.015
.016
.017
.018
.019
.020
.021
.022
.023
.024
.025
15%
25%
2%4%6%8% RELATIVE HUMIDITY
10
20
30
40
50
6070
8090
-50
05
510
1015
1520
2025
2530
30
35
35
40
40
45
45
50
50
55
55
60
60
65
65
70
70
75
7580
8085
HU
MID
ITY
RAT
IO -
POU
ND
S M
OIS
TUR
E PE
R P
OU
ND
DR
Y AI
R
0
1.0 1.0
-2.0
4.08.0-8.0-4.0-2.0-1.0-0.5-0.4-0.3-0.2-0.10.10.20.3
0.4
0.50.6
0.8
-2000-1000
0
500
1000
1500
2000
3000
5000
-
SENSIBLE HEAT QsTOTAL HEAT Qt
ENTHALPYHUMIDITY RATIO
hW
BAROMETRIC PRESSURE: 29.921 in. HGATMOSPHERIC PRESSURE: 14.696 psia
ALTITUDE: SEA LEVEL
Chart by: AKTON PSYCHROMETRICS, www.aktonassoc.com
AFA2D
Definitions• Psychrometric Chart
Scary, complicated looking graph.
DEFINITIONS AND USEFUL EQUATIONS 11

AFA2D
Definitions• Psychrometric Equations
The alternative to using the psych chart.
DEFINITIONS AND USEFUL EQUATIONS 12

BAROMETRIC PRESSURE: 29.921 in. HGATMOSPHERIC PRESSURE: 14.696 psia
ALTITUDE: SEA LEVEL
0 5 10 15 20 25
30
35
40
45
50
50
55
55
ENTHALPY - BTU PER POUND OF DRY AIR
0
5
10
15
20
25
30
35
40
45
ENTHALP
Y - BTU
PER P
OUND OF D
RY AIR
Chart by: AKTON PSYCHROMETRICS, www.aktonassoc.com
-5 0 5 10 15 20 25 30 35 40 45 50 55 60 65 70 75 80 85 90 95 100
105
110
115
120
DR
Y BU
LB T
EMPE
RAT
UR
E - °
F
.001
.002
.003
.004
.005
.006
.007
.008
.009
.010
.011
.012
.013
.014
.015
.016
.017
.018
.019
.020
.021
.022
.023
.024
.025
15%
25%
2%4%6%8% RELATIVE HUMIDITY
10
20
30
40
50
6070
8090
-50
05
510
1015
1520
2025
2530
30
35
35
40
40
45
45
50
50
55
55
60
60
65
65
70
70
75
7580
8085
HU
MID
ITY
RAT
IO -
POU
ND
S M
OIS
TUR
E PE
R P
OU
ND
DR
Y AI
R
0
1.0 1.0
-2.0
4.08.0-8.0-4.0-2.0-1.0-0.5-0.4-0.3-0.2-0.10.10.20.3
0.4
0.50.6
0.8
-2000-1000
0
500
1000
1500
2000
3000
5000
-
SENSIBLE HEAT QsTOTAL HEAT Qt
ENTHALPYHUMIDITY RATIO
hW
BAROMETRIC PRESSURE: 29.921 in. HGATMOSPHERIC PRESSURE: 14.696 psia
ALTITUDE: SEA LEVEL
Chart by: AKTON PSYCHROMETRICS, www.aktonassoc.com
AFA2D
Definitions• Psychrometric Chart
Graphical tool that allows the informed user to determine multiple parameters like enthalpy, dew point, relative humidity, specific humidity, dry bulb temperature and wet bulb temperature for a sample of air if any two of them are know.
DEFINITIONS AND USEFUL EQUATIONS 13

BAROMETRIC PRESSURE: 29.921 in. HGATMOSPHERIC PRESSURE: 14.696 psia
ALTITUDE: SEA LEVEL
0 5 10 15 20 25
30
35
40
45
50
50
55
55
ENTHALPY - BTU PER POUND OF DRY AIR
0
5
10
15
20
25
30
35
40
45
ENTHALP
Y - BTU
PER P
OUND OF D
RY AIR
Chart by: AKTON PSYCHROMETRICS, www.aktonassoc.com
-5 0 5 10 15 20 25 30 35 40 45 50 55 60 65 70 75 80 85 90 95 100
105
110
115
120
DR
Y BU
LB T
EMPE
RAT
UR
E - °
F
.001
.002
.003
.004
.005
.006
.007
.008
.009
.010
.011
.012
.013
.014
.015
.016
.017
.018
.019
.020
.021
.022
.023
.024
.025
15%
25%
2%4%6%8% RELATIVE HUMIDITY
10
20
30
40
5060
7080
90
-50
05
510
1015
1520
2025
2530
30
35
35
40
40
45
45
50
50
55
55
60
60
65
65
70
70
75
7580
8085
HU
MID
ITY
RAT
IO -
POU
ND
S M
OIS
TUR
E PE
R P
OU
ND
DR
Y AI
R
0
1.0 1.0
-2.0
4.08.0-8.0-4.0-2.0-1.0-0.5-0.4-0.3-0.2-0.10.10.20.3
0.4
0.50.6
0.8
-2000-1000
0
500
1000
1500
2000
3000
5000
-
SENSIBLE HEAT QsTOTAL HEAT Qt
ENTHALPYHUMIDITY RATIO
hW
BAROMETRIC PRESSURE: 29.921 in. HGATMOSPHERIC PRESSURE: 14.696 psia
ALTITUDE: SEA LEVEL
Chart by: AKTON PSYCHROMETRICS, www.aktonassoc.com
Dry Bulb Temperature Axis and Lines
Increasing temperature and energy content
DEFINITIONS AND USEFUL EQUATIONS 14

BAROMETRIC PRESSURE: 29.921 in. HGATMOSPHERIC PRESSURE: 14.696 psia
ALTITUDE: SEA LEVEL
0 5 10 15 20 25
30
35
40
45
50
50
55
55
ENTHALPY - BTU PER POUND OF DRY AIR
0
5
10
15
20
25
30
35
40
45
ENTHALP
Y - BTU
PER P
OUND OF D
RY AIR
Chart by: AKTON PSYCHROMETRICS, www.aktonassoc.com
-5 0 5 10 15 20 25 30 35 40 45 50 55 60 65 70 75 80 85 90 95 100
105
110
115
120
DR
Y BU
LB T
EMPE
RAT
UR
E - °
F
.001
.002
.003
.004
.005
.006
.007
.008
.009
.010
.011
.012
.013
.014
.015
.016
.017
.018
.019
.020
.021
.022
.023
.024
.025
15%
25%
2%4%6%8% RELATIVE HUMIDITY
10
20
30
40
5060
7080
90
-50
05
510
1015
1520
2025
2530
30
35
35
40
40
45
45
50
50
55
55
60
60
65
65
70
70
75
7580
8085
HU
MID
ITY
RAT
IO -
POU
ND
S M
OIS
TUR
E PE
R P
OU
ND
DR
Y AI
R
0
1.0 1.0
-2.0
4.08.0-8.0-4.0-2.0-1.0-0.5-0.4-0.3-0.2-0.10.10.20.3
0.4
0.50.6
0.8
-2000-1000
0
500
1000
1500
2000
3000
5000
-
SENSIBLE HEAT QsTOTAL HEAT Qt
ENTHALPYHUMIDITY RATIO
hW
BAROMETRIC PRESSURE: 29.921 in. HGATMOSPHERIC PRESSURE: 14.696 psia
ALTITUDE: SEA LEVEL
Chart by: AKTON PSYCHROMETRICS, www.aktonassoc.com
Spec
ific
Hum
idity
Axi
s an
d Li
nes
Increasing moisture and energy content
DEFINITIONS AND USEFUL EQUATIONS 15
BAROMETRIC PRESSURE: 29.921 in. HGATMOSPHERIC PRESSURE: 14.696 psia
ALTITUDE: SEA LEVEL
0 5 10 15 20 25
30
35
40
45
50
50
55
55
ENTHALPY - BTU PER POUND OF DRY AIR
0
5
10
15
20
25
30
35
40
45
ENTHALP
Y - BTU
PER P
OUND OF D
RY AIR
Chart by: AKTON PSYCHROMETRICS, www.aktonassoc.com
-5 0 5 10 15 20 25 30 35 40 45 50 55 60 65 70 75 80 85 90 95 100
105
110
115
120
DR
Y BU
LB T
EMPE
RAT
UR
E - °
F
.001
.002
.003
.004
.005
.006
.007
.008
.009
.010
.011
.012
.013
.014
.015
.016
.017
.018
.019
.020
.021
.022
.023
.024
.025
15%
25%
2%4%6%8% RELATIVE HUMIDITY
10
20
30
40
5060
7080
90
-50
05
510
1015
1520
2025
2530
30
35
35
40
40
45
45
50
50
55
55
60
60
65
65
70
70
75
7580
8085
HU
MID
ITY
RAT
IO -
POU
ND
S M
OIS
TUR
E PE
R P
OU
ND
DR
Y AI
R
0
1.0 1.0
-2.0
4.08.0-8.0-4.0-2.0-1.0-0.5-0.4-0.3-0.2-0.10.10.20.3
0.4
0.50.6
0.8
-2000-1000
0
500
1000
1500
2000
3000
5000
-
SENSIBLE HEAT QsTOTAL HEAT Qt
ENTHALPYHUMIDITY RATIO
hW
BAROMETRIC PRESSURE: 29.921 in. HGATMOSPHERIC PRESSURE: 14.696 psia
ALTITUDE: SEA LEVEL
Chart by: AKTON PSYCHROMETRICS, www.aktonassoc.com
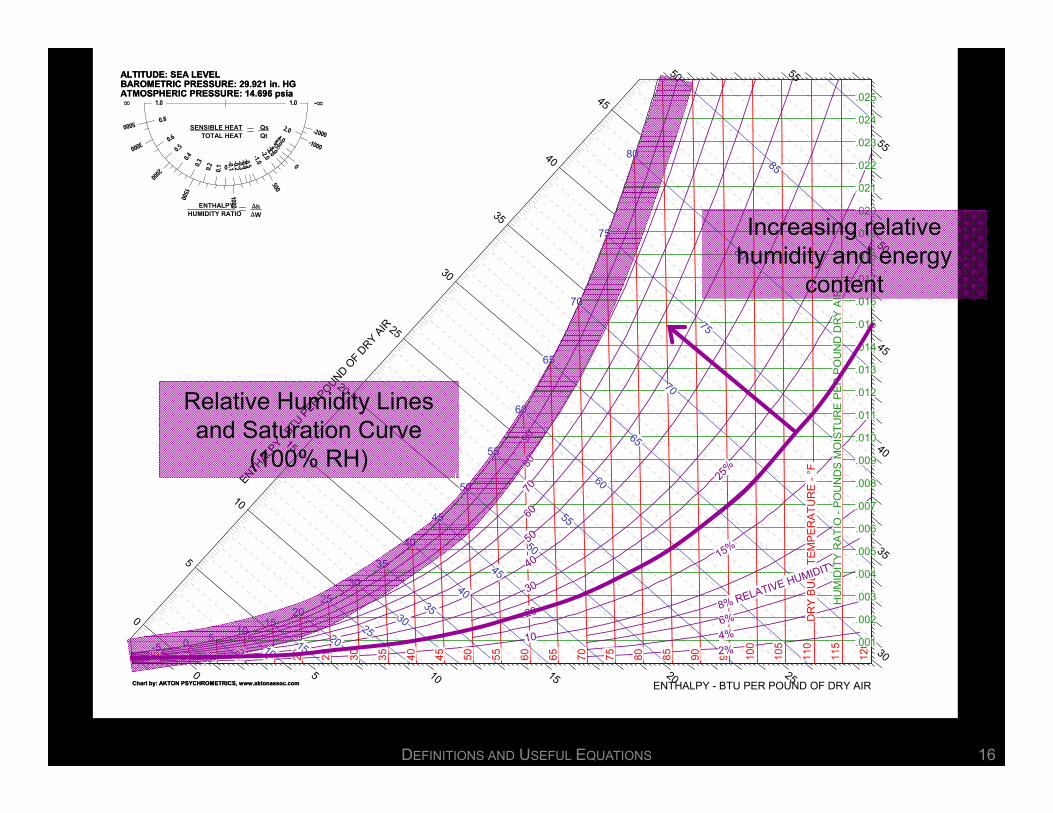
Relative Humidity Lines and Saturation Curve
(100% RH)
Increasing relative humidity and energy
content
DEFINITIONS AND USEFUL EQUATIONS 16

BAROMETRIC PRESSURE: 29.921 in. HGATMOSPHERIC PRESSURE: 14.696 psia
ALTITUDE: SEA LEVEL
0 5 10 15 20 25
30
35
40
45
50
50
55
55
ENTHALPY - BTU PER POUND OF DRY AIR
0
5
10
15
20
25
30
35
40
45
ENTHALP
Y - BTU
PER P
OUND OF D
RY AIR
Chart by: AKTON PSYCHROMETRICS, www.aktonassoc.com
-5 0 5 10 15 20 25 30 35 40 45 50 55 60 65 70 75 80 85 90 95 100
105
110
115
120
DR
Y BU
LB T
EMPE
RAT
UR
E - °
F
.001
.002
.003
.004
.005
.006
.007
.008
.009
.010
.011
.012
.013
.014
.015
.016
.017
.018
.019
.020
.021
.022
.023
.024
.025
15%
25%
2%4%6%8% RELATIVE HUMIDITY
10
20
30
40
5060
7080
90
-50
05
510
1015
1520
2025
2530
30
35
35
40
40
45
45
50
50
55
55
60
60
65
65
70
70
75
7580
8085
HU
MID
ITY
RAT
IO -
POU
ND
S M
OIS
TUR
E PE
R P
OU
ND
DR
Y AI
R
0
1.0 1.0
-2.0
4.08.0-8.0-4.0-2.0-1.0-0.5-0.4-0.3-0.2-0.10.10.20.3
0.4
0.50.6
0.8
-2000-1000
0
500
1000
1500
2000
3000
5000
-
SENSIBLE HEAT QsTOTAL HEAT Qt
ENTHALPYHUMIDITY RATIO
hW
BAROMETRIC PRESSURE: 29.921 in. HGATMOSPHERIC PRESSURE: 14.696 psia
ALTITUDE: SEA LEVEL
Chart by: AKTON PSYCHROMETRICS, www.aktonassoc.com
Wet Bulb temperature Axis and Lines
Increasing temperature and energy content
DEFINITIONS AND USEFUL EQUATIONS 17
BAROMETRIC PRESSURE: 29.921 in. HGATMOSPHERIC PRESSURE: 14.696 psia
ALTITUDE: SEA LEVEL
0 5 10 15 20 25
30
35
40
45
50
50
55
55
ENTHALPY - BTU PER POUND OF DRY AIR
0
5
10
15
20
25
30
35
40
45
ENTHALP
Y - BTU
PER P
OUND OF D
RY AIR
Chart by: AKTON PSYCHROMETRICS, www.aktonassoc.com
-5 0 5 10 15 20 25 30 35 40 45 50 55 60 65 70 75 80 85 90 95 100
105
110
115
120
DR
Y BU
LB T
EMPE
RAT
UR
E - °
F
.001
.002
.003
.004
.005
.006
.007
.008
.009
.010
.011
.012
.013
.014
.015
.016
.017
.018
.019
.020
.021
.022
.023
.024
.025
15%
25%
2%4%6%8% RELATIVE HUMIDITY
10
20
30
40
5060
7080
90
-50
05
510
1015
1520
2025
2530
30
35
35
40
40
45
45
50
50
55
55
60
60
65
65
70
70
75
7580
8085
HU
MID
ITY
RAT
IO -
POU
ND
S M
OIS
TUR
E PE
R P
OU
ND
DR
Y AI
R
0
1.0 1.0
-2.0
4.08.0-8.0-4.0-2.0-1.0-0.5-0.4-0.3-0.2-0.10.10.20.3
0.4
0.50.6
0.8
-2000-1000
0
500
1000
1500
2000
3000
5000
-
SENSIBLE HEAT QsTOTAL HEAT Qt
ENTHALPYHUMIDITY RATIO
hW
BAROMETRIC PRESSURE: 29.921 in. HGATMOSPHERIC PRESSURE: 14.696 psia
ALTITUDE: SEA LEVEL
Chart by: AKTON PSYCHROMETRICS, www.aktonassoc.com
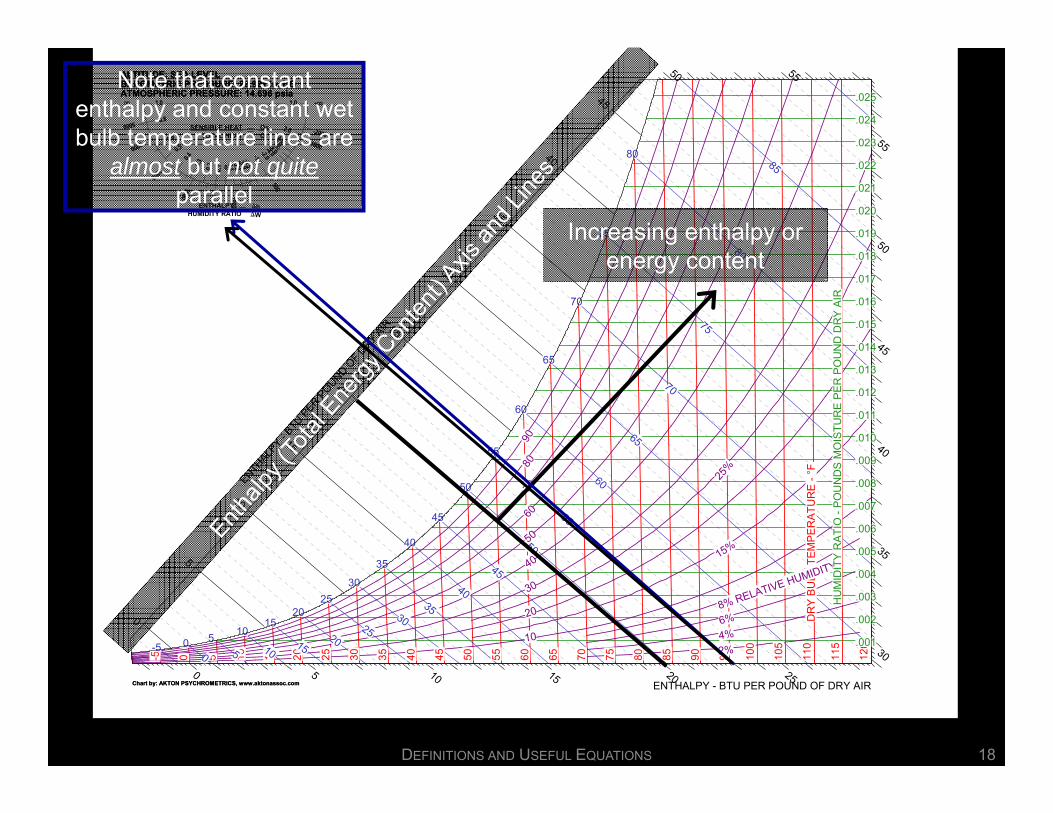
Increasing enthalpy or energy content
Note that constant enthalpy and constant wet bulb temperature lines are
almost but not quiteparallel
DEFINITIONS AND USEFUL EQUATIONS 18

BAROMETRIC PRESSURE: 29.921 in. HGATMOSPHERIC PRESSURE: 14.696 psia
ALTITUDE: SEA LEVEL
0 5 10 15 20 25
30
35
40
45
50
50
55
55
ENTHALPY - BTU PER POUND OF DRY AIR
0
5
10
15
20
25
30
35
40
45
ENTHALP
Y - BTU
PER P
OUND OF D
RY AIR
Chart by: AKTON PSYCHROMETRICS, www.aktonassoc.com
-5 0 5 10 15 20 25 30 35 40 45 50 55 60 65 70 75 80 85 90 95 100
105
110
115
120
DR
Y BU
LB T
EMPE
RAT
UR
E - °
F
.001
.002
.003
.004
.005
.006
.007
.008
.009
.010
.011
.012
.013
.014
.015
.016
.017
.018
.019
.020
.021
.022
.023
.024
.025
15%
25%
2%4%6%8% RELATIVE HUMIDITY
10
20
30
40
50
6070
8090
-50
05
510
1015
1520
2025
2530
30
35
35
40
40
45
45
50
50
55
55
60
60
65
65
70
70
75
7580
8085
HU
MID
ITY
RAT
IO -
POU
ND
S M
OIS
TUR
E PE
R P
OU
ND
DR
Y AI
R
0
1.0 1.0
-2.0
4.08.0-8.0-4.0-2.0-1.0-0.5-0.4-0.3-0.2-0.10.10.20.3
0.4
0.50.6
0.8
-2000-1000
0
500
1000
1500
2000
3000
5000
-
SENSIBLE HEAT QsTOTAL HEAT Qt
ENTHALPYHUMIDITY RATIO
hW
BAROMETRIC PRESSURE: 29.921 in. HGATMOSPHERIC PRESSURE: 14.696 psia
ALTITUDE: SEA LEVEL
Chart by: AKTON PSYCHROMETRICS, www.aktonassoc.com
AFA2D
Definitions• Psychrometric Chart
If you know the dry bulb temperature and relative humidity entering and leaving a cooling coil, you can plot those points on the chart and determine:• The entering and leaving enthalpy (energy content)• The load (how much energy was transferred)• The amount of moisture condensed, if any• The entering and leaving dew point temperature• The entering and leaving wet bulb temperature
DEFINITIONS AND USEFUL EQUATIONS 19

Learn More about Using a Psych Chart
HTML version at:http://www.buildingcontrolworkbench.comDownloadable .pdf at:http://customer.honeywell.com/techlit/pdf/77-0000s/77-E1100.pdf
DEFINITIONS AND USEFUL EQUATIONS 20

AFA2D
Definitions• Cooling
A process that removes energy. For a space, this is often accomplished by circulating air through it at a temperature below the required set point. For an airstream, this is often accomplished by passing it over a surface that is below the required supply temperature. If the surface is below the dew point of the air stream, dehumidification (moisture removal) will also occur.
DEFINITIONS AND USEFUL EQUATIONS 21

AFA2D
Definitions• Heating
A process that adds energy. For a space, this is often accomplished by circulating air through it at a temperature above the required set point. For an airstream, this is often accomplished by passing it over a surface that is above the required supply temperature.
DEFINITIONS AND USEFUL EQUATIONS 22

AFA2D
Definitions• Freezing
A condition that occurs when water is cooled to the point where it changes phase from a solid to a liquid.
DEFINITIONS AND USEFUL EQUATIONS 23

AFA2D
Definitions• Water Damage
A condition that occurs after frozen water contained in a HVAC coil changes back to the liquid phase.
DEFINITIONS AND USEFUL EQUATIONS 24

AFA2D
Definitions• Expletive
A generic reference to the field terminology used to describe and discuss water damage when it occurs.
DEFINITIONS AND USEFUL EQUATIONS 25

AFA2D
Definitions• Preheat
A process that heats a fluid stream to prepare it for a subsequent HVAC process. In air handling systems, this process is used to raise subfreezing air above freezing to protect water filled elements down stream from damage due to freezing.
See the Functional Testing Guide (www.peci.org/ftguide) Air Handling System Reference Guide Chapter 5 – Preheat, Table
5.1 to contrast preheat, reheat and heating applications
DEFINITIONS AND USEFUL EQUATIONS 26

AFA2D
Definitions• Reheat
A process that uses heat to warm air being delivered to a zone to prevent over cooling. The temperature of the air was set by the need to hit a dehumidification target or by the requirements of another zone, so it can not be raised at the central system. The volume can not be reduced because it has been set to assure proper ventilation (contaminant control). In the limit, reheat will raise the supply temperature to the zone temperature but not above it.
DEFINITIONS AND USEFUL EQUATIONS 27

AFA2D
Definitions• Economizer Process
An HVAC process designed to minimize the energy required to cool a building
DEFINITIONS AND USEFUL EQUATIONS 28

AFA2D
Definitions• Constant Volume System
An air handling or pumping process that, in general terms, is always moving the same amount of water or air. Pump or fan energy is fairly steady state. Supply and return temperature differences will tend to vary with load. In water systems, the control valves will tend to be three-way valves.
DEFINITIONS AND USEFUL EQUATIONS 29

AFA2D
Definitions• Variable Volume System/Variable Air Volume System
(VAV)An air handling or pumping process that varies the flow of water or air to match the requirements of the load.. Supply and return temperature differences will tend to hold steady regardless of load. In water systems, the control valves will tend to be two-way valves.
DEFINITIONS AND USEFUL EQUATIONS 30

BenchmarksContrasting Utility Consumption with Your Peers
DEFINITIONS AND USEFUL EQUATIONS 31

Peak electrical consumption may be driven by the need to cool
Average Daily Consumption AnalysisContrasting Utility Consumption with Other Metrics
DEFINITIONS AND USEFUL EQUATIONS 32

Occupancy may also be a driver for electrical consumption, but maybe not
FOCUSING OUR EFFORT 33

Gas consumption tends to be driven by the need to heat
FOCUSING OUR EFFORT 34

Gas consumption seems to be unrelated to occupancy, which is not always true for a hotel due to the domestic hot water loads
FOCUSING OUR EFFORT 35

Interval Data Consumption AnalysisLooking at Variations in Hour by Hour Patterns
DEFINITIONS AND USEFUL EQUATIONS 36

Sensible Heating or Cooling Loads
DEFINITIONS AND USEFUL EQUATIONS 37

Where did the Units Conversion Constant Come From?
DEFINITIONS AND USEFUL EQUATIONS 38

Where did the Units Conversion Constant Come From?
DEFINITIONS AND USEFUL EQUATIONS 39

Specific Heat and Density of Air versus Temperature
0.200
0.210
0.220
0.230
0.240
0.250
0.260
-100 0 100 200 300 400 500
Temperature,°F
Spec
ific
Hea
t, bt
u/lb
-°F
0.00
0.04
0.08
0.12
0.16
0.20
0.24
Den
sity
, lb/
cubi
c fo
ot
Specific Heat Density of Dry Air Density of Saturated Air
Physical Properties can Vary …
DEFINITIONS AND USEFUL EQUATIONS 40

… so Conversion Constants Only are Valid for a Range of Conditions
Versus 1.08 in the equation in common use
DEFINITIONS AND USEFUL EQUATIONS 41

… so Conversion Constants Only are Valid for a Range of Conditions
Virtually the same as for cold dry air
DEFINITIONS AND USEFUL EQUATIONS 42

… so Conversion Constants Only are Valid for a Range of Conditions
Versus 1.08 in the equation in common use
DEFINITIONS AND USEFUL EQUATIONS 43
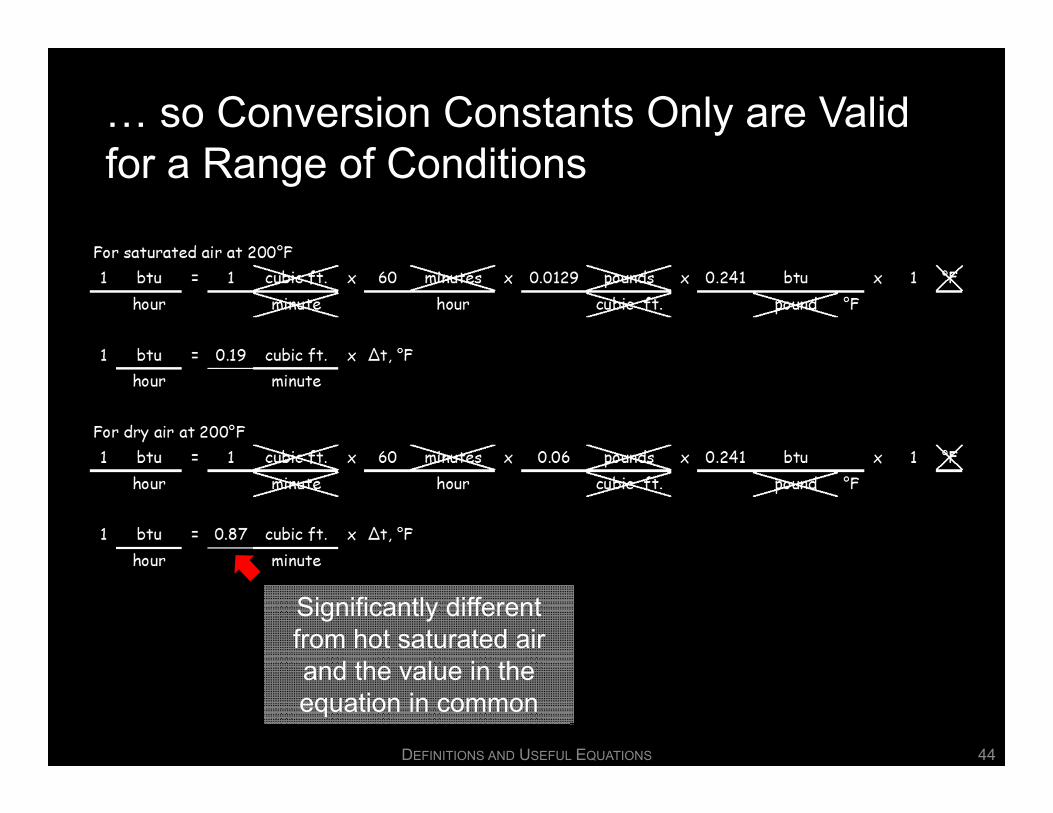
… so Conversion Constants Only are Valid for a Range of Conditions
Significantly different from hot saturated air and the value in the equation in common
DEFINITIONS AND USEFUL EQUATIONS 44
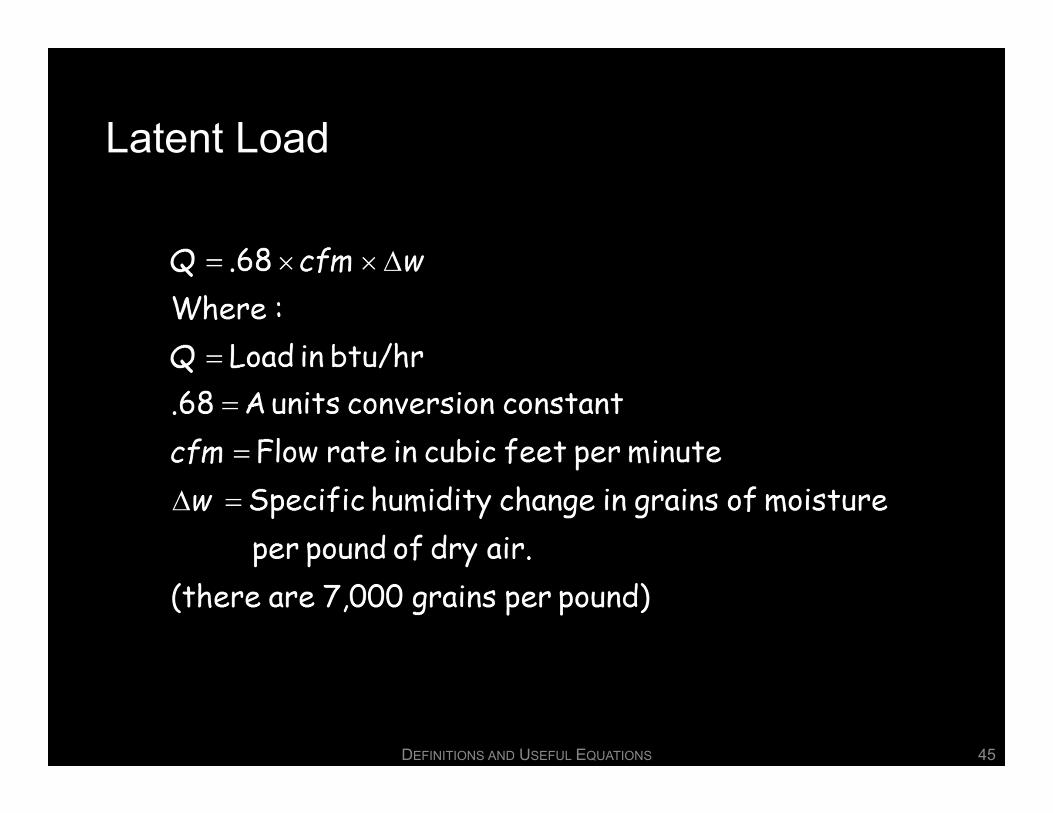
Latent Load
DEFINITIONS AND USEFUL EQUATIONS 45

Total Load
DEFINITIONS AND USEFUL EQUATIONS 46

Water Side Load
DEFINITIONS AND USEFUL EQUATIONS 47
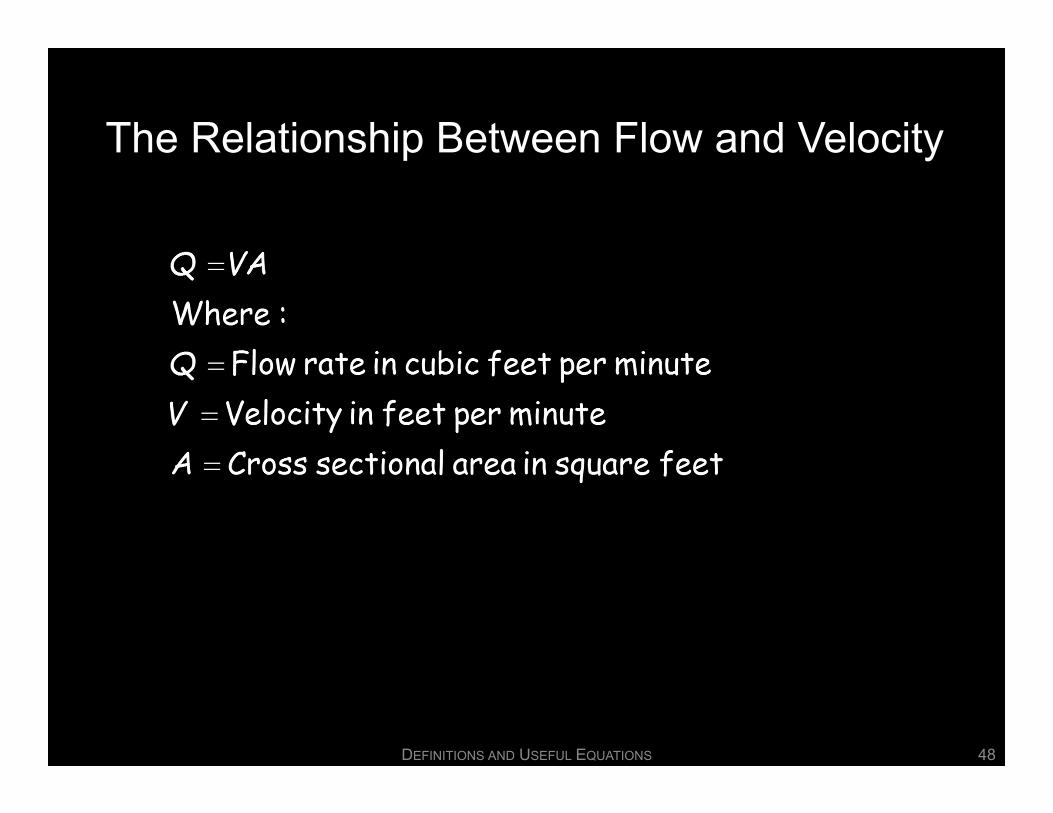
The Relationship Between Flow and Velocity
DEFINITIONS AND USEFUL EQUATIONS 48
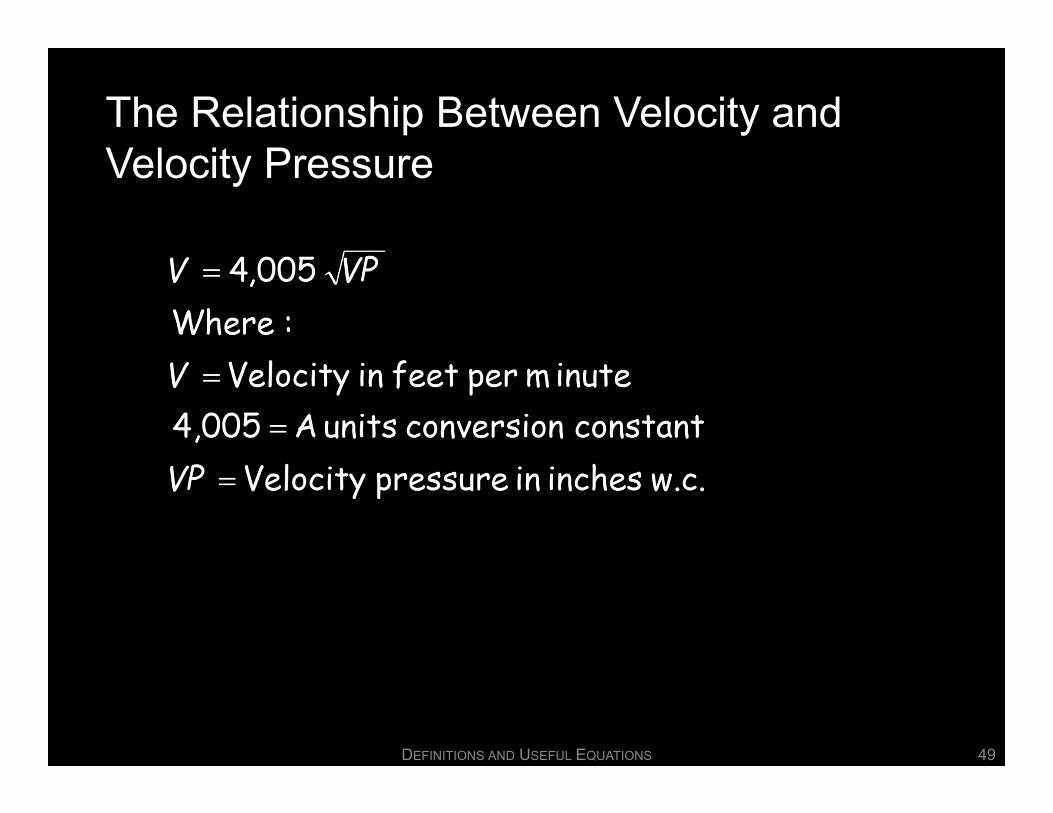
The Relationship Between Velocity and Velocity Pressure
DEFINITIONS AND USEFUL EQUATIONS 49
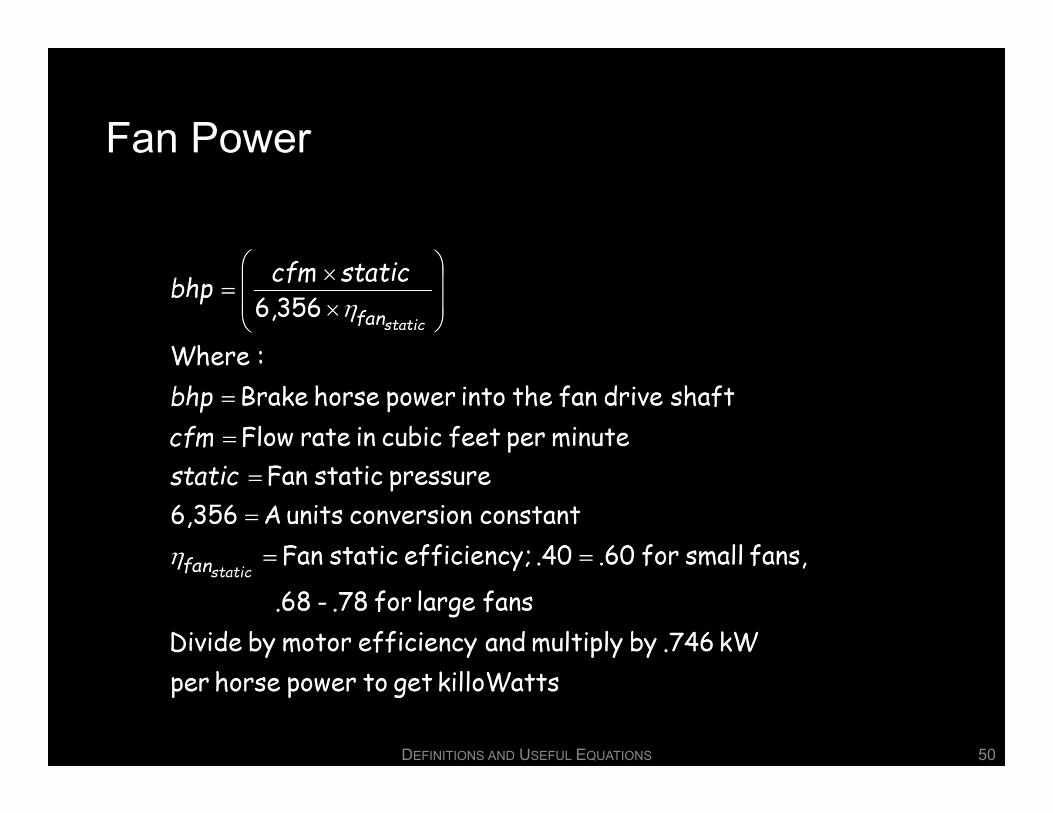
Fan Power
DEFINITIONS AND USEFUL EQUATIONS 50

Unit Conversions for Working with SI Units
DEFINITIONS AND USEFUL EQUATIONS 51

Pump Power
DEFINITIONS AND USEFUL EQUATIONS 52

Unit Conversions for Working with SI Units
DEFINITIONS AND USEFUL EQUATIONS 53

Calculating Kw Into the Pump Motor
DEFINITIONS AND USEFUL EQUATIONS 54

Calculating Kw Into the Pump Motor (Continued)
DEFINITIONS AND USEFUL EQUATIONS 55

Calculating Power Into the Fan Motor as kW
DEFINITIONS AND USEFUL EQUATIONS 56
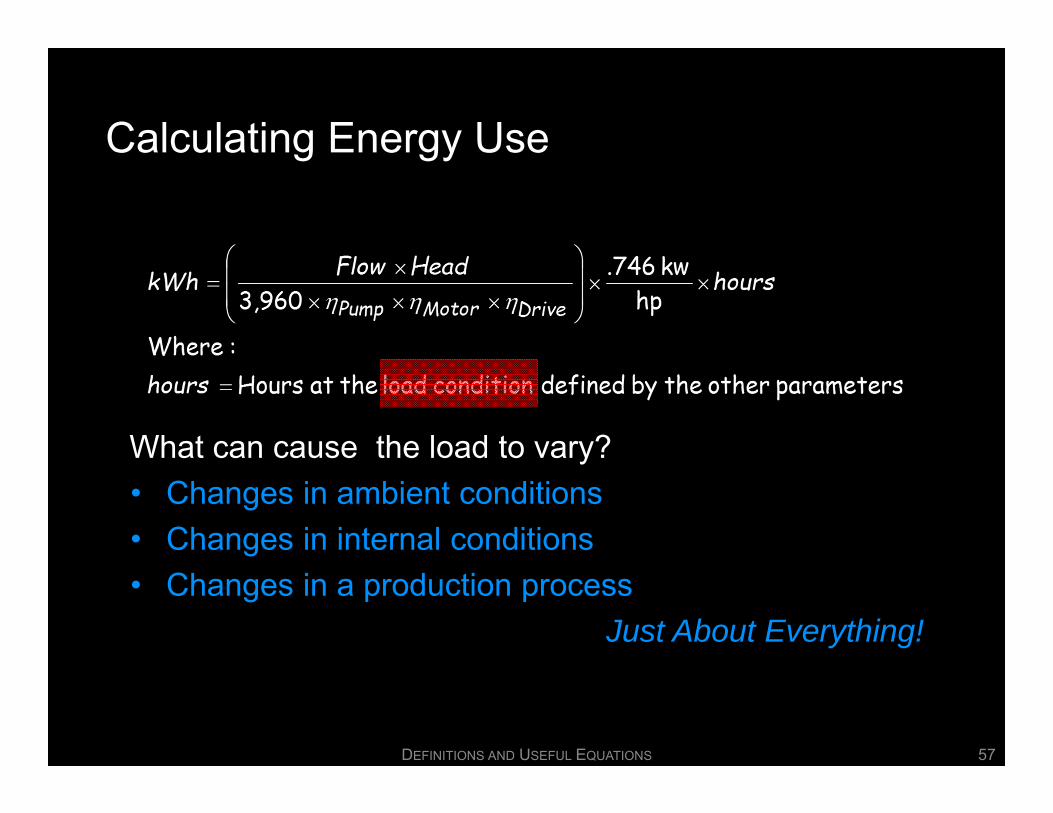
Calculating Energy Use
What can cause the load to vary?• Changes in ambient conditions• Changes in internal conditions• Changes in a production process
Just About Everything!
DEFINITIONS AND USEFUL EQUATIONS 57

The Square Law
DEFINITIONS AND USEFUL EQUATIONS 58

Conservation of Mass and Energy
DEFINITIONS AND USEFUL EQUATIONS 59
The Goes Inta’s gotta equal the Goes Outa’s
Dr. Al Black
The tee where the building return meets the bypass line is a node in the system
‒ Energy into and out of the node must be equal
‒ Mass flow into and out of the node must be equal
Re
Return Flow at Return Temperature
Bypass Flow at Bypass Temperature
Chiller Flow at Chiller Entering Temperature

Conservation of Mass and Energy
DEFINITIONS AND USEFUL EQUATIONS 60
The Goes Inta’s gotta equal the Goes Outa’s
Dr. Al Black
The tee where the building return meets the bypass line is a node in the system
‒ Energy into and out of the node must be equal
‒ Mass flow into and out of the node must be equal
‒ This is a steady state, steady flow process described by the continuity equation
Re
Return Flow at Return Temperature
Bypass Flow at Bypass Temperature
Chiller Flow at Chiller Entering Temperature

Conservation of Mass and Energy
DEFINITIONS AND USEFUL EQUATIONS 61
The Goes Inta’s gotta equal the Goes Outa’s
Dr. Al Black
The tee where the building return meets the bypass line is a node in the system
‒ Energy into and out of the node must be equal
‒ Mass flow into and out of the node must be equal
‒ This is a steady state, steady flow process described by the continuity equation
‒ For a tee in the pipe, the continuity equation can be simplified
Re
Return Flow at Return Temperature
Bypass Flow at Bypass Temperature
Chiller Flow at Chiller Entering Temperature
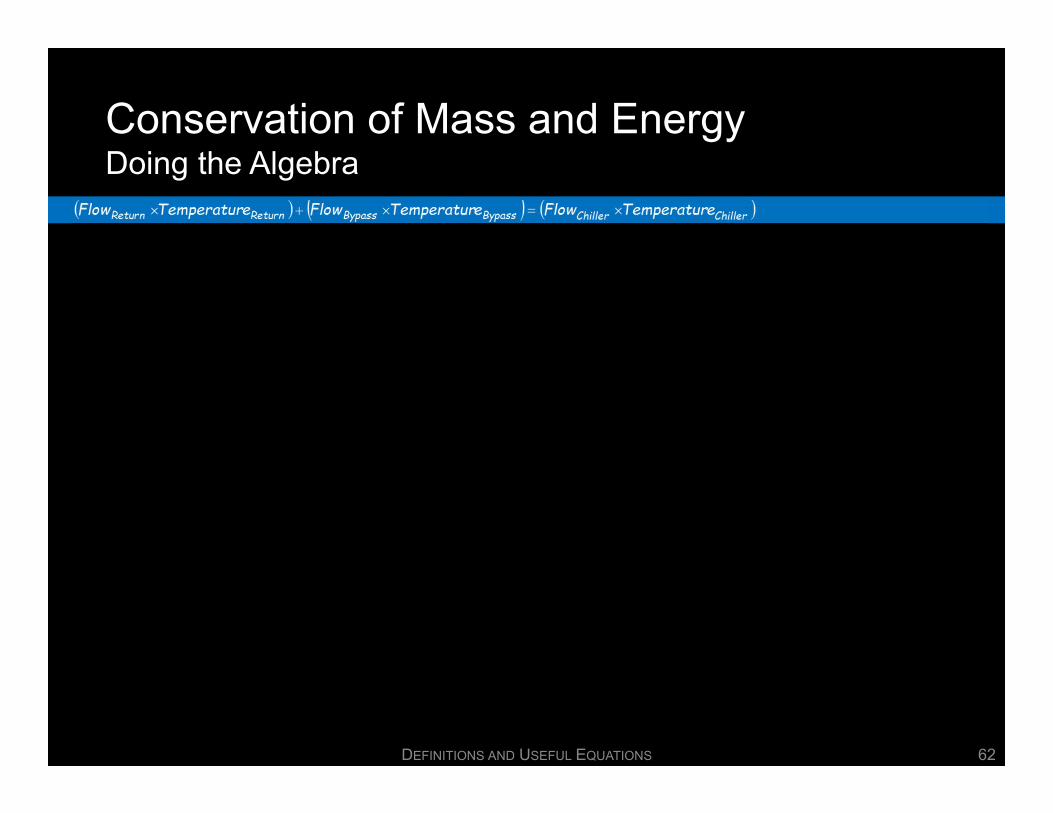
Conservation of Mass and EnergyDoing the Algebra
DEFINITIONS AND USEFUL EQUATIONS 62
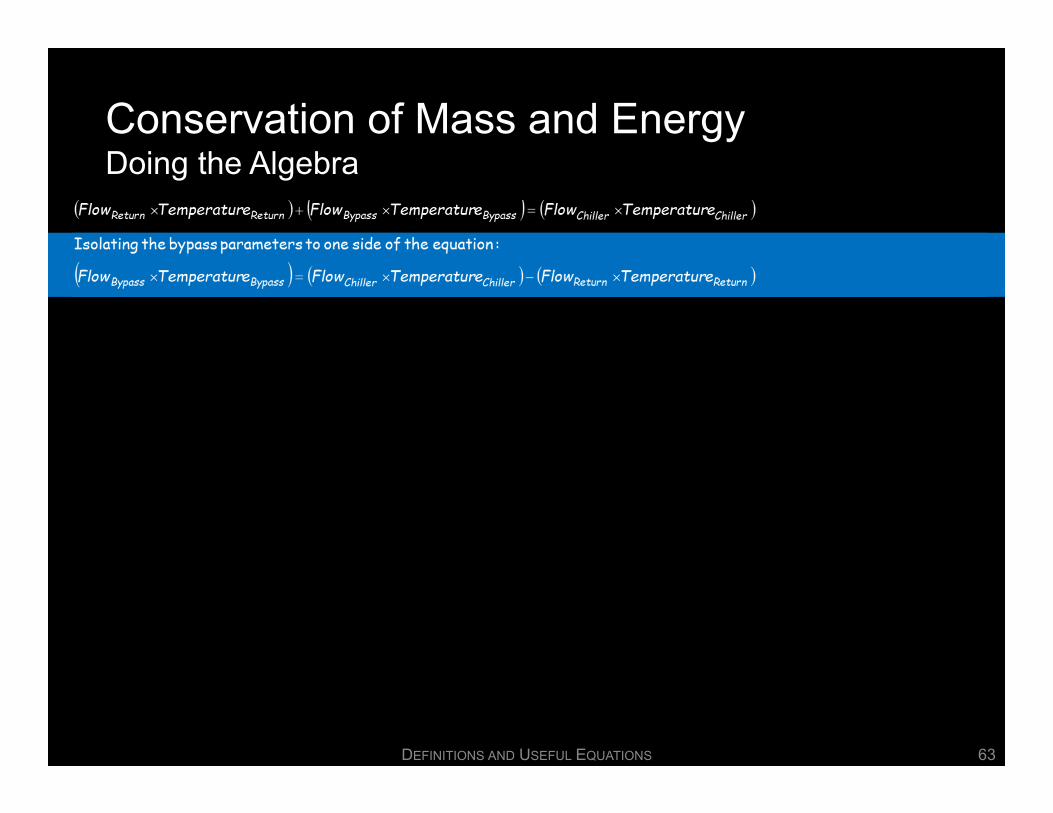
Conservation of Mass and EnergyDoing the Algebra
DEFINITIONS AND USEFUL EQUATIONS 63

Conservation of Mass and EnergyDoing the Algebra
DEFINITIONS AND USEFUL EQUATIONS 64

Conservation of Mass and EnergyDoing the Algebra
DEFINITIONS AND USEFUL EQUATIONS 65

Conservation of Mass and EnergyDoing the Algebra
DEFINITIONS AND USEFUL EQUATIONS 66
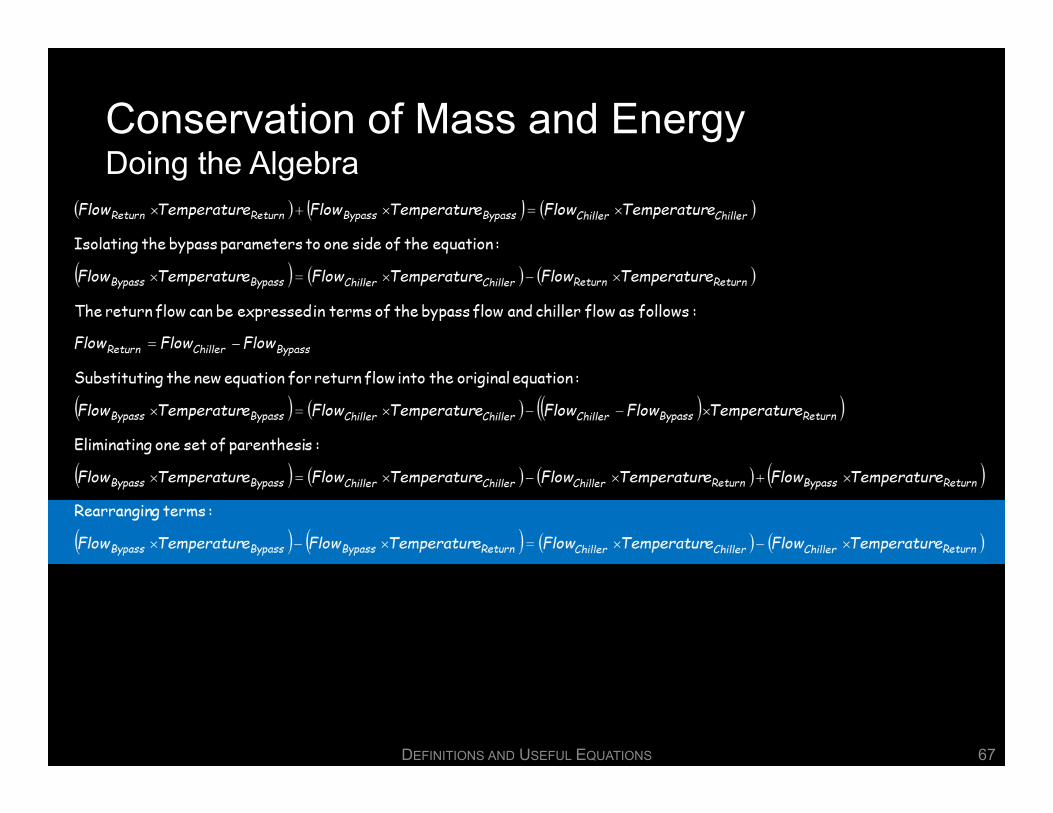
Conservation of Mass and EnergyDoing the Algebra
DEFINITIONS AND USEFUL EQUATIONS 67

Conservation of Mass and EnergyDoing the Algebra
DEFINITIONS AND USEFUL EQUATIONS 68

Conservation of Mass and EnergyDoing the Algebra
DEFINITIONS AND USEFUL EQUATIONS 69
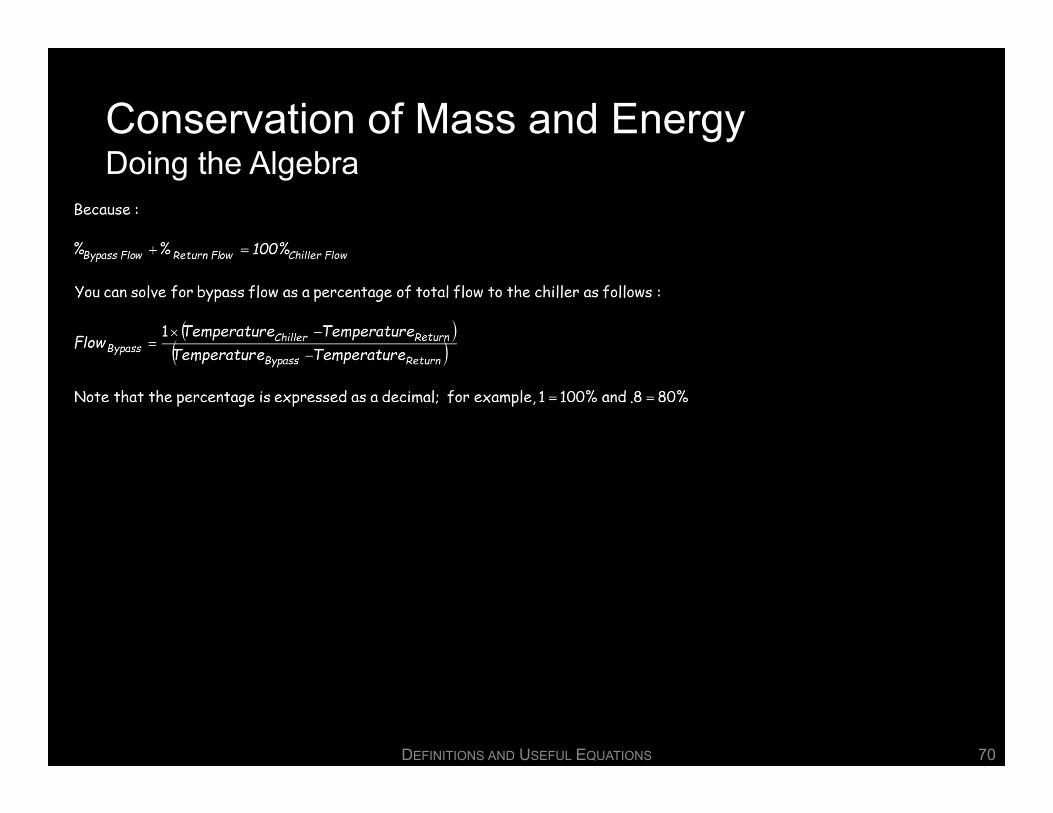
Conservation of Mass and EnergyDoing the Algebra
DEFINITIONS AND USEFUL EQUATIONS 70

Conservation of Mass and EnergyDoing the Algebra
DEFINITIONS AND USEFUL EQUATIONS 71

Conservation of Mass and EnergyDoing the Algebra
DEFINITIONS AND USEFUL EQUATIONS 72
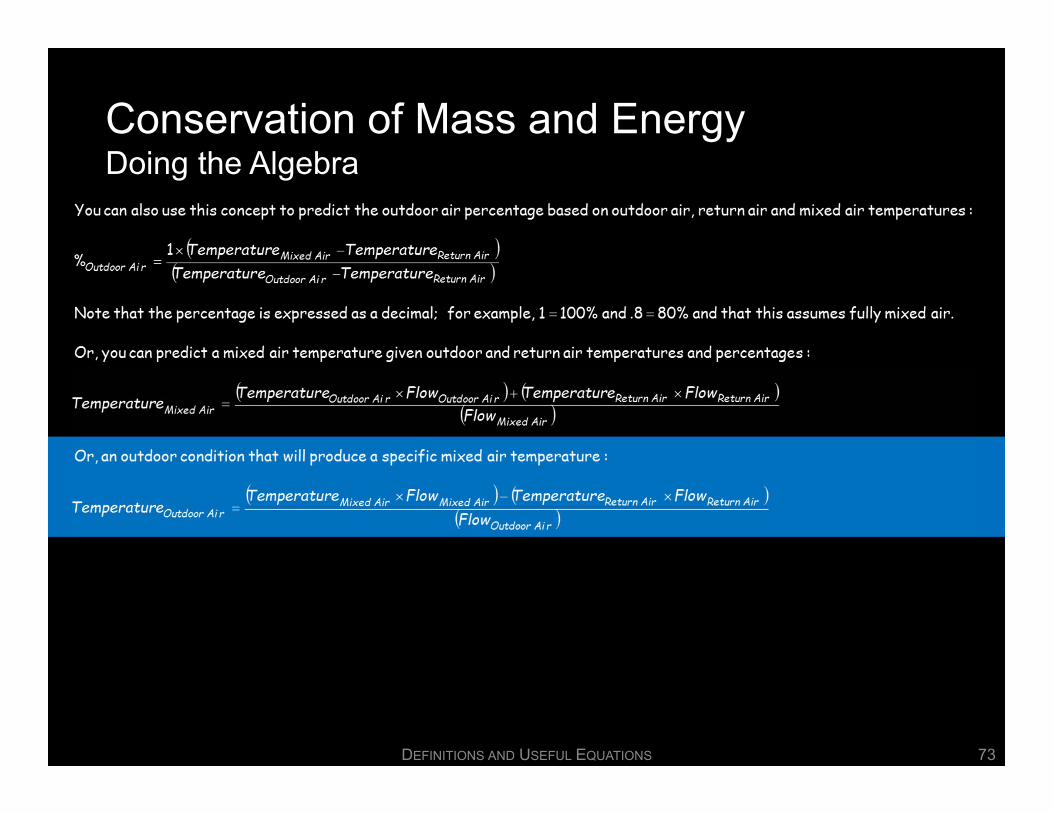
Conservation of Mass and EnergyDoing the Algebra
DEFINITIONS AND USEFUL EQUATIONS 73