hvac maintenance and technologies - fstrategies.com - maintenance and technologies ... (2007...
TRANSCRIPT
HVAC - Maintenance and TechnologiesFederal Utility Partnership Working Group Meeting
Providence, Rhode IslandApril 15, 2010
BY
Ramin Faramarzi, P.E.
Technology Test Centers (TTC)Design and Engineering Services
Southern California Edison (SCE)www.sce.com/rttc
2
Outline
• Introduction to SCE’s TTC• Overview of energy challenges in California (CA) • Role of HVAC in CA’s energy and demand equations• Factors affecting HVAC performance
• Focus on SCE’s research on maintenance faults• Next generation of HVAC equipment• HVAC technologies on SCE’s TTC radar• Black boxes – do they all work?
3
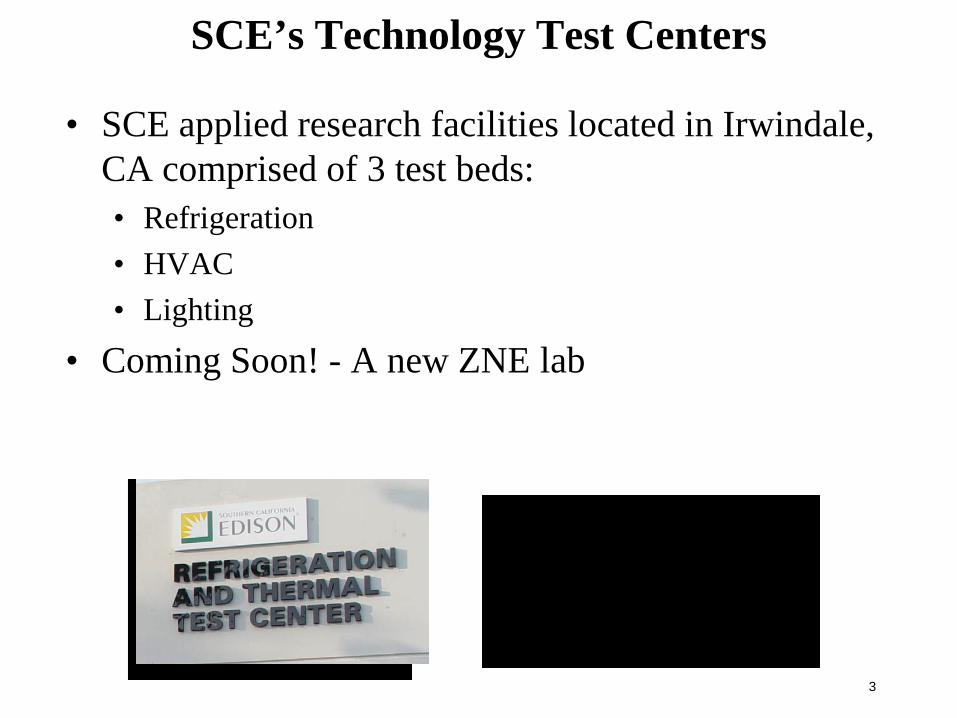
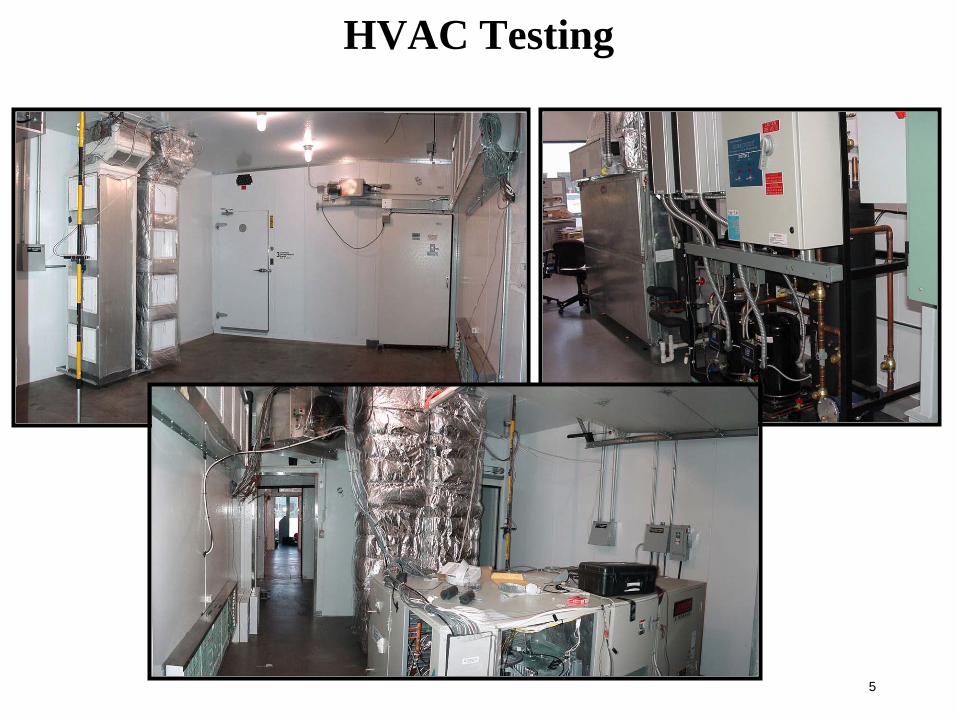
SCE’s Technology Test Centers
• SCE applied research facilities located in Irwindale, CA comprised of 3 test beds:• Refrigeration• HVAC• Lighting
• Coming Soon! - A new ZNE lab
4
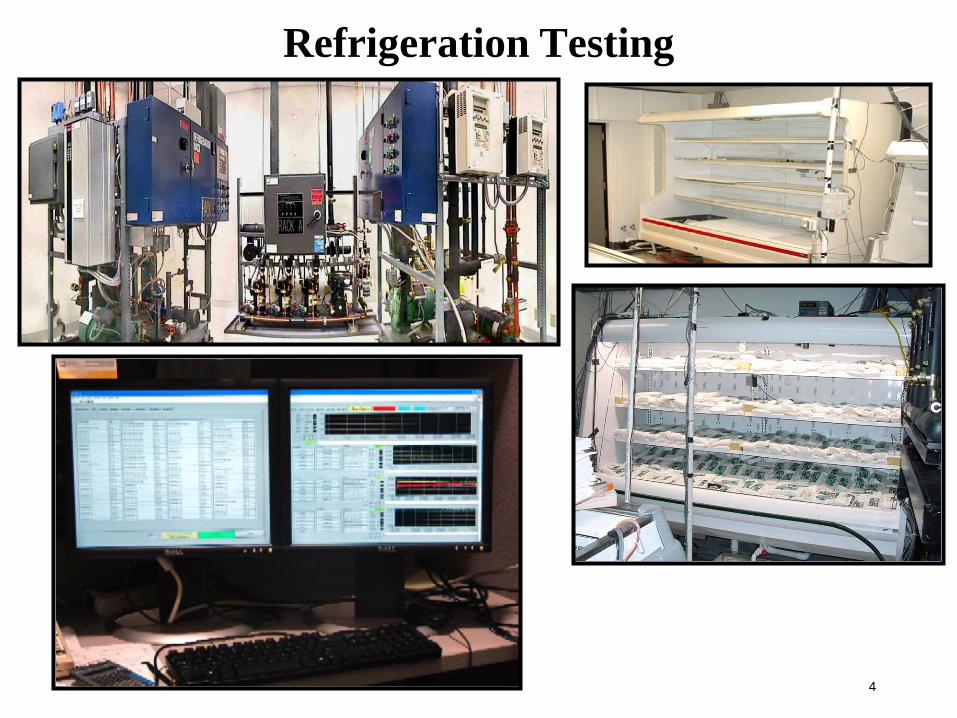
Refrigeration Testing
5
HVAC Testing

6
Lighting Testing
7
Future of Energy Efficiency in California
• Climate change initiatives are drivers• California Assembly Bill 32 (AB 32)
• Greenhouse gas (GHG) be reduced to• 1990 levels by 2020• 80% below 1990 level by 2050
• DSM transition to IDSM and renewable generation• By 2020 all new residential buildings and by 2030 all
new construction commercial buildings must be Zero Net Energy (ZNE)
• HVAC systems to be tailored to California’s hot and dry climate
8
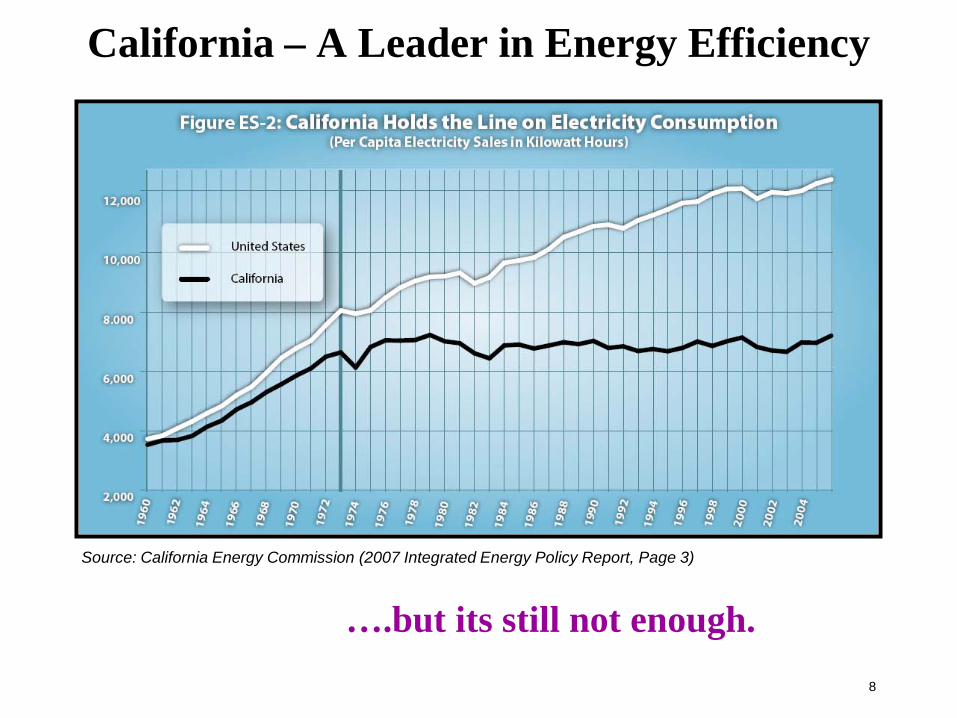
California – A Leader in Energy Efficiency
Source: California Energy Commission (2007 Integrated Energy Policy Report, Page 3)
….but its still not enough.
9
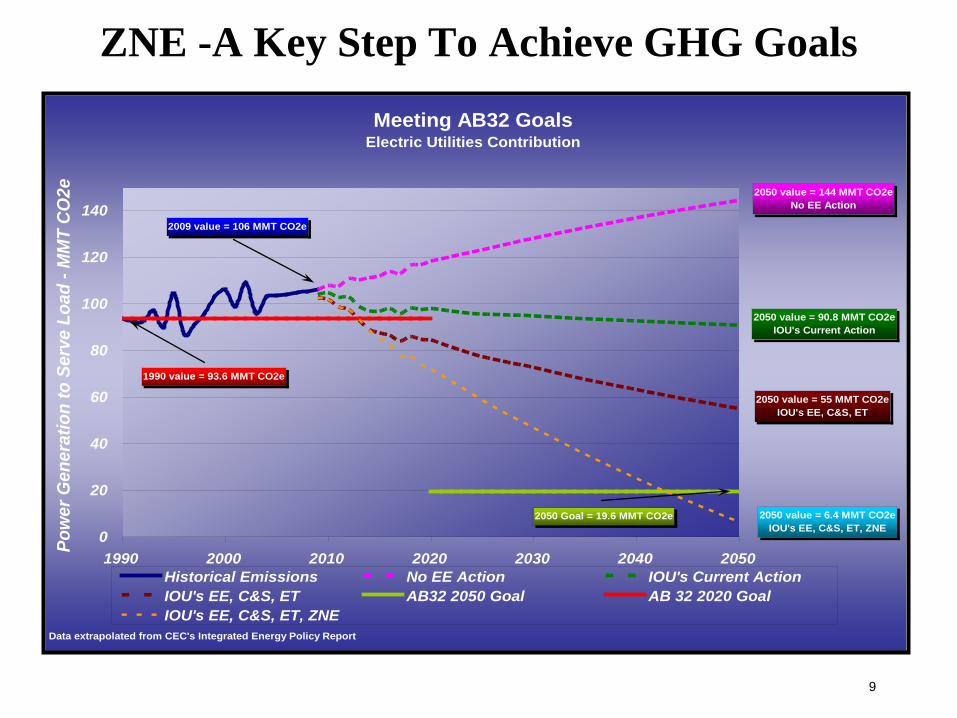
ZNE -A Key Step To Achieve GHG GoalsMeeting AB32 Goals
Electric Utilities Contribution
2009 value = 106 MMT CO2e
2050 value = 144 MMT CO2eNo EE Action
2050 value = 90.8 MMT CO2eIOU's Current Action
2050 value = 55 MMT CO2eIOU's EE, C&S, ET
2050 Goal = 19.6 MMT CO2e
1990 value = 93.6 MMT CO2e
2050 value = 6.4 MMT CO2eIOU's EE, C&S, ET, ZNE
0
20
40
60
80
100
120
140
1990 2000 2010 2020 2030 2040 2050
Pow
er G
ener
atio
n to
Ser
ve L
oad
- MM
T C
O2e
Historical Emissions No EE Action IOU's Current ActionIOU's EE, C&S, ET AB32 2050 Goal AB 32 2020 GoalIOU's EE, C&S, ET, ZNE
Data extrapolated from CEC's Integrated Energy Policy Report
10
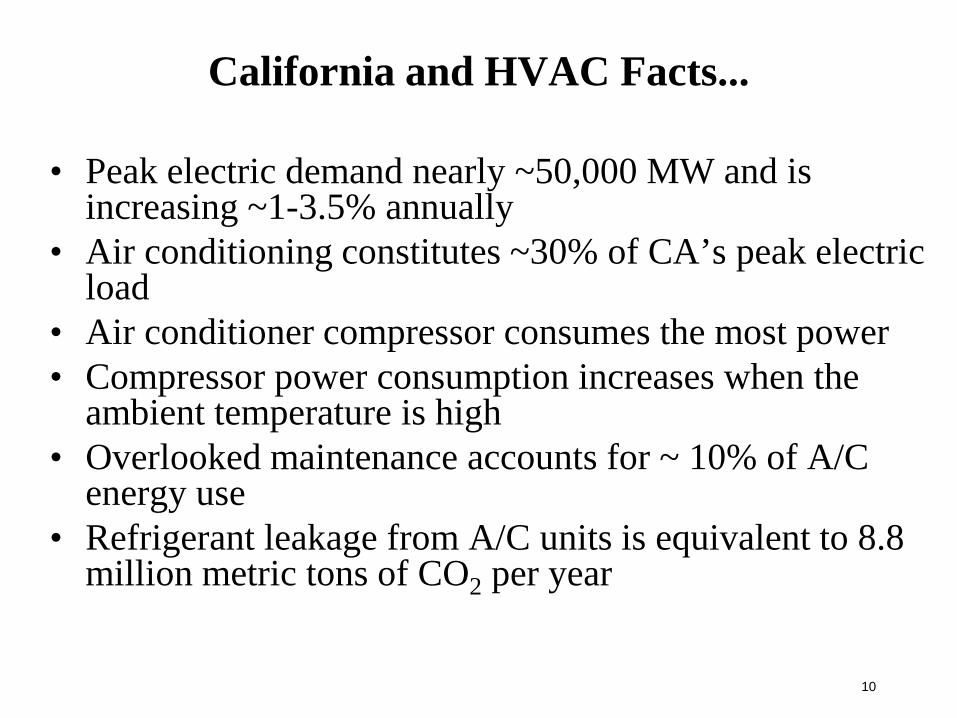
California and HVAC Facts...
• Peak electric demand nearly ~50,000 MW and is increasing ~1-3.5% annually
• Air conditioning constitutes ~30% of CA’s peak electric load
• Air conditioner compressor consumes the most power• Compressor power consumption increases when the
ambient temperature is high • Overlooked maintenance accounts for ~ 10% of A/C
energy use• Refrigerant leakage from A/C units is equivalent to 8.8
million metric tons of CO2 per year
11
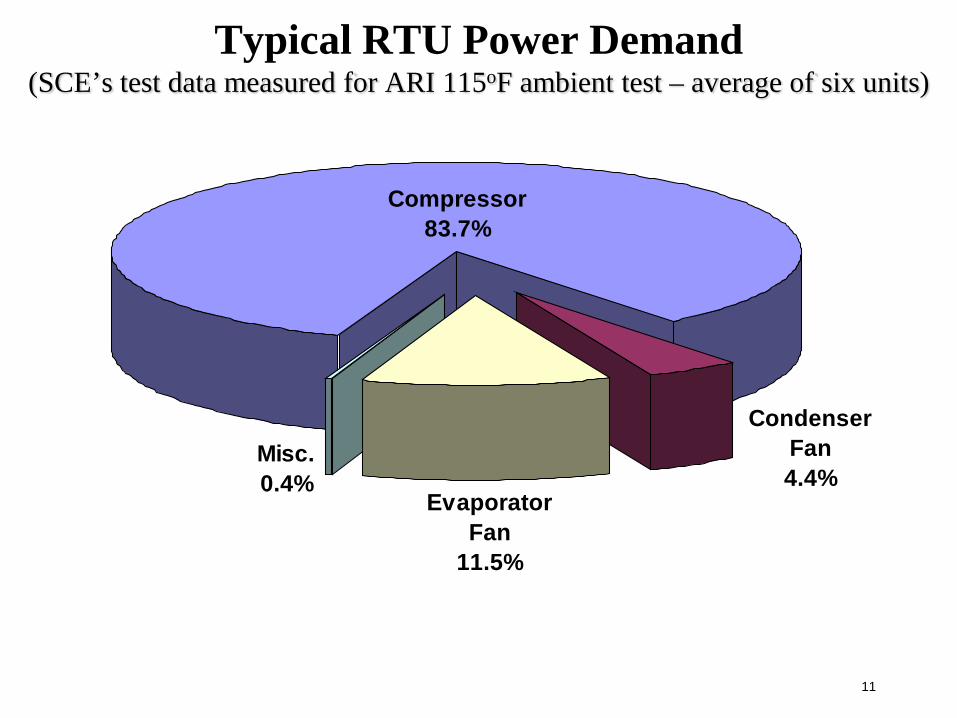
Typical RTU Power Demand(SCE’s test data measured for ARI 115oF ambient test – average of six units)
Evaporator Fan
11.5%
Misc.0.4%
Condenser Fan4.4%
Compressor83.7%
12
Key Parameters Affecting HVAC Performance
• Ambient Conditions• Maintenance• Effectiveness of energy efficiency features
13
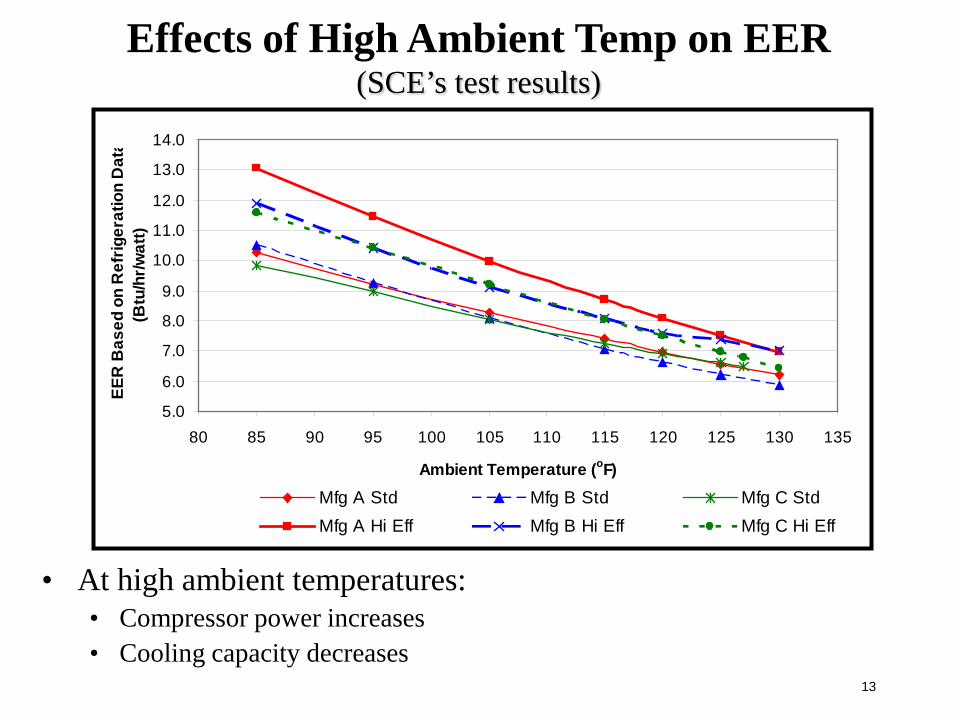
• At high ambient temperatures:• Compressor power increases• Cooling capacity decreases
5.0
6.0
7.0
8.0
9.0
10.0
11.0
12.0
13.0
14.0
80 85 90 95 100 105 110 115 120 125 130 135
Ambient Temperature (oF)
EER
Bas
ed o
n R
efrig
erat
ion
Dat
a
(Btu
/hr/w
att)
Mfg A Std Mfg B Std Mfg C StdMfg A Hi Eff Mfg B Hi Eff Mfg C Hi Eff
Effects of High Ambient Temp on EER (SCE’s test results)

14
Effects of Overlooked Maintenance(based on tests conducted at SCE’s TTC)
15
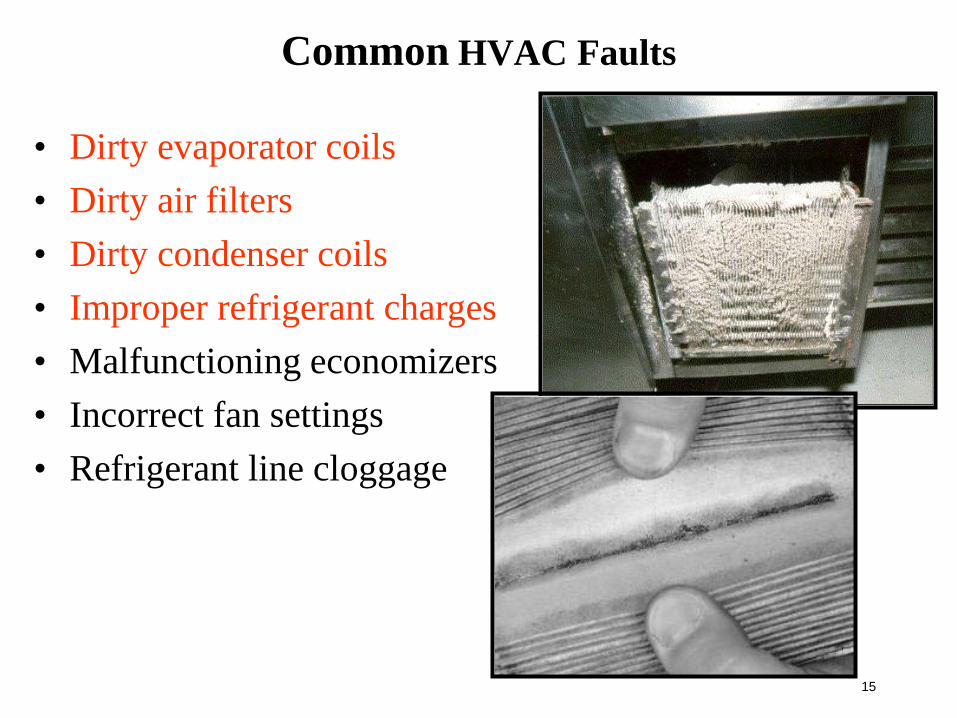
Common HVAC Faults
• Dirty evaporator coils• Dirty air filters• Dirty condenser coils• Improper refrigerant charges• Malfunctioning economizers• Incorrect fan settings• Refrigerant line cloggage
16
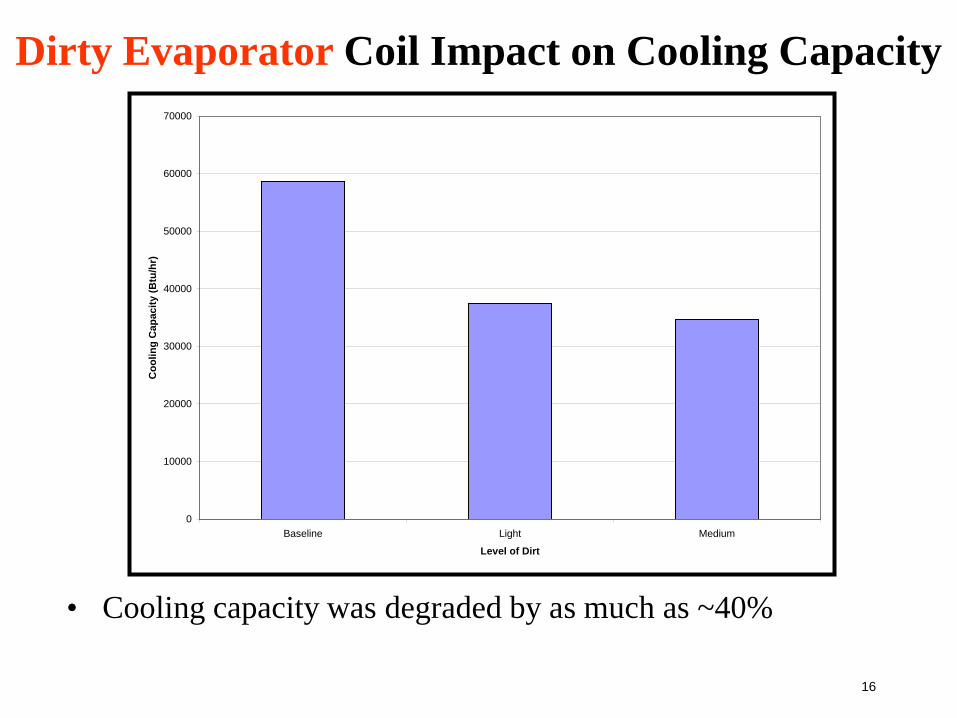
Dirty Evaporator Coil Impact on Cooling Capacity
0
10000
20000
30000
40000
50000
60000
70000
Baseline Light Medium
Level of Dirt
Coo
ling
Cap
acity
(Btu
/hr)
• Cooling capacity was degraded by as much as ~40%
17
0.00
1.00
2.00
3.00
4.00
5.00
6.00
Baseline Light Medium
Level of Dirt
Pow
er (k
W)
Total Compressor Evaporator Fan Condenser Fan
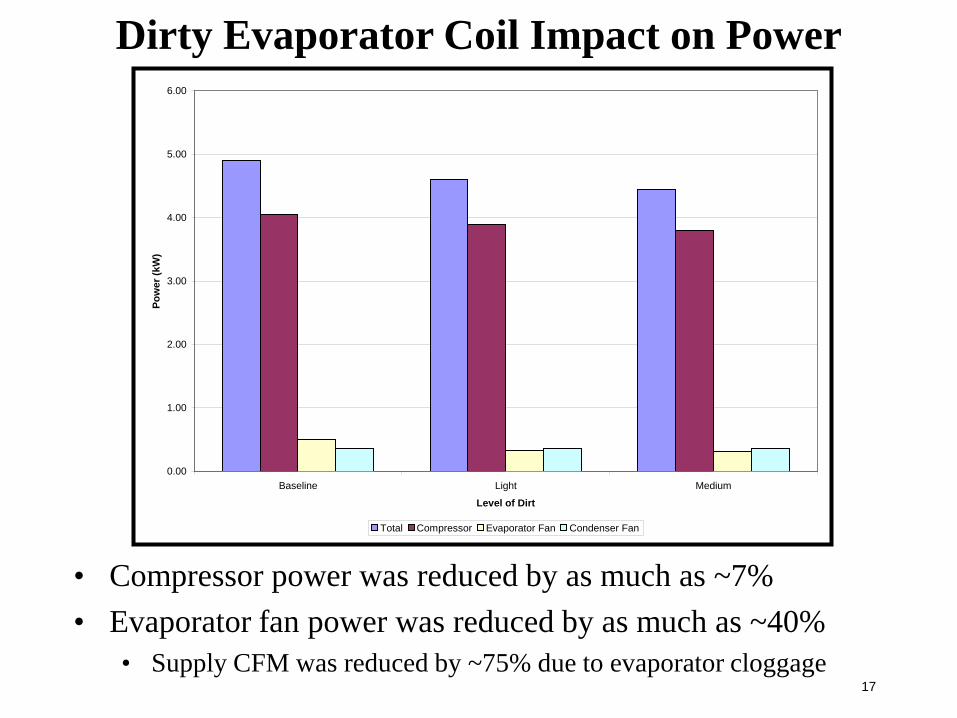
Dirty Evaporator Coil Impact on Power
• Compressor power was reduced by as much as ~7%• Evaporator fan power was reduced by as much as ~40%
• Supply CFM was reduced by ~75% due to evaporator cloggage
18
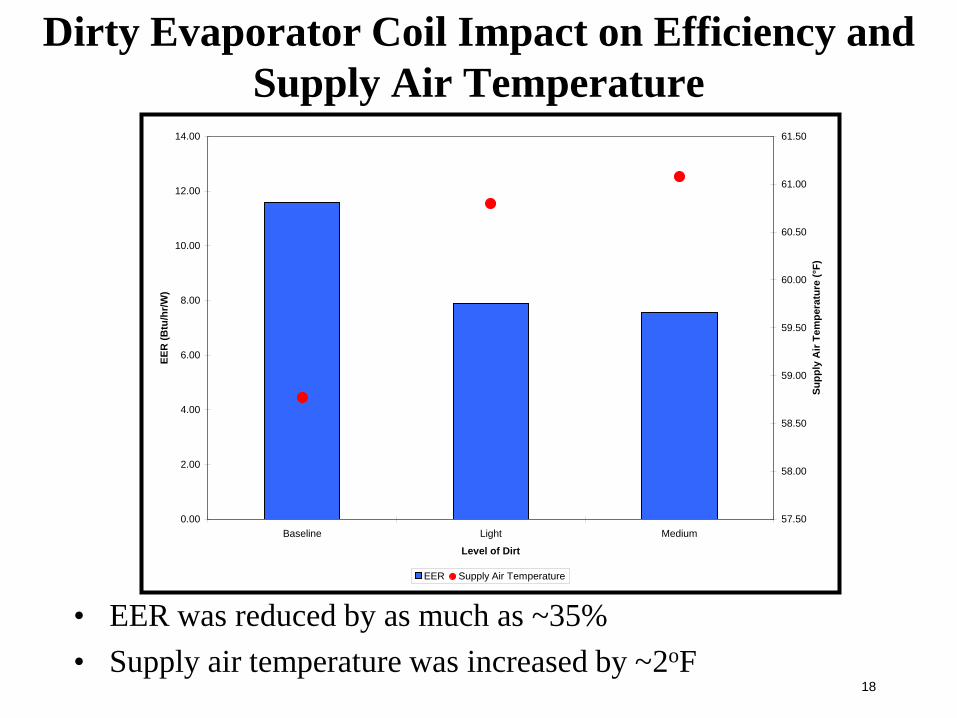
Dirty Evaporator Coil Impact on Efficiency and Supply Air Temperature
0.00
2.00
4.00
6.00
8.00
10.00
12.00
14.00
Baseline Light Medium
Level of Dirt
EER
(Btu
/hr/W
)
57.50
58.00
58.50
59.00
59.50
60.00
60.50
61.00
61.50
Supp
ly A
ir Te
mpe
ratu
re (°
F)
EER Supply Air Temperature
• EER was reduced by as much as ~35%• Supply air temperature was increased by ~2oF
19
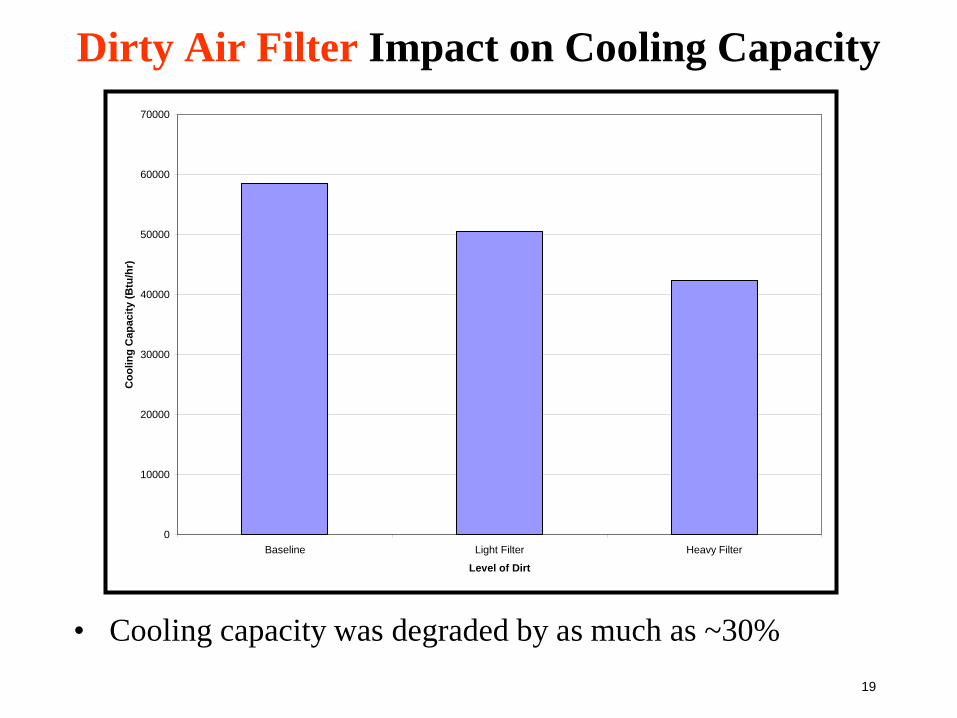
Dirty Air Filter Impact on Cooling Capacity
0
10000
20000
30000
40000
50000
60000
70000
Baseline Light Filter Heavy Filter
Level of Dirt
Coo
ling
Cap
acity
(Btu
/hr)
• Cooling capacity was degraded by as much as ~30%
20
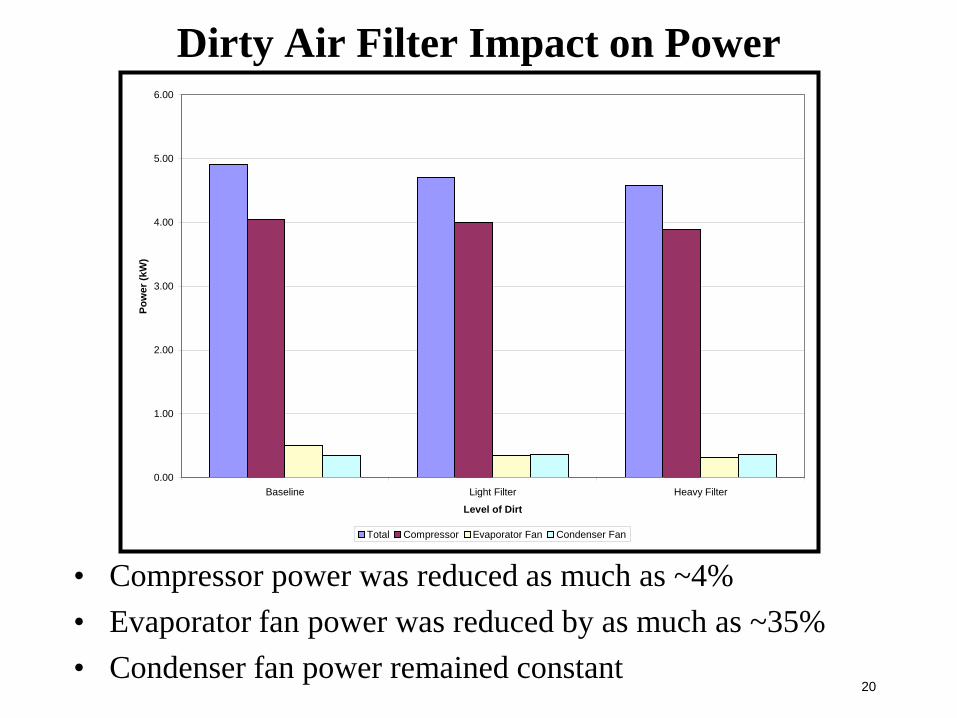
Dirty Air Filter Impact on Power
0.00
1.00
2.00
3.00
4.00
5.00
6.00
Baseline Light Filter Heavy Filter
Level of Dirt
Pow
er (k
W)
Total Compressor Evaporator Fan Condenser Fan
• Compressor power was reduced as much as ~4%• Evaporator fan power was reduced by as much as ~35%• Condenser fan power remained constant
21
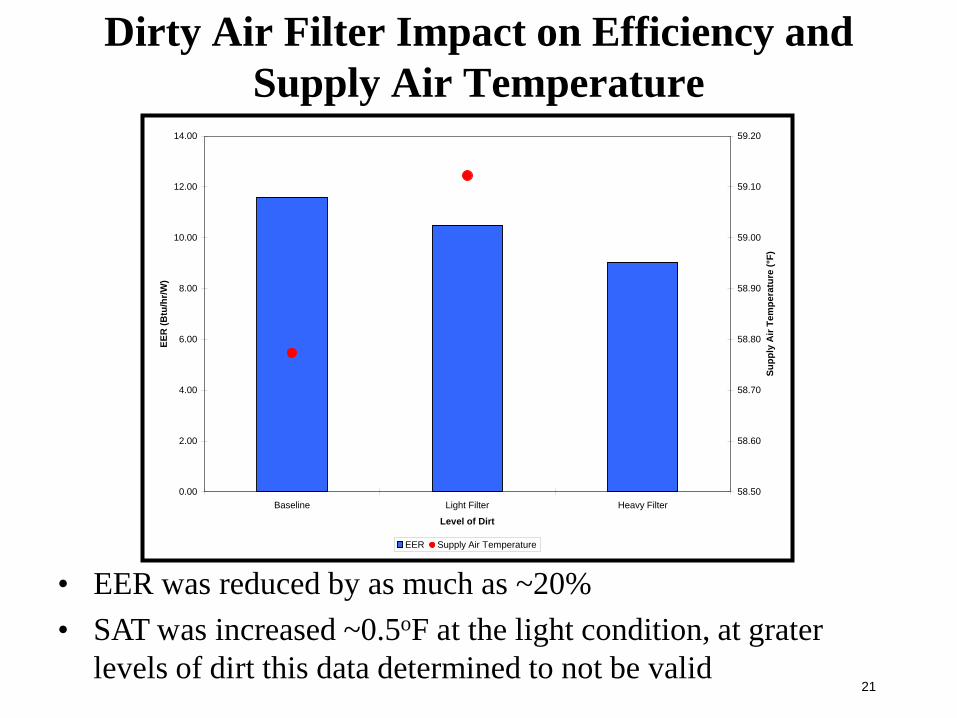
Dirty Air Filter Impact on Efficiency and Supply Air Temperature
0.00
2.00
4.00
6.00
8.00
10.00
12.00
14.00
Baseline Light Filter Heavy Filter
Level of Dirt
EER
(Btu
/hr/W
)
58.50
58.60
58.70
58.80
58.90
59.00
59.10
59.20
Supp
ly A
ir Te
mpe
ratu
re (°
F)
EER Supply Air Temperature
• EER was reduced by as much as ~20%• SAT was increased ~0.5oF at the light condition, at grater
levels of dirt this data determined to not be valid

22
Dirty Condenser Coil Impact on Cooling Capacity
0
10000
20000
30000
40000
50000
60000
70000
Baseline Very Light Condenser Light Condenser Medium Condenser Heavy Condenser
Level of Dirt
Coo
ling
Cap
acity
(Btu
/hr)
• Cooling capacity was degraded by as much as ~40%• An increase of ~60% in discharge pressure caused a decrease in
refrigeration effect of ~30%, impacting capacity
23
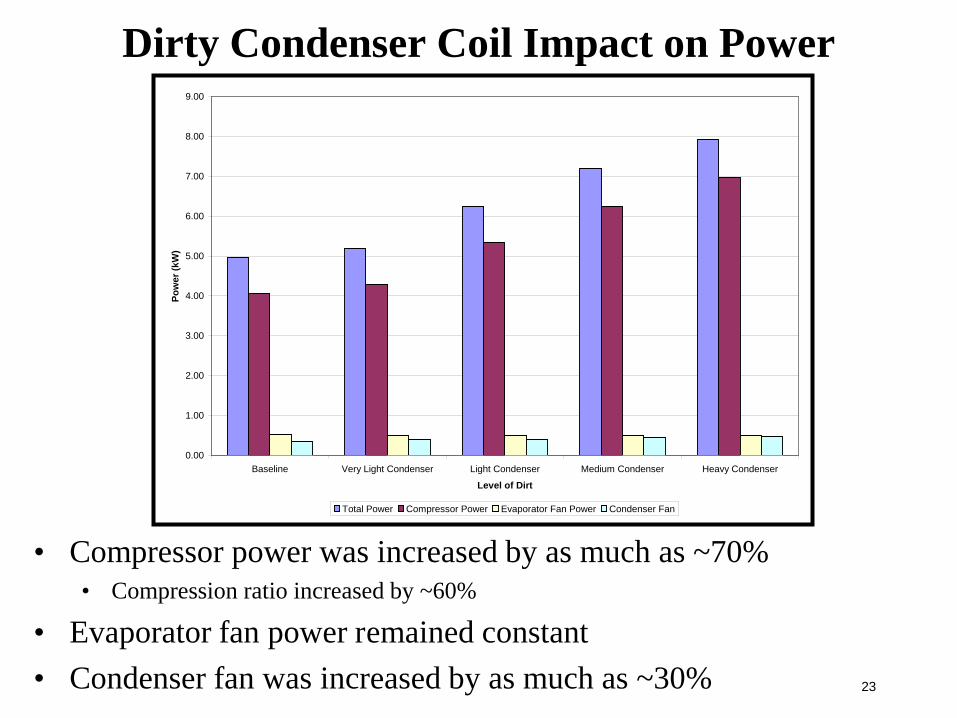
Dirty Condenser Coil Impact on Power
0.00
1.00
2.00
3.00
4.00
5.00
6.00
7.00
8.00
9.00
Baseline Very Light Condenser Light Condenser Medium Condenser Heavy Condenser
Level of Dirt
Pow
er (k
W)
Total Power Compressor Power Evaporator Fan Power Condenser Fan
• Compressor power was increased by as much as ~70%• Compression ratio increased by ~60%
• Evaporator fan power remained constant• Condenser fan was increased by as much as ~30%
24
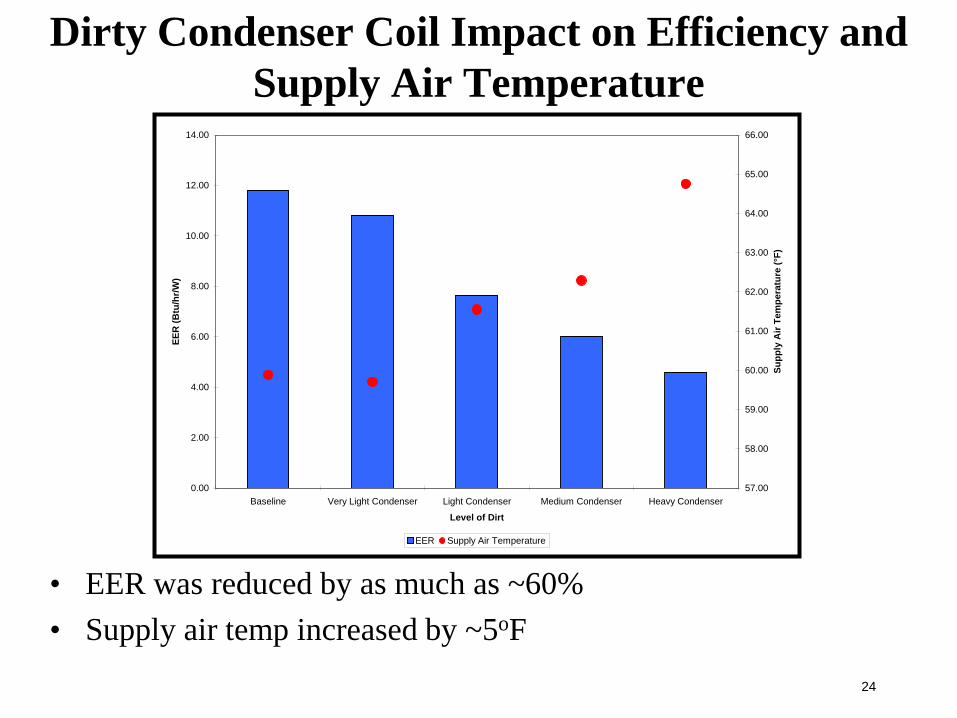
Dirty Condenser Coil Impact on Efficiency and Supply Air Temperature
0.00
2.00
4.00
6.00
8.00
10.00
12.00
14.00
Baseline Very Light Condenser Light Condenser Medium Condenser Heavy Condenser
Level of Dirt
EER
(Btu
/hr/W
)
57.00
58.00
59.00
60.00
61.00
62.00
63.00
64.00
65.00
66.00
Supp
ly A
ir Te
mpe
ratu
re (°
F)
EER Supply Air Temperature
• EER was reduced by as much as ~60%• Supply air temp increased by ~5oF
25
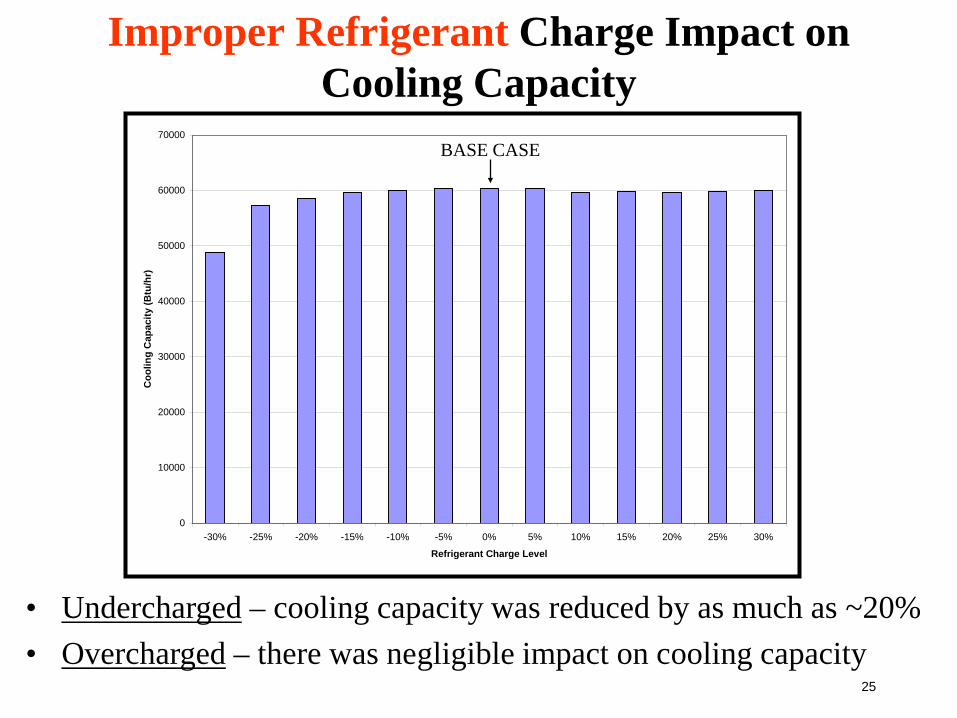
Improper Refrigerant Charge Impact on Cooling Capacity
0
10000
20000
30000
40000
50000
60000
70000
-30% -25% -20% -15% -10% -5% 0% 5% 10% 15% 20% 25% 30%
Refrigerant Charge Level
Coo
ling
Cap
acity
(Btu
/hr)BASE CASE
• Undercharged – cooling capacity was reduced by as much as ~20%• Overcharged – there was negligible impact on cooling capacity
26
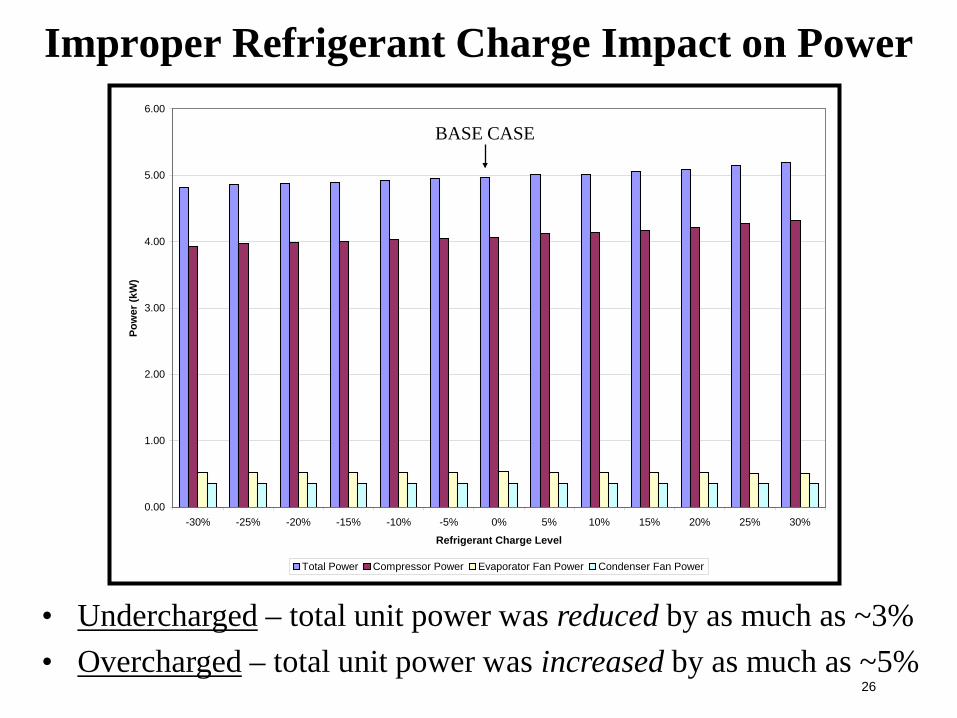
Improper Refrigerant Charge Impact on Power
0.00
1.00
2.00
3.00
4.00
5.00
6.00
-30% -25% -20% -15% -10% -5% 0% 5% 10% 15% 20% 25% 30%
Refrigerant Charge Level
Pow
er (k
W)
Total Power Compressor Power Evaporator Fan Power Condenser Fan Power
BASE CASE
• Undercharged – total unit power was reduced by as much as ~3%• Overcharged – total unit power was increased by as much as ~5%
27
0.00
2.00
4.00
6.00
8.00
10.00
12.00
14.00
-30% -25% -20% -15% -10% -5% 0% 5% 10% 15% 20% 25% 30%
Refrigerant Charge Level
EER
(Btu
/hr/W
)
58.50
59.00
59.50
60.00
60.50
61.00
61.50
Supp
ly A
ir Te
mpe
ratu
re (°
F)
EER Supply Air Temperature
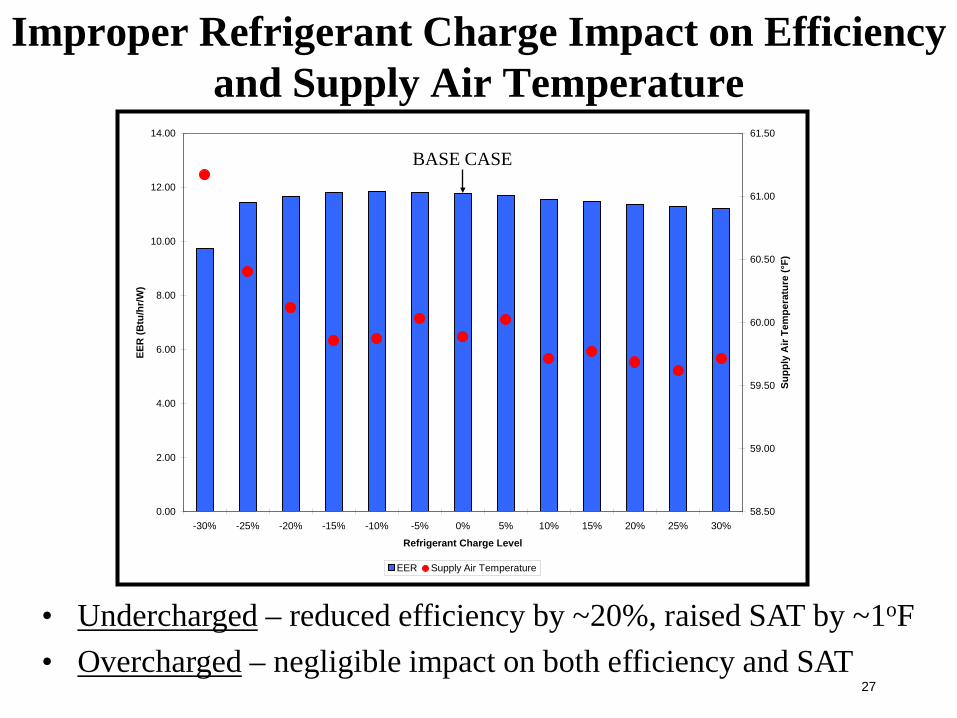
Improper Refrigerant Charge Impact on Efficiency and Supply Air Temperature
BASE CASE
• Undercharged – reduced efficiency by ~20%, raised SAT by ~1oF• Overcharged – negligible impact on both efficiency and SAT
28
Next Generation of HVAC Technologies
29
Characteristics of Next Generation HVAC Equipment
• High efficiency at peak design and under part load • Climatic region sensitive design• Robust integration capabilities with:
• Building energy systems,• Building automation• Smart meter/grid
• Intelligent and demand response ready• Environmentally friendly refrigerants• Compliant with indoor air quality and human comfort• Reliable• Cost effective
30
Next Generation of A/C Units Features
• Efficient• Low temperature lift heat exchangers• Compressor-less: indirect/direct cooling systems• Desiccant dehumidification• Variable speed fan and compressor: match capacity and load• Efficient compressor and fan motors• Precise metering device: electronic expansion valve (EXV)• Hybrid Cooling: adiabatic + direct expansion (DX)• Indirect or direct evaporatively cooled condensers• Heat recovery
31
Next Generation of A/C Units Features (cont’d)
• Intelligent• 2-way connectivity• Smart user interface and energy advisory• On-board fault detection and diagnostic• Direct digital control
• Indoor Air Quality• Economizer integrated with Demand Controlled Ventilation
• Low GWP Refrigerant• Natural refrigerants
• Hydrocarbons• CO2
32
Technologies on SCE’s Radar Screen
33
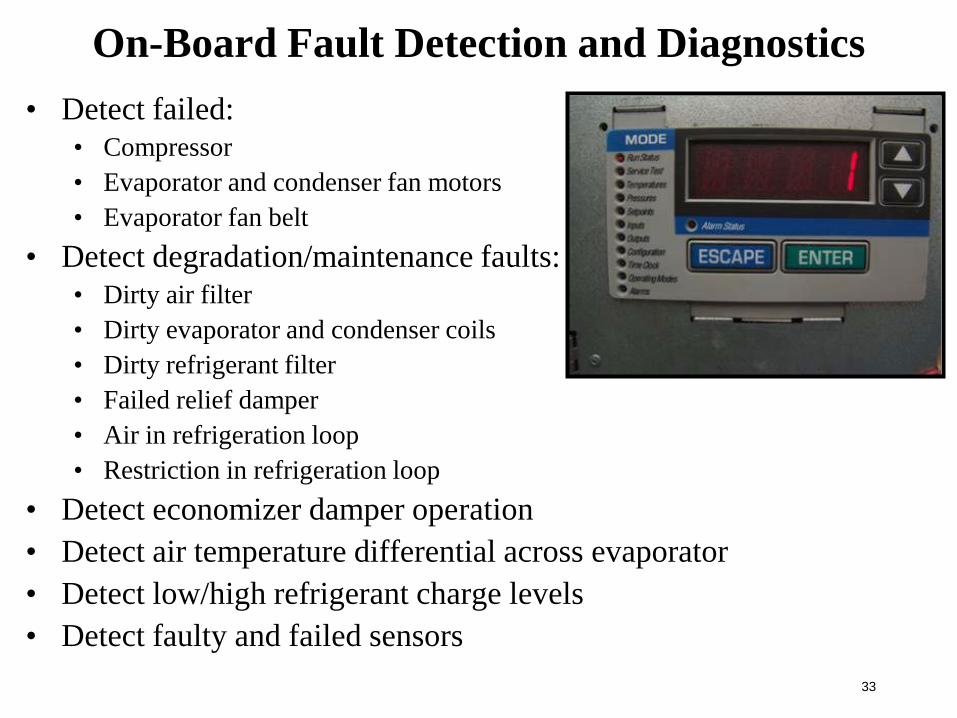
On-Board Fault Detection and Diagnostics• Detect failed:
• Compressor• Evaporator and condenser fan motors• Evaporator fan belt
• Detect degradation/maintenance faults:• Dirty air filter• Dirty evaporator and condenser coils• Dirty refrigerant filter• Failed relief damper• Air in refrigeration loop• Restriction in refrigeration loop
• Detect economizer damper operation• Detect air temperature differential across evaporator• Detect low/high refrigerant charge levels• Detect faulty and failed sensors
34
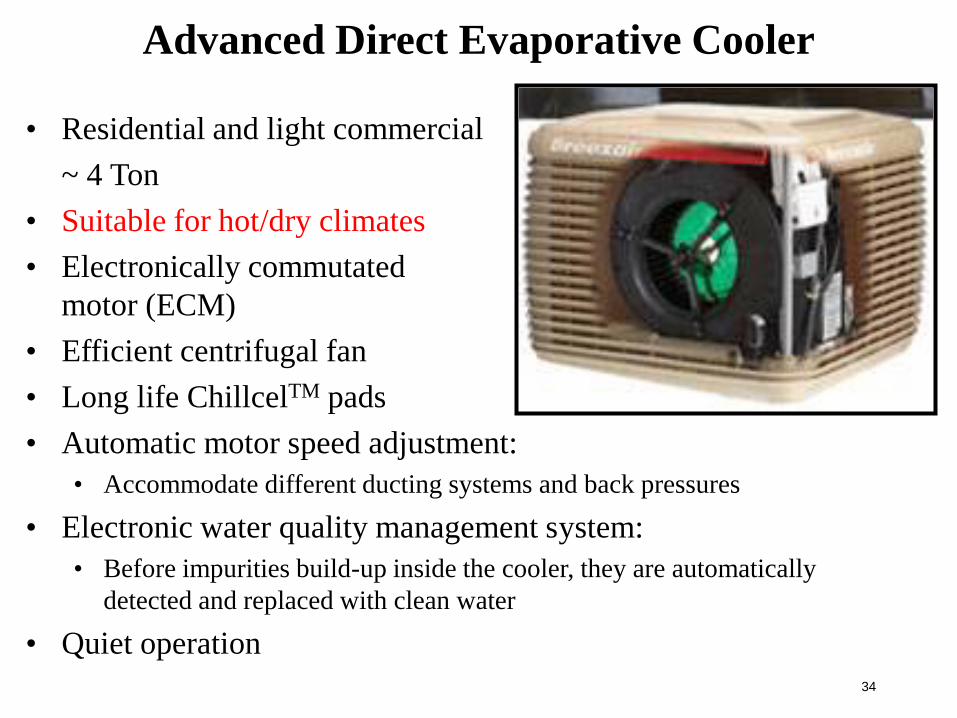
Advanced Direct Evaporative Cooler
• Residential and light commercial~ 4 Ton
• Suitable for hot/dry climates• Electronically commutated
motor (ECM)• Efficient centrifugal fan• Long life ChillcelTM pads• Automatic motor speed adjustment:
• Accommodate different ducting systems and back pressures
• Electronic water quality management system:• Before impurities build-up inside the cooler, they are automatically
detected and replaced with clean water
• Quiet operation
35
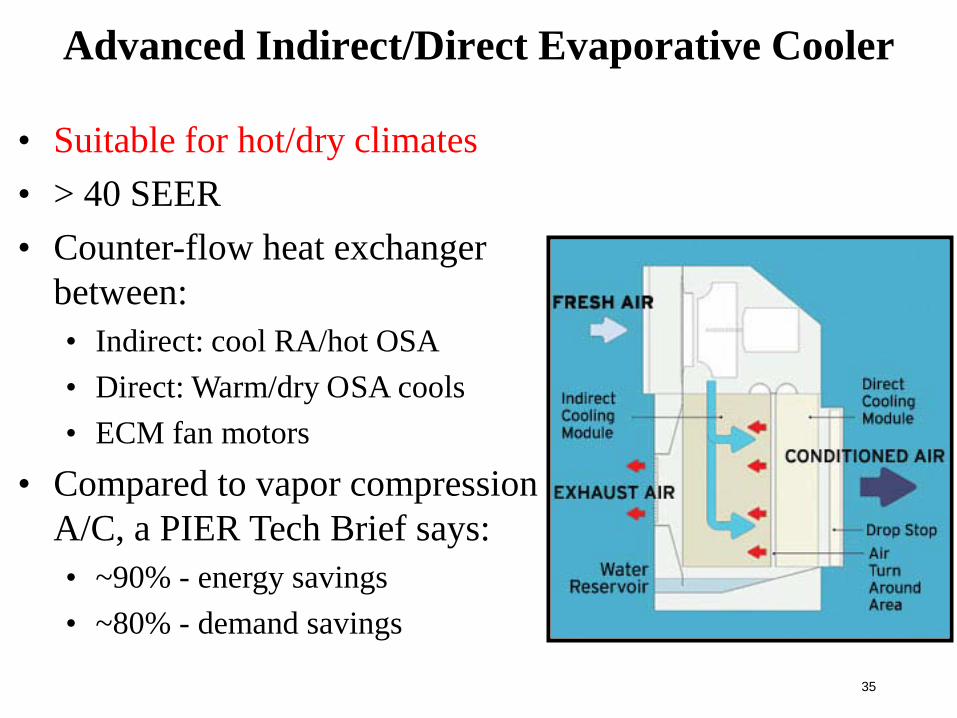
Advanced Indirect/Direct Evaporative Cooler
• Suitable for hot/dry climates• > 40 SEER• Counter-flow heat exchanger
between:• Indirect: cool RA/hot OSA• Direct: Warm/dry OSA cools • ECM fan motors
• Compared to vapor compression A/C, a PIER Tech Brief says:• ~90% - energy savings• ~80% - demand savings
36
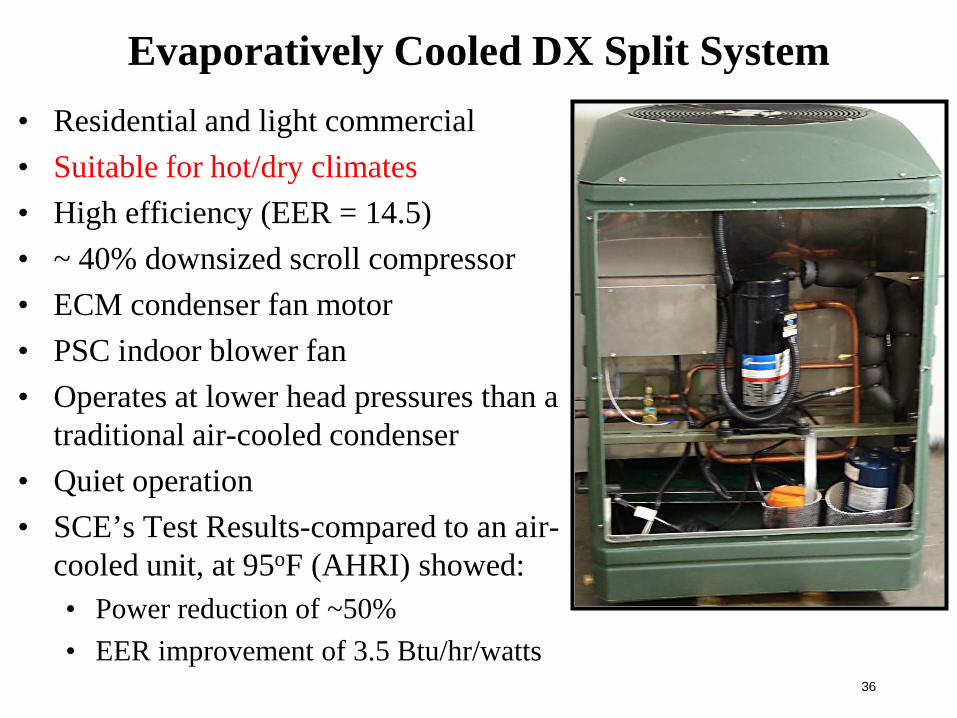
Evaporatively Cooled DX Split System• Residential and light commercial• Suitable for hot/dry climates• High efficiency (EER = 14.5)• ~ 40% downsized scroll compressor• ECM condenser fan motor• PSC indoor blower fan• Operates at lower head pressures than a
traditional air-cooled condenser• Quiet operation• SCE’s Test Results-compared to an air-
cooled unit, at 95oF (AHRI) showed:• Power reduction of ~50%• EER improvement of 3.5 Btu/hr/watts
37
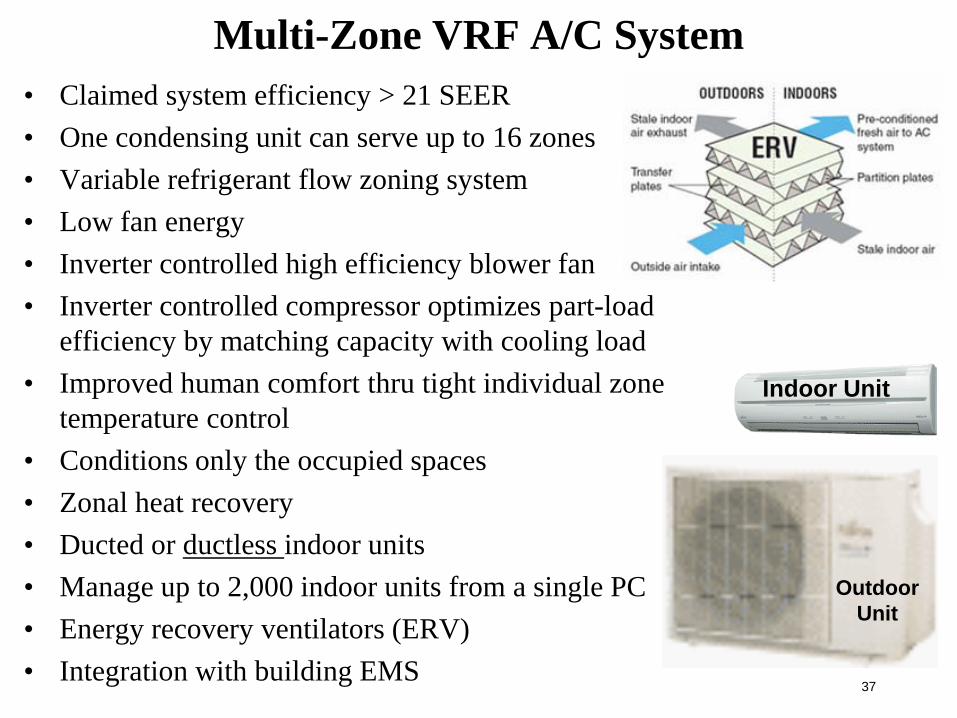
Multi-Zone VRF A/C System• Claimed system efficiency > 21 SEER• One condensing unit can serve up to 16 zones• Variable refrigerant flow zoning system • Low fan energy• Inverter controlled high efficiency blower fan• Inverter controlled compressor optimizes part-load
efficiency by matching capacity with cooling load• Improved human comfort thru tight individual zone
temperature control • Conditions only the occupied spaces• Zonal heat recovery• Ducted or ductless indoor units• Manage up to 2,000 indoor units from a single PC• Energy recovery ventilators (ERV)• Integration with building EMS
Indoor Unit
Outdoor Unit
38
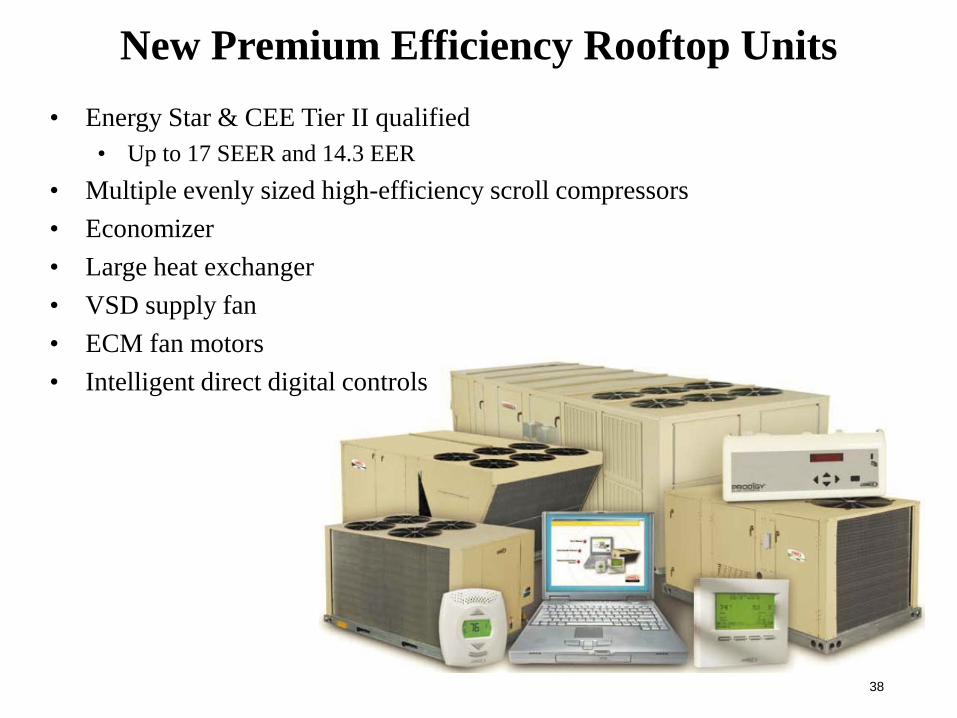
New Premium Efficiency Rooftop Units• Energy Star & CEE Tier II qualified
• Up to 17 SEER and 14.3 EER• Multiple evenly sized high-efficiency scroll compressors• Economizer• Large heat exchanger• VSD supply fan• ECM fan motors• Intelligent direct digital controls
39
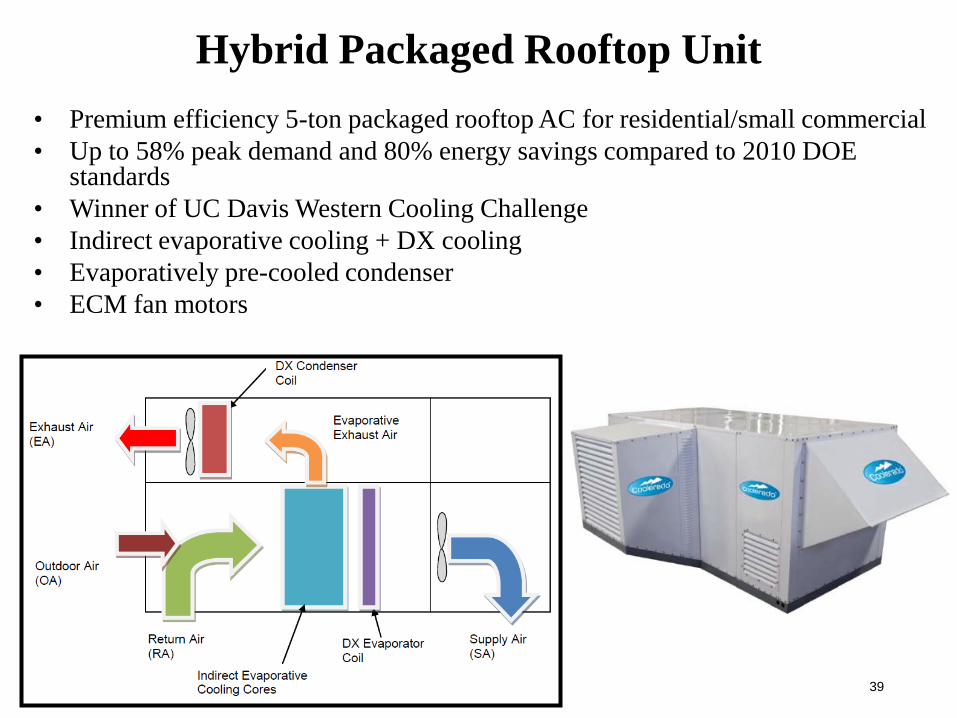
Hybrid Packaged Rooftop Unit• Premium efficiency 5-ton packaged rooftop AC for residential/small commercial• Up to 58% peak demand and 80% energy savings compared to 2010 DOE
standards• Winner of UC Davis Western Cooling Challenge• Indirect evaporative cooling + DX cooling • Evaporatively pre-cooled condenser • ECM fan motors
40
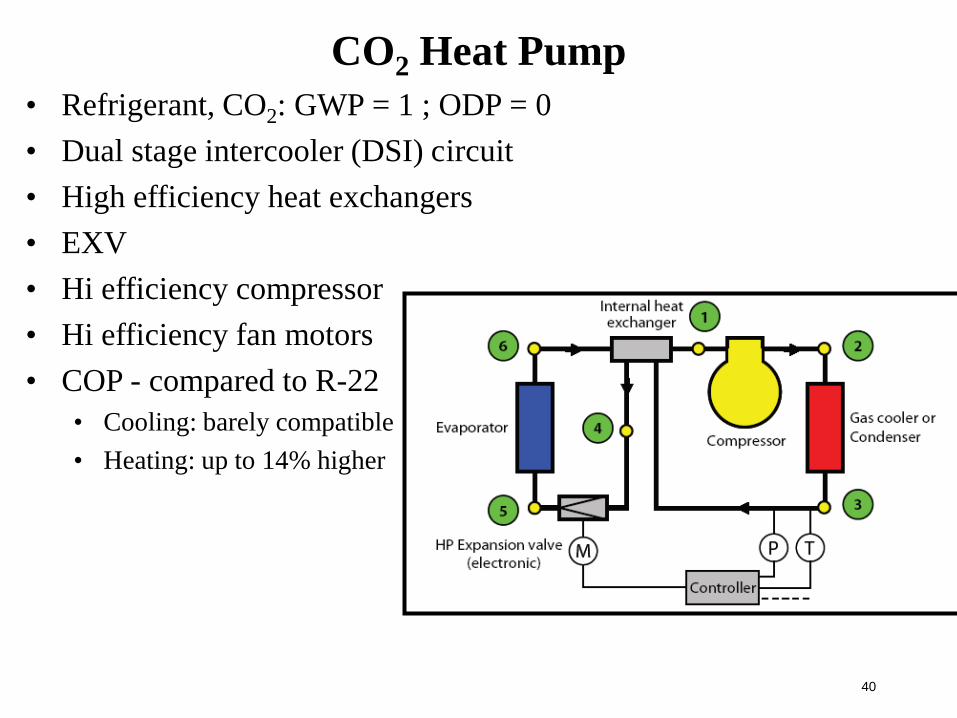
CO2 Heat Pump• Refrigerant, CO2: GWP = 1 ; ODP = 0• Dual stage intercooler (DSI) circuit• High efficiency heat exchangers • EXV• Hi efficiency compressor• Hi efficiency fan motors• COP - compared to R-22
• Cooling: barely compatible• Heating: up to 14% higher
41
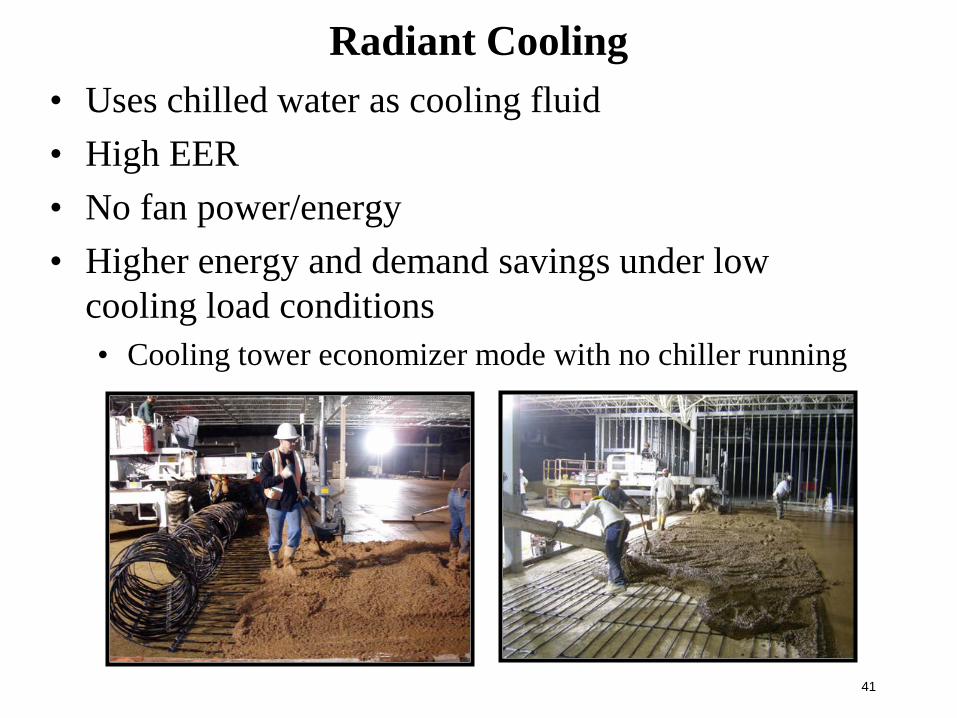
Radiant Cooling• Uses chilled water as cooling fluid• High EER• No fan power/energy• Higher energy and demand savings under low
cooling load conditions• Cooling tower economizer mode with no chiller running
42
Not Every Black Box Works
43
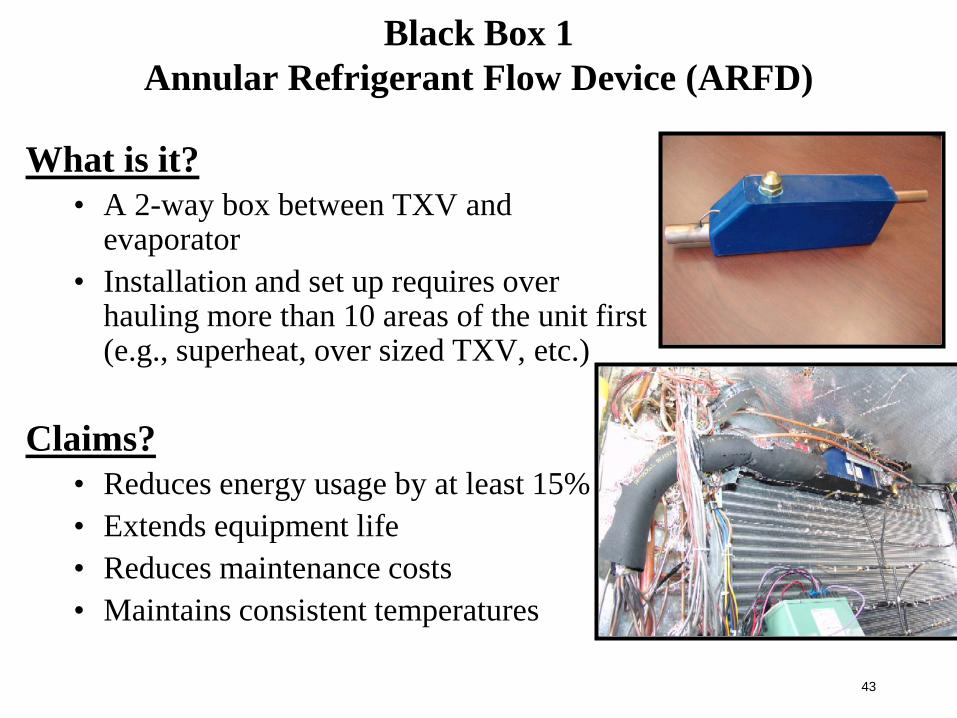
Black Box 1Annular Refrigerant Flow Device (ARFD)
What is it?• A 2-way box between TXV and
evaporator• Installation and set up requires over
hauling more than 10 areas of the unit first (e.g., superheat, over sized TXV, etc.)
Claims?• Reduces energy usage by at least 15%• Extends equipment life• Reduces maintenance costs• Maintains consistent temperatures
44
Black Box 1 – ARFD
How does it work?• It enhances heat transfer efficiency by changing the quality of
refrigerant in evaporator (close to all liquid phase)
Applications?• Commercial refrigeration and air conditioning systems
45
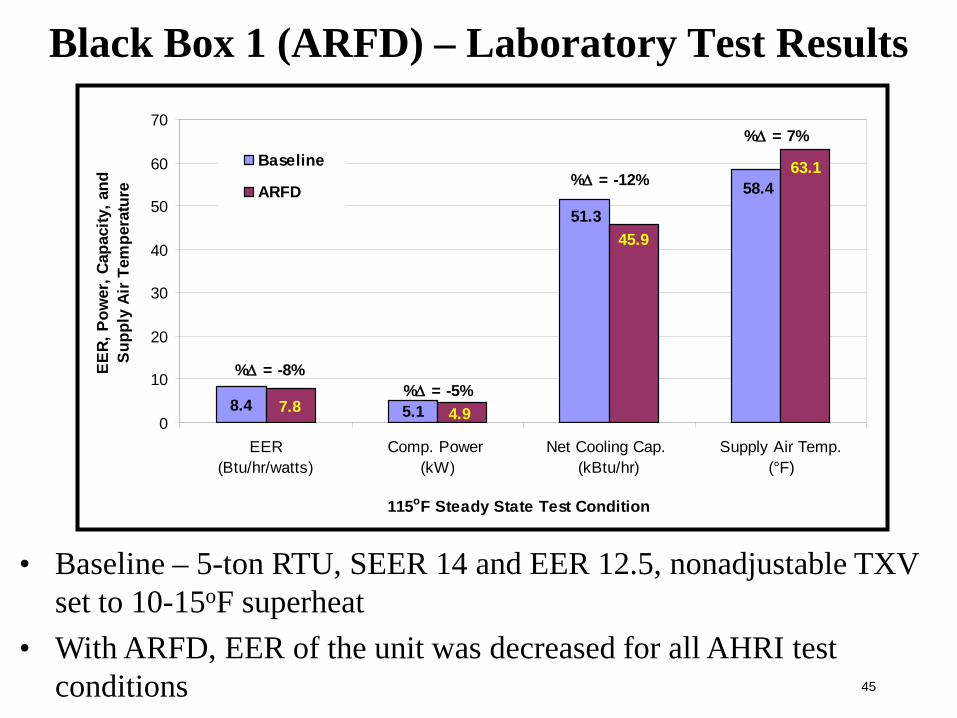
Black Box 1 (ARFD) – Laboratory Test Results
• Baseline – 5-ton RTU, SEER 14 and EER 12.5, nonadjustable TXV set to 10-15oF superheat
• With ARFD, EER of the unit was decreased for all AHRI test conditions
58.4
8.4 5.1
51.3
63.1
45.9
4.97.80
10
20
30
40
50
60
70
EER(Btu/hr/watts)
Comp. Power (kW)
Net Cooling Cap. (kBtu/hr)
Supply Air Temp.(°F)
115oF Steady State Test Condition
EER,
Pow
er, C
apac
ity, a
nd
Supp
ly A
ir Te
mpe
ratu
re
Baseline
ARFD
%∆ = -5%%∆ = -8%
%∆ = -12%
%∆ = 7%
46
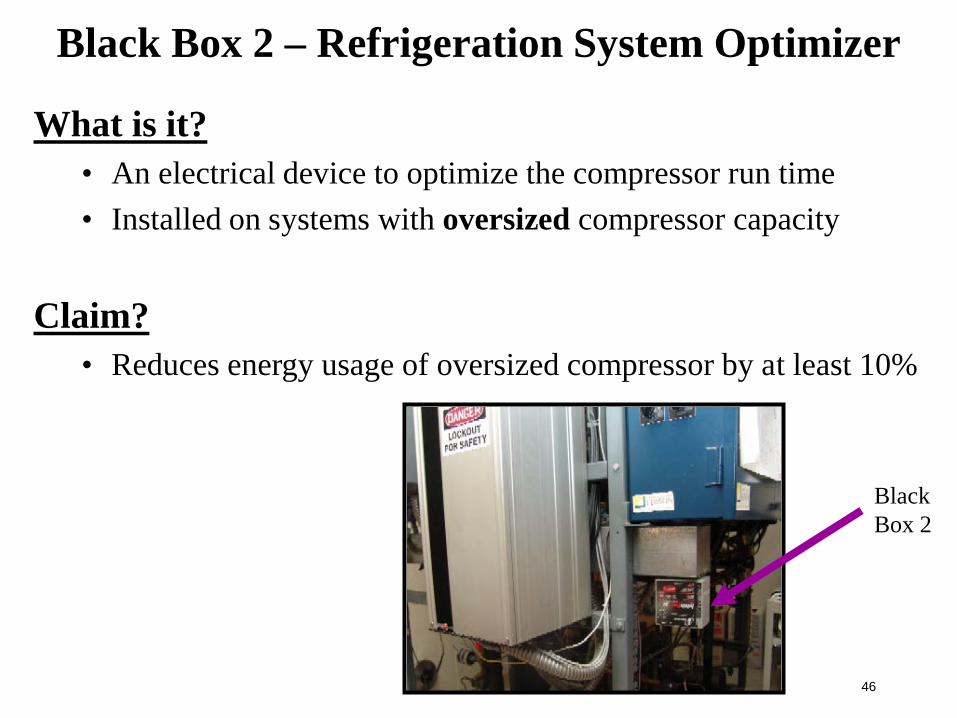
Black Box 2 – Refrigeration System Optimizer
What is it?• An electrical device to optimize the compressor run time• Installed on systems with oversized compressor capacity
Claim?• Reduces energy usage of oversized compressor by at least 10%
BlackBox 2
47
Black Box 2 (Refrigeration System Optimizer)
How does it work?• It improves system performance by real-time “load-demand”
analysis and control
Applications?• Commercial refrigeration and air conditioning systems• Residential refrigeration and air conditioning systems
48
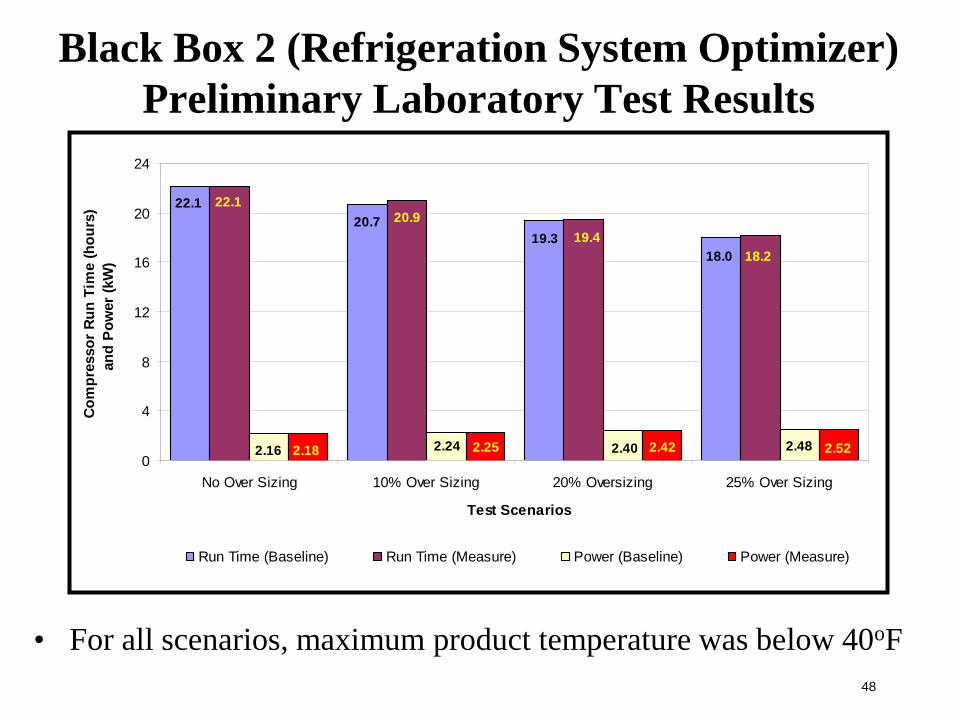
Black Box 2 (Refrigeration System Optimizer)Preliminary Laboratory Test Results
20.722.1
19.318.0
20.922.1
19.418.2
2.40 2.482.242.16 2.42 2.522.252.180
4
8
12
16
20
24
No Over Sizing 10% Over Sizing 20% Oversizing 25% Over Sizing
Test Scenarios
Com
pres
sor R
un T
ime
(hou
rs)
and
Pow
er (k
W)
Run Time (Baseline) Run Time (Measure) Power (Baseline) Power (Measure)
• For all scenarios, maximum product temperature was below 40oF
49
Appendix
50
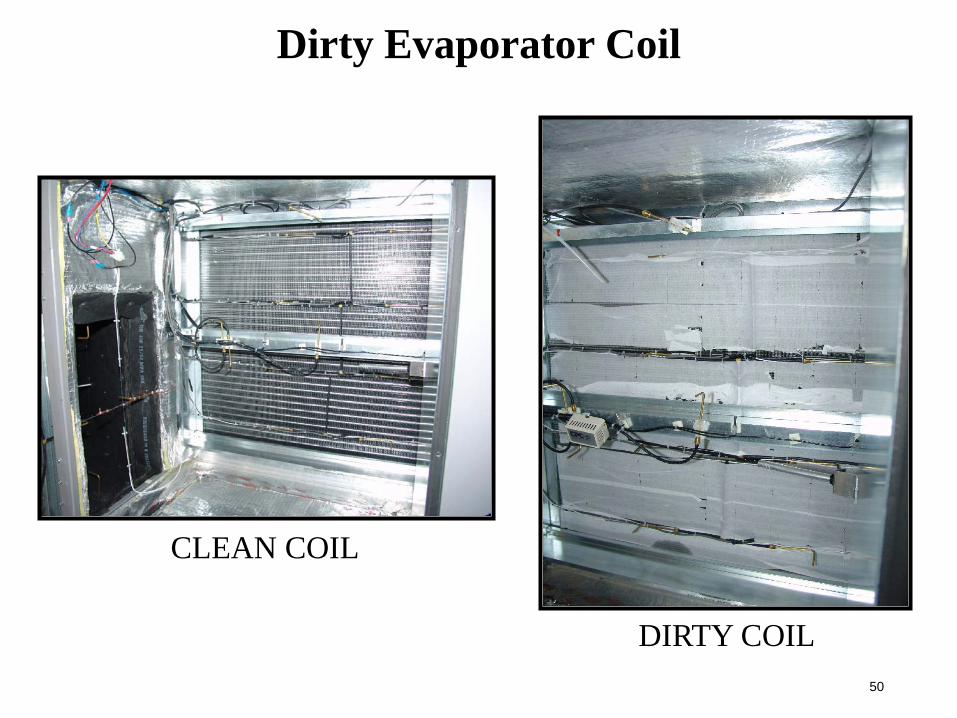
Dirty Evaporator Coil
CLEAN COIL
DIRTY COIL
51
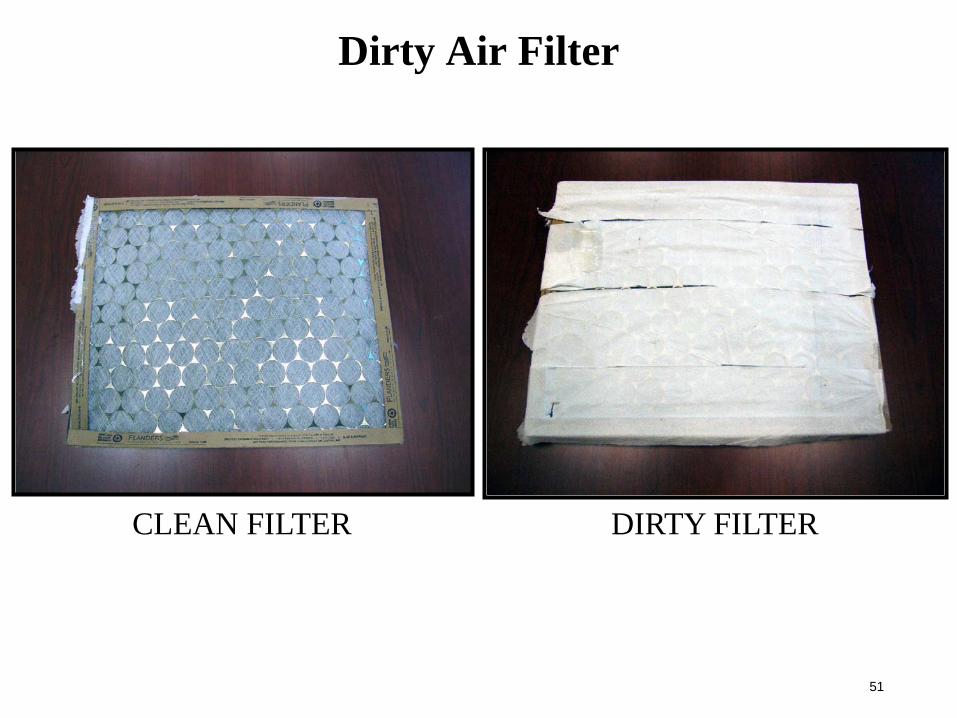
Dirty Air Filter
CLEAN FILTER DIRTY FILTER
52
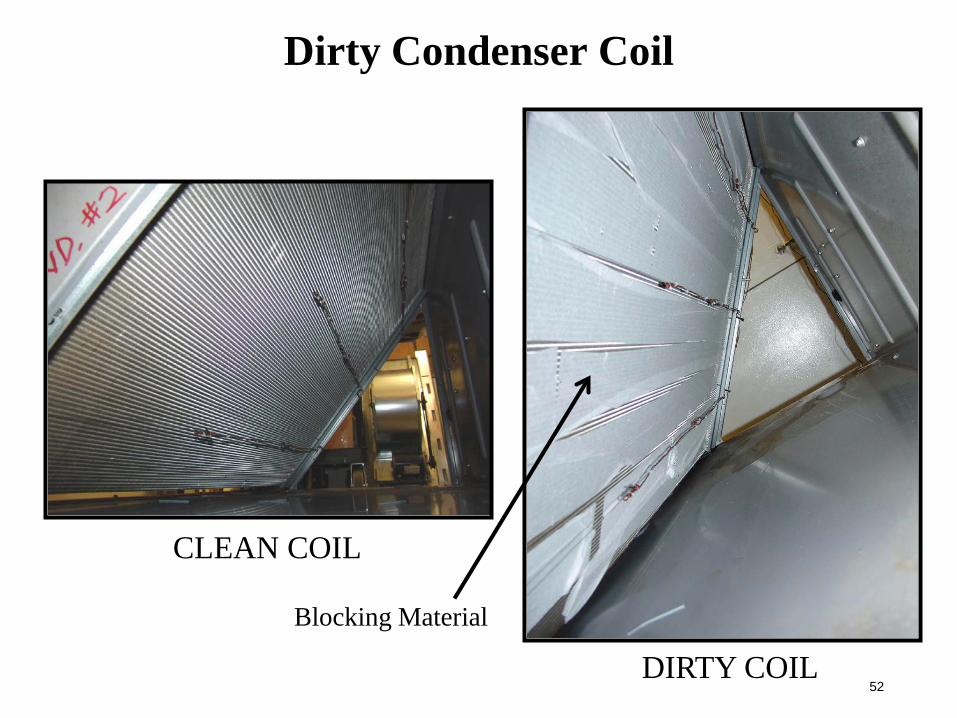
Dirty Condenser Coil
CLEAN COIL
DIRTY COILBlocking Material
53
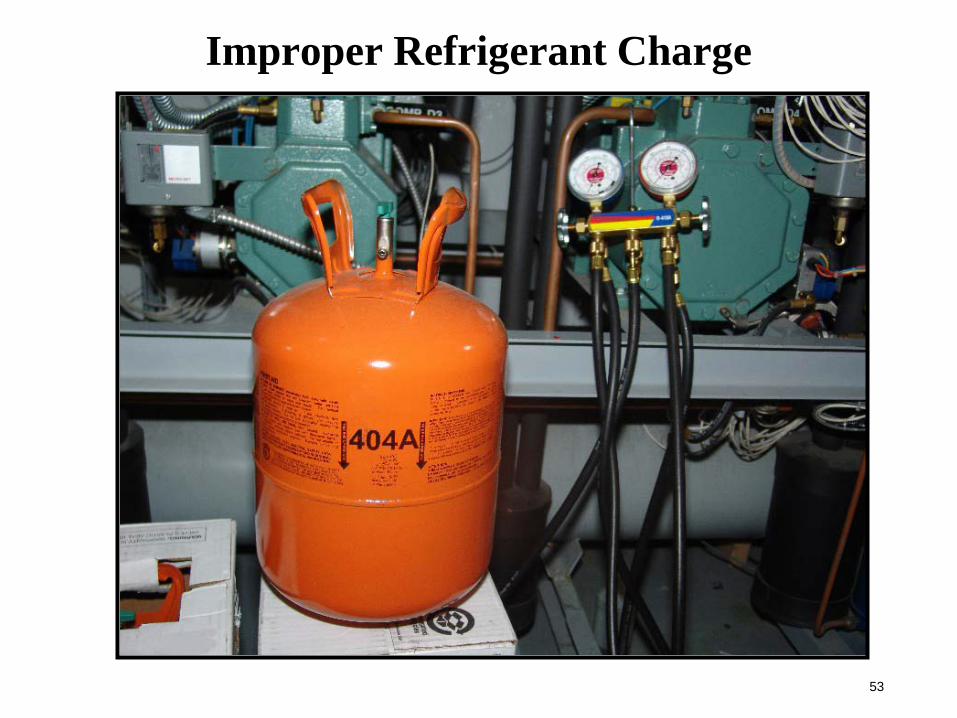
Improper Refrigerant Charge
54
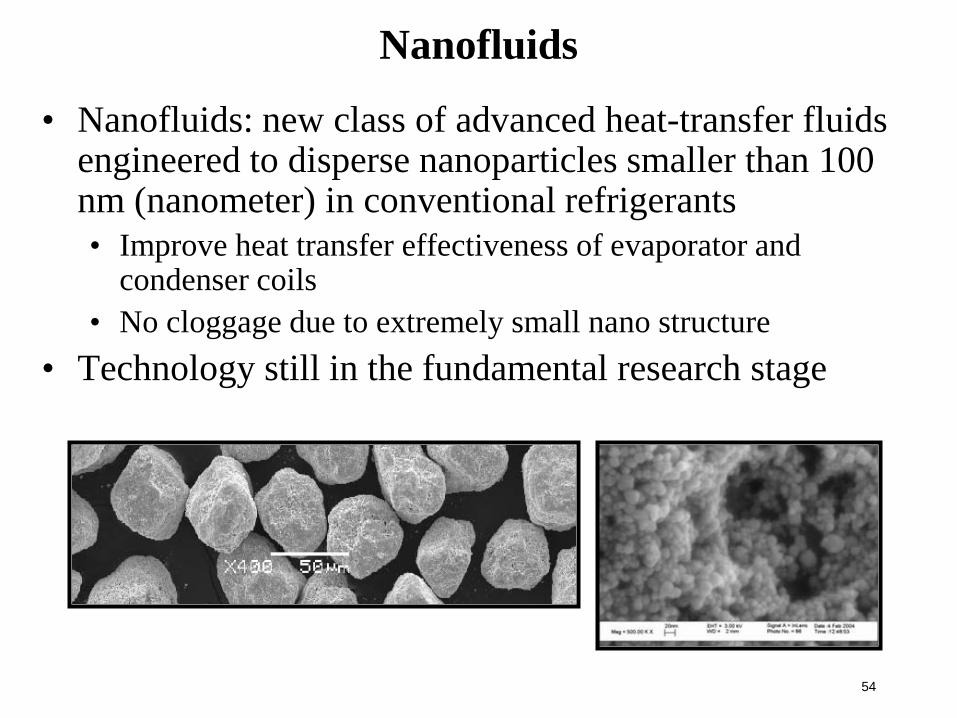
Nanofluids
• Nanofluids: new class of advanced heat-transfer fluids engineered to disperse nanoparticles smaller than 100 nm (nanometer) in conventional refrigerants• Improve heat transfer effectiveness of evaporator and
condenser coils• No cloggage due to extremely small nano structure
• Technology still in the fundamental research stage