hvs 2009 u.s. hotel valuation index
TRANSCRIPT

8/8/2019 HVS 2009 U.S. Hotel Valuation Index
http://slidepdf.com/reader/full/hvs-2009-us-hotel-valuation-index 1/50
New York San Francisco Boulder Denver Miami Dallas Chicago Washington DC Atlanta Boston Newport RI Vancouver Toronto Las VegasLondon Madrid Athens Moscow New Delhi Mumbai Dubai Beijing Singapore Hong Kong Shanghai São Paulo Buenos Aires Mexico City
Nassau, Bahamas
2009 United States
Hotel Valuation Index
Stephen Rushmore, MAI, FRICS, CHAPresident and Founder
Emily U. SmithVice President
Neel M. LundVice President
HVS GLOBAL HOSPITALITY SERVICES369 Willis AvenueMineola, NY 11501USATel: +1 516-248-8828Fax: +1 516-742-3059
Price: $1,500 October 2009

8/8/2019 HVS 2009 U.S. Hotel Valuation Index
http://slidepdf.com/reader/full/hvs-2009-us-hotel-valuation-index 2/50
HVS Global Hospitality Services 2009 United States Hotel Valuation Index
Page 1 of 49
2009 United States Hotel Valuation Index
The 2009 publication of the HVI marks an unprecedented time for hotelvalues. As markets fluctuated wildly throughout the past year and major
banking institutions folded, hotel demand dropped dramatically, andaverage rates soon followed suit. The trend has continued into the summer,rendering prior forecasts for a “quick recovery” defunct. To understand the2009 HVI values and corresponding forecasts for each market, it is importantto understand the context in which the values have been derived.
The Hotel Valuation Index (HVI) tracks hotel values in 65 major markets andthe United States as a whole. Created in 1987 by HVS, the HVI is derivedfrom an income capitalization approach, utilizing market area data provided by Smith Travel Research (STR) and historical operational information fromHVS’s extensive global experience in hotel feasibility studies and valuations.
The HVI for 2009 is based on 2008 data; we note that each market has beenevaluated and forecast based on prevailing and anticipated trends specific tothat market.
The dizzying pace of declining hotel values has left industry participants inlimbo. When will it end? When will it recover, and by how much? How dowe even value hotels in today’s uncertain times? Are the good times of recentyears past gone for good?
The following discussions help to provide the context for per-room valuesforecast in the report. We first revisit the fateful consequences of thecrumbling banking system upon the U.S. economy, and governmentattempts to plug the leak. We then analyze the impact of the recession uponlodging demand and compare these trends to prior periods of recession.Next, we look at how to value hotels in today’s credit-dry environment. Wethen present the 2009 HVI, with historical values, forecasts, and discussionson notable markets. We also provide a guide to interpreting the HVI.

8/8/2019 HVS 2009 U.S. Hotel Valuation Index
http://slidepdf.com/reader/full/hvs-2009-us-hotel-valuation-index 3/50
HVS Global Hospitality Services 2009 United States Hotel Valuation Index
Page 2 of 49
U.S. Economic Trends
In mid-2008, just before the publication of the last version of the HVI,economists and market participants alike were wary of labeling the thencontinually downward-spiraling macroeconomic conditions as trending towards a deep recession, and termed it rather as “the great Americanslowdown.” 1 The prevailing sentiment exuded a tone of “cautious optimism.”The consensus was that this “slowdown” would in fact lead to a recession, but the hope remained that the trough would be “short and shallow,” similarto that of the previous two U.S. recessions in 1990-91 and 2001-03. 2 Such an
outlook was supported by the already active and aggressive response of thefederal government to deteriorating conditions. The Federal Reserve hadalready orchestrated J.P. Morgan’s acquisition of troubled Bear Sterns, andprovided much-needed support to failing Fannie Mae and Freddie Mac.Abiding by the principles of “trickle-down economics,” former U.S. PresidentBush and Congress had originated the tax rebate program to revivedwindling consumer spending.
Twelve months later, such estimations of the gravity of the downturn haveproven to be an exercise in misguided buoyancy. Although the governmenthad done much, it clearly had not done enough to avert the economically
cataclysmic events of the fourth quarter of 2008. The Economist aptlycharacterizes the September 2008 collapse of Lehman Brothers as the “mostseismic event of the crisis to date” that swiftly descended the ‘slowdown’ to‘global economic meltdown status.’ 3 Following this unprecedented event, averitable panic on Wall Street ensued, as the markets fluctuated violently andconsumer confidence evaporated.
The past fiscal year has witnessed five of the eight largest bankruptcy filingsin the history of the United States – Washington Mutual, Thornburg Mortgage, General Motors, Chrysler, and of course, Lehman Brothers. Sincethe end of 2007, the U.S. GDP has declined by a cumulative 3.7%, matching 1957-58 as the deepest recession since the Great Depression. According to theBureau of Labor Statistics, national unemployment had skyrocketed to astaggering level of 9.7%, as of August 2009. Overall, this profound economictrough has resulted in the erosion of more than $13 trillion of consumer
1 The Economist,“The great American slowdown,” April 10, 2008.2 Ibid.3 The Economist,“Rebuilding the banks,” May 14, 2009.

8/8/2019 HVS 2009 U.S. Hotel Valuation Index
http://slidepdf.com/reader/full/hvs-2009-us-hotel-valuation-index 4/50
HVS Global Hospitality Services 2009 United States Hotel Valuation Index
Page 3 of 49
wealth, the implosion of the capital market lending system, and dramaticreductions in consumer spending. 4
To combat the potential transformation of a deep recession into a depression,the federal government resorted to lessons from the past, in re-committing itself to a mammoth dose of the Keynesian brand of economics. In the fall of 2008, soon after the demise of Lehman Brothers, the federal governmentinjected $700 billion of public capital into the financial system, providing forloans and loan guarantees for ailing banks. In the spring of 2009, beneficiariesof such funds underwent critical “stress tests” to gauge their progressiontowards fiscal stability. Moreover, President Obama’s first actions upontaking office in January 2009 included the infusion of an additional $787- billion fiscal stimulus, in large part geared towards reviving the economy viapublic works programs.
The question arises – have such grand governmental efforts translated intodiscernible improvement? On face value, certain recent successes can becelebrated. On July 31, 2009, the federal government reported that the GDPonly contracted by approximately 1.0% in the second quarter. Such a declineis largely attributable to lack of production, as businesses opted to servicenew consumer orders through existing inventory. 5 Consequently, anexhaustion of existing inventory is expected to spur resumption of manufacturing activity, thereby translating into the potential growth of theGDP by as much as 3.0% in the third quarter of 2009. 6 More recently, thegovernment’s “cash for clunkers” program has helped markedly improve carsales, resulting in warranted increases in production. Ironically, the chief beneficiary of this program has been Japanese auto-maker, Toyota.Nevertheless, General Motors and Chrysler have exited bankruptcyproceedings with a directive towards streamlined and efficient futureoperations. Moreover, with the aid of public capital and massive write-downs, U.S. investment banks for the most part have now begun to illustratesigns of short-term profitability.
Upcoming ChallengesDespite such positive signs, the U.S. economic recovery effort faces thefollowing challenges:
4 The Economist,“Dropping the shopping,” July 23, 2009.5 The Economist,“The sun also rises,” August 6, 2009.6 Ibid.

8/8/2019 HVS 2009 U.S. Hotel Valuation Index
http://slidepdf.com/reader/full/hvs-2009-us-hotel-valuation-index 5/50
HVS Global Hospitality Services 2009 United States Hotel Valuation Index
Page 4 of 49
· In recent decades, U.S. economic growth has been inextricably linkedwith the rise in consumer spending. In fact, consumer spending andresidential investment rose from 67% of the GDP in 1980 to 75% in2007. Conversely, the household savings rate contracted from 10% of disposable income in 1980 to nearly 0% in 2007. 7 The publicity of long-running Ponzi schemes, exemplified by the Bernie Madoff and SirAllen Stanford criminal scandals, coupled with a general skepticism of the welfare of financial and investment institutions have partiallycaused the American savings rate to rise to approximately 5%,dramatically above the 2007 average. The sudden maintenance of such a healthy savings rate to some extent is considered a double-edged sword. An effective way to reverse economic woes is in fact tospend and create demand, thereby engendering production,employment, and tax revenues for the government. A key factor inthe potential recovery of consumer spending, of course, will be therestoration of consumer confidence in the general direction of U.S.financial institutions and the overall economy. Reduced consumerspending has resulted in a dramatic downturn in hotel demand.
· Thus far, government bailouts and spending have provided themechanism for a potential economic recovery. Patently, suchspending has ballooned the national deficit to a forecasted 13% of theGDP by year-end 2009, approximately 12 percentage points higherthan in 2007. 8 If actions are not taken to curtail the levels of deficitspending, the federal deficit is projected to increase to approximately82% of the GDP by 2019. Larry Summers, President Obama’s chief economic adviser, maintains that “the rebuilt American economymust be more export oriented and less consumption-oriented.” 9 TheU.S. government is increasingly offering companies incentives toproduce and manufacture domestically. Such measures could lead tostrengthened local market economies, which could in turn increaselodging demand. A key factor in the reorientation of the U.S.economy depends on the economic welfare and willingness of globalcounterparts to consume American-made products. In the interim,heightened government spending has boosted hotel demand levels inkey government cities such as Washington DC, thereby minimizing the impact of the recession.
7 The Economist,“Dropping the shopping,” July 23, 2009.8 Ibid.9 Ibid.

8/8/2019 HVS 2009 U.S. Hotel Valuation Index
http://slidepdf.com/reader/full/hvs-2009-us-hotel-valuation-index 6/50
HVS Global Hospitality Services 2009 United States Hotel Valuation Index
Page 5 of 49
· The most recent American economic boom was engendered by thelow of cost of capital and widespread availability of credit supplied bycapital market participants such as money-market funds, hedgefunds, investment banks, and exchange-traded funds, among others.Since 1993, traditional banks have accounted for only an average of approximately 20% of the total net lending in the United States. 10 While such traditional banks have largely resumed lending activities,capital market funded transaction activity has yet to recover. Furtherexacerbating the prospects of a recovery in capital market lending areremaining widespread concerns of impending and significant defaultsstemming from a plethora of emerging distressed assets. Thus,although U.S. investment banks for the most part have illustratedsigns of short-term profitability through massive write-downs andgovernment aid, additional troubles loom. Such defaults are expectedto result in additional write-downs and workout proceedings.However, market participants anticipate that such losses will bemanageable, as they are expected to be sourced from more traditionalasset classes, rather than the esoteric subprime mortgage/CMBScategory. As an example, Real Capital Analytics estimatesapproximately $18 billion in hotel loans as distressed as of August2009, sharply higher than the approximately $1.3 billion as of the same
period in 2008.
The recovery in capital market lending is expected to be governed by the timing of resolution and work-out of suchdistressed assets classes.
Overall, most economists and market participants share the belief that theU.S. economy will tread a stronger recovery path beginning in the latter half of 2010. However, appropriately addressing the previously outlinedchallenges remains integral to the timing and intensity of this anticipatedrecovery.
U.S. Hospitality Supply and Demand Trends
A useful tool in analyzing hotel trends is the comparison of GDP growth withhotel demand. The following graph illustrates a comparison of historical andanticipated U.S. lodging demand trends and the corresponding GDP from1970 to 2010.
10 The Economist,“Too big to swallow,” May 14, 2009.

8/8/2019 HVS 2009 U.S. Hotel Valuation Index
http://slidepdf.com/reader/full/hvs-2009-us-hotel-valuation-index 7/50
HVS Global Hospitality Services 2009 United States Hotel Valuation Index
Page 6 of 49
U.S. Lodging Demand vs. GDP (1970-2010)
With the exception of the period from 1982 through approximately 1987during which the GDP grew at a faster rate than lodging demand, historicallodging demand trends have predominantly mirrored movements of thenational GDP. Thus, going forward, fluctuation in the GDP can be considereda vital predictor of future hospitality demand levels.
Despite the disparity discussed above, HVS’ review and analysis of the last
four U.S. recessions results in the conclusion that the 1980-82 recession isconsidered the most analogous to the current economic trough. This isprimarily due to the severity and duration of the early ‘80’s recession and itsconsequently prolonged impact on the U.S. lodging industry. In contrast, theother previous U.S. recessions (1973, 1990-91, 2001-03) were short andshallow.

8/8/2019 HVS 2009 U.S. Hotel Valuation Index
http://slidepdf.com/reader/full/hvs-2009-us-hotel-valuation-index 8/50
HVS Global Hospitality Services 2009 United States Hotel Valuation Index
Page 7 of 49
The 1980-82 recession was fueled by the energy crisis of 1979, and wascharacterized by tight monetary policy to control rampant inflation. Thefollowing illustrates its impact on hotel supply and demand.
1980-82 Recession Impact on U.S. Lodging Supply and Demand
Year Recession
1979 2,466 — 1,863 —1980 Recession 2,485 0.8 % 1,844 (1.0) %1981 Recession 2,523 1.5 1,800 (2.4)1982 Recession 2,540 0.7 1,778 (1.2)1983 2,571 1.2 1,741 (2.1)1984 2,609 1.5 1,757 0.91985 2,682 2.8 1,780 1.31986 2,899 8.1 1,821 2.31987 2,998 3.4 1,883 3.4
Available DailyHotel
Demand(+000)
Changein Supply
(%)
Sources: HVS and STR
Supply(+000)
Room Changein Demand
(+000)
Prior to the 1980-82 recession, high interest rates inhibited sizeable supplygrowth amidst the recessionary conditions. Moreover, as the nationaleconomy recovered from the recession and the availability of financing improved, supply illustrated noteworthy increases from 1985 through 1987.More importantly, the preceding illustrates an extensive, four-year period of consecutive declines in demand from 1980 through 1983. Such losses resultedin a prolonged recovery period, as demand matched its 1979 high in 1987.
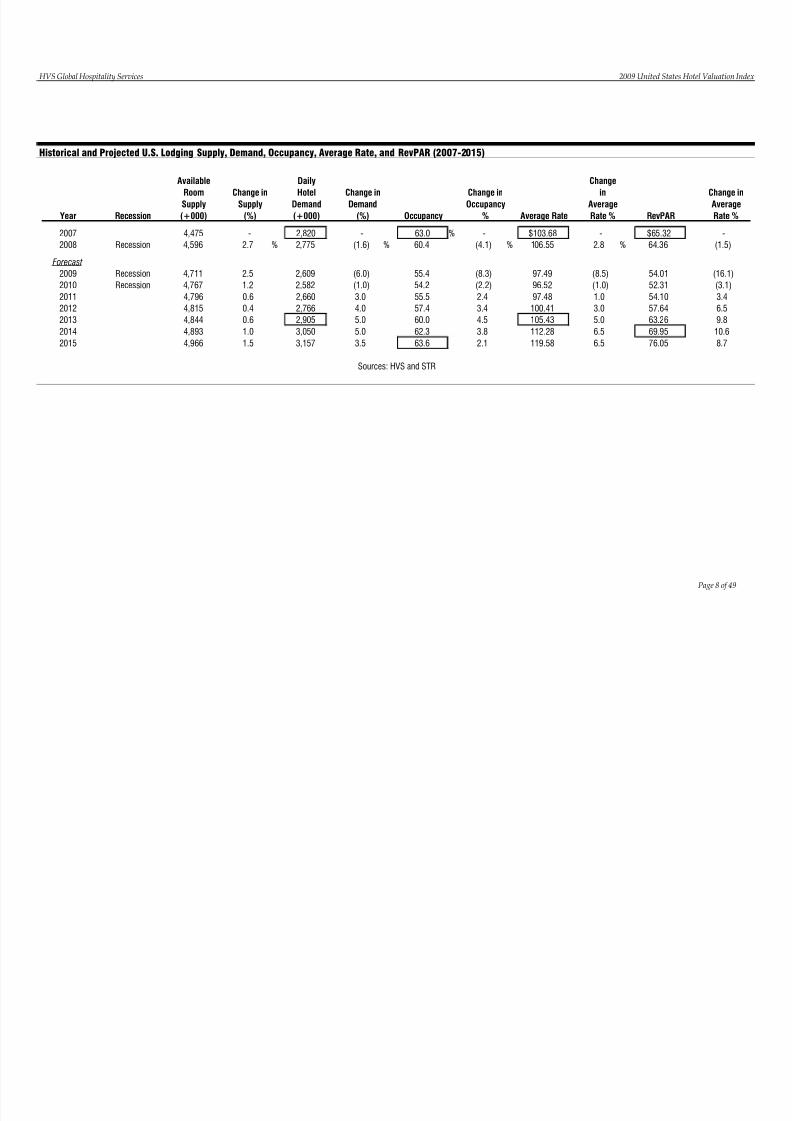
Based on the previously discussed state and outlook of the macroeconomiclandscape, the following illustrates historical and forecasted U.S. lodging supply, demand, occupancy, average rate, and RevPAR from 2007 through2015.
8/8/2019 HVS 2009 U.S. Hotel Valuation Index
http://slidepdf.com/reader/full/hvs-2009-us-hotel-valuation-index 9/50
HVS Global Hospitality Services 2009 United States Hotel Valuation I
Page 8 of 49
Historical and Projected U.S. Lodging Supply, Demand, Occupancy, Average Rate, and RevPAR (2007-2015)
Year Recession Occupancy Average Rate RevPAR
2007 4,475 - 2,820 - 63.0 % - $103.68 - $65.32 -2008 Recession 4,596 2.7 % 2,775 (1.6) % 60.4 (4.1) % 106.55 2.8 % 64.36 (1.
Forecast
2009 Recession 4,711 2.5 2,609 (6.0) 55.4 (8.3) 97.49 (8.5) 54.01 (16.12010 Recession 4,767 1.2 2,582 (1.0) 54.2 (2.2) 96.52 (1.0) 52.31 (3.1)2011 4,796 0.6 2,660 3.0 55.5 2.4 97.48 1.0 54.10 3.42012 4,815 0.4 2,766 4.0 57.4 3.4 100.41 3.0 57.64 6.52013 4,844 0.6 2,905 5.0 60.0 4.5 105.43 5.0 63.26 9.82014 4,893 1.0 3,050 5.0 62.3 3.8 112.28 6.5 69.95 10.62015 4,966 1.5 3,157 3.5 63.6 2.1 119.58 6.5 76.05 8.7
Sources: HVS and STR
Change inOccupancy%
Change
inAverageRate %
Change iAverageRate %
Available
RoomSupply(+000)
Change inSupply(%)
Daily
HotelDemand(+000)
Change inDemand(%)

8/8/2019 HVS 2009 U.S. Hotel Valuation Index
http://slidepdf.com/reader/full/hvs-2009-us-hotel-valuation-index 10/50
HVS Global Hospitality Services 2009 United States Hotel Valuation Index
Page 9 of 49
Based on the previous discussion of U.S. macroeconomic trends andcurrently prevailing market sentiments, the current recession is anticipated toextend for a duration of three years, ending in the latter half of 2010. During this period, marketwide supply is expected to increase at a slightly higherpace than witnessed during the 1980-82 recession, due to the low cost of capital and the widespread availability of credit prior to the current recession.However, the pace of supply growth is not considered so significant as toseverely hamper recovery efforts. In consideration of existing challengesrelated to new hotel project financing and depressed near-term earnings,proposed hotels that were in the early stages of development have beeneither put on hold or delayed indefinitely, thereby limiting the introductionof considerable new supply over near term. Going forward, as institutionsconclude their efforts to tend to distressed assets and the economic recoveryintensifies, hotel lending is expected to resume once capital markets return tosome semblance of normalcy. Consequently, our forecast accounts for anacceleration of supply growth beginning in 2014.
Though not matching in exact duration, lodging demand during the currentrecession is forecast to illustrate a prolonged recovery period, similar to thatin the early 1980’s recession. Overall, marketwide demand is forecast toillustrate three consecutive years of decline, from 2008 through 2010, followed by a progressive recovery. Across the board, 2009 is expected to register thelargest declines in demand, occupancy, and average rate. Resultantly,marketwide RevPAR is forecast to decline by a staggering 16.1% in 2009.Largely aligned with prospects for the national economy, marketwideRevPAR is forecast to bottom out in 2010, followed by a progressivelyintensifying recovery period. On the whole, marketwide RevPAR is forecastto fully recover and surpass its 2007 high by 2014. Our forthcoming forecastof year-over-year change in values for HVI markets is predicated on suchanticipated trends in the U.S. hospitality industry.
U.S. Lodging Sales Activity
A useful barometer to the income approach to hotel valuation is the presenceof comparable sales data. The following table illustrates a 12-year history of U.S. hotel sales, as well as year-to-date trends through July for both 2008 and2009.

8/8/2019 HVS 2009 U.S. Hotel Valuation Index
http://slidepdf.com/reader/full/hvs-2009-us-hotel-valuation-index 11/50
HVS Global Hospitality Services 2009 United States Hotel Valuation Index
Page 10 of 49
12-Year History – U.S. Hotel Sales
YearNumber of
HotelsChange
(%)Number of
RoomsChange
(%)
AveragePrice per
RoomChange
(%)
1997 288 - 51,848 - $82,000 -1998 234 (18.8) % 51,101 (1.4) % 95,000 15.9 %1999 222 (5.1) 31,203 (38.9) 83,000 (12.6)2000 254 14.4 33,300 6.7 80,000 (3.6)2001 196 (22.8) 39,163 17.6 127,000 58.8
2002 323 64.8 59,483 51.9 77,000 (39.4)2003 312 (3.4) 59,960 0.8 97,000 26.02004 605 93.9 115,703 93.0 89,000 (8.2)2005 522 (13.7) 111,934 (3.3) 126,000 41.62006 485 (7.1) 106,955 (4.4) 163,000 29.42007 447 (7.8) 84,782 (20.7) 152,000 (6.7)2008 357 (20.1) 48,684 (42.6) 127,000 (16.4)
Year-to-date Through July2008 252 - 34,146 - $133,000 -2009 87 (65.5) % 14,713 (56.9) % 117,000 (12.0) %
Source: HVS
The preceding table resoundingly illustrates the impact of a deepening economic recession on recent hotel sales activity. Each relevant metricillustrated sharp declines in 2008 from the previous year’s levels. The globaleconomic landscape was jolted by the calamitous events of the fourth quarterof 2008, which illustrated its consequent impact on hotel sales activity. Fromthe 357 hotel sales transacted in 2008, only 105, or roundly 29%, wereconducted between August and December 2008. The volume of hoteltransactions exhibited staggering declines in the year-to-date period through July 2009, compared to the same period in 2008.
As noted earlier, Real Capital Analytics estimates that approximately $18 billion in hotel loans were distressed as of August 2009, sharply higher thanthe approximately $1.3 billion as of the same period in 2008. Capital marketparticipants are expected to either foreclose on such assets or restructure andwork out their loan requirements. Considering such factors, savvy investorswith access to equity are expected to capitalize on such opportunities andpurchase distressed assets with an upside, at significantly discounted prices.

8/8/2019 HVS 2009 U.S. Hotel Valuation Index
http://slidepdf.com/reader/full/hvs-2009-us-hotel-valuation-index 12/50
HVS Global Hospitality Services 2009 United States Hotel Valuation Index
Page 11 of 49
Thus, over the next 12 to 18 months, the volume of hotel sales transactions isexpected to illustrate a progressively upward trend.
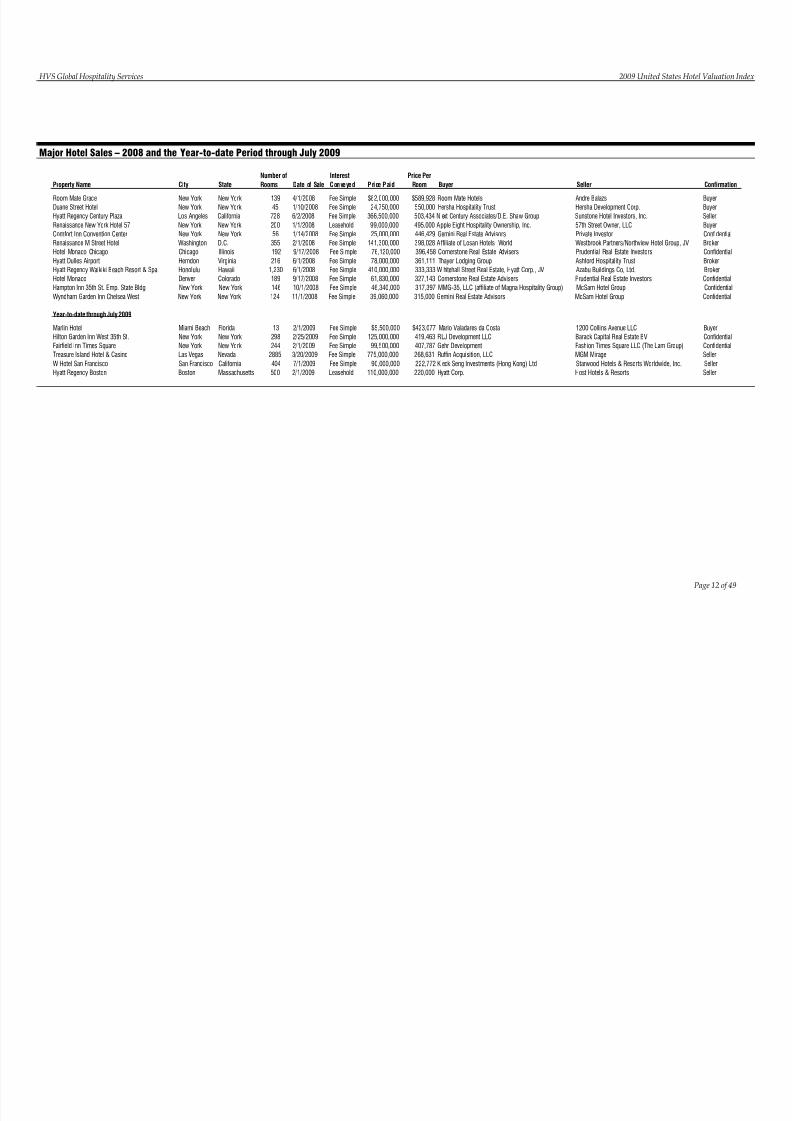
For referential purposes, the following table presents several of the largestsingle-asset sales (in price per room) in 2008 and the year-to-date periodthrough July 2009.
8/8/2019 HVS 2009 U.S. Hotel Valuation Index
http://slidepdf.com/reader/full/hvs-2009-us-hotel-valuation-index 13/50
HVS Global Hospitality Services 2009 United States Hotel Valuation I
Page 12 of 49
Major Hotel Sales – 2008 and the Year-to-date Period through July 2009
Property Name City StateNumber ofRooms Date of Sale
InterestConveyed Price Paid
Price PerRoom Buyer Seller Confirmatio
Room Mate Grace New York New York 139 4/1/2008 Fee Simple $82,000,000 $589,928 Room Mate Hotels Andre BalazsDuane Street Hotel New York New York 45 1/10/2008 Fee Simple 24,750,000 550,000 Hersha Hospitality Trust Hersha Development Corp.Hyatt Regency Century Plaza Los Angeles California 728 6/2/2008 Fee Simple 366,500,000 503,434 N ext Century Associates/D.E. Shaw Group Sunstone Hotel Investors, Inc.Renaissance New York Hotel 57 New York New York 200 1/1/2008 Leasehold 99,000,000 495,000 Apple Eight Hospitality Ownership, Inc. 57th Street Owner, LLCComfort Inn Convention Center New York New York 56 1/14/2008 Fee Simple 25,000,000 446,429 Gemini Real Estate Advisors Private InvestorRenaissance M Street Hotel Washington D.C. 355 2/1/2008 Fee Simple 141,300,000 398,028 Affiliate of Losan Hotels World Westbrook Partners/Northview HotelHotel Monaco Chicago Chicago Illinois 192 9/17/2008 Fee Simple 76,120,000 396,458 Cornerstone Real Estate Advisers Prudential Real Estate InvestorsHyatt Dulles Airport Herndon Virginia 216 6/1/2008 Fee Simple 78,000,000 361,111 Thayer Lodging Group Ashford Hospitality TrustHyatt Regency Waikiki Beach Resort & Spa Honolulu Hawaii 1,230 6/1/2008 Fee Simple 410,000,000 333,333 W hitehall Street Real Estate, Hyatt Corp., JV Azabu Buildings Co, Ltd.Hotel Monaco Denver Colorado 189 9/17/2008 Fee Simple 61,830,000 327,143 Cornerstone Real Estate Advisers Prudential Real Estate InvestorsHampton Inn 35th St. Emp. State Bldg New York New York 146 10/1/2008 Fee Simple 46,340,000 317,397 MMG-35, LLC (affiliate of Magna Hospitality Group) McSam Hotel GroupWyndham Garden Inn Chelsea West New York New York 124 11/1/2008 Fee Simple 39,060,000 315,000 Gemini Real Estate Advisors McSam Hotel Group
Year-to-date through July 2009
Marlin Hotel Miami Beach Florida 13 2/1/2009 Fee Simple $5,500,000 $423,077 Mario Valadares da Costa 1200 Collins Avenue LLCHilton Garden Inn West 35th St. New York New York 298 2/25/2009 Fee Simple 125,000,000 419,463 RLJ Development LLC Barack Capital Real Estate BVFairfield Inn Times Square New York New York 244 2/1/2009 Fee Simple 99,500,000 407,787 Gehr Development Fashion Times Square LLC (The LamTreasure Island Hotel & Casino Las Vegas Nevada 2885 3/20/2009 Fee Simple 775,000,000 268,631 Ruffin Acquisition, LLC MGM MirageW Hotel San Francisco San Francisco California 404 7/1/2009 Fee Simple 90,000,000 222,772 K eck Seng Investments (Hong Kong) Ltd Starwood Hotels & Resorts WorldwHyatt Regency Boston Boston Massachusetts 500 2/1/2009 Leasehold 110,000,000 220,000 Hyatt Corp. Host Hotels & Resorts

8/8/2019 HVS 2009 U.S. Hotel Valuation Index
http://slidepdf.com/reader/full/hvs-2009-us-hotel-valuation-index 14/50
HVS Global Hospitality Services 2009 United States Hotel Valuation Index
Page 13 of 49
A New Valuation Methodology
Valuing Hotels under Current Recessionary Market Conditions
HVS has traditionally utilized an algebraic equation known as thesimultaneous valuation formula (SVF), which was developed by SuzanneMellen, Managing Director of the HVS San Francisco and Las Vegas offices;the SVF solves for the total property value using a ten-year mortgage andequity technique. 11 The valuation of the mortgage and equity components isaccomplished using an algebraic equation that calculates the exact amount ofdebt and equity that the hotel will be able to support based on theanticipated cash flow (as estimated by an 11-year forecast of income andexpense) and the specific return requirements demanded by the mortgagelender (interest) and the equity investor (equity yield). Thus, the anticipatednet income (before debt service and depreciation) is allocated to themortgage and equity components based on market rates of return and loan-to-value ratios. The total of the mortgage component and the equitycomponent equals the value of the property. Via the mortgage-equitymethod, an overall property yield, also called an internal rate of return or adiscount rate, is calculated, which includes the yield to the lender, and theyield to the equity position.
Since the purpose of the HVI is to present a general estimate of market value,one must appropriately consider the anticipated recovery from currentlydepressed earning levels. Mellen maintains that “with the absence of salestransactions to validate the direction and level of capitalization rates…theneed to employ a ten year discounted cash flow analysis in hotel valuationsis all the more important now, with near term income levels declining andinvestors betting on a future recovery.” 12
As illustrated by the preceding section, with the widespread inactivity of capitalmarket lending sources, the volume of sales activity has eroded significantly.Willing buyers are continually encountering challenges related to the procurementof financing. If financing is secured, such buyers would like to purchasedistressed assets at a steep discount from peak values, “but sellers are averse
11 Suzanne R. Mellen, “Simultaneous Valuation: A New Technique,” Appraisal Journal,April 1983.12 Suzanne R. Mellen, “Hotel Capitalization Rates on the Rise,” HVS Global HospitalityReport, January 2009.
8/8/2019 HVS 2009 U.S. Hotel Valuation Index
http://slidepdf.com/reader/full/hvs-2009-us-hotel-valuation-index 15/50
HVS Global Hospitality Services 2009 United States Hotel Valuation Index
Page 14 of 49
to letting their hotels go at such distressed pricing.” 13 When valuing an assetin the current economic landscape, one must realize and maintain adistinction between market value and liquidation value. The premise of market value assumes a paradigm of a “willing buyer and willing seller”conducting a transaction after market-appropriate exposure and marketing times. On the contrary, liquidation value connotes the principle of “unwilling seller,” likely facing bankruptcy or foreclosure, under extreme duress to sell.Such transactions generally produce a sale price that reflects a 20%-50%discount from market value.
With near-term depressed earnings, and the reality of making a purchasewith all cash or a low loan-to-value ratio, HVS’s new valuation methodologyassumes that purchasers will look to refinance the hotel once its earningshave recovered and the credit markets have returned to some semblance of normalcy. Given the premise of market value, it is our opinion that modeling a refinancing in our mortgage-equity valuation analysis is the mostappropriate way to reflect the current thought process of market participants.
As an example, the following valuation exercise illustrates components of amortgage-equity analysis that assumes a refinancing scenario.
Refinancing Scenario Example – Assumptions
Date of Value January 1, 2009Projection Period 10 yearsAssumed Refinancing 2012 – based on 2012 property valueAssumed Sale and Reversion 2018Based on Per-room value
Assumptions
The following details a pro forma for the example asset through the year of stabilization (year seven). Beyond the stabilized year, net operating income ispresumed to increase annually at the assumed underlying rate of inflation(3.0%).
13 Suzanne R. Mellen, “Hotel Capitalization Rates on the Rise,” HVS Global HospitalityReport, January 2009.

8/8/2019 HVS 2009 U.S. Hotel Valuation Index
http://slidepdf.com/reader/full/hvs-2009-us-hotel-valuation-index 16/50
HVS Global Hospitality Services 2009 United States Hotel Valuation I
Page 15 of 49
Example Pro Forma through Stabilized Year
2009 2010 2011 2012 2013 2014 2015Occupancy 58% 57% 57% 58% 60% 62% 63%Average Rate $103.51 $102.47 $102.98 $106.07 $111.38 $118.62 $126.33
Revenues $(000) Percent $(000) Percent $(000) Percent $(000) Percent $(000) Percent $(000) Percent $(000) PercentRooms $21,800 65.8% $21,319 64.8% $21,500 64.3% $22,494 64.4% $24,311 65.1% $26,800 66.0% $29,188 66.9%Food $7,566 22.8% $7,724 23.5% $7,976 23.9% $8,310 23.8% $8,743 23.4% $9,239 22.8% $9,677 22.2%Beverages $1,742 5.3% $1,780 5.4% $1,837 5.5% $1,912 5.5% $2,007 5.4% $2,116 5.2% $2,212 5.1%Telephone $397 1.2% $405 1.2% $418 1.3% $437 1.3% $461 1.2% $490 1.2% $515 1.2%Rentals and Other Income $1,616 4.9% $1,655 5.0% $1,707 5.1% $1,771 5.1% $1,850 5.0% $1,938 4.8% $2,019 4.6%Total Rev enue $33,12 1 100.0% $ 32 ,883 100.0 % $33,43 8 100.0% $ 34 ,924 100.0 % $37,37 2 100.0% $ 40 ,583 100.0% $43,611 100.0 %
Departmental ExpensesRooms $6,051 27.8% $6,204 29.1% $6,399 29.8% $6,630 29.5% $6,905 28.4% $7,208 26.9% $7,491 25.7%Food & Beverages $7,341 78.9% $7,532 79.3% $7,767 79.2% $8,039 78.6% $8,356 77.7% $8,703 76.6% $9,030 76.0%Telephone $360 90.7% $369 91.1% $380 90.9% $394 90.2% $410 88.9% $427 87.1% $444 86.2%Rentals and Other Income $969 60.0% $996 60.2% $1,026 60.1% $1,061 59.9% $1,100 59.5% $1,143 59.0% $1,184 58.6%Total Departmental Expenses $14 ,721 44.4% $15,101 45.9% $15,572 46.6% $16,124 46.2% $16,771 44.9% $17,481 43.1% $18,149 41.6%
Departmenta l Income $18,40 0 55.6% $ 17 ,782 54.1% $ 17,86 6 53.4% $ 18 ,800 53.8% $ 20,60 1 55.1% $ 23 ,102 56.9% $ 25,46 2 58.4 %
Undistributed Operating ExpensesAdministrative & General $2,972 9.0% $3,052 9.3% $3,147 9.4% $3,254 9.3% $3,376 9.0% $3,509 8.6% $3,636 8.3%Marketing $2,420 7.3% $2,485 7.6% $2,562 7.7% $2,649 7.6% $2,749 7.4% $2,857 7.0% $2,961 6.8%
Prop. Oper. & Maintenance $1,728 5.2% $1,775 5.4% $1,829 5.5% $1,892 5.4% $1,963 5.3% $2,040 5.0% $2,114 4.8%Energy Costs $1,445 4.4% $1,487 4.5% $1,532 4.6% $1,580 4.5% $1,632 4.4% $1,686 4.2% $1,740 4.0%Total UDOEs $8,565 25.9% $8,799 26.8% $9,070 27.1% $9,375 26.8% $9,720 26.0% $10,092 24.9% $10,451 24.0%
Income Before Fixed Cha rges $9,83 5 29.7% $8 ,983 27.3% $8,79 6 26.3% $9 ,425 27.0% $10,88 1 29.1% $ 13 ,010 32.1% $15,011 34.4 %
Fixed ChargesManagement Fee $994 3.0% $986 3.0% $1,003 3.0% $1,048 3.0% $1,121 3.0% $1,217 3.0% $1,308 3.0%Property Tax $1,765 5.3% $1,802 5.5% $1,858 5.6% $1,937 5.5% $2,036 5.4% $2,170 5.3% $2,236 5.1%Insurance $742 2.2% $764 2.3% $787 2.4% $810 2.3% $835 2.2% $860 2.1% $885 2.0%Reserve for Replacement $994 3.0% $986 3.0% $1,003 3.0% $1,048 3.0% $1,121 3.0% $1,217 3.0% $1,308 3.0%Total Fixed Charges $4,495 13.6% $4,538 13.8% $4,651 13.9% $4,843 13.9% $5,113 13.7% $5,464 13.5% $5,737 13.2%
Net Income $6,675 16.1% $5,556 13.5% $5,181 12.4% $5,728 13.1% $7,210 15.4% $9,433 18.6% $11,593 21.3%

8/8/2019 HVS 2009 U.S. Hotel Valuation Index
http://slidepdf.com/reader/full/hvs-2009-us-hotel-valuation-index 17/50
HVS Global Hospitality Services 2009 United States Hotel Valuation Index
Page 16 of 49
As noted, this valuation assumes refinancing at the end of 2012, by whichtime the asset’s income level recovery has intensified, coinciding with theanticipated availability of higher leveraged credit. Based on suchassumptions, the following illustrates the results of two scenarios: valuationunder current market conditions at time of purchase and valuation uponrefinancing.
Valuation under Current Investment Parameters (2009)
LTV 50% Valuation Input LTV 50% Valuation Output
Loan/Value 50% Value $72,700Amortization 25 years Overall Discount Rate 15.20%Term 10 years Mortgage $36,350Interest Rate 7.50% Mortgage Constant 0.0887Terminal Cap Rate 10.00% Debt Service $3,225Transaction Costs 2.00%Equity Yield 19.00%
Valuation under Anticipated Refinancing Investment Parameters (End of 2012)
LTV 70% Valuation Input LTV 70% Valuation Output
Loan/Value 70% Value $108,500Amortization 25 years Overall Discount Rate 12.30%Term 10 years Mortgage $75,950Interest Rate 7.00% Mortgage Constant 0.0848Terminal Cap Rate 10.00% Debt Service $6,442Transaction Costs 2.00%Equity Yield 19.00%
Thereafter, a final valuation is conducted that appropriately weighs theimpact of refinancing.

8/8/2019 HVS 2009 U.S. Hotel Valuation Index
http://slidepdf.com/reader/full/hvs-2009-us-hotel-valuation-index 18/50
HVS Global Hospitality Services 2009 United States Hotel Valuation Index
Page 17 of 49
Final Valuation Per Room – Initial Purchase and Refinancing Scenarios
DiscountedYear Cash Flow
2009 $6,675 $3,225 $3,450 0.8403 $2,9882010 5,556 3,225 2,331 0.7062 1,6462011 5,181 3,225 1,956 0.5934 1,1612012 5,728 3,225 $41,104 43,606 0.4987 21,7452013 7,210 6,442 768 0.4195 322
2014 9,433 6,442 2,991 0.3521 1,0532015 11,593 6,442 5,498 0.2960 1,5242016 11,940 6,442 5,856 0.2487 1,3672017 12,298 6,442 6,225 0.2090 1,2242018 12,667 6,442 60,271 66,496 0.1756 11,676
Value of Equity Component $44,619Plus: Value of Initial Mortgage $36,369Total Property Value Per Room $80,998Rounded $81,000
Debt Service
Net IncomeAvailable forDebt Service
TotalAnnual
Plus:Refi/SalesProceeds
PresentWorth of
$1 at 19%to EquityCash Flow
Total
As illustrated, the weighted per-room valuation result of roundly $81,000rests between the range provided by the initial purchase valuation and therefinancing valuation. As Mellen summarizes, “the capitalization anddiscount rates developed through the refinancing scenario more accuratelyreflect the expectations of hotel investors, and thus better reflect themarketplace and concept of market value.” 14 Consequently, this newlydeveloped refinancing model forms the basis of our estimation of value perroom for HVI markets.
The following figure illustrates the impact of various loan-to-value (LTV)requirements for either valuation scenario on the final resulting value.
14 Suzanne R. Mellen, “Hotel Capitalization Rates on the Rise,” HVS Global HospitalityReport, January 2009.

8/8/2019 HVS 2009 U.S. Hotel Valuation Index
http://slidepdf.com/reader/full/hvs-2009-us-hotel-valuation-index 19/50
HVS Global Hospitality Services 2009 United States Hotel Valuation Index
Page 18 of 49
Valuation Comparison
Understanding the HVI
The Hotel Valuation Index (HVI) tracks hotel values in 65 major markets andthe United States as a whole. Created in 1987 by HVS, the HVI is derivedfrom an income capitalization approach, utilizing market area data provided by Smith Travel Research (STR) and historical operational information fromHVS’s extensive global experience in hotel feasibility studies and valuations.The data are then aggregated to produce a pro-forma performance for atypical 1,000-room, full-service hotel in each respective market of the UnitedStates. Based upon our experience of real-life hotel financing structuresgained from valuing thousands of hotels each year, we then applyappropriate valuation parameters for each market, including loan-to-valueratios, real interest rates, and equity return expectations. As noted, our newlydeveloped refinancing model forms the basis of our estimation of value perroom for HVI markets. These market-specific valuation parameters areapplied to the net operating income for a typical 1,000-room, full-service hotelin each city.

8/8/2019 HVS 2009 U.S. Hotel Valuation Index
http://slidepdf.com/reader/full/hvs-2009-us-hotel-valuation-index 20/50
HVS Global Hospitality Services 2009 United States Hotel Valuation Index
Page 19 of 49
Prior to the 2008 version of the HVI, we had indexed the 1987 value of atypical U.S. hotel (1987 = 1.0000) as a base. Beginning in last year’s version,we have utilized 2005 as the base year. Thus, each market area is indexed off the 2005 U.S. base, with a number showing the value relationship of thatmarket area to the base. For example, in 2005, the index for New York, NewYork, was 3.857, which means that the value of a hotel located in New York was approximately 386% higher than that of a similar hotel in the U.S. as awhole in 2005.
Another useful comparison highlights the value differences between hotels in
two different U.S. cities. For example, say that a hotel in Philadelphia,Pennsylvania, sold in 2008 for $100,000 per room. If a similar hotel weresituated in New York, it would probably have sold for roundly $469,000 perroom in 2008. This figure is calculated by taking the 2008 HVI for New York,and dividing it by the 2008 HVI for Philadelphia to determine the valueadjustment.
2008 HVI New York (5.590) / 2008 HVI Philadelphia (1.191) = 4.6935
The 2008 sales price of $100,000 per room is then multiplied by the amount of the previously calculated factor of 4.6935, yielding the estimated 2008 salesprice per room for New York.
$100,000 x 4.6935 = $469,350
To calculate the percentage change of hotel values in the same markets atdifferent points in time using the HVI, divide the HVI for the last year by theHVI for the first year, and then subtract 1 from this calculation. For example,in 2006, the HVI for Miami was 2.789, and in 2008, the HVI for this city was3.042. To calculate the estimated percentage change in value for a typicalMiami hotel from 2006 to 2008, divide the 2008 HVI of 3.042 by the 2006 HVIof 2.789, and then subtract 1 to get an approximate 9% increase in value from2006 to 2008.
(3.042/2.789) – 1 = 0.0907, or roundly 9%

8/8/2019 HVS 2009 U.S. Hotel Valuation Index
http://slidepdf.com/reader/full/hvs-2009-us-hotel-valuation-index 21/50
HVS Global Hospitality Services 2009 United States Hotel Valuation Index
Page 20 of 49
2009 HVI
In 2008, the value of a typical full-service hotel in the United States declined by roundly $14,000 per room, or approximately 14.6%. The per-room valuefor the United States as a whole reached its peak in 2006, surpassing $100,000.Since that time, the per-room value has tumbled, and is forecast to reach half its peak amount in 2010. These trends have been prompted by significantdeclines in all forms of travel, which have in turn severely impacted netincome, as hoteliers have drastically reduced average rates in an effort to boost occupancy levels. Combined with stringent credit availability and
terms, the effect upon hotel values is significant. While per-values will remainsuppressed in the near term, the overall market should recover in 2013-2014.
The following table illustrates historical and forecast per-room values for atypical U.S. hotel.
Historical and Projected United States Per-Room Hotel Values
2005 2006 2007 2008 2009 2010 2011 2012 2013
United States $82,416 $100,065 $95,117 $81,196 $55,132 $50,060 $57,069 $75,102 $93,12725.4% 21.4% -4.9% -14.6% -32.1% -9.2% 14.0% 31.6% 24.0%
Sixty of the 66 markets reviewed (including the United States as a whole)experienced declines in per-room value in 2008. While not as drastic as the2001 change in per-room values, the severity of the current recession uponhotel values is illustrated in the fact that two-thirds of the marketsexperienced declines in 2007, and 60 markets are projected to decline in 2009.Per-room values for over two-thirds of the market are expected to continue todecline in 2010. The four years of per-room value declines for over half of allmajor U.S. markets is unprecedented in the history of the HVI. HVS projectsthat it will take roughly five years (by 2013-2014) for values to return to thehighs recorded in 2006 and 2007; on average, the lowest point in per-roomvalues is expected to occur in early 2010.
The following table provides a historical review of the number of marketswhere hotel values have declined, beginning in 1991. The year 2008 marksthe largest number of markets where values declined since 2001.

8/8/2019 HVS 2009 U.S. Hotel Valuation Index
http://slidepdf.com/reader/full/hvs-2009-us-hotel-valuation-index 22/50
HVS Global Hospitality Services 2009 United States Hotel Valuation Index
Page 21 of 49
Number of Markets Where Hotel Values Declined
Year
1991 501995 22000 152001 642002 312003 37
2004 82005 42006 42007 442008 61
Number ofMarkets
While the data for 2008 is indeed ominous, some markets actuallyexperienced increases in per-room value in 2008, in comparison to 2007. The biggest per-room gain in value occurred in New Orleans, where valueincreased over 20%. Per-room value in New Orleans declined nearly 40% in2007, due to the continued effects of Hurricane Katrina in the area, as
recovery efforts have been slow, and rebuilding of industry and tourism has been gradual. New Orleans’ economy improved in 2008; the city is heavilydependent on the oil industry, which recorded high profits in 2008. Hoteldemand has also been boosted by continual construction projects in the area.Similarly, Houston experienced a strong per-room value increase in 2008, asthe Energy Capital of the World continued to benefit from the presence of amultitude of energy companies in the area. Houston’s reputation as a leading healthcare center also boosted growth in demand. Pittsburgh, Buffalo, andSan Francisco completed the top five markets, in terms of per-room valueincreases in 2008. Pittsburgh was one of the few cities that added jobs in 2008;the city’s economy has diversified since its manufacturing days, and the city
was ranked as America’s Most Livable City by The Economistin 2009. The onlyother market that experienced an increase in per-room value in 2008, albeitmarginal, was Portland, Oregon.
The greatest percentage declines in per-room value vastly outpaced the gainsmade by the top five “winners” mentioned previously. These five declining markets have been plagued by dwindling industries, such as the textile andtobacco industries in Greensboro, as well as the collapse of the housing

8/8/2019 HVS 2009 U.S. Hotel Valuation Index
http://slidepdf.com/reader/full/hvs-2009-us-hotel-valuation-index 23/50
HVS Global Hospitality Services 2009 United States Hotel Valuation Index
Page 22 of 49
market, such as in West Palm Beach–Boca Raton. Las Vegas’ building frenzyfinally caught up with the city in 2008, as huge casino hotels opened to adiminishing number of visitors. Moreover, the fallout from lavish corporatespending and incentive meetings caused Las Vegas to be blacklisted among meeting planners; as consumer confidence and spending dwindled, so hasleisure travel to perceived “lavish” destinations, such as Las Vegas.Tallahassee experienced nearly a 50% decline in per-room value in 2008, incomparison to 2007. While the local economy has remained relatively stable, boosted by the presence of state government and two major universities, thecity’s financial profile has continually deteriorated, due to deficit spending and the inability to generate sufficient revenues.
Major Winners and Losers in 2008
Market 2008
New Orleans 21%Houston 20%Pittsburgh 11%Buffalo 9%San Francisco 5%
WPB-Boca Raton -29%Las Vegas -29%Norfolk -40%Greensboro -46%Tallahassee -49%
Some of the most iconic American cities (New York, San Francisco, Boston,and Washington, D.C.) have historically achieved the highest per-roomvalues throughout the years, and are projected to continue to do so over thenext five years. Other cities and regions have lost ground in comparison withother markets, such as Stamford, Connecticut, and Long Island, New York,
both of which represent mature, saturated markets with little developmentpotential. Going forward, Las Vegas is projected to lose its Top Ten status,due to the economic conditions described previously. Newcomers such asHouston and Seattle are poised to experience strong growth in per-roomvalues, due to growing industries and development potential.

8/8/2019 HVS 2009 U.S. Hotel Valuation Index
http://slidepdf.com/reader/full/hvs-2009-us-hotel-valuation-index 24/50
HVS Global Hospitality Services 2009 United States Hotel Valuation Index
Page 23 of 49
The following table presents the top ten markets in terms of per-room valueas of 2000 and 2006, as well as forecasts for 2010 and 2013.
Top Ten Markets through the Years
1 San Francisco $329,000 New York $382,000 Washington DC $312,000 New York $475,02 New York 302,000 Oahu 356,000 New York 304,000 Washington DC 450,03 Boston 294,000 Washington DC 242,000 San Francisco 266,000 Boston 375,0004 San Jose 237,000 San Francisco 242,000 Boston 217,000 San Francisco 368,000
5 Long Island 191,999 San Diego 232,000 Oahu 211,000 Oahu 334,0006 Oahu 169,000 Miami 230,000 Miami 189,000 Miami 313,0007 Washington DC 168,000 Boston 216,000 San Diego 186,000 San Diego 289,008 San Diego 159,000 Las Vegas 201,000 WPB - Boca Raton 170,000 WPB - Boca Raton 253,09 Chicago 153,000 Chicago 199,000 Houston 160,000 Seattle 248,00010 Stamford 152,000 Los Angeles 196,000 Los Angeles 137,000 Houston 246,000
2006 2010 2013
Source: HVS
2000
In general, 2006 marked the year that per-room hotel values in most of themarkets reached their peak during the historical period reviewed. Thefollowing table presents the changes in value for the top ten and bottom tenmarkets from the peak levels achieved in 2006, through the projected per-room values for 2013. The United States’ ranking is also provided to facilitatea comparison.

8/8/2019 HVS 2009 U.S. Hotel Valuation Index
http://slidepdf.com/reader/full/hvs-2009-us-hotel-valuation-index 25/50
HVS Global Hospitality Services 2009 United States Hotel Valuation Index
Page 24 of 49
Changes in Per-Room Value from 2006 to (Projected) 2013
Rank Rank
1 Washington, D.C. $209,000 57Indianapolis ($14,000)2 Boston 159,000 58 Dayton (14,000)3 Houston 141,000 59 Jacksonville (19,000)4 San Francisco 126,000 60 Sacramento (20,000)5 New York 93,000 61 Oahu (22,000)6 Denver 88,000 62 Phoenix (25,000)7 San Jose 85,000 63 Greensboro (30,000)8 Miami 83,000 64 Detroit (32,000)9 Portland 81,000 65 Tallahassee (44,000)
10 Austin 74,000 66 Las Vegas (103,000)
51 United States ($7,000)
Rank Rank 1 Houston 134.5% 57 Orlando -10.4%2 Huntsville 89.5% 58 Phoenix -14.8%3 Columbia 89.5% 59 Indianapolis -15.3%4 Washington, D.C. 86.3% 60 Jacksonville -15.6%5 Boston 73.6% 61 Sacramento -18.6%6 Portland 72.2% 62 Dayton -32.8%7 Denver 70.8% 63 Greensboro -47.7%8 Pittsburgh 67.9% 64 Las Vegas -51.2%9 San Jose 64.1% 65 Detroit -54.1%10 St. Louis 59.5% 66 Tallahassee -61.7%
53 United States -6.9%
Source: HVS
The following tables present the historical and projected estimates for theHotel Valuation Index. We note that since the 2008 version, we haveamended the base year from 1987 to 2005. Therefore, a typical hotel in theUnited States, which was previously indexed 1.000 in 1987, has now beenindexed at 1.000 in 2005. For informational purposes, we have presented HVIresults between 1987 and 2004, then from 2005 to 2008, plus a forecast for2009. The HVI also shows the Compounded Annual Growth Rate (CAGR).

8/8/2019 HVS 2009 U.S. Hotel Valuation Index
http://slidepdf.com/reader/full/hvs-2009-us-hotel-valuation-index 26/50
HVS Global Hospitality Services 2009 United States Hotel Valuation I
Page 25 of 49
Hotel Valuation Index – 1987 to 2004
Market 1987 1988 1989 1990 1991 1992 1993 1994 1995 1996 1997 1998 1999 2000 2001 2002 2003 2004
Albuquerque 1.194 1.245 1.460 1.461 1.538 1.615 1.804 1.769 1.676 1.507 1.478 1.083 0.937 1.036 0.904 0.995 0.948 0.990 (1Anaheim 1.364 1.317 1.313 0.963 0.763 0.656 0.781 0.692 1.057 1.318 1.643 1.560 1.577 2.118 2.157 1.960 2.251 2.871 4.Atlanta 1.321 1.198 1.155 1.045 1.045 1.195 1.631 1.963 2.409 2.700 2.190 2.184 2.241 2.234 1.717 1.600 1.333 1.736 1.Austin 0.437 0.423 0.603 0.639 0.768 1.031 1.365 1.642 2.351 2.257 2.461 2.394 2.406 2.955 1.960 1.532 1.325 1.415 7.2Baltimore 1.717 1.374 1.326 0.907 0.748 0.867 0.996 1.284 1.600 1.859 2.346 2.496 2.758 3.264 2.871 3.301 3.331 3.671 4.Boston 2.612 2.750 2.334 2.505 1.799 1.987 2.412 3.177 4.019 4.651 6.334 6.485 6.830 7.880 5.169 4.402 3.050 4.318 3.0Buffalo 1.384 1.257 1.506 1.465 1.472 1.211 1.102 1.055 1.115 1.142 1.328 1.183 1.283 1.347 1.121 1.170 1.069 0.999 (1.Charlotte 1.096 1.094 1.019 0.700 0.499 0.560 0.668 0.950 1.280 1.642 1.889 1.852 1.849 1.558 0.986 1.049 1.016 1.203 0.Chicago 1.663 1.644 1.426 1.463 1.303 1.348 1.660 2.225 2.663 3.170 4.005 3.996 4.003 4.098 2.650 2.405 2.456 2.669 2.8Cincinnati 1.167 1.199 1.134 1.068 0.982 1.056 1.073 1.201 1.323 1.435 1.591 1.491 1.447 1.353 0.918 1.055 1.136 1.374 1.Cleveland 0.821 0.909 0.928 0.733 0.639 0.701 0.898 1.195 1.667 1.625 1.885 1.710 1.627 1.536 1.034 0.912 0.776 0.977 1.Columbia 0.891 0.748 0.760 0.615 0.572 0.745 0.836 0.905 1.163 1.283 1.395 1.078 1.092 1.104 0.965 1.180 1.168 1.611 3.Dallas 0.933 0.992 1.215 1.109 1.155 1.403 1.564 1.955 2.421 2.606 2.824 2.736 2.424 2.493 1.554 1.442 1.195 1.504 2.8Dayton 1.193 0.996 1.018 0.633 0.557 0.590 0.685 0.706 0.840 0.809 0.988 1.103 1.058 1.069 0.817 0.917 1.037 0.940 (1.4Denver 0.807 0.768 0.734 0.885 0.988 1.182 1.547 1.772 2.120 2.391 2.831 2.585 2.179 2.318 1.772 1.575 1.378 1.668 4.4Detroit 1.414 1.136 0.871 0.510 0.304 0.410 0.557 0.931 1.257 1.382 1.543 1.678 1.929 2.052 1.430 1.127 0.921 1.081 (1.Fort Lauderdale 1.087 0.965 1.015 0.936 0.744 1.479 1.255 1.020 1.377 1.669 2.220 2.035 2.209 2.336 2.037 1.742 2.124 3.151 6Greensboro 0.611 0.705 0.685 0.460 0.312 0.680 1.004 1.296 1.498 1.162 1.285 1.509 1.355 1.421 1.100 1.239 1.334 1.306 4.6Hartford 2.183 1.952 1.676 1.480 0.640 0.497 0.425 0.573 0.886 1.118 1.531 1.701 2.016 2.354 1.985 1.758 1.367 1.846 (1.Houston 0.538 0.763 0.881 1.014 1.127 1.126 1.165 1.198 1.355 1.443 1.952 2.057 1.699 1.828 1.857 1.703 1.231 1.442 6.0Huntsvil le 0.603 0.635 0.615 0.483 0.510 0.605 0.453 0.354 0.381 0.464 0.836 0.537 0.659 0.693 0.641 0.961 1.006 1.133 3Indianapoli s 1.153 1.035 1.059 0.854 0.903 1.019 1.171 1.356 1.681 1.697 1.863 1.551 1.439 1.734 1.544 1.573 1.557 1.896 3.Jacksonville 0.808 0.755 0.842 0.705 0.569 0.796 0.992 1.175 1.517 1.830 2.133 1.820 1.785 1.958 1.767 1.970 2.331 2.675 7.Kansas Ci ty 1.057 1.090 1.001 0.763 0.657 0.795 1.108 1.313 1.659 1.823 2.007 1.757 1.537 1.493 1.266 1.258 0.985 1.238 0.Las Vegas 1.030 1.099 1.164 1.292 0.831 0.922 1.386 2.065 2.438 3.325 3.245 2.886 3.101 3.996 3.421 3.651 4.984 6.167 11.Long Island 3.820 2.891 2.437 1.463 0.916 0.879 1.074 1.383 1.802 2.059 2.665 3.205 3.963 5.117 4.494 3.911 3.724 3.617 (0.Los Angeles 1.652 1.585 1.586 1.626 1.016 0.617 0.501 0.921 0.970 1.338 2.095 2.475 2.674 3.267 2.460 2.349 2.448 3.639 4.Memphis 0.821 0.611 0.633 0.538 0.595 0.668 0.968 1.280 1.444 1.419 1.655 1.509 1.256 1.064 0.889 0.978 0.937 1.199 2.Miami 0.597 0.786 0.940 1.191 1.294 2.289 2.024 0.906 1.863 2.174 2.863 2.856 3.299 3.403 2.363 1.638 2.098 3.504 11.Milwaukee 0.955 1.015 0.928 0.879 0.707 0.692 0.777 0.858 1.008 0.973 1.162 1.210 1.212 1.315 0.966 1.074 1.118 1.204 1.Minneapoli s 1.050 0.833 0.711 0.637 0.863 1.167 1.398 1.689 1.995 1.961 2.260 2.240 2.082 2.277 1.767 1.676 1.450 1.892 3.Nashvi lle 1.387 1.141 1.140 0.990 0.937 1.135 1.337 1.712 2.112 2.103 2.366 1.880 1.712 1.616 1.228 1.378 1.550 1.801 1.New Haven 1.958 1.761 1.482 1.043 0.621 0.531 0.594 0.649 0.930 1.080 1.532 1.686 1.901 2.178 1.994 2.030 1.669 1.799 (0.
CAGR(1987 - 20

8/8/2019 HVS 2009 U.S. Hotel Valuation Index
http://slidepdf.com/reader/full/hvs-2009-us-hotel-valuation-index 27/50
HVS Global Hospitality Services 2009 United States Hotel Valuation I
Page 26 of 49
Hotel Valuation Index – 1987 to 2004 (continued)
Market 1987 1988 1989 1990 1991 1992 1993 1994 1995 1996 1997 1998 1999 2000 2001 2002 2003 2004
New Orleans 1.183 1.537 1.589 1.593 1.647 2.053 2.079 2.621 3.021 2.990 3.382 3.408 3.736 4.010 3.342 3.244 2.920 3.172 6.New York 1.339 1.422 1.392 0.964 0.804 0.670 0.804 0.536 1.442 2.898 4.803 6.392 6.805 8.089 3.666 2.802 2.678 5.174 8Norfolk 1.569 1.375 1.272 0.850 0.733 0.761 0.750 0.792 0.968 0.918 1.140 1.238 1.138 1.270 1.182 1.739 1.986 1.822 0.Oahu 2.235 2.517 3.095 3.925 3.236 3.773 2.777 3.137 4.343 4.499 4.954 3.816 3.397 4.522 3.412 3.617 4.318 6.240 6.2Oakland 1.241 1.193 1.216 0.978 0.923 0.958 0.835 0.940 1.309 1.801 2.648 2.860 2.960 3.999 3.125 2.164 1.509 1.718 1.Omaha 0.224 0.351 0.486 0.467 0.357 0.309 0.492 0.509 0.856 0.840 0.993 1.211 1.221 1.080 1.041 1.107 1.155 1.375 11.3Orlando 1.797 1.890 2.369 2.154 1.834 2.129 1.986 1.929 2.244 2.916 3.662 3.356 3.085 3.212 2.151 2.249 2.100 3.134 3.Phi ladelphia 1.942 1.534 1.232 0.905 0.619 0.560 0.728 1.116 1.425 1.905 2.500 2.473 2.297 2.358 1.694 2.098 1.904 2.303 1.Phoenix 1.415 1.135 1.598 1.398 1.196 1.413 1.984 2.599 3.285 3.568 3.793 3.012 2.524 2.602 1.953 1.740 1.954 2.752 4.0Pittsburgh 1.162 1.096 1.233 1.130 1.065 1.209 1.272 1.462 1.483 1.587 1.613 1.473 1.544 1.634 1.151 1.205 1.163 1.414 1.2Portland 1.148 1.438 1.729 1.703 1.841 1.728 1.906 1.994 2.509 2.709 2.629 2.164 1.867 1.736 1.376 1.380 1.307 1.594 2.0Raleigh-Durham 1.008 0.814 0.705 0.576 0.527 0.789 0.978 1.145 1.689 2.153 2.305 1.746 1.601 1.704 1.315 1.243 1.203 1.463 2Richmond 1.409 1.316 1.263 1.130 0.910 0.967 0.974 1.011 1.151 1.344 1.572 1.512 1.313 1.373 1.098 1.131 1.513 1.686 1.Rochester 1.792 1.740 1.708 1.536 1.608 1.233 1.053 0.808 1.116 0.967 1.057 1.362 1.370 1.366 1.038 1.134 1.341 1.222 (2.2Sacramento 1.025 0.959 0.914 0.799 0.734 0.973 1.113 1.244 1.496 1.388 1.697 1.835 1.767 2.159 1.815 1.882 1.961 2.213 4.6Salt Lake City 1.143 1.340 1.492 1.508 1.547 1.747 2.072 2.251 2.510 3.007 3.131 2.472 1.952 1.863 1.675 2.712 1.781 1.971 3San Antonio 0.856 1.206 1.423 1.316 1.422 1.911 2.272 2.190 2.231 1.994 2.099 2.260 2.208 2.368 2.187 2.628 2.398 2.556 6.San Diego 2.088 1.836 1.810 1.301 1.292 1.320 1.154 1.351 1.762 2.089 2.971 3.635 3.808 4.253 3.790 3.934 4.312 4.681 4.San Franci sco 2.767 2.513 2.391 2.871 2.400 2.426 2.807 3.259 4.154 5.167 7.071 7.229 7.284 8.823 5.086 3.187 2.803 3.973 2.San Jose 1.503 1.614 1.788 1.505 1.216 1.155 1.198 1.499 2.281 3.201 4.354 4.365 4.501 6.355 3.914 2.315 1.254 1.545 0.2Santa Fe 1.888 2.375 3.090 3.275 3.232 3.667 4.598 3.659 3.352 2.827 3.360 3.248 3.274 3.300 3.056 3.559 3.282 3.559 3.8Seattle 1.438 1.594 1.916 1.886 1.796 1.804 1.931 2.118 2.722 2.990 3.456 3.305 2.977 3.034 2.369 2.123 2.199 2.689 3.7St. Louis 0.768 0.778 0.745 0.699 0.659 0.767 0.930 1.136 1.324 1.338 1.420 1.252 1.283 1.418 1.218 1.371 1.166 1.294 3.Stamford 1.835 1.853 1.659 1.369 1.155 0.941 1.150 1.157 1.525 2.139 2.774 3.377 3.390 4.076 2.835 2.394 2.029 2.245 1.2Syracuse 1.420 1.527 1.716 1.715 1.360 1.251 1.113 1.021 1.124 1.050 1.197 1.354 1.437 1.230 1.186 1.569 1.527 1.485 0.3Tallahassee 0.330 0.373 0.405 0.546 0.430 0.449 0.590 0.622 0.833 0.791 0.905 0.978 1.083 1.216 0.956 1.146 1.359 1.813 10.5Tampa 0.667 0.695 1.011 0.990 0.928 0.907 0.933 0.967 1.109 1.405 1.869 1.847 1.968 2.045 1.866 1.562 1.548 2.103 7.0Tucson 1.076 1.144 1.341 1.219 1.185 1.323 1.737 1.879 2.417 2.431 2.410 2.152 2.066 2.065 1.697 1.512 1.454 1.757 2.9United States 1.000 0.990 1.017 0.858 0.737 0.796 0.878 1.004 1.207 1.348 1.594 1.608 1.641 1.850 1.404 1.392 1.382 1.760 3.4Washington, D.C. 1.999 1.970 1.997 1.770 1.517 1.729 2.260 2.229 2.769 2.732 3.669 3.645 3.942 4.507 3.582 3.869 4.099 5.482 6Wilmington 1.850 2.197 1.586 0.975 0.546 0.508 0.374 0.458 0.734 1.028 1.743 1.770 1.915 1.819 1.483 1.460 1.843 1.872 0Winston-Salem 1.228 1.192 1.371 1.121 0.983 1.413 1.579 1.385 1.625 1.514 1.654 1.480 1.196 1.147 0.957 0.988 1.058 0.941 (1.WPB-Boca Raton 1.085 0.977 0.996 0.426 0.364 0.942 1.433 1.368 1.668 1.807 2.524 2.472 2.615 3.113 2.600 2.355 2.695 4.190 8
CAGR(1987 - 20

8/8/2019 HVS 2009 U.S. Hotel Valuation Index
http://slidepdf.com/reader/full/hvs-2009-us-hotel-valuation-index 28/50
HVS Global Hospitality Services 2009 United States Hotel Valuation Index
Page 27 of 49
Hotel Valuation Index – 2005 to 2009
Market 2005 2006 2007 2008 2009*
Albuquerque 0.549 0.702 0.673 0.666 0.516 6.7 %Anaheim 1.761 2.087 1.991 1.683 1.539 (1.5)Atlanta 1.085 1.338 1.159 0.907 0.681 (5.8)Austin 1.075 1.636 1.736 1.723 1.522 17.0Baltimore 1.758 1.890 1.638 1.237 0.997 (11.0)Boston 2.328 2.623 3.162 2.750 2.527 5.7Buffalo 0.581 0.741 0.827 0.897 0.709 15.6
Charlotte 0.811 1.203 1.306 1.121 1.003 11.4Chicago 1.698 2.418 2.563 2.052 1.522 6.5Cincinnati 0.710 0.844 0.755 0.717 0.675 0.3Cleveland 0.458 0.708 0.679 0.485 0.321 2.0Columbia 0.925 0.998 0.939 0.882 0.970 (1.6)Dallas 1.015 1.305 1.191 1.093 0.930 2.5Dayton 0.457 0.522 0.398 0.325 0.183 (10.8)Denver 1.058 1.517 1.614 1.573 1.453 14.1Detroit 0.564 0.727 0.614 0.492 0.194 (4.4)Fort Lauderdale 1.698 2.027 1.769 1.420 1.151 (5.8)Greensboro 0.639 0.769 0.617 0.334 0.180 (19.5)Hartford 0.786 0.793 0.726 0.566 0.432 (10.4)Houston 1.067 1.272 1.311 1.578 1.769 13.9
Huntsville 0.644 0.704 0.799 0.721 0.697 3.8Indianapolis 0.906 1.098 0.965 0.795 0.635 (4.3)Jacksonville 1.473 1.466 1.301 0.955 0.781 (13.4)Kansas City 0.648 0.817 0.762 0.650 0.546 0.1Las Vegas 2.669 2.435 2.639 1.862 1.317 (11.3)Long Island 1.915 1.800 1.757 1.522 1.450 (7.4)Los Angeles 2.142 2.378 2.646 2.328 1.772 2.8Memphis 0.739 0.946 0.890 0.676 0.562 (2.9)Miami 2.653 2.789 3.454 3.042 2.291 4.7Milwaukee 0.687 0.962 0.858 0.830 0.695 6.5Minneapolis 1.138 1.345 1.255 1.092 0.914 (1.3)Nashville 0.919 1.310 1.248 1.039 0.863 4.2New Haven 0.813 0.847 0.865 0.800 0.657 (0.6)
*Forecast
CAGR(2005 - 2008)

8/8/2019 HVS 2009 U.S. Hotel Valuation Index
http://slidepdf.com/reader/full/hvs-2009-us-hotel-valuation-index 29/50
HVS Global Hospitality Services 2009 United States Hotel Valuation Index
Page 28 of 49
Hotel Valuation Index – 2005 to 2009 (continued)
Market 2005 2006 2007 2008 2009*
New Orleans 1.694 1.412 0.850 1.026 0.730 (15.4) %New York 3.857 4.632 6.127 5.590 4.040 13.2Norfolk 0.780 0.809 0.786 0.473 0.408 (15.3)Oahu 4.190 4.318 4.014 3.391 2.641 (6.8)Oakland 0.950 1.225 1.261 1.006 0.947 1.9Omaha 0.751 1.021 0.931 0.864 0.635 4.8Orlando 1.446 1.540 1.392 1.141 0.784 (7.6)Philadelphia 1.247 1.458 1.417 1.191 0.913 (1.5)Phoenix 1.626 2.084 1.868 1.360 0.948 (5.8)Pittsburgh 0.705 1.078 1.033 1.150 1.069 17.7Portland 1.005 1.357 1.414 1.428 1.502 12.4Raleigh-Durham 0.714 0.993 0.993 0.824 0.661 4.9Richmond 0.854 0.992 1.023 0.792 0.635 (2.5)Rochester 0.622 0.944 0.939 0.796 0.632 8.6Sacramento 1.065 1.329 1.012 0.812 0.623 (8.6)Salt Lake City 1.178 1.564 1.526 1.378 1.419 5.4San Antonio 1.405 1.709 1.476 1.454 1.327 1.1San Diego 2.337 2.810 2.646 2.345 2.160 0.1San Francisco 2.484 2.930 3.479 3.639 2.925 13.6San Jose 1.077 1.604 1.725 1.562 1.444 13.2
Santa Fe 1.782 1.858 1.678 1.378 1.256 (8.2)Seattle 1.541 2.125 2.085 1.903 1.647 7.3St. Louis 0.687 0.772 0.776 0.668 0.643 (1.0)Stamford 1.159 1.326 1.267 0.906 0.699 (7.9)Syracuse 0.783 0.779 0.802 0.742 0.599 (1.8)Tallahassee 0.891 0.873 0.567 0.290 0.150 (31.2)Tampa 1.149 1.251 1.015 0.729 0.580 (14.0)Tucson 1.147 1.459 1.354 1.002 0.718 (4.4)United States 1.000 1.214 1.154 0.985 0.669 (0.5)Washington, D.C. 3.158 2.932 3.213 2.993 3.292 (1.8)Wilmington 0.913 1.141 1.137 0.835 0.653 (2.9)Winston-Salem 0.550 0.718 0.767 0.589 0.517 2.3WPB-Boca Raton 2.318 2.350 1.817 1.293 1.708 (17.7)
*Forecast
CAGR(2005 - 2008)

8/8/2019 HVS 2009 U.S. Hotel Valuation Index
http://slidepdf.com/reader/full/hvs-2009-us-hotel-valuation-index 30/50
HVS Global Hospitality Services 2009 United States Hotel Valuation Index
Page 29 of 49
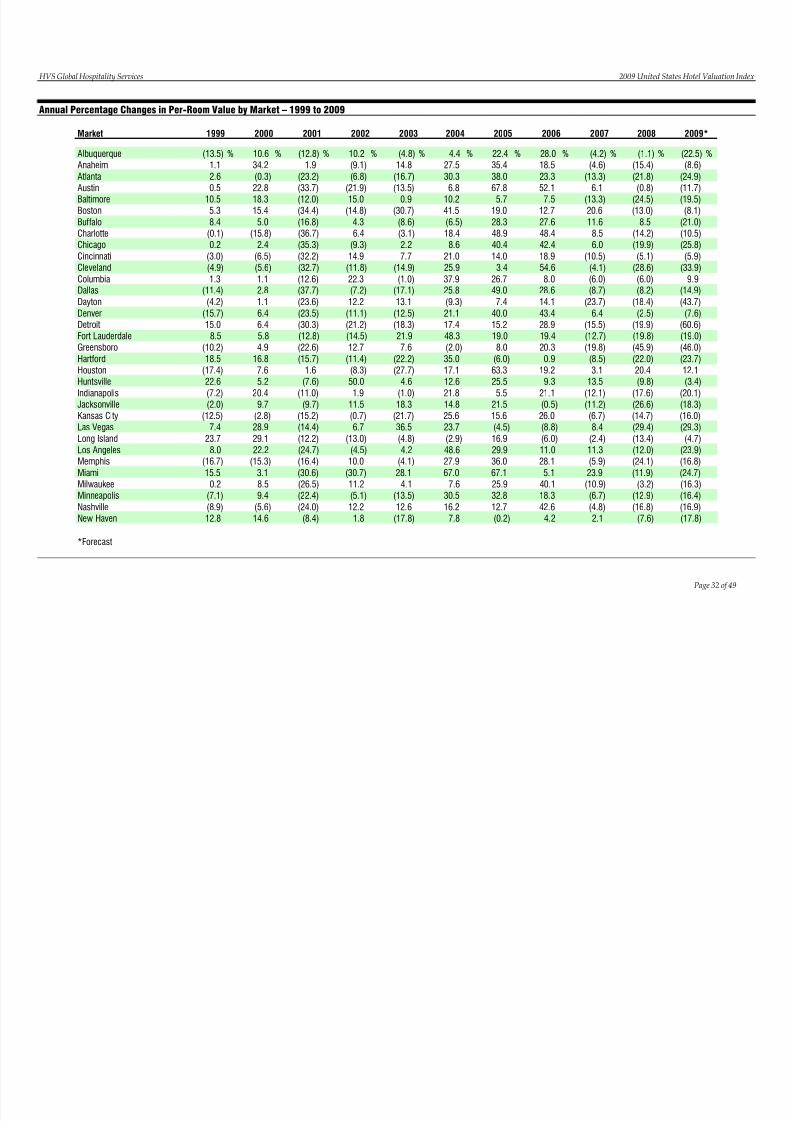
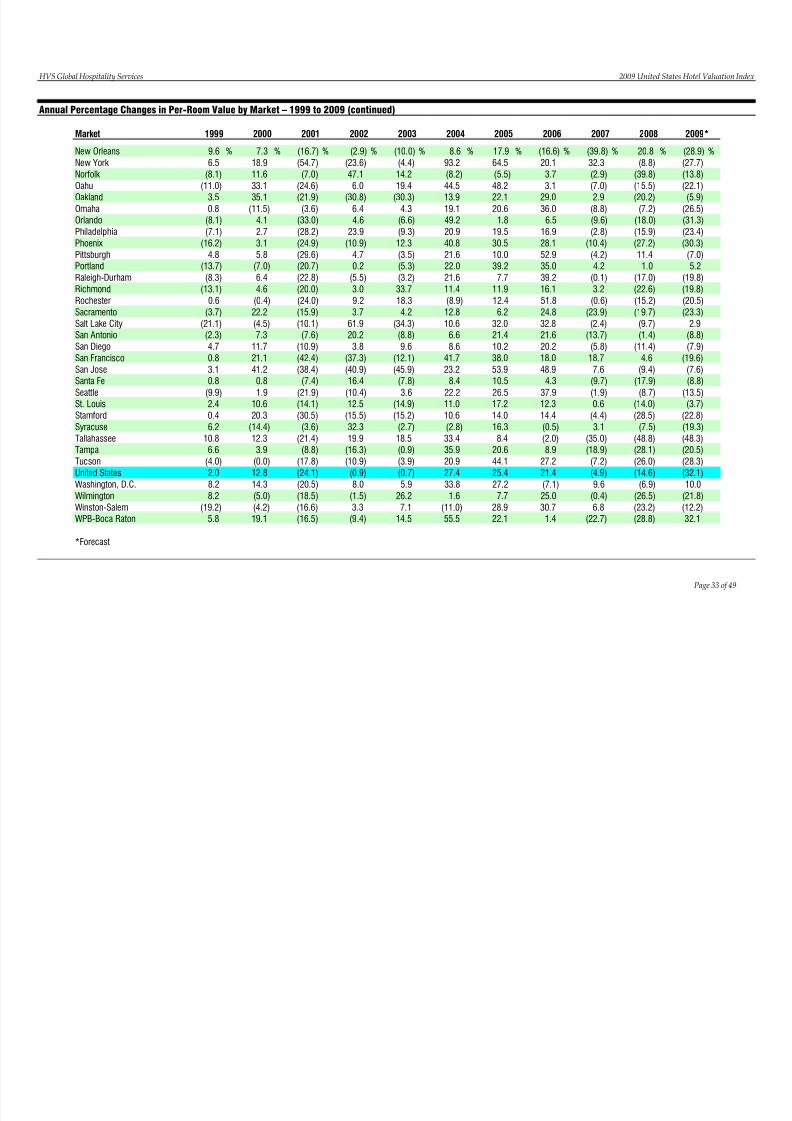
The tables on the following two pages exhibit per-room values for 65 HVImarkets and the United States as a whole for the past ten years, as well asforecasts for 2009. The subsequent table illustrates the annual percentagechange in per-room hotel values by market for the corresponding ten-yearperiod, as well as our forecasts for 2009.

8/8/2019 HVS 2009 U.S. Hotel Valuation Index
http://slidepdf.com/reader/full/hvs-2009-us-hotel-valuation-index 31/50
HVS Global Hospitality Services 2009 United States Hotel Valuation I
Page 30 of 49
Per-Room Value by Market – 1999 to 2009
Market 1999 2000 2001 2002 2003 2004 2005 2006 2007 2008 2009*
Albuquerque $34,974 $38,666 $33,735 $37,160 $35,387 $36,946 $45,217 $57,895 $55,461 $54,872 $42,515Anaheim $58,895 $79,057 $80,528 $73,193 $84,051 $107,174 $145,116 $171,974 $164,058 $138,716 $126,823Atlanta $83,663 $83,411 $64,091 $59,731 $49,752 $64,808 $89,429 $110,279 $95,560 $74,731 $56,147Austin $89,815 $110,318 $73,192 $57,187 $49,457 $52,819 $88,635 $134,823 $143,057 $141,977 $125,435Baltimore $102,961 $121,844 $107,204 $123,258 $124,368 $137,059 $144,893 $155,774 $135,025 $101,990 $82,131Boston $254,985 $294,185 $192,981 $164,351 $113,885 $161,193 $191,839 $216,143 $260,626 $226,624 $208,250Buffalo $47,885 $50,302 $41,850 $43,665 $39,900 $37,309 $47,858 $61,070 $68,133 $73,932 $58,414Charlotte $69,048 $58,159 $36,808 $39,166 $37,938 $44,908 $66,847 $99,180 $107,626 $92,348 $82,648Chicago $149,462 $153,012 $98,928 $89,773 $91,704 $99,635 $139,927 $199,281 $211,197 $169,090 $125,460Cincinnati $54,016 $50,524 $34,265 $39,381 $42,413 $51,302 $58,503 $69,540 $62,215 $59,059 $55,603Cleveland $60,738 $57,360 $38,590 $34,054 $28,980 $36,487 $37,727 $58,334 $55,960 $39,983 $26,448Columbia $40,756 $41,202 $36,028 $44,069 $43,618 $60,162 $76,212 $82,274 $77,356 $72,705 $79,907Dallas $90,504 $93,063 $58,014 $53,852 $44,623 $56,136 $83,651 $107,541 $98,141 $90,090 $76,647Dayton $39,482 $39,897 $30,502 $34,231 $38,720 $35,102 $37,700 $43,002 $32,818 $26,770 $15,064Denver $81,349 $86,532 $66,171 $58,795 $51,435 $62,292 $87,188 $125,017 $133,025 $129,677 $119,768Detroit $72,035 $76,612 $53,397 $42,076 $34,374 $40,352 $46,488 $59,938 $50,633 $40,581 $15,975Fort Lauderdale $82,473 $87,215 $76,048 $65,046 $79,308 $117,647 $139,944 $167,085 $145,824 $117,021 $94,821Greensboro $50,580 $53,068 $41,063 $46,266 $49,791 $48,776 $52,685 $63,405 $50,823 $27,500 $14,849Hartford $75,254 $87,904 $74,106 $65,624 $51,047 $68,931 $64,780 $65,363 $59,826 $46,658 $35,592Houston $63,417 $68,232 $69,332 $63,594 $45,977 $53,846 $87,937 $104,822 $108,054 $130,044 $145,800
Huntsville $24,595 $25,880 $23,924 $35,890 $37,544 $42,287 $53,089 $58,017 $65,874 $59,437 $57,426Indianapolis $53,743 $64,728 $57,629 $58,727 $58,126 $70,799 $74,703 $90,458 $79,549 $65,529 $52,351Jacksonville $66,634 $73,098 $65,977 $73,561 $87,015 $99,867 $121,379 $120,795 $107,255 $78,747 $64,342Kansas City $57,373 $55,743 $47,274 $46,964 $36,789 $46,203 $53,409 $67,311 $62,800 $53,562 $44,979Las Vegas $115,764 $149,201 $127,738 $136,322 $186,071 $230,238 $219,981 $200,721 $217,532 $153,473 $108,557Long Island $147,947 $191,030 $167,788 $145,998 $139,047 $135,026 $157,853 $148,326 $144,828 $125,434 $119,524Los Angeles $99,826 $121,974 $91,847 $87,693 $91,410 $135,858 $176,545 $195,953 $218,043 $191,842 $146,024Memphis $46,909 $39,724 $33,197 $36,501 $34,996 $44,765 $60,878 $77,954 $73,351 $55,678 $46,351Miami $123,183 $127,063 $88,231 $61,139 $78,334 $130,820 $218,624 $229,841 $284,700 $250,704 $188,815Milwaukee $45,254 $49,100 $36,079 $40,102 $41,753 $44,943 $56,598 $79,290 $70,682 $68,438 $57,281Minneapolis $77,736 $85,022 $65,974 $62,582 $54,126 $70,622 $93,768 $110,882 $103,412 $90,032 $75,307Nashville $63,904 $60,351 $45,854 $51,430 $57,887 $67,248 $75,762 $108,005 $102,855 $85,620 $71,124New Haven $70,977 $81,318 $74,449 $75,800 $62,308 $67,156 $67,045 $69,832 $71,321 $65,918 $54,182
*Forecast

8/8/2019 HVS 2009 U.S. Hotel Valuation Index
http://slidepdf.com/reader/full/hvs-2009-us-hotel-valuation-index 32/50
HVS Global Hospitality Services 2009 United States Hotel Valuation I
Page 31 of 49
Per-Room Value by Market – 1999-2009 (continued)
Market 1999 2000 2001 2002 2003 2004 2005 2006 2007 2008 2009*
New Orleans $139,498 $149,722 $124,788 $121,111 $109,029 $118,427 $139,591 $116,410 $70,038 $84,577 $60,144New York $254,070 $302,011 $136,874 $104,601 $100,000 $193,161 $317,846 $381,767 $504,943 $460,726 $333,002Norfolk $42,499 $47,422 $44,118 $64,909 $74,136 $68,034 $64,271 $66,653 $64,740 $38,986 $33,596Oahu $126,836 $168,841 $127,376 $135,058 $161,204 $232,954 $345,301 $355,840 $330,825 $279,498 $217,696Oakland $110,513 $149,283 $116,660 $80,774 $56,330 $64,150 $78,321 $101,001 $103,950 $82,923 $78,063Omaha $45,572 $40,327 $38,870 $41,338 $43,118 $51,336 $61,922 $84,184 $76,753 $71,200 $52,351Orlando $115,179 $119,916 $80,289 $83,957 $78,405 $117,011 $119,138 $126,905 $114,726 $94,039 $64,623Phi ladelphia $85,773 $88,046 $63,244 $78,333 $71,084 $85,965 $102,762 $120,178 $116,778 $98,184 $75,220Phoenix $94,231 $97,128 $72,902 $64,967 $72,971 $102,744 $134,047 $171,765 $153,951 $112,058 $78,096Pittsburgh $57,638 $61,009 $42,956 $44,971 $43,407 $52,797 $58,098 $88,808 $85,101 $94,766 $88,136Portland $69,717 $64,832 $51,382 $51,507 $48,790 $59,515 $82,845 $111,838 $116,575 $117,696 $123,803Raleigh-Durham $59,774 $63,609 $49,084 $46,393 $44,931 $54,618 $58,832 $81,869 $81,809 $67,932 $54,455Richmond $49,017 $51,268 $40,994 $42,230 $56,478 $62,938 $70,403 $81,727 $84,309 $65,273 $52,337Rochester $51,163 $50,981 $38,767 $42,342 $50,076 $45,607 $51,256 $77,818 $77,348 $65,600 $52,128Sacramento $65,960 $80,608 $67,773 $70,257 $73,228 $82,629 $87,785 $109,524 $83,371 $66,933 $51,333Salt Lake City $72,863 $69,557 $62,530 $101,248 $66,500 $73,574 $97,114 $128,926 $125,776 $113,574 $116,922San Antonio $82,448 $88,426 $81,668 $98,128 $89,526 $95,421 $115,818 $140,853 $121,609 $119,859 $109,362San Diego $142,154 $158,773 $141,489 $146,878 $160,983 $174,756 $192,600 $231,565 $218,105 $193,296 $178,008San Francisco $271,955 $329,386 $189,867 $118,992 $104,638 $148,312 $204,703 $241,497 $286,710 $299,916 $241,078San Jose $168,057 $237,280 $146,140 $86,433 $46,800 $57,670 $88,738 $132,156 $142,178 $128,772 $119,040
Santa Fe $122,233 $123,190 $114,109 $132,872 $122,540 $132,861 $146,826 $153,127 $138,278 $113,587 $103,553Seattle $111,159 $113,259 $88,435 $79,250 $82,118 $100,385 $127,015 $175,158 $171,832 $156,844 $135,704St. Louis $47,889 $52,942 $45,475 $51,170 $43,529 $48,326 $56,650 $63,603 $63,960 $55,030 $52,991Stamford $126,551 $152,190 $105,845 $89,388 $75,767 $83,799 $95,530 $109,262 $104,417 $74,636 $57,649Syracuse $53,668 $45,939 $44,276 $58,587 $57,017 $55,439 $64,491 $64,163 $66,123 $61,133 $49,343Tallahassee $40,443 $45,397 $35,696 $42,801 $50,733 $67,699 $73,419 $71,942 $46,748 $23,933 $12,368Tampa $73,473 $76,345 $69,662 $58,318 $57,775 $78,525 $94,663 $103,107 $83,652 $60,110 $47,778Tucson $77,139 $77,102 $63,357 $56,467 $54,271 $65,594 $94,524 $120,211 $111,589 $82,571 $59,195United States $61,250 $69,067 $52,434 $51,957 $51,585 $65,719 $82,416 $100,065 $95,117 $81,196 $55,132Washington, D.C. $147,180 $168,258 $133,717 $144,466 $153,036 $204,687 $260,263 $241,676 $264,839 $246,660 $271,326Wilmington $71,483 $67,930 $55,352 $54,517 $68,806 $69,890 $75,247 $94,036 $93,704 $68,845 $53,848Winston-Salem $44,663 $42,809 $35,723 $36,899 $39,504 $35,150 $45,306 $59,210 $63,213 $48,517 $42,585WPB-Boca Raton $97,628 $116,230 $97,068 $87,906 $100,625 $156,444 $191,032 $193,650 $149,733 $106,551 $140,792
*Forecast
8/8/2019 HVS 2009 U.S. Hotel Valuation Index
http://slidepdf.com/reader/full/hvs-2009-us-hotel-valuation-index 33/50
HVS Global Hospitality Services 2009 United States Hotel Valuation I
Page 32 of 49
Annual Percentage Changes in Per-Room Value by Market – 1999 to 2009
Market
Albuquerque (13.5) % 10.6 % (12.8) % 10.2 % (4.8) % 4.4 % 22.4 % 28.0 % (4.2) % (1.1) % (22.5) %Anaheim 1.1 34.2 1.9 (9.1) 14.8 27.5 35.4 18.5 (4.6) (15.4) (8.6)Atlanta 2.6 (0.3) (23.2) (6.8) (16.7) 30.3 38.0 23.3 (13.3) (21.8) (24.9)Austin 0.5 22.8 (33.7) (21.9) (13.5) 6.8 67.8 52.1 6.1 (0.8) (11.7)Baltimore 10.5 18.3 (12.0) 15.0 0.9 10.2 5.7 7.5 (13.3) (24.5) (19.5)Boston 5.3 15.4 (34.4) (14.8) (30.7) 41.5 19.0 12.7 20.6 (13.0) (8.1)Buffalo 8.4 5.0 (16.8) 4.3 (8.6) (6.5) 28.3 27.6 11.6 8.5 (21.0)Charlotte (0.1) (15.8) (36.7) 6.4 (3.1) 18.4 48.9 48.4 8.5 (14.2) (10.5)Chicago 0.2 2.4 (35.3) (9.3) 2.2 8.6 40.4 42.4 6.0 (19.9) (25.8)Cincinnati (3.0) (6.5) (32.2) 14.9 7.7 21.0 14.0 18.9 (10.5) (5.1) (5.9)Cleveland (4.9) (5.6) (32.7) (11.8) (14.9) 25.9 3.4 54.6 (4.1) (28.6) (33.9)Columbia 1.3 1.1 (12.6) 22.3 (1.0) 37.9 26.7 8.0 (6.0) (6.0) 9.9Dallas (11.4) 2.8 (37.7) (7.2) (17.1) 25.8 49.0 28.6 (8.7) (8.2) (14.9)Dayton (4.2) 1.1 (23.6) 12.2 13.1 (9.3) 7.4 14.1 (23.7) (18.4) (43.7)Denver (15.7) 6.4 (23.5) (11.1) (12.5) 21.1 40.0 43.4 6.4 (2.5) (7.6)Detroit 15.0 6.4 (30.3) (21.2) (18.3) 17.4 15.2 28.9 (15.5) (19.9) (60.6)Fort Lauderdale 8.5 5.8 (12.8) (14.5) 21.9 48.3 19.0 19.4 (12.7) (19.8) (19.0)Greensboro (10.2) 4.9 (22.6) 12.7 7.6 (2.0) 8.0 20.3 (19.8) (45.9) (46.0)Hartford 18.5 16.8 (15.7) (11.4) (22.2) 35.0 (6.0) 0.9 (8.5) (22.0) (23.7)Houston (17.4) 7.6 1.6 (8.3) (27.7) 17.1 63.3 19.2 3.1 20.4 12.1Huntsville 22.6 5.2 (7.6) 50.0 4.6 12.6 25.5 9.3 13.5 (9.8) (3.4)Indianapolis (7.2) 20.4 (11.0) 1.9 (1.0) 21.8 5.5 21.1 (12.1) (17.6) (20.1)Jacksonville (2.0) 9.7 (9.7) 11.5 18.3 14.8 21.5 (0.5) (11.2) (26.6) (18.3)Kansas City (12.5) (2.8) (15.2) (0.7) (21.7) 25.6 15.6 26.0 (6.7) (14.7) (16.0)Las Vegas 7.4 28.9 (14.4) 6.7 36.5 23.7 (4.5) (8.8) 8.4 (29.4) (29.3)Long Island 23.7 29.1 (12.2) (13.0) (4.8) (2.9) 16.9 (6.0) (2.4) (13.4) (4.7)Los Angeles 8.0 22.2 (24.7) (4.5) 4.2 48.6 29.9 11.0 11.3 (12.0) (23.9)Memphis (16.7) (15.3) (16.4) 10.0 (4.1) 27.9 36.0 28.1 (5.9) (24.1) (16.8)Miami 15.5 3.1 (30.6) (30.7) 28.1 67.0 67.1 5.1 23.9 (11.9) (24.7)Milwaukee 0.2 8.5 (26.5) 11.2 4.1 7.6 25.9 40.1 (10.9) (3.2) (16.3)Minneapolis (7.1) 9.4 (22.4) (5.1) (13.5) 30.5 32.8 18.3 (6.7) (12.9) (16.4)Nashville (8.9) (5.6) (24.0) 12.2 12.6 16.2 12.7 42.6 (4.8) (16.8) (16.9)New Haven 12.8 14.6 (8.4) 1.8 (17.8) 7.8 (0.2) 4.2 2.1 (7.6) (17.8)
*Forecast
1999 2000 2001 2002 2003 2009*20082005 2006 20072004
8/8/2019 HVS 2009 U.S. Hotel Valuation Index
http://slidepdf.com/reader/full/hvs-2009-us-hotel-valuation-index 34/50
HVS Global Hospitality Services 2009 United States Hotel Valuation I
Page 33 of 49
Annual Percentage Changes in Per-Room Value by Market – 1999 to 2009 (continued)
Market
New Orleans 9.6 % 7.3 % (16.7) % (2.9) % (10.0) % 8.6 % 17.9 % (16.6) % (39.8) % 20.8 % (28.9) %New York 6.5 18.9 (54.7) (23.6) (4.4) 93.2 64.5 20.1 32.3 (8.8) (27.7)Norfolk (8.1) 11.6 (7.0) 47.1 14.2 (8.2) (5.5) 3.7 (2.9) (39.8) (13.8)Oahu (11.0) 33.1 (24.6) 6.0 19.4 44.5 48.2 3.1 (7.0) (15.5) (22.1)Oakland 3.5 35.1 (21.9) (30.8) (30.3) 13.9 22.1 29.0 2.9 (20.2) (5.9)Omaha 0.8 (11.5) (3.6) 6.4 4.3 19.1 20.6 36.0 (8.8) (7.2) (26.5)Orlando (8.1) 4.1 (33.0) 4.6 (6.6) 49.2 1.8 6.5 (9.6) (18.0) (31.3)Philadelphia (7.1) 2.7 (28.2) 23.9 (9.3) 20.9 19.5 16.9 (2.8) (15.9) (23.4)Phoenix (16.2) 3.1 (24.9) (10.9) 12.3 40.8 30.5 28.1 (10.4) (27.2) (30.3)Pittsburgh 4.8 5.8 (29.6) 4.7 (3.5) 21.6 10.0 52.9 (4.2) 11.4 (7.0)Portland (13.7) (7.0) (20.7) 0.2 (5.3) 22.0 39.2 35.0 4.2 1.0 5.2Raleigh-Durham (8.3) 6.4 (22.8) (5.5) (3.2) 21.6 7.7 39.2 (0.1) (17.0) (19.8)Richmond (13.1) 4.6 (20.0) 3.0 33.7 11.4 11.9 16.1 3.2 (22.6) (19.8)Rochester 0.6 (0.4) (24.0) 9.2 18.3 (8.9) 12.4 51.8 (0.6) (15.2) (20.5)Sacramento (3.7) 22.2 (15.9) 3.7 4.2 12.8 6.2 24.8 (23.9) (19.7) (23.3)Salt Lake City (21.1) (4.5) (10.1) 61.9 (34.3) 10.6 32.0 32.8 (2.4) (9.7) 2.9San Antonio (2.3) 7.3 (7.6) 20.2 (8.8) 6.6 21.4 21.6 (13.7) (1.4) (8.8)San Diego 4.7 11.7 (10.9) 3.8 9.6 8.6 10.2 20.2 (5.8) (11.4) (7.9)San Francisco 0.8 21.1 (42.4) (37.3) (12.1) 41.7 38.0 18.0 18.7 4.6 (19.6)San Jose 3.1 41.2 (38.4) (40.9) (45.9) 23.2 53.9 48.9 7.6 (9.4) (7.6)Santa Fe 0.8 0.8 (7.4) 16.4 (7.8) 8.4 10.5 4.3 (9.7) (17.9) (8.8)Seattle (9.9) 1.9 (21.9) (10.4) 3.6 22.2 26.5 37.9 (1.9) (8.7) (13.5)St. Louis 2.4 10.6 (14.1) 12.5 (14.9) 11.0 17.2 12.3 0.6 (14.0) (3.7)Stamford 0.4 20.3 (30.5) (15.5) (15.2) 10.6 14.0 14.4 (4.4) (28.5) (22.8)Syracuse 6.2 (14.4) (3.6) 32.3 (2.7) (2.8) 16.3 (0.5) 3.1 (7.5) (19.3)Tallahassee 10.8 12.3 (21.4) 19.9 18.5 33.4 8.4 (2.0) (35.0) (48.8) (48.3)Tampa 6.6 3.9 (8.8) (16.3) (0.9) 35.9 20.6 8.9 (18.9) (28.1) (20.5)Tucson (4.0) (0.0) (17.8) (10.9) (3.9) 20.9 44.1 27.2 (7.2) (26.0) (28.3)United States 2.0 12.8 (24.1) (0.9) (0.7) 27.4 25.4 21.4 (4.9) (14.6) (32.1)Washington, D.C. 8.2 14.3 (20.5) 8.0 5.9 33.8 27.2 (7.1) 9.6 (6.9) 10.0Wilmington 8.2 (5.0) (18.5) (1.5) 26.2 1.6 7.7 25.0 (0.4) (26.5) (21.8)Winston-Salem (19.2) (4.2) (16.6) 3.3 7.1 (11.0) 28.9 30.7 6.8 (23.2) (12.2)WPB-Boca Raton 5.8 19.1 (16.5) (9.4) 14.5 55.5 22.1 1.4 (22.7) (28.8) 32.1
*Forecast
20051999 2000 2001 2002 2003 2004 2006 2007 2008 2009*

8/8/2019 HVS 2009 U.S. Hotel Valuation Index
http://slidepdf.com/reader/full/hvs-2009-us-hotel-valuation-index 35/50
HVS Global Hospitality Services 2009 United States Hotel Valuation Index
Page 34 of 49
The following table presents the 65 markets and the United States as a whole,ranked in terms of their 2008 HVI. Each market’s per-room value change as both a dollar amount and a percentage change from 2007 are also provided.Following the presentation of this data are pertinent observations for themarkets included in the HVI.
Percentage Change in Per-Room Values in 2008
HVI HVIMarket Index Market Index
1 New York 5.590 460,726 (8.8)% 34 Oakland 1.006 $82,923 (20.2)%2 San Francisco 3.639 299,916 4.6 35 Tucson 1.002 82,571 (26.0)3 Oahu 3.391 279,498 (15.5) 36 United States 0.985 81,196 (14.6)4 Miami 3.042 250,704 (11.9) 37 Jacksonville 0.955 78,747 (26.6)5 Washington, D.C. 2.993 246,660 (6.9) 38 Atlanta 0.907 74,731 (21.86 Boston 2.750 226,624 (13.0) 39 Stamford 0.906 74,636 (28.5)7 San Diego 2.345 193,296 (11.4) 40 Buffalo 0.897 73,932 8.58 Los Angeles 2.328 191,842 (12.0) 41 Columbia 0.882 72,705 (6.0)9 Chicago 2.052 169,090 (19.9) 42 Omaha 0.864 71,200 (7.2)10 Seattle 1.903 156,844 (8.7) 43 Wilmington 0.835 68,845 (26.5)11 Las Vegas 1.862 153,473 (29.4) 44 Milwaukee 0.830 68,438 (3.2)12 Austin 1.723 141,977 (0.8) 45 Raleigh-Durham 0.824 67,932 (17.013 Anaheim 1.683 138,716 (15.4) 46 Sacramento 0.812 66,933 (19.7)14 Houston 1.578 130,044 20.4 47 New Haven 0.800 65,918 (7.6)15 Denver 1.573 129,677 (2.5) 48 Rochester 0.796 65,600 (15.2)16 San Jose 1.562 128,772 (9.4) 49 Indianapolis 0.795 65,529 (17.6)17 Long Island 1.522 125,434 (13.4) 50 Richmond 0.792 65,273 (22.618 San Antonio 1.454 119,859 (1.4) 51 Syracuse 0.742 61,133 (7.5)19 Portland 1.428 117,696 1.0 52 Tampa 0.729 60,110 (28.1)20 Fort Lauderdale 1.420 117,021 (19.8) 53 Huntsville 0.721 59,437 (9.821 Santa Fe 1.378 113,587 (17.9) 54 Cincinnati 0.717 59,059 (5.1)22 Salt Lake City 1.378 113,574 (9.7) 55 Memphis 0.676 55,678 (24.123 Phoenix 1.360 112,058 (27.2) 56 St. Louis 0.668 55,030 (14.0)24 WPB-Boca Raton 1.293 106,551 (28.8) 57 Albuquerque 0.666 54,872 (1.25 Baltimore 1.237 101,990 (24.5) 58 Kansas City 0.650 53,562 (14.726 Philadelphia 1.191 98,184 (15.9) 59 Winston-Salem 0.589 48,517 (23.227 Pittsburgh 1.150 94,766 11.4 60 Hartford 0.566 46,658 (22.0)28 Orlando 1.141 94,039 (18.0) 61 Detroit 0.492 40,581 (19.9)29 Charlotte 1.121 92,348 (14.2) 62 Cleveland 0.485 39,983 (28.6)30 Dallas 1.093 90,090 (8.2) 63 Norfolk 0.473 38,986 (39.8)31 Minneapolis 1.092 90,032 (12.9) 64 Greensboro 0.334 27,500 (45.932 Nashville 1.039 85,620 (16.8) 65 Dayton 0.325 26,770 (18.4)33 New Orleans 1.026 84,577 20.8 66 Tallahassee 0.290 23,933 (48.8)
% ChangeFrom 2007
Per-Room Per-RoomValue Value
% ChangeFrom 2007

8/8/2019 HVS 2009 U.S. Hotel Valuation Index
http://slidepdf.com/reader/full/hvs-2009-us-hotel-valuation-index 36/50
HVS Global Hospitality Services 2009 United States Hotel Valuation Index
Page 35 of 49
THE TOP TEN MARKETS (in terms of HVI)
Historical and Projected New York Per-Room Hotel Values
2005 2006 2007 2008 2009 2010 2011 2012 2013
New York $317,846 $381,767 $504,943 $460,726 $333,002 $304,030 $324,096 $397,018 $474,83464.5% 20.1% 32.3% -8.8% -27.7% -8.7% 6.6% 22.5% 19.6%
New York, New York, has historically remained one of the top-ranked cities interms of per-room value in the United States. In addition to its status as thefinancial capital of the United States, the city also benefits from a plethora of leisure attractions. The market’s response to downturns has been historicallytypified by dramatic decreases and equally dramatic recoveries. Moreover,New York has historically benefited from very strong underlying demandfundamentals and a relatively limited room supply. However, New York incurred a significant influx of new supply in 2008, with a sizable portion stillto come through 2010. Considering the latter, coupled with the impact of thedeepening recession, New York is anticipated to illustrate a continuouslydownward trend through 2010. Thereafter, per-room value is expected toprogressively recover, matching its 2007 peak in 2014.
Historical and Projected San Francisco Per-Room Hotel Values
2005 2006 2007 2008 2009 2010 2011 2012 2013
San Francisco $204,703 $241,497 $286,710 $299,916 $241,078 $265,540 $259,519 $301,416 $367,86538.0% 18.0% 18.7% 4.6% -19.6% 10.1% -2.3% 16.1% 22.0%
San Francisco, California, has weathered the recession storm relatively well,in comparison with other California markets. While San Francisco was one of the few markets to post a per-room value increase in 2008, per-room value is
projected to decline notably in 2009. Value is then expected to partiallyrecover in 2010, due in part to an extremely limited amount of new supply.The city benefits from a diversified economy based on high technology,financial services, and tourism. Since 2004, when the national economyrecovered from the last downturn, San Francisco has posted strong increasesin marketwide demand and average rate year-over-year, up until the end of 2008.

8/8/2019 HVS 2009 U.S. Hotel Valuation Index
http://slidepdf.com/reader/full/hvs-2009-us-hotel-valuation-index 37/50
HVS Global Hospitality Services 2009 United States Hotel Valuation Index
Page 36 of 49
Historical and Projected Oahu Per-Room Hotel Values
2005 2006 2007 2008 2009 2010 2011 2012 2013
Oahu $345,301 $355,840 $330,825 $279,498 $217,696 $211,366 $238,248 $273,626 $334,20048.2% 3.1% -7.0% -15.5% -22.1% -2.9% 12.7% 14.8% 22.1%
Oahu, Hawaii, was the subject of much unwanted press in 2008, due tosubstantial declines in tourism and visitation stemming from reduceddiscretionary spending in major American markets. Per-room values declined by 15.5% in 2008; a more drastic decline is forecast for 2009. Considering itsstrong demand fundamentals and lack of new supply in the pipeline, Oahu’sper-room values are forecast to recover beginning in 2011.
Historical and Projected Miami Per-Room Hotel Values
2005 2006 2007 2008 2009 2010 2011 2012 2013
Miami $218,624 $229,841 $284,700 $250,704 $188,815 $189,122 $214,150 $246,318 $313,12467.1% 5.1% 23.9% -11.9% -24.7% 0.2% 13.2% 15.0% 27.1%
In 2007, per-room values in Miami, Florida, increased by nearly 24% incomparison to 2006 levels. Following this notable increase, per-room valuesdeclined by nearly 12% in 2008, due to faltering demand levels and increasesin supply. According to Smith Travel Research, approximately 20 projects arecurrently under construction in the market, with a total of roughly 2,000 hotelrooms. This increase in supply, combined with weakened leisure tourism, isprojected to cause per-room values to decline by nearly 25% in 2009.
Historical and Projected Washington, D.C., Per-Room Hotel Values
2005 2006 2007 2008 2009 2010 2011 2012 2013
Washington, D.C. $260,263 $241,676 $264,839 $246,660 $271,326 $312,024 $355,708 $401,950 $450,18427.2% -7.1% 9.6% -6.9% 10.0% 15.0% 14.0% 13.0% 12.0%
The federal government serves as the catalyst for all the economic activity inthe greater Washington, D.C., area, including the operations of hundreds of private-sector firms, associations, trade unions, lawyers, defense companies,political groups, and international organizations. The U.S. government is the

8/8/2019 HVS 2009 U.S. Hotel Valuation Index
http://slidepdf.com/reader/full/hvs-2009-us-hotel-valuation-index 38/50
HVS Global Hospitality Services 2009 United States Hotel Valuation Index
Page 37 of 49
area's largest employer in terms of direct employees, and through contracts,research grants, and partnerships, it is the largest indirect employer as well.Since the federal government has continually committed itself to enlarge itspresence in order to revitalize the national economy, the D.C. market has been less impacted by the ongoing recession than other major markets in theUnited States. Based on such considerations, coupled with the demandinduced due to the January 2009 presidential inauguration, per-room valuefor this market is expected to rebound strongly in 2009. Going forward, thismarket is expected to continue to benefit from the presence of strong government demand levels, and its consequent impact on locally basedcompanies.
Historical and Projected Boston Per-Room Hotel Values
2005 2006 2007 2008 2009 2010 2011 2012 2013
Boston $191,839 $216,143 $260,626 $226,624 $208,250 $216,834 $254,659 $295,447 $375,12119.0% 12.7% 20.6% -13.0% -8.1% 4.1% 17.4% 16.0% 27.0%
Boston, Massachusetts, is known as New England’s economic hub,attributable to its diverse economy relating to the financial, educational, and
biotechnology sectors. As one of the nation’s oldest cities, Boston also benefitsfrom a healthy tourism industry. Considering the impact of the nationalrecession, per-room value illustrated a decline in 2008, and this trend isexpected to continue through 2009. However, with limited new supplyanticipated for the near term coupled with a strong demand base, per-roomvalue is expected to rebound in 2010, progressively recovering to surpass its2007 peak in 2012.
Historical and Projected San Diego Per-Room Hotel Values
2005 2006 2007 2008 2009 2010 2011 2012 2013
San Diego $192,600 $231,565 $218,105 $193,296 $178,008 $185,855 $209,191 $240,866 $288,74110.2% 20.2% -5.8% -11.4% -7.9% 4.4% 12.6% 15.1% 19.9%
San Diego, California, has experienced moderate declines in per-room valuessince 2007; this trend is forecast to continue into 2009. While the city benefitsfrom a diverse economy that includes a significant presence from the military, biotechnology corporate firms, and a convention market, a notable amount of

8/8/2019 HVS 2009 U.S. Hotel Valuation Index
http://slidepdf.com/reader/full/hvs-2009-us-hotel-valuation-index 39/50
HVS Global Hospitality Services 2009 United States Hotel Valuation Index
Page 38 of 49
new supply entered the market in the past 18 months. The city is poised torecover before most other markets, returning to peak levels achieved in 2006 by 2012.
Historical and Projected Los Angeles Per-Room Hotel Values
2005 2006 2007 2008 2009 2010 2011 2012 2013
Los Angeles $176,545 $195,953 $218,043 $191,842 $146,024 $136,813 $154,735 $182,769 $234,02629.9% 11.0% 11.3% -12.0% -23.9% -6.3% 13.1% 18.1% 28.0%
Following a 12% decrease in 2008, per-room values in Los Angeles, California, are projected to continue to decline into 2010. Los Angeles has been plagued by growing unemployment levels, and the area economy has experiencednotable retraction. Tourism levels have also declined, both domestically andinternationally, which has impacted hotel demand levels. The year 2010 isprojected to be the low point in per-room values for Los Angeles. Values areexpected to surpass the 2007 level by 2013.
Historical and Projected Chicago Per-Room Hotel Values
2005 2006 2007 2008 2009 2010 2011 2012 2013
Chicago $139,927 $199,281 $211,197 $169,090 $125,460 $119,036 $141,962 $172,014 $212,63940.4% 42.4% 6.0% -19.9% -25.8% -5.1% 19.3% 21.2% 23.6%
Chicago, Illinois, experienced a notable decline in per-room values in 2008.The Chicago area has been greatly impacted by the financial crisis, with area banking institutions implementing significant layoffs. Prevailing economictrends will continue to suppress hotel values into 2009 and 2010.Furthermore, a notable amount of new supply is slated for the greaterChicago area, which will delay the recovery of demand. Hotel values in
Chicago are forecast to achieve the peak levels recorded in 2007 by 2013.
Historical and Projected Seattle Per-Room Hotel Values
2005 2006 2007 2008 2009 2010 2011 2012 2013
Seattle $127,015 $175,158 $171,832 $156,844 $135,704 $134,974 $169,259 $201,069 $247,79526.5% 37.9% -1.9% -8.7% -13.5% -0.5% 25.4% 18.8% 23.2%

8/8/2019 HVS 2009 U.S. Hotel Valuation Index
http://slidepdf.com/reader/full/hvs-2009-us-hotel-valuation-index 40/50
HVS Global Hospitality Services 2009 United States Hotel Valuation Index
Page 39 of 49
Seattle, Washington, benefits from its diverse economic base, with such majorcompanies as Starbucks, Nordstrom, and Microsoft headquartered in thearea. As a result of the impact of the national recession, this market’s per-room value posted a decline in 2008, and this trend is expected to continuethrough 2009. However, considering the city’s relatively strong demand base,per-room value is expected to recover fully and surpass its 2006 peak in 2012.
Remaining HVI Markets
The following tables present historical and projected per-room values for the
remaining 55 HVI markets.

8/8/2019 HVS 2009 U.S. Hotel Valuation Index
http://slidepdf.com/reader/full/hvs-2009-us-hotel-valuation-index 41/50

8/8/2019 HVS 2009 U.S. Hotel Valuation Index
http://slidepdf.com/reader/full/hvs-2009-us-hotel-valuation-index 42/50
HVS Global Hospitality Services 2009 United States Hotel Valuation I
Page 41 of 49
Remaining HVI Markets (continued)
2005 2006 2007 2008 2009 2010 2011 2012 2013
Denver $87,188 $125,017 $133,025 $129,677 $119,768 $125,213 $153,475 $177,679 $213,511 14.140.0% 43.4% 6.4% -2.5% -7.6% 4.5% 22.6% 15.8% 20.2%
Detroit $46,488 $59,938 $50,633 $40,581 $15,975 $5,431 $5,157 $13,438 $27,496 (4.4)15.2% 28.9% -15.5% -19.9% -60.6% -66.0% -5.0% 160.6% 104.6%
Fort Lauderdale $139,944 $167,085 $145,824 $117,021 $94,821 $85,105 $100,419 $122,636 $158,441 (5.8)19.0% 19.4% -12.7% -19.8% -19.0% -10.2% 18.0% 22.1% 29.2%
Greensboro $52,685 $63,405 $50,823 $27,500 $14,849 $530 $4,779 $15,274 $33,150 (19.5)8.0% 20.3% -19.8% -45.9% -46.0% -96.4% 802.4% 219.6% 117.0%
Hartford $64,780 $65,363 $59,826 $46,658 $35,592 $23,705 $30,465 $42,222 $62,754 (10.4)-6.0% 0.9% -8.5% -22.0% -23.7% -33.4% 28.5% 38.6% 48.6%
Houston $87,937 $104,822 $108,054 $130,044 $145,800 $160,371 $189,917 $211,961 $245,839 13.963.3% 19.2% 3.1% 20.4% 12.1% 10.0% 18.4% 11.6% 16.0%
Huntsville $53,089 $58,017 $65,874 $59,437 $57,426 $56,771 $72,270 $88,563 $109,936 3.825.5% 9.3% 13.5% -9.8% -3.4% -1.1% 27.3% 22.5% 24.1%
Indianapolis $74,703 $90,458 $79,549 $65,529 $52,351 $43,510 $51,118 $60,266 $76,648 (4.3)5.5% 21.1% -12.1% -17.6% -20.1% -16.9% 17.5% 17.9% 27.2%
Jacksonville $121,379 $120,795 $107,255 $78,747 $64,342 $58,108 $70,251 $81,801 $101,893 (13.4)21.5% -0.5% -11.2% -26.6% -18.3% -9.7% 20.9% 16.4% 24.6%
Kansas City $53,409 $67,311 $62,800 $53,562 $44,979 $36,311 $44,515 $55,356 $72,297 0.115.6% 26.0% -6.7% -14.7% -16.0% -19.3% 22.6% 24.4% 30.6%
Las Vegas $219,981 $200,721 $217,532 $153,473 $108,557 $86,677 $72,584 $71,921 $97,920 (11.3)-4.5% -8.8% 8.4% -29.4% -29.3% -20.2% -16.3% -0.9% 36.1%
Long Island $157,853 $148,326 $144,828 $125,434 $119,524 $108,187 $130,494 $153,469 $184,590 (7.4)16.9% -6.0% -2.4% -13.4% -4.7% -9.5% 20.6% 17.6% 20.3%
CAGR(2005 - 2013)

8/8/2019 HVS 2009 U.S. Hotel Valuation Index
http://slidepdf.com/reader/full/hvs-2009-us-hotel-valuation-index 43/50
HVS Global Hospitality Services 2009 United States Hotel Valuation I
Page 42 of 49
Remaining HVI Markets (continued)
2005 2006 2007 2008 2009 2010 2011 2012 2013
Memphis $60,878 $77,954 $73,351 $55,678 $46,351 $41,672 $53,183 $66,842 $88,328 (2.9)36.0% 28.1% -5.9% -24.1% -16.8% -10.1% 27.6% 25.7% 32.1%
Milwaukee $56,598 $79,290 $70,682 $68,438 $57,281 $53,101 $66,860 $80,473 $96,861 6.525.9% 40.1% -10.9% -3.2% -16.3% -7.3% 25.9% 20.4% 20.4%
Minneapolis $93,768 $110,882 $103 ,412 $90,032 $75,307 $81,155 $100,499 $122,082 $152,525 (1.3)32.8% 18.3% -6.7% -12.9% -16.4% 7.8% 23.8% 21.5% 24.9%
Nashville $75,762 $108,005 $102,855 $85,620 $71,124 $68,872 $87,986 $106,353 $132,631 4.212.7% 42.6% -4.8% -16.8% -16.9% -3.2% 27.8% 20.9% 24.7%
New Haven $67,045 $69,832 $71,321 $65,918 $54,182 $47,947 $59,388 $72,640 $94,206 (0.6)-0.2% 4.2% 2.1% -7.6% -17.8% -11.5% 23.9% 22.3% 29.7%
New Orleans $139,591 $116,410 $70 ,038 $84,577 $60,144 $51,144 $69,190 $91,985 $127,253 (15.4) %17.9% -16.6% -39.8% 20.8% -28.9% -15.0% 35.3% 32.9% 38.3%
Norfolk $64,271 $66,653 $64,740 $38,986 $33,596 $31,251 $36,931 $45,903 $62,371 (15.3)-5.5% 3.7% -2.9% -39.8% -13.8% -7.0% 18.2% 24.3% 35.9%
Oakland $78,321 $101,001 $103,950 $82,923 $78,063 $78,347 $94,676 $110,744 $136,453 1.922.1% 29.0% 2.9% -20.2% -5.9% 0.4% 20.8% 17.0% 23.2%
Omaha $61,922 $84,184 $76,753 $71,200 $52,351 $43,107 $55,011 $70,639 $94,751 4.820.6% 36.0% -8.8% -7.2% -26.5% -17.7% 27.6% 28.4% 34.1%
Orlando $119,138 $126,905 $114,726 $94,039 $64,623 $54,095 $68,136 $85,483 $113,692 (7.6)1.8% 6.5% -9.6% -18.0% -31.3% -16.3% 26.0% 25.5% 33.0%
Philadelphia $102,762 $120,178 $116 ,778 $98,184 $75,220 $67,461 $81,740 $101,504 $133,731 (1.5)19.5% 16.9% -2.8% -15.9% -23.4% -10.3% 21.2% 24.2% 31.7%
Phoenix $134,047 $171,765 $153,951 $112,058 $78,096 $61,523 $82,637 $107,935 $146,296 (5.8)30.5% 28.1% -10.4% -27.2% -30.3% -21.2% 34.3% 30.6% 35.5%
CAGR(2005 - 2013)

8/8/2019 HVS 2009 U.S. Hotel Valuation Index
http://slidepdf.com/reader/full/hvs-2009-us-hotel-valuation-index 44/50
HVS Global Hospitality Services 2009 United States Hotel Valuation I
Page 43 of 49
Remaining HVI Markets (continued)
2005 2006 2007 2008 2009 2010 2011 2012 2013
Pi ttsburgh $58,098 $88,808 $85,101 $94,766 $88,136 $89,770 $109,047 $124,651 $149,143 17.710.0% 52.9% -4.2% 11.4% -7.0% 1.9% 21.5% 14.3% 19.6%
Portland $82,845 $111,838 $116,575 $117,696 $123,803 $131,481 $152,231 $167,375 $192,548 12.439.2% 35.0% 4.2% 1.0% 5.2% 6.2% 15.8% 9.9% 15.0%
Raleigh-Durham $58,832 $81,869 $81,809 $67,932 $54,455 $45,687 $56,696 $69,538 $90,607 4.97.7% 39.2% -0.1% -17.0% -19.8% -16.1% 24.1% 22.7% 30.3%
Richmond $70,403 $81,727 $84,309 $65,273 $52,337 $47,402 $58,167 $69,858 $90,391 (2.5)11.9% 16.1% 3.2% -22.6% -19.8% -9.4% 22.7% 20.1% 29.4%
Rochester $51,256 $77,818 $77,348 $65,600 $52,128 $43,119 $55,615 $70,784 $94,685 8.612.4% 51.8% -0.6% -15.2% -20.5% -17.3% 29.0% 27.3% 33.8%
Sacramento $87,785 $109,524 $83,371 $66,933 $51,333 $41,194 $54,219 $68,995 $89,100 (8.6)6.2% 24.8% -23.9% -19.7% -23.3% -19.8% 31.6% 27.3% 29.1%
Salt Lake City $97,114 $128,926 $125,776 $113,574 $116,922 $119,496 $134,590 $152,364 $179,979 5.432.0% 32.8% -2.4% -9.7% 2.9% 2.2% 12.6% 13.2% 18.1%
San Antonio $115,818 $140,853 $121,609 $119,859 $109,362 $99,292 $109,566 $127,254 $155,233 1.121.4% 21.6% -13.7% -1.4% -8.8% -9.2% 10.3% 16.1% 22.0%
San Jose $88,738 $132,156 $142,178 $128,772 $119,040 $119,276 $148,224 $175,684 $216,924 13.253.9% 48.9% 7.6% -9.4% -7.6% 0.2% 24.3% 18.5% 23.5%
Santa Fe $146,826 $153,127 $138,278 $113,587 $103,553 $91,691 $110,760 $130,841 $161,800 (8.2)10.5% 4.3% -9.7% -17.9% -8.8% -11.5% 20.8% 18.1% 23.7%
St. Louis $56,650 $63,603 $63,960 $55,030 $52,991 $52,545 $64,883 $78,865 $101,476 (1.0)17.2% 12.3% 0.6% -14.0% -3.7% -0.8% 23.5% 21.5% 28.7%
Stamford $95,530 $109,262 $104,417 $74,636 $57,649 $46,403 $61,478 $76,665 $97,897 (7.9)14.0% 14.4% -4.4% -28.5% -22.8% -19.5% 32.5% 24.7% 27.7%
CAGR(2005 - 2013)

8/8/2019 HVS 2009 U.S. Hotel Valuation Index
http://slidepdf.com/reader/full/hvs-2009-us-hotel-valuation-index 45/50
HVS Global Hospitality Services 2009 United States Hotel Valuation I
Page 44 of 49
Remaining HVI Markets (continued)
2005 2006 2007 2008 2009 2010 2011 2012 2013
Syracuse $64,491 $64,163 $66,123 $61,133 $49,343 $43,843 $51,246 $60,032 $75,948 (1.8)16.3% -0.5% 3.1% -7.5% -19.3% -11.1% 16.9% 17.1% 26.5%
Tallahassee $73,419 $71,942 $46,748 $23,933 $12,368 $842 $3,704 $12,252 $27,581 (31.2)8.4% -2.0% -35.0% -48.8% -48.3% -93.2% 339.9% 230.7% 125.1%
Tampa $94,663 $103,107 $83,652 $60,110 $47,778 $41,869 $55,735 $76,043 $107,402 (14.0)20.6% 8.9% -18.9% -28.1% -20.5% -12.4% 33.1% 36.4% 41.2%
Tucson $94,524 $120,211 $111,589 $82,571 $59,195 $51,886 $65,886 $83,381 $111,694 (4.4)44.1% 27.2% -7.2% -26.0% -28.3% -12.3% 27.0% 26.6% 34.0%
Wilmington $75,247 $94,036 $93,704 $68,845 $53,848 $44,879 $49,423 $64,307 $88,719 (2.9)7.7% 25.0% -0.4% -26.5% -21.8% -16.7% 10.1% 30.1% 38.0%
Winston-Salem $45,306 $59,210 $63,213 $48,517 $42,585 $38,626 $49,466 $62,158 $82,149 2.328.9% 30.7% 6.8% -23.2% -12.2% -9.3% 28.1% 25.7% 32.2%
WPB-Boca Raton $191,032 $193,650 $149,733 $106,551 $140,792 $169,903 $204,020 $227,723 $253,07922.1% 1.4% -22.7% -28.8% 32.1% 20.7% 20.1% 11.6% 11.1%
(2005 - 2013)CAGR

8/8/2019 HVS 2009 U.S. Hotel Valuation Index
http://slidepdf.com/reader/full/hvs-2009-us-hotel-valuation-index 46/50
HVS Global Hospitality Services 2009 United States Hotel Valuation Index
Page 45 of 49
Conclusion
Over the past twelve months, the deepening economic recession has had aprofound impact on hotel values. Not only have weakened demand levelscontributed to this trend, but the veritable evaporation of credit has alsocontributed significantly. Generally, hotel values are projected to bottom outin 2010. With near-term depressed earnings for hotels, and the reality of making a purchase with all cash or a low loan-to-value ratio, HVS’s newvaluation methodology assumes that purchasers will look to refinance thehotel once its earnings have recovered and the credit markets have returned
to some semblance of normalcy. Based on the economic and financial trendsdescribed throughout this report, hotel values are expected to recover over afive-year period, matching or surpassing peak levels recorded in 2006 by2013-2014. Real Capital Analytics estimates that approximately $18 billion inhotel loans were distressed as of August 2009. Capital market participants areexpected to either foreclose on such assets or restructure and work out theirloan requirements. Considering such factors, savvy investors with access toequity are expected to capitalize on such opportunities and purchasedistressed assets with an upside, at significantly discounted prices. Thus, overthe next 12 to 18 months, the volume of hotel sales transactions is expected toillustrate a progressively upward trend.

8/8/2019 HVS 2009 U.S. Hotel Valuation Index
http://slidepdf.com/reader/full/hvs-2009-us-hotel-valuation-index 47/50

8/8/2019 HVS 2009 U.S. Hotel Valuation Index
http://slidepdf.com/reader/full/hvs-2009-us-hotel-valuation-index 48/50
HVS Global Hospitality Services 2009 United States Hotel Valuation Index
Page 47 of 49
within the broader market, can cause that submarket to have significantlydifferent results than the market as a whole.
Numerous factors influence the value of an individual asset, including theproperty’s age, condition, location, amenities and services, brand,management expertise, and reputation. All of these factors must beconsidered in the context of the hotel’s specific competitive market, including the nature, strength, and trends in demand generators, the character andcompetitive posture of the existing hotels, and the potential addition of anynew properties. The value of any individual asset can only be concluded after
a thorough investigation of all these factors. And that conclusion willinvariably differ – often materially – from the index indicated by the HVI.
So how can the HVI be of use to an individual investor? Although the HVIcannot tell you what a particular hotel is worth, it does provide excellent “big picture” data, indicating which market areas are experiencing positive trendsand thus may present good investment opportunities. The HVI for the U.S. isa measure of the strength of the lodging industry as a whole and, specifically,the hospitality investment market. The HVI for the various identified marketscan provide a basis to evaluate and compare different geographic regions.

8/8/2019 HVS 2009 U.S. Hotel Valuation Index
http://slidepdf.com/reader/full/hvs-2009-us-hotel-valuation-index 49/50
HVS Global Hospitality Services 2009 United States Hotel Valuation Index
Page 48 of 49
About the AuthorsSteve Rushmore is the president and founder of HVS, a global hospitalityconsulting organization with more than 25 office s around the globe. Hedirects the worldwide operat ion of this firm and is responsible for futureoffice expansion and new product development. Steve has providedconsultation services for more than 15,000 hotels throughout the worldduring his 40-year career and specializes in complex issues involving hotelfeasibility, valuations, and financing. He was one of the creators of theMicrotel concept and was instrumental in its IPO. Steve is a partner in HEIHospitality, LLC, a hotel investment fund, which makes him one of the few
hospitality consultants that actually invest in and own hotels.As a leading authority and prolific author on the topic of hotel feasibilitystudies and appraisals, Steve Rushmore has written all five textbooks and twoseminars for the Appraisal Institute covering this subject. He has alsoauthored three reference books on hotel investing and has published morethan 300 articles. He writes a column for Lodging Hospitality magazine and iswidely quoted by major business and professional publications. Steve lecturesextensively on hotel trends and has taught hundreds of classes and seminarsto more than 20,000 industry professionals. He is also a frequent lecturer atmajor hotel schools around the world, including Lausanne, Cornell, Houston,and IMHI.
Steve has a BS degree from the Cornell Hotel School and an MBA from theUniversity of Buffalo. He holds MAI and FRICS appraisal designations and isa CHA (certified hotel administrator). He is a member of numerous hotelindustry committees, including IREFAC and the NYU Hotel InvestmentConference. In 1999, Steve was recognized by the New York chapter of theCornell Hotel Society as "Hotelie of the Year.” In his free time, he enjoysskiing, diving, and sailing. He holds a commercial pilot's license with multi-engine instrument rating, collects hotel key tags, and is one of the foremostauthorities on regional dining ( www.roadfood.com ).
© 2009 HVS. All rights reserved.Published by: HVS New York, 369 Willis Avenue, Mineola, NY 11501
Contact information for Steve Rushmore:Phone: 516-248-8828 x204Fax: 516-742-3059Email: [email protected] visit our website at: www.hvs.com

8/8/2019 HVS 2009 U.S. Hotel Valuation Index
http://slidepdf.com/reader/full/hvs-2009-us-hotel-valuation-index 50/50
HVS Global Hospitality Services 2009 United States Hotel Valuation Index
Emily U. Smith is a Vice President of the New York office of HVS. Since joining HVS in June 2007, Ms. Smith has worked on roughly 100 consulting and valuation assignments in 19 states. In addition to appraisals, she hasperformed feasibility and market studies, as well as litigation support servicesand competitive market analyses. She has published three articles pertaining to development, valuation, and lodging trends, and she has also beeninterviewed by Commercial Property News. Her article on the Japanese lodging industry was published in the Fall 2008 Real Estate Finance Journal.
Ms. Smith received a Bachelor of Arts degree from Tulane University,graduating summa cum laude with a dual major in History and French. She
holds a Master of Science in Hospitality Management from the Conrad N.Hilton College of Hotel & Restaurant Management at the University of Houston. She also has two years of overseas work experience in Kyoto, Japan.Ms. Smith was recently selected as the recipient of the 2009 DistinguishedYoung Alumnus Award by the Conrad N. Hilton College.
Contact information for Emily Smith:Phone: 516-248-8828 x277Fax: 516-742-3059Email: [email protected]
Neel M. Lund is a Vice President at HVS New York. Since joining HVS in June 2007, he has provided consulting and appraisal services for over 100assignments in the United States. Neel specializes in the New York Citylodging market and has worked on more than 50 assignments within thismarket area alone. His industry expertise includes market studies, feasibilityanalyses, appraisals, and development consulting. Neel’s previouspublications include articles on topics relating to hotel front office “upsell”programs and sport tourism. He also co-authored the 2008 publication of theHotel Valuation Index (HVI).
Neel received his bachelor’s degree from Cornell University’s School of
Industrial and Labor Relations, and also holds a post-graduate diploma inInternational Hospitality Management from Les Roches, School of HotelManagement, Bluche, Switzerland.
Contact information for Neel Lund: