hwange colliery company limited abridged audited financial ...€¦ · hwange colliery company...
TRANSCRIPT

UNAUDITED ABRIDGED FINANCIAL RESULTS
Hwange Colliery Company LimitedAbridged Audited Financial ResultsFor the year ended 31 December 2019
HWANGE(Incorporated in Zimbabwe)
ADMINISTRATOR’S LETTERb) Rebuild or replacement of Hwange Colliery’s own Coke Oven Battery.
The company’s coke oven battery was shut down in mid-2014 in a controlled manner in order to prevent damage to the oven furnaces. Despite many interventions over many years to implement a rolling rebuild, the plant was very old and beyond its economic life. Therefore a process is underway, to invite bidders to tender for the full rebuild of the coke oven battery, by-products plant and ancillary plants or the supply of a completely new coke oven battery of the same capacity together with the by-products and ancillary plant.
b) Fixed plant repair and restoration of full capacity The main thrust as we move into 2020 is to ensure that we fully capacitate our opencast mine by acquiring the required spares to bring back all the trucks on line and sort out the loading capacity which was a bottleneck in 2019. The completion of repair work of the Heavy Medium separation plant (HMS) is also on the high priority list and should be commissioned in the second quarter of 2020.
c) Development of Option Area and Lubimbi The life of mine at the current open cast operations is estimated to be less than 5 years. Therefore the development of the Option Areas and Lubimbi coal fields to a full scale mining operations is critical. The loss of the Western Area Coal Fields is now a threat to the 25 years coal supply agreement which was signed with the Zimbabwe Power Company’s Hwange Power Station Stage 3 expansion. There is therefore need for the company to be allocated an alternative resource to be able to full fill the agreement which is critical to the electricity supply in the country.
e) Increase volume of export sales Given the deliberate focus on increasing the mix of high value and margin coking coal and coke, the company will grow its market share in the neighbouring countries. Hwange Colliery’s coking coal and coke meets exacting quality specifications in the ferro-chrome industries and smelters. It is therefore currently gathering market information of the ferro-chrome industries in South Africa to try and explore options to export either coking coal or coke into that market. In collaboration with the National Railways of Zimbabwe and Bulawayo Beitbridge Railway ( BBR), the company will develop dedicated solutions for the delivery of coking coal and coke products to customers in the region and within the country.
COVID 19 UpdateThe company continues to operate cautiously during the lockdown period which commenced on 31 March 2020 as it is considered to be offering essential services according to SI 83 of 2020. Several measures were taken to ensure the safety of the employees and the other stakeholders. The company operations were however affected by the pandemic as some customers and suppliers are closed due to lockdown. The company will continue to operate and is fully aware of the potential risk to the business of the pandemic until it is under control.
ZSE LISTINGThe Zimbabwe Stock Exchange suspension owing to administration, continues.
DIRECTORATEThere are no directors in place due to administration.
APPRECIATIONI would like to express my gratitude to the administration team, management and Staff for their collective efforts and dedication to the Company.
B. Moyo (MR) Administrator 10 April 2019
INTRODUCTION It is my privilege to present a review of the operations of Hwange Colliery Company Limited for the year ended 31 December 2019. OPEN CAST OPERATIONSAs the production year 2019 began, the strategic thrust carried over from 2018 was for the organization to focus on managing coal stockpiles which had exceeded 340,000 tonnes in September 2018. Mining operations had been strategically stopped in a bid to deplete the available stockpiles and improve sales and revenue while mitigating the spontaneous combustion risk posed. Therefore as the year began, mining equipment was deployed on coal movement from stockpiles to the processing plants. Mining operations commenced in February 2019 at the JKL Strategic pit and continued throughout the year.
The contractor Mota Engil complimented HCCL’s own production towards the end of the year, mining coal at Chaba for 3 months; August, September and November before the expiration of the contract.
The highlight of the year was the acquisition and commissioning into production of two new state of the art Liebherr 980 SME excavators meant to bridge the gap on the aging loading capacity. The Mine continued to be constrained by low working capital inflows and the shortage of adequate foreign currency to acquire critical spares and consumables.
Total coal mined by Opencast operations totalled 756,279 tonnes, a 52% decline in production from the previous year. Total coal from HCCL pits was 449,454 tonnes, a 22% increase in production from 2018 while the contractor Mota Engil mined a total of 306,825 tonnes, which was a 75% decline in production.
A total of 554,619 tonnes of coal was delivered to Hwange Power Station during the course of the year. The coal conveyor delivery system to ZPC continued to be a major bottleneck which requires capital expenditure.
UNDERGROUND OPERATIONS3 Main Underground Mine Run of Mine (RoM) coal production was 37% better than the previous year but 35.5% below the target. During the year 268,603t of RoM coal was produced against a budget of 409,500t. The year-on-year increase is attributable to the resuscitation of the Sandvik LHD, improving operational funding support and the credit facility that was availed by OEM (Komatsu SA), which has been working well.
The mine received and commissioned the eighteen seater Personnel man Carrier and reduced fatigue on underground employees. The underground working sections have advanced and employee were travelling long travel distances in and out of the mine. The Continuous Miner (CM) had a major breakdown towards the end of 2019 and was subsequently trammed out of the mine in December 2019 for repairs and opportunistic maintenance works. It is now in good working condition.
ProjectsConveyor interlock and communication system was partially commissioned. Full commissioning will be done when the control voltage transformers are acquired. Change house construction project is now expected to be completed in 2020.
Coke ProductionThe Company is still pursuing takeover project of the Hwange Coal Gasification Company (HCGC) Coke oven battery pursuant to a BOOT Agreement with its Chinese partners in HCGC. Engagements remain in place to ensure that this is achieved without placing risk on the Company. The Company has placed more emphasis and attention on the building of its own coke oven battery going forward.
PROCESSING - METALLURGICAL OPERATIONS AND LOGISTICSA total of 628 727 tons raw coal was processed at both Chaba and No 2 plants against a target of 1 440 000 tons which is 44% attainment of the target.
A total of 378,090tons HIC/HCC was processed at Chaba during the year under review. This was against a target of 960,000tons i.e. 39.4% target achievement. The Jig and floatation plant processed a total of 161,256tons versus a target of 252,000 tons i.e. 64% target achievement. The Jig plant was affected by engineering breakdowns mainly the number 2 feed water pump and the waste elevator buckets. The plant also had challenges on supply of process water from the Runduwe and low haulage capacity.The Wet Screens plant processed a total of 250,637tons against a target of 480,000tons i.e. 52% target achievement. Fuel supply was a challenge from the beginning of the year right through the end and it affected production.
Hw
ange
Res
ults
Pag
e 1
ESTATES OPERATIONSThe Division is divided into four segments, namely Real Estate, Retail, Hospitality and Education.
Planned projects were negatively affected by the unfavourable economic environment. Projects undertaken by the division included -:• Refurbishment of retail outlets and clubs as part of our ongoing rebranding exercise.• Completion of the refurbishment and refurnishing of Hwange Angling and Boating Club, an eleven (11) chalet facility of the mighty Zambezi River.• Construction of a fast food outlet complex along the Bulawayo-Victoria Falls highway.
MEDICAL SERVICES OPERATIONSRevenue performance was 82% above budget, largely due to rampant inflation experienced throughout 2019. The Division refrained from collecting a co-payment from Cellmed clients, and from claiming medical aid shortfalls from the same market segment. This had a profoundly negative impact on revenue generation as this group comprises circa 85% of patient throughput. Costs of consumables also contributed as inflation remained a factor throughout 2019.
The Employee Wellness Programme spearheaded by the Division was successfully launched in December, 2019 following extensive research, bench marking with companies that have launched successful programmes as well as an extensive process of employee consultation and involvement.
A Patient Management and Administration software system [PMS] was acquired to manage the billing and Management Information and year end was in the process of implementation.
All professional staff whose licences expired in December 2019 renewed their practicing licences after amassing acceptable professional development points. The Division had in place In-House/in service training, which covered all staff groups and grades. By year end, there were 89 students in training at the School of Nursing.
IMPROVED EFFICIENCIES AND COMPETITIVENESSAs the Company increases the thrust on the core business of mining, it will also look at ways of allowing other entities and mining companies within the concession to assist in the running of town services such as road maintenance, electrical power distribution and sewage treatment. The adoption of enterprise resource planning systems to automate the administration of the business will also improve efficiencies and lower the cost per ton of coal produced.
COVID 19 MEASURESIn December 2019, a novel strain of coronavirus was reported in Wuhan, China. January 2020, the World Health Organization (WHO) declared the novel Coronavirus, COVID-19, as a Public Health Emergency of International concern.
Hwange Colliery Company Limited (HCCL) will follow and comply with all Government directives as the company has always done in critical matters. It is against this background that HCCL has put in place a raft of mitigation measures in line with COVID-19 National Preparedness and Response Plan. Some of the measures include setting up screening sites at identified critical points. Screening is currently being done at Opencast entry point, Hospital gate and General Office entrance. Where screening is not being done, everyone is encouraged to wash/ sanitize hands regularly and religiously.
As for the isolation of suspected cases, individuals suspected will self-isolate at home and the surveillance team shall be monitoring the person.
CONCLUSIONI would like to express my gratitude to the administration team, management and Staff for their collective efforts and dedication to the Company.
Dr C. ZinyembaActing Managing Director
OPERATIONAL REVIEW CONDENSED STATEMENT OF PROFIT OR LOSS AND OTHER COMPREHENSIVE INCOMEfor the year ended 31 December 2019
Inflation Adjusted Historical 2019 2018 2019 2018 Notes ZWL ZWL ZWL ZWL
Revenue 5 881 483 368 429 477 707 422 227 974 69 144 019
Cost of sales (459 305 628) (450 572 795) (239 912 676) (72 540 235)
Gross profit/(loss) 422 177 740 (21 095 088) 182 315 298 (3 396 216)
Other income 7 5 675 738 8 154 994 2 285 276 1 312 918
Other losses and gains 8 (284 351 481) - (256 741 882) -
Marketing costs (3 125 366) (3 632 143) (1 301 154) ( 584 759)
Administrative costs (131 765 816) (200 389 725) (77 275 551) (32 261 863)
Impairment of assets 14 - (121 788 761) - (19 607 454)
Care and maintenance - (39 220 669) - (6 314 355)
Gain on net monetary position 2 261 005 386 - - -
Operating profit/loss before
interest and tax 2 269 616 201 (377 971 392) (150 718 013) (60 851 729)
Finance costs 9 (57 877 401) (109 409 590) (19 023 411) (17 614 462)
Share of profit/(loss) from
equity accounted investments 10 - 146 010 - 23 507
Profit/(loss) before tax 11 2 211 738 800 (487 234 972) (169 741 424) (78 442 684
Income tax expense 12 (666 503 660) - 78 631 903 -
PROFIT/LOSS FOR THE YEAR 1 545 235 140 (487 234 972) (91 109 521) (78 442 684)
Other comprehensive income:
Gain on revaluation property,
plant and equipment - - 2 380 201 695 -
Tax effect of revaluation - - (588 385 859) -
- - 1 791 815 836 -
TOTAL COMPREHENSIVE INCOME
FOR THE YEAR 1 545 235 140 (487 234 972) 1 700 706 315 (78 442 684)
Attributable profit/(loss) per share
- basic 13.1 8.41 (2.65) (0.50) (0.43)
- diluted 13.2 8.41 (2.65) (0.50) (0.40)
Headline profit/(loss) per share
- basic 13.3 8.28 (1.80) (0.52) (0.31)
- diluted 13.4 8.28 (1.80) (0.52) (0.31)
OVERVIEW
The Company was placed under administration by a Reconstruction Order made by the Minister of Justice, Legal and Parliamentary Affairs (“the Minister”) in terms of the Reconstruction of State-Indebted Companies Act [Chapter 24:27] on or about 26 October 2018. The reasons for this include :
a) Gross losses;b) Persistent losses over a long period;c) Negative cash flow;d) Obsolete and antiquated plant and equipment;e) Technical insolvency with liabilities significantly exceeding assets;f) Non payment of creditors as they fell due; andg) Non payment of employees over a long period of time.
Owing to the above mining had stopped in August 2018.On 12 February 2020, the High Court refused to confirm the Reconstruction Order as it found, inter alia, that the 2014 scheme of arrangement with creditors subsisted at the time of the Reconstruction Order and should be allowed to run its course. However, on 27 February 2020, the Minister appealed against this decision, to the Supreme Court, and pending the hearing in the Supreme Court, administration continues as normal. Whilst a lot of work still needs to be done, it is pleasing to note that mining resumed in April 2019. We report hereunder the progress made to date.
FINANCIAL PERFORMANCE On a historic cost basis, the Company’s performance improved from a gross loss of ZWL 3.3 million for the year ended 31 December 2018 to a Gross profit of ZWL 182 million for the year under review. The net loss position however increased from ZWL 78 million to ZWL 91 million due to an exchange loss of ZWL 322 million on legacy foreign creditors. On an inflation adjusted basis, the performance improved from a gross loss of ZWL 21 million and a net loss of ZWL 487 million to a gross profit of ZWL 422 million and after tax profit of ZWL 1.5 billion. .
Revenue increased by 105% from ZWL429 million in 2018 to ZWL 881 million in 2019 on an inflation adjusted basis and on historical basis it increased by 511% from ZWL69.1 million in 2018 to ZWL422.2 million in 2019. This was largely due to a combination of an increase in high value coking coal sales as well as frequent adjustments to product prices in line with changes to the Interbank rates which were introduced in February 2019.
PERFORMANCE Financial performance improved in 2019 against comparable period in 2018 despite decreased production and sales volumes. This was largely due to a change in the sales mix, which saw high value coking coal production and sales going up by 20% as well as improved product pricing. Production and sales were adversely affected by the shortage of diesel coupled with unavailability of wagons. There was a production gap of 64% in total coal mined of 1,013,932 tonnes, compared to sales potential of 2,819,298 tonnes. The market remains with a high appetite for our product as evidenced by our 2019 order book. The Marketing Department was capacitated by two field vehicles which were purchased during the period under review, and which increased market visibility.
REVIEW OF OPERATIONSIt was encouraging to note that own production increased by 27% during the period under review, despite the overall production decreasing by 43% mainly as a result of contractor production, which decreased by 75%. Over time, less reliance should be placed on contractors with own mining being a priority as it is cheaper and generally more reliable. However the major challenge in achieving this is largely due to lack of both financial and human capital, aspects which will continue to be prioritized going forward. The strategic priorities for the Company’s year-end were the following;
a) Safety, Health, Environment and QualityThe company recorded improvements on both lost time injury accidents and property damage incidents in 2019 compared to 2018. A wellness programme was introduced in December 2019 in order to augment efforts towards consolidating all systems through an IBMS programme which is expected to be fully implemented in 2020.
b) Increasing the volume of high value and high margin coking coalDuring the year under review, focus was on increasing production and sales of high value coking Coal. Coking coal sales increased by 20% from 203 298 tonnes in 2018 to 244 314 tonnes in 2019. The coking coal sales volumes were however limited by washing capacity constraints as the plant is antiquated and needs retooling, which is currently underway.
c) Open Cast MiningOwn open cast operations at JKL Mine produced 449 454 tonnes in 2019 which was an increase of 22% from 2018 production of 366 959 tonnes. Production by the Contractor at Chaba Mine dropped by 75% from 1,220,859 tonnes in 2018 to 306 825 tonnes in 2019. As a result overall opencast mine production in 2019 was 52% below that of 2018. This was mainly attributable to low Contractor activity and working capital challenges, shortages of diesel in the market and foreign currency to buy spares and explosives. The highlight of the year was the acquisition and commissioning into production of 2 new state of the art Liebherr excavators to bridge the gap on the aging loading capacity. The excavators have had a significant impact on loading capacity. However, dump truck capacity continues to be a major bottleneck to production as 70% of dump truck capacity went down due to worn out tyres. It should be noted that when the Company was placed under administration production had ceased and this was worsened by the Contactor which immediately stopped production due to non-payment of long outstanding invoices.
d) Underground MiningThe underground operation at 3 Main mine produced 268 603 tonnes in 2019 which was an increase of 37% from 2018 production of 196 060 tonnes. The increase was attributable to improved operational funding support and the credit facility availed by the major original equipment manufacturer, Komatsu SA, which has been working well. This was however below the 2019 annual target of 409 500 tonnes, attributable to a shortage of working capital and foreign currency for spares and consumables, mainly imported from South Africa. The mine received and commissioned the 18-seater personnel carrier which reduces fatigue on underground employees who were travelling a long distance. The Continuous Miner (CM) had a major breakdown towards the end of 2019 and was subsequently trammed out of the mine in December 2019 for repairs and opportunistic maintenance works. The CM resumed work in March 2020.
e) Fixed and mobile plant repair and restoration of full capacitySignificant investment has been made in new equipment as well as repairs and maintenance of the existing plant and equipment. Open cast mine was equipped with two excavators and two mine dewatering pumps which significantly improved the loading capacity and pumping capacity. Repairs work on the HMS washing plant is at an advanced stage and has been delayed by foreign currency constraints and is expected to be commissioned in the second quarter of 2020. Two buses for employees have also been purchased, with one already received and in use. Two utility vehicles were also purchased for the marketing department.
f) Coke ProductionThe intended takeover of the Hwange Coal Gasification Company (Private) Limited (HCGC) Coke Oven Battery pursuant to a BOOT Agreement with its Chinese partners in HCGC is still pending. The company is now also considering constructing its own battery in order to tap into the coke market, which has high value and significant foreign currency earning potential.
g) Cost ControlThe Company adopted a low cost high productivity strategy. This has enabled it to significantly reduce its costs. Tight controls remain on costs, but these are affected by exchange rate driven inflation.
OUTLOOKStrategic plans to unearth the Company’s potential are being developed and these include:-
a) Increasing the volume of high value and margin coking coal Apart from the underground mining operations which are producing an average of 35 000 tonnes per month, plans are underway to develop a second underground mining section in the medium term, so that coking coal production will double when the new section is fully operational. In addition, opencast operations at the JKL pit will continue in order to increase high value coking coal in the product mix. It should be noted that at present 50% of production and sales is thermal coal which is currently being sold at a loss. Clearly this is not sustainable and hence the need to aggressively change the mix even if it means lower volumes.
NOTES TO THE ABRIDGED FINANCIAL STATEMENTSfor the year ended 31 December 2019
1 NATURE OF OPERATIONS AND GENERAL INFORMATION Hwange Colliery Company Limited is a Company whose principal activities include extraction, processing
and distribution of coal and coal products and provision of health services and various retail goods and services. Its activities are grouped into the following three (3) areas:
i) Mining - the extracting, processing and distribution of coal and coal products. ii) Medical services - provides healthcare to staff members and the surrounding community. iii) Estates - the division provides properties for rental and sell retail goods and services. The Company is a limited liability Company incorporated and domiciled in Zimbabwe. It is listed primarily on the Zimbabwe Stock Exchange (ZSE), and has secondary listing on the Johannesburg Stock Exchange (JSE) and London Stock Exchange (LSE). The company’s financial statements were authorised for issue on 10 April 2020. Presentation currency These financial statements are presented in Zimbabwean Dollars (ZWL) being the functional and reporting currency of the primary economic environment in which the Group operates. Statement of compliance
The abridged financial results of the Company have been prepared using accounting policies consistent with International Financial Reporting Standards (IFRSs). The same accounting policies, presentation and methods followed in the abridged financial results are as applied in the Company latest annual financial statements. The Company partially complied with the International Financial Reporting Standards due to the requirement to comply with Statutory Instrument 33 of 2019.
Changes in accounting policies New and revised standards and interpretations - Adopted IFRS 16 ‘Leases’
IFRS 16 ‘Leases’ replaces IAS 17 ‘Leases’ along with three Interpretations (IFRIC 4 ‘Determining whether an Arrangement contains a Lease’, SIC 15 ‘Operating Leases-Incentives’ and SIC 27 ‘Evaluating the Substance of Transactions Involving the Legal Form of a Lease’). The new Standard has been applied using the modified retrospective approach, with the cumulative effect of adopting IFRS 16 being recognised in equity as an adjustment to the opening balance of retained earnings for the current period. Prior periods have not been restated For contracts in place at the date of initial application, the Company has elected to apply the definition of a lease from IAS 17 and has not applied IFRS 16 to arrangements that were previously not identified as lease under IAS 17 and IFRIC. The Company has elected not to include initial direct costs in the measurement of the right-of-use asset for operating leases in existence at the date of initial application of IFRS 16, being 1 January 2019. On transition, for those leases previously classified as finance leases, the right-of-use asset and lease liability are measured at the date of initial application at the same amounts as under IAS 17 immediately before the date of initial application. IAS 29 ‘Financial Reporting in Hyper -Inflationary Economies’ The Company adopted IAS 29 – “Financial Reporting in Hyper -Inflationary Economies” effective 1 January 2019 as proclaimed by the local accounting regulatory board, Public Accountants and Auditors Board “PAAB”. IAS 29 requires that the financial statements prepared in the currency of a hyper-inflationary economy be stated in terms of a measuring unit current at the balance sheet date. The restatement has been calculated by means of conversion factors derived from the consumer price index( CPI) prepared by the Reserve Bank Of Zimbabwe. The conversion factors unused to restate the financial statements at 31 December 2019, using a February 2019 base are as follows:
Date Indices Conversion factor 31 December 2019 551.6 1.000 31 December 2018 88.8 6.211
4 SUMMARY OF ACCOUNTING POLICIES
4.1 Overall considerations The financial statements have been prepared using the measurement bases specified by IFRSs for each type of asset, liability, income and expense. The measurement bases are more fully described in the accounting policies below: 4.2 Foreign currency translation Foreign currency transactions are translated into the functional currency of the Company, using the exchange rates prevailing at the dates of the transactions (spot exchange rate). Foreign exchange gains and losses resulting from the settlement of such transactions and from the remeasurement of monetary items denominated in foreign currency at year-end exchange rates are recognised in profit or loss. Non-monetary items are not retranslated at year-end and are measured at historical cost (translated using the exchange rates at the transaction date), except for non-monetary items measured at fair value which are translated using the exchange rates at the date when fair value was determined. In the Company’s financial statements, all assets, liabilities and transactions of the entities with a functional currency other than the ZWL, are translated into ZWL. The functional currency of the Company has changed from USD to ZWL during the reporting period. 4.3 Investment in associates and joint ventures Investments in associates and joint ventures are accounted for using the equity method. Associates are all entities over which the Company has significant influence but not control, generally accompanying a shareholding of between 20% and 50% of the voting rights. Investments in associates are accounted for using the equity method and are initially recognised at cost. The company’s investment in associates includes goodwill identified on acquisition, net of any accumulated impairment loss.
The carrying amount of the investments is increased or decreased to recognise the Company’s share of the profit or loss and other comprehensive income of the associate or joint venture. These changes include subsequent depreciation, amortisation or impairment of the fair value adjustments of the assets and liabilities. Unrealised gains/losses on transactions between the Company and its associates or joint ventures are eliminated to the extent of the Company’s interest in those entities. Where unrealised losses are eliminated, the underlying asset is also tested for impairment.
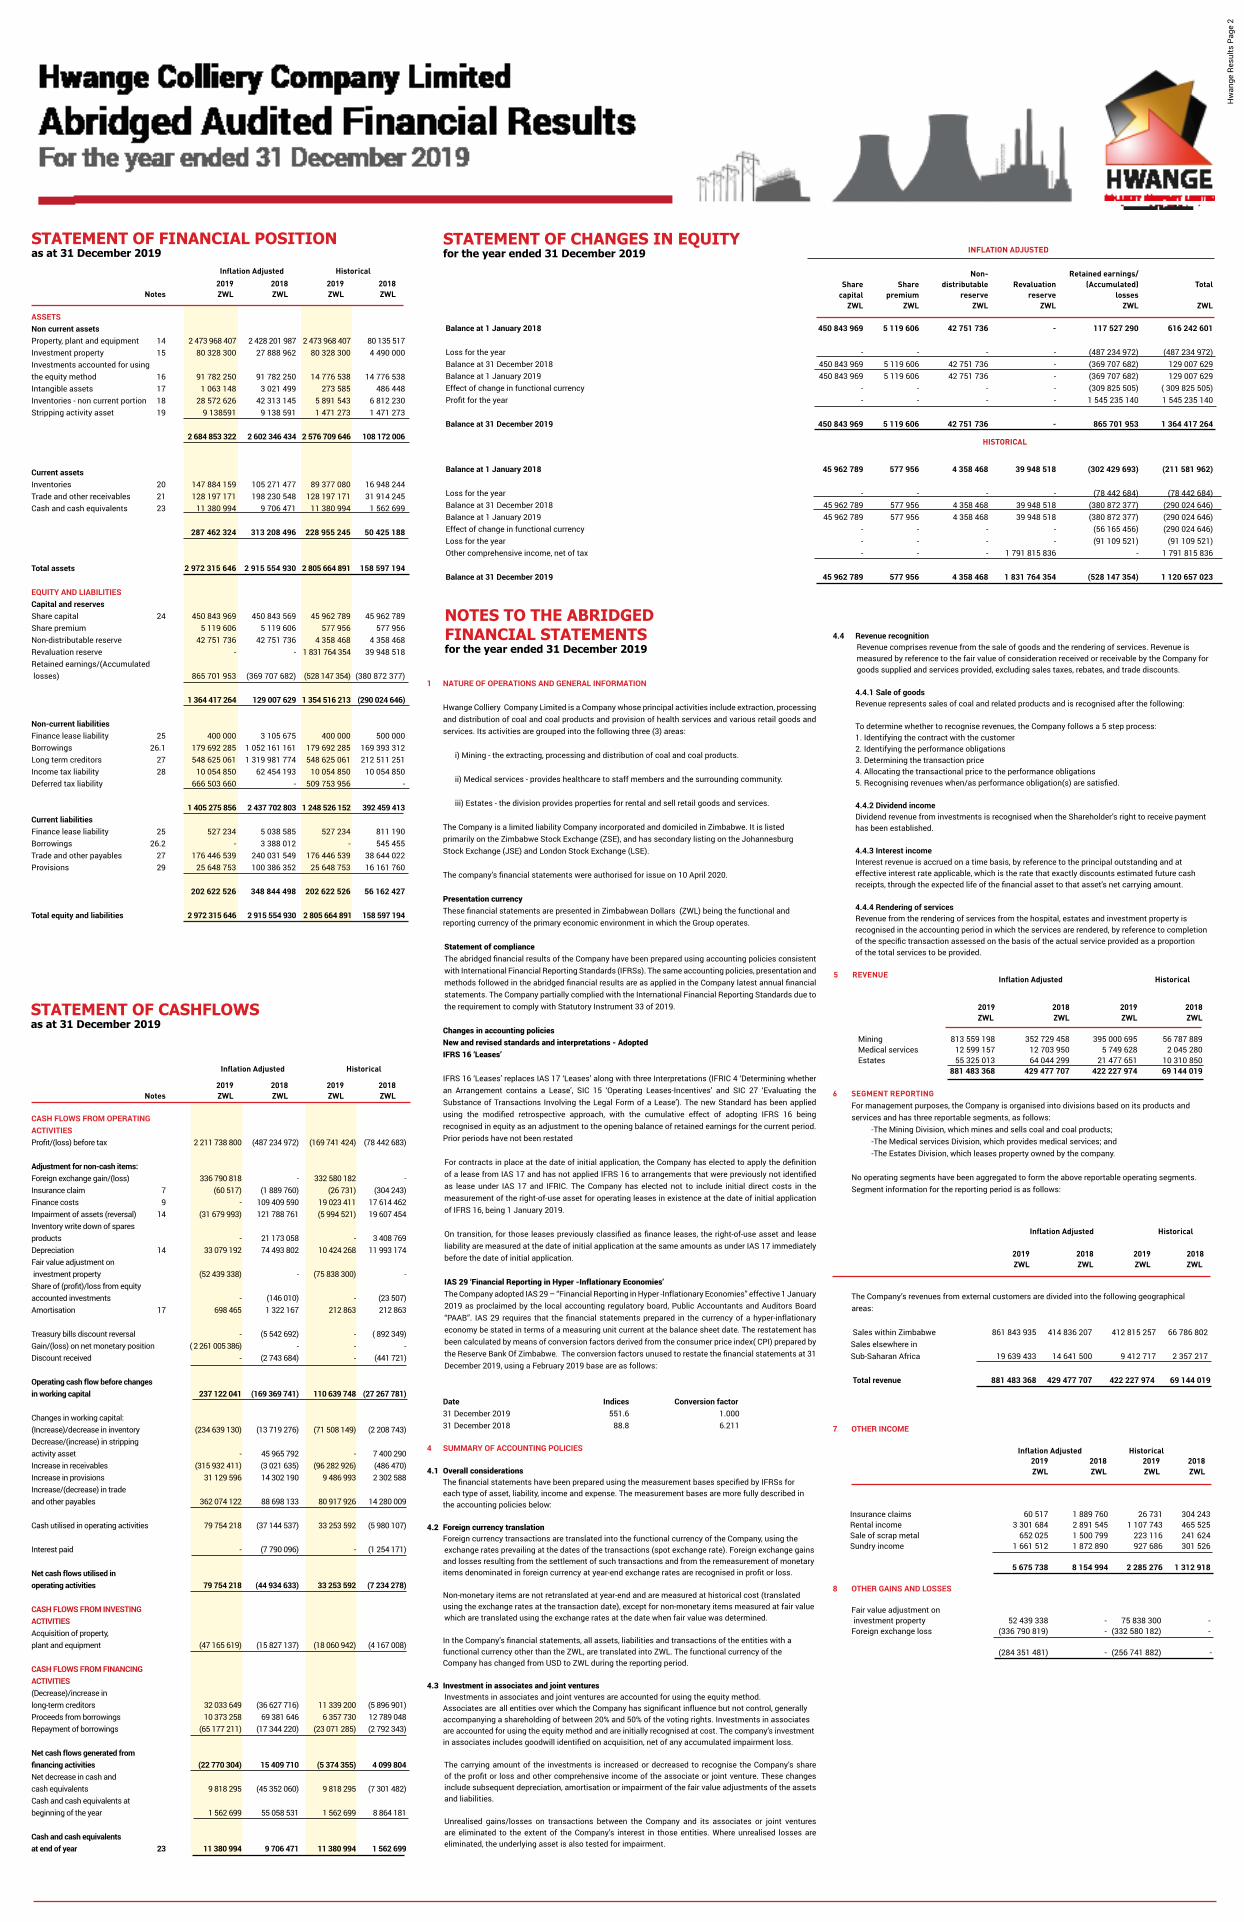
2019 2018 2019 2018 ZWL ZWL ZWL ZWL Mining 813 559 198 352 729 458 395 000 695 56 787 889 Medical services 12 599 157 12 703 950 5 749 628 2 045 280 Estates 55 325 013 64 044 299 21 477 651 10 310 850 881 483 368 429 477 707 422 227 974 69 144 019
6 SEGMENT REPORTING For management purposes, the Company is organised into divisions based on its products and services and has three reportable segments, as follows: -The Mining Division, which mines and sells coal and coal products; -The Medical services Division, which provides medical services; and -The Estates Division, which leases property owned by the company.
No operating segments have been aggregated to form the above reportable operating segments. Segment information for the reporting period is as follows:
Inflation Adjusted Historical5 REVENUE
Inflation Adjusted Historical
4.4 Revenue recognition Revenue comprises revenue from the sale of goods and the rendering of services. Revenue is measured by reference to the fair value of consideration received or receivable by the Company for goods supplied and services provided, excluding sales taxes, rebates, and trade discounts.
4.4.1 Sale of goods Revenue represents sales of coal and related products and is recognised after the following: To determine whether to recognise revenues, the Company follows a 5 step process: 1. Identifying the contract with the customer 2. Identifying the performance obligations 3. Determining the transaction price 4. Allocating the transactional price to the performance obligations 5. Recognising revenues when/as performance obligation(s) are satisfied. 4.4.2 Dividend income Dividend revenue from investments is recognised when the Shareholder’s right to receive payment has been established. 4.4.3 Interest income Interest revenue is accrued on a time basis, by reference to the principal outstanding and at effective interest rate applicable, which is the rate that exactly discounts estimated future cash receipts, through the expected life of the financial asset to that asset’s net carrying amount. 4.4.4 Rendering of services Revenue from the rendering of services from the hospital, estates and investment property is recognised in the accounting period in which the services are rendered, by reference to completion of the specific transaction assessed on the basis of the actual service provided as a proportion of the total services to be provided.
STATEMENT OF CHANGES IN EQUITYfor the year ended 31 December 2019 INFLATION ADJUSTED
HISTORICAL
Non- Retained earnings/ Share Share distributable Revaluation (Accumulated) Total capital premium reserve reserve losses ZWL ZWL ZWL ZWL ZWL ZWL Balance at 1 January 2018 450 843 969 5 119 606 42 751 736 - 117 527 290 616 242 601
Loss for the year - - - - (487 234 972) (487 234 972)Balance at 31 December 2018 450 843 969 5 119 606 42 751 736 - (369 707 682) 129 007 629 Balance at 1 January 2019 450 843 969 5 119 606 42 751 736 - (369 707 682) 129 007 629Effect of change in functional currency - - - - (309 825 505) ( 309 825 505)Profit for the year - - - - 1 545 235 140 1 545 235 140 Balance at 31 December 2019 450 843 969 5 119 606 42 751 736 - 865 701 953 1 364 417 264
Balance at 1 January 2018 45 962 789 577 956 4 358 468 39 948 518 (302 429 693) (211 581 962)
Loss for the year - - - - (78 442 684) (78 442 684)Balance at 31 December 2018 45 962 789 577 956 4 358 468 39 948 518 (380 872 377) (290 024 646)Balance at 1 January 2019 45 962 789 577 956 4 358 468 39 948 518 (380 872 377) (290 024 646)Effect of change in functional currency - - - - (56 165 456) (290 024 646)Loss for the year - - - - (91 109 521) (91 109 521)Other comprehensive income, net of tax - - - 1 791 815 836 - 1 791 815 836
Balance at 31 December 2019 45 962 789 577 956 4 358 468 1 831 764 354 (528 147 354) 1 120 657 023
2019 2018 2019 2018 ZWL ZWL ZWL ZWL
The Company’s revenues from external customers are divided into the following geographical areas: Sales within Zimbabwe 861 843 935 414 836 207 412 815 257 66 786 802 Sales elsewhere in Sub-Saharan Africa 19 639 433 14 641 500 9 412 717 2 357 217 Total revenue 881 483 368 429 477 707 422 227 974 69 144 019
Inflation Adjusted Historical
2019 2018 2019 2018 ZWL ZWL ZWL ZWL
Insurance claims 60 517 1 889 760 26 731 304 243 Rental income 3 301 684 2 891 545 1 107 743 465 525 Sale of scrap metal 652 025 1 500 799 223 116 241 624 Sundry income 1 661 512 1 872 890 927 686 301 526 5 675 738 8 154 994 2 285 276 1 312 918 8 OTHER GAINS AND LOSSES
Fair value adjustment on investment property 52 439 338 - 75 838 300 - Foreign exchange loss (336 790 819) - (332 580 182) - (284 351 481) - (256 741 882) -
7 OTHER INCOME
Hw
ange
Res
ults
Pag
e 2
STATEMENT OF FINANCIAL POSITIONas at 31 December 2019
STATEMENT OF CASHFLOWSas at 31 December 2019
2019 2018 2019 2018 Notes ZWL ZWL ZWL ZWL ASSETS Non current assets Property, plant and equipment 14 2 473 968 407 2 428 201 987 2 473 968 407 80 135 517Investment property 15 80 328 300 27 888 962 80 328 300 4 490 000Investments accounted for using the equity method 16 91 782 250 91 782 250 14 776 538 14 776 538Intangible assets 17 1 063 148 3 021 499 273 585 486 448Inventories - non current portion 18 28 572 626 42 313 145 5 891 543 6 812 230Stripping activity asset 19 9 138591 9 138 591 1 471 273 1 471 273
2 684 853 322 2 602 346 434 2 576 709 646 108 172 006 Current assets Inventories 20 147 884 159 105 271 477 89 377 080 16 948 244Trade and other receivables 21 128 197 171 198 230 548 128 197 171 31 914 245Cash and cash equivalents 23 11 380 994 9 706 471 11 380 994 1 562 699
287 462 324 313 208 496 228 955 245 50 425 188 Total assets 2 972 315 646 2 915 554 930 2 805 664 891 158 597 194 EQUITY AND LIABILITIES Capital and reserves Share capital 24 450 843 969 450 843 569 45 962 789 45 962 789Share premium 5 119 606 5 119 606 577 956 577 956Non-distributable reserve 42 751 736 42 751 736 4 358 468 4 358 468Revaluation reserve - - 1 831 764 354 39 948 518Retained earnings/(Accumulated losses) 865 701 953 (369 707 682) (528 147 354) (380 872 377) 1 364 417 264 129 007 629 1 354 516 213 (290 024 646) Non-current liabilities Finance lease liability 25 400 000 3 105 675 400 000 500 000Borrowings 26.1 179 692 285 1 052 161 161 179 692 285 169 393 312Long term creditors 27 548 625 061 1 319 981 774 548 625 061 212 511 251Income tax liability 28 10 054 850 62 454 193 10 054 850 10 054 850Deferred tax liability 666 503 660 - 509 753 956 - 1 405 275 856 2 437 702 803 1 248 526 152 392 459 413Current liabilities Finance lease liability 25 527 234 5 038 585 527 234 811 190Borrowings 26.2 - 3 388 012 - 545 455Trade and other payables 27 176 446 539 240 031 549 176 446 539 38 644 022Provisions 29 25 648 753 100 386 352 25 648 753 16 161 760 202 622 526 348 844 498 202 622 526 56 162 427
Total equity and liabilities 2 972 315 646 2 915 554 930 2 805 664 891 158 597 194
2019 2018 2019 2018 Notes ZWL ZWL ZWL ZWL CASH FLOWS FROM OPERATINGACTIVITIES Profit/(loss) before tax 2 211 738 800 (487 234 972) (169 741 424) (78 442 683) Adjustment for non-cash items: Foreign exchange gain/(loss) 336 790 818 - 332 580 182 -Insurance claim 7 (60 517) (1 889 760) (26 731) (304 243)Finance costs 9 - 109 409 590 19 023 411 17 614 462Impairment of assets (reversal) 14 (31 679 993) 121 788 761 (5 994 521) 19 607 454Inventory write down of spares products - 21 173 058 - 3 408 769Depreciation 14 33 079 192 74 493 802 10 424 268 11 993 174Fair value adjustment on investment property (52 439 338) - (75 838 300) -Share of (profit)/loss from equity accounted investments - (146 010) - (23 507)Amortisation 17 698 465 1 322 167 212 863 212 863
Treasury bills discount reversal - (5 542 692) - ( 892 349)Gain/(loss) on net monetary position ( 2 261 005 386) - - -Discount received - (2 743 684) - (441 721) Operating cash flow before changesin working capital 237 122 041 (169 369 741) 110 639 748 (27 267 781) Changes in working capital: (Increase)/decrease in inventory (234 639 130) (13 719 276) (71 508 149) (2 208 743)Decrease/(increase) in strippingactivity asset - 45 965 792 - 7 400 290Increase in receivables (315 932 411) (3 021 635) (96 282 926) (486 470)Increase in provisions 31 129 596 14 302 190 9 486 993 2 302 588Increase/(decrease) in trade and other payables 362 074 122 88 698 133 80 917 926 14 280 009
Cash utilised in operating activities 79 754 218 (37 144 537) 33 253 592 (5 980 107) Interest paid - (7 790 096) - (1 254 171)
Net cash flows utilised inoperating activities 79 754 218 (44 934 633) 33 253 592 (7 234 278) CASH FLOWS FROM INVESTING ACTIVITIES Acquisition of property,plant and equipment (47 165 619) (15 827 137) (18 060 942) (4 167 008) CASH FLOWS FROM FINANCINGACTIVITIES (Decrease)/increase in long-term creditors 32 033 649 (36 627 716) 11 339 200 (5 896 901)Proceeds from borrowings 10 373 258 69 381 646 6 357 730 12 789 048Repayment of borrowings (65 177 211) (17 344 220) (23 071 285) (2 792 343) Net cash flows generated fromfinancing activities (22 770 304) 15 409 710 (5 374 355) 4 099 804Net decrease in cash andcash equivalents 9 818 295 (45 352 060) 9 818 295 (7 301 482)Cash and cash equivalents atbeginning of the year 1 562 699 55 058 531 1 562 699 8 864 181 Cash and cash equivalentsat end of year 23 11 380 994 9 706 471 11 380 994 1 562 699
Inflation Adjusted
Inflation Adjusted
Historical
Historical

NOTES TO THE ABRIDGED FINANCIAL STATEMENTSfor the year ended 31 December 2019
18 INVENTORIES - NON CURRENT PORTION 2019 2018 2019 2019 ZWL ZWL ZWL ZWL
Balance at 1 January 54 707 776 60 450 468 8 807 711 9 732 259Additions to stockpiles - 1 747 004 - 281 260Sales (6 188 512) (7 489 696) (690 516) (1 205 808)
Balance at 31 December 48 519 264 54 707 776 8 117 195 8 807 711
Balance at end of year is classified as follows: Non-current portion 28 572 626 42 313 145 5 891 543 6 812 230Current portion (included in inventories note 20) 19 946 638 12 394 631 2 225 652 1 995 481 48 519 264 54 707 776 8 117 195 8 807 711
The Company accumulated coal fines over the years for which an active market was identified in 2009. Coal fines in excess of the average annual uptake of the product have been classified as non-current assets. No coal fines were written down in 2019 (2018: ZWL nil).
16 INVESTMENTS ACCOUNTED FOR USING THE EQUITY METHOD
2019 2018 2019 2018 ZWL ZWL ZWL ZWL
Investments in associates (note 16.1) 146 010 146 010 23 507 23 507 Investments in joint venture (note 16.2) 91 636 240 91 636 240 14 753 031 14 753 031 91 782 250 91 782 250 14 776 538 14 776 53816.1 Investments in associates
Carrying amount as at 1 January 146 010 - 23 507 - Share of profit/(loss) - 146 010 - 23 507
Carrying amount as at 31 December 146 010 146 010 23 507 23 507
The Company holds a 49% voting and equity interest in Clay Products (Private) Limited. Hwange Colliery Company Limited also holds a 44% voting and equity interest in Zimchem Refineries (Private) Limited. The investments are accounted for under the equity method.
The shares are not publicly listed on a stock exchange and hence published price quotes are not available. The aggregate amounts of certain financial information of the associates can be summarised as follows:
16.2 Investment in joint venture Carrying amount as at 1 January 91 636 240 91 636 240 14 753 031 14 753 031
17 INTANGIBLE ASSETS Exploration ERP and development evaluation Mining and other asset rights software Total ZWL ZWL ZWL ZWL
2019 Cost/ Gross carrying amount Balance at 1 January 2019 47 858 1 242 270 12 600 531 13 890 659Additions - - - -
Balance at 31 December 2019 47 858 1 242 270 12 600 531 13 890 659 Amortisation and impairment Balance at 1 January 2019 - 1 062 837 9 806 324 10 869 161Amortisation - 92 000 1 866 350 1 958 350 Balance at 31 December 2019 - 1 154 837 11 672 674 12 827 511 Carrying amount 31 December 2019 47 858 87 433 927 857 1 063 148
2018 Cost/ Gross carrying amount Balance at 1 January 2018 47 858 1 242 270 12 600 531 13 890 660Additions - - - - Balance at 31 December 2018 47 858 1 242 270 12 600 531 13 890 660 Amortisation and impairment Balance at 1 January 2018 - 1 000 723 8 546 271 9 546 994Amortisation - 62 114 1 260 053 1 322 167 Balance at 31 December 2018 - 1 062 837 9 806 324 10 869 161 Carrying amount 31 December 2018 47 858 179 433 2 794 207 3 021 499
2019 Cost/ Gross carrying amount Balance at 1 January 2019 7 705 200 000 2 028 630 2 236 335Additions - - - - Balance at 31 December 2019 7 705 200 000 2 028 630 2 236 335 Amortisation and impairment Balance at 1 January 2019 - 171 112 1 578 775 1 749 887Amortisation - 10 000 202 863 212 863 Balance at 31 December 2019 - 181 112 1 781 638 1 962 750 Carrying amount 31 December 2019 7 705 18 888 246 992 273 585 2018 Cost/ Gross carrying amount Balance at 1 January 2018 7 705 200 000 2 028 630 2 236 335Additions - - - - Balance at 31 December 2018 7 705 200 000 2 028 630 2 236 335 Amortisation and impairment Balance at 1 January 2018 - 161 112 1 375 912 1 537 024Amortisation - 10 000 202 863 212 863 Balance at 31 December 2018 - 171 112 1 578 775 1 749 887 Carrying amount 31 December 2018 7 705 28 888 449 855 486 448 The Company has an enterprise resource planning (ERP) software that supports the administration and control of the Company. Some modules for mine planning and marketing are still to be developed. Mining rights comprise coal mining claims which are yet to be mined. No intangible assets have been pledged as security for liabilities.
13.4 Diluted headline profit/(loss) per share Profit/(loss) used to determine diluted headline loss per share 3 451 680 855 (358 248 862) (95 726 116) (55 541 135) Weighted average number of ordinary shares in issue 183 720 699 183 720 699 183 720 699 183 720 699 Diluted headline profit/(loss) per share 18.79 (1.95) (0.52) (0.30)
Inflation Adjusted Historical
Hw
ange
Res
ults
Pag
e 3
14 PROPERTY, PLANT AND EQUIPMENT
Plant, Capital Freehold land machinery and Motor work in and builidngs movables vehicles progress TotalYear ended 31 December 2019 ZWL ZWL ZWL ZWL ZWL
Cost/gross carrying amount Balance at 1 January 1 832 979 118 718 915 611 24 877 167 5 295 996 2 582 067 892Additions - 36 766 275 6 943 884 3 455 460 47 165 619Reclassification of assets - - 105 837 ( 105 837) - Balance as at 31 December 1 832 979 118 755 681 886 31 926 888 8 645 619 2 629 233 511 Depreciation and impairment Balance at 1 January 31 539 189 117 747 488 2 228 020 2 351 208 153 865 905Depreciation charge for the year 7 651 664 24 415 608 1 011 920 - 33 079 192Impairment (reversal) - (31 679 993) - - (31 679 993) Balance as at 31 December 39 190 853 110 483 103 3 239 940 2 351 208 155 265 104
Carrying amount as at 31 December 1 793 788 265 645 198 783 28 686 948 6 294 411 2 473 968 407 Year ended 31 December 2018
Cost/ gross carrying amount Balance at 1 January 1 832 979 118 704 507 877 24 423 465 4 330 295 2 566 240 755Additions - 13 443 876 453 702 1 929 559 15 827 137Reclassification of assets - 963 858 - ( 963 858) - Balance as at 31 December 1 832 979 118 718 915 611 24 877 167 5 295 996 2 582 067 892 Depreciation and impairment Balance at 1 January 14 708 915 38 485 713 2 108 792 - 55 303 420Depreciation charge for the year 16 830 274 27 493 037 119 228 - 44 442 539Impairment - 51 768 738 - 2 351 208 54 119 946 Balance as at 31 December 31 539 189 117 747 488 2 228 020 2 351 208 153 865 905
Carrying amount at 31 December 1 801 439 929 601 168 123 22 649 147 2 944 788 2 428 201 987
Plant, Capital Freehold land machinery and Motor work in and builidngs movables vehicles progress TotalYear ended 31 December 2019 ZWL ZWL ZWL ZWL ZWL
Cost/gross carrying amount Balance at 1 January 102 833 842 119 513 371 3 327 665 5 295 996 230 970 874Additions - 12 432 678 2 172 804 3 455 460 18 060 942Revaluation 1 730 145 276 623 735 837 26 320 582 2 380 201 695Reclassification of assets - - 105 837 (105 837) - Balance as at 31 December 1 832 979 118 755 681 886 31 926 888 8 645 619 2 629 233 511 Depreciation and impairment Balance at 1 January 36 779 579 108 783 517 2 921 053 2 351 208 150 835 357Depreciation charge for the year 2 411 274 7 694 107 318 887 - 10 424 268Impairment (reversal) - (5 994 521) - - (5 994 521) Balance as at 31 December 39 190 853 110 483 103 3 239 940 2 351 208 155 265 104 Carrying amount at 31 December 1 793 788 265 645 198 783 28 686 948 6 294 411 2 473 968 407
Year ended 31 December 2018 Cost/ gross carrying amount Balance at 1 January 102 833 842 116 385 108 3 254 621 4 330 295 226 803 866Additions - 2 164 405 73 044 1 929 559 4 167 008Reclassification of assets - 963 858 - ( 963 858) - Balance as at 31 December 102 833 842 119 513 371 3 327 665 5 295 996 230 970 874 Depreciation and impairment Balance at 1 January 34 069 979 82 362 925 2 801 825 - 119 234 729Depreciation charge for the year 2 709 600 9 164 346 119 228 - 11 993 174Impairment - 17 256 246 - 2 351 208 19 607 454 Balance as at 31 December 36 779 579 108 783 517 2 921 053 2 351 208 150 835 357 Carrying amount at 31 December 66 054 263 10 729 854 406 612 2 944 788 80 135 517 14.1 Leases The Company has certain property that is held under a lease arrangement. As at 31 December 2019, the carrying amount of the property is ZWL 37 737 531 (2018: ZWL 670 930) and is included in freehold land and buildings. Finance lease liabilities are secured by the related assets held under finance leases. Future minimum lease payments at 31 December were as follows:
Minimum lease payments due Within 1 year 1 to 5 years After 5 years Total ZWL ZWL ZWL ZWL
31 December 2019 Principal repayments 600 000 100 000 300 000 1 000 000Finance charges accrued (72 766) - - (72 766)Total 527 234 100 000 300 000 927 234 31 December 2018 Principal repayments 5 190 209 621 135 400 006 6 211 350Finance charges accrued 1 932 910 - - 1 932 910Total 7 123 119 100 000 400 000 8 144 260
Minimum lease payments due Within 1 year 1 to 5 years After 5 years Total ZWL ZWL ZWL ZWL
31 December 2019 Principal repayments 600 000 100 000 300 000 1 000 000Finance charges accrued (72 766) - - (72 766)Total 527 234 100 000 300 000 927 234
31 December 2018 Principal repayments 500 000 100 000 400 000 1 000 000Finance charges accrued 311 190 - - 311 190Total 811 190 100 000 400 000 1 311 190
The lease agreement includes fixed lease payments and a purchase option at the end of the lease term. The agreements are non-cancellable but do not contain any further restrictions. No contingent rents were recognised as an expense in the reporting periods under review, and no future sublease income is expected to be received as all assets are used exclusively by the Company.
15 INVESTMENT PROPERTY 2019 2018 2019 2018 ZWL ZWL ZWL ZWL Valuation at 1 January 27 888 962 27 888 962 4 490 000 4 490 000Fair value gains (included in other gains and losses) 52 439 338 - 75 838 300 -At 31 December 80 328 300 27 888 962 80 328 300 4 490 000
15.1 The following amount has been recognised in the statement of comprehensive income:
Inflation Adjusted Historical 2019 2018 2019 2018 ZWL ZWL ZWL ZWL Rental income 3 301 684 2 891 545 1 107 743 465 525
Inflation Adjusted Historical
Inflation Adjusted
Historical
Inflation Adjusted
Historical
13 LOSS PER SHARE
2019 2018 2019 2019 ZWL ZWL ZWL ZW 13.1 Basic Profit/(loss) attributable to shareholders 3 475 687 378 (487 234 972) (91 109 521) (78 442 684) Weighted average number of ordinary shares in issue 183 720 699 183 720 699 183 720 699 183 720 699 Basic profit/(loss) per share 18.92 (2.65) (0.50) (0.43) Basic profit/(loss) per share is calculated by dividing the loss attributable to shareholders by the weighted average number of ordinary shares in issue during the year, excluding the average number of ordinary shares purchased by the Company and held as treasury shares. 13.2 Diluted
For profit/(loss) per share the weighted average number of ordinary shares in issue is adjusted to assume conversion of all dilutive potential ordinary shares. The Company has one category of dilutive potential ordinary shares being share options granted to employees. The profit/(loss) used in the calculation of all diluted loss per share measures are the same as those for the equivalent basic loss per share measures, as outlined above. In the diluted profit/(loss) per share the share options calculation is done to determine the number of shares that could have been acquired (determined as the average annual share price of the Company’s shares) based on the monetary value of the subscription rights attached to outstanding share options. This calculation serves to determine the “unpurchased” shares to be added to the ordinary shares outstanding for the purpose of computing the dilution; for the share option calculation no adjustment is made to profit/(loss).
2019 2018 2019 2019 ZWL ZWL ZWL ZW Profit/(loss) used to determine
diluted profit/(loss) per share 3 475 687 378 (487 234 972) (91 109 521) (78 442 684) Weighted average number of ordinary shares in issues 183 720 699 183 720 699 183 720 699 183 720 699 Diluted profit/(loss) per share 18.92 (2.65) (0.50) (0.43) 13.3 Profit/(loss) per share Headline profit/(loss) per share excludes all items of a capital nature and represents an after tax amount. It is calculated by dividing the headline profit/(loss) shown below by the number of shares in issue during the year: 2019 2018 2019 2019 ZWL ZWL ZWL ZW IAS 33 -Loss for the year 3 475 687 378 (487 234 972) (91 109 521) (78 442 684) Non - recurring items: Proceeds on sale of scrap (652 025) (1 500 799) (223 116) (241 624) Impairment of assets/(reversal) (31 679 993) 121 788 761 (5 994 521) 19 607 454 Stripping activity asset impairment - 45 965 792 - 7 400 290 Loss on disposal of Treasury Bills - 5 542 698 - 892 350 Tax effect of the above 8 325 495 (42 810 342) 1 601 042 (4 756 921) Headline profit/(loss) 3 451 680 855 (358 248 862) (95 726 116) (55 541 135) Weighted average number of ordinary shares in issue 183 720 699 183 720 699 183 720 699 183 720 699 Headline profit/(loss) per share 18.79 (1.95) (0.52) (0.30)
Inflation Adjusted Historical
Inflation Adjusted
Inflation Adjusted
Historical
Historical
9 FINANCE COSTS
2019 2018 2019 2018 ZWL ZWL ZWL ZWL
Interest on loans and overdrafts 57 752 661 108 607 736 18 898 671 17 485 367 Interest on leases 124 740 801 854 124 740 129 095 57 877 401 109 409 590 19 023 411 17 614 462
Interest on loans and overdraft comprise of interest charged on the Government of Zimbabwe treasury bills at a rate of 7% per annum , ZAMCO and EXIM loan and finance lease facilities at an interest rate of 7% and LIBOR + 3.5% per annum respectively.
10 SHARE OF LOSSES FROM EQUITY ACCOUNTED INVESTMENTS Included in this amount is the Company’s share of loss after tax from: Clay Products (Private) Limited - 146 010 - 23 507 Zimchem Refineries(Private) Limited - - - - Hwange Coal Gasification Company - - - - - 146 010 - 23 507 The share of profit of Zimchem Refiners (Private) Limited for the year ended 31 December 2019 amounting to ZWL280 399 was not recorded in these financial statements as the cumulative share of losses exceeds the carrying amount of the investment in the associate. Audited financial information for Hwange Coal Gasification Company and Clay products (Private) Limited was not yet available at the date of publication. 11 LOSS BEFORE TAX 2019 2018 2019 2018 ZWL ZWL ZWL ZWL
Profit/(loss) before tax for the year has been arrived at after charging the following: Expected credit losses 2 796 699 7 236 024 2 796 699 1 164 968 Amortisation 1 958 350 1 322 167 212 863 212 863 Audit fees 4 516 526 686 385 1 559 895 110 505 Depreciation on property, plant and equipment (note 14) 33 079 192 74 493 796 10 424 268 11 993 174 Impairment of assets (note 14) (31 679 993) 121 788 761 (5 994 521) 19 607 454 Directors’ emoluments - Executive Directors 2 579 328 2 739 609 564 574 441 065 - Non-Executive Directors - 443 304 - 71 370 Employee benefits expense (note 11.1) 219 471 107 118 605 171 48 593 398 19 094 910 11.1 Employee benefits expense Salaries and other contributions 152 516 718 110 661 612 46 480 688 17 816 032 Contribution to Mining Industry Pension Fund 65 478 513 6 052 172 1 662 925 974 373 Contribution to National Social Security Authority 1 475 876 1 891 580 449 785 304 536 219 471 107 118 605 364 48 593 398 19 094 941 12 INCOME TAX 12.1 Current tax: Current tax - - - - Deferred tax 666 503 660 - (78 631 903) - Income tax (credit)/expense 666 503 660 - (78 631 903) -
Inflation Adjusted Historical
Historical
Inflation Adjusted
Inflation Adjusted Historical
Inflation Adjusted Historical
Inflation Adjusted Historical

19. STRIPPING ACTIVITY ASSET
2019 2018 2019 2019 ZWL ZWL ZWL ZWL Balance at 1 January 9 138 591 55 104 383 1 471 273 8 871 563 Current year pre-stripping costs - - - - Provision for impairment - (45 965 792) - (7 400 290) Balance at 31 December 9 138 591 9 138 591 1 471 273 1 471 273 Balance at end of year allocated as follows: Non-current assets 9 138 591 9 138 591 1 471 273 1471 273 Current assets - - - - Balance at end of year 9 138 591 9 138 591 1 471 273 1 471 273
20 INVENTORIES
2019 2018 2019 2018 ZWL ZWL ZWL ZWL
Raw materials/consumables 59 816 205 38 203 592 19 030 111 6 150 610 Finished goods - Coal 68 121 316 54 673 254 68 121 317 8 802 153 - Coal fines (note 18) 19 946 638 12 394 631 2 225 652 1 995 481 147 884 159 105 271 477 89 377 080 16 948 244
During the year ended 31 December 2019, a total of ZWL1 385 212 (2018: ZWL NIL) worth of invento ries was included in profit and loss as an expense resulting from write down of inventories to net realisable value. No reversal of previous write-downs was recognised as a reduction of expense in 2019 (2018: nil)
21 TRADE AND OTHER RECEIVABLES Trade receivables, gross 109 649 647 207 549 138 109 649 647 33 414 497 Allowance for credit losses (27 392 661) (152 774 130) (27 392 661) (24 595 962)
Trade receivables, net 82 256 986 54 775 008 82 256 986 8 818 535 Other receivables 45 940 185 143 455 540 45 940 185 23 095 710 128 197 171 198 230 548 128 197 171 31 914 245
All amounts are short-term. The net carrying value of trade receivables is considered a reasonable approximation of fair value. Included in trade receivables is an amount of ZWL 1 319 923 (2018: ZWL 16 676 706) relating to related party receivables (note 22.2).
The Company adopted IFRS 9 “Financial instrustment” from 1 January 2018 which resulted in changes in the accouting policy on trade receivables. The Company elected the simplified approach to measuring expected credit losses which uses a lifetime expected loss allowance for all trade receivables and contract assets. To measure the expected credit losses, the credit risk and credit profile of each receivable was considered on an individual basis.
All of the Company’s trade and other receivables have been reviewed for indicators of impairment. Certain trade receivables were found to be impaired and an increase in allowance for credit losses of ZWL 2 796 999 (2018:ZWL 1 164 968 ) has been recognised. The movement in the allowance for credit losses can be reconciled as follows: Balance 1 January 24 595 962 145 538 106 24 595 962 23 430 994 Increase in allowance for credit losses 2 796 699 7 236 024 2 796 699 1 164 968
Balance 31 December 27 392 661 152 774 130 27 392 661 24 595 962
The table below describes the credit loss allowanced recognised on balance sheet.
Current More than More than More than More than Total 30 days 60 days 90 days 120 daysTrade receivable past due past due past due past due ZWL ZWL ZWL ZWL ZWL ZWL Gross carrying amount 22 950 550 29 733 775 19 403 368 23 932 604 13 629 350 109 649 647Average expected loss rate 0.5% 9.6% 30.2% 20.6% 100.0% 25.0%Credit loss allowance 114 753 2 858 625 5 859 817 4 930 116 13 629 350 27 392 661
22 RELATED PARTY BALANCES AND TRANSACTIONS
Included in the trade receivable and trade payable balances are related party balances that resulted from transactions that occurred between Hwange Colliery Company Limited and its related parties.
2019 2018 2019 2018 ZWL ZWL ZWL ZWL
Related party receivables: Hwange Coal Gasification Company 1 303 851 101 772 120 1 303 851 16 384 863 Clay Products (Private) Limited 13 900 333 959 13 900 53 766 Zimchem Refineries (Private) Limited 2 172 1 478 780 2 172 238 077 1 319 923 103 584 859 1 319 923 16 676 706
Related party payables: Hwange Coal Gasification Company 4 338 672 86 908 390 4 338 672 13 991 868 Zimchem Refineries (Private) Limited 21 151 153 041 21 151 24 639 4 359 823 87 061 431 4 359 823 14 016 507
23 CASH AND CASH EQUIVALENTS
2019 2018 2019 2018 ZWL ZWL ZWL ZWL
For purposes of statement of cash flows, cash and cash equivalents include cash on hand and in banks net of outstanding bank overdrafts.
Bank and cash balances 11 380 994 9 706 471 11 380 994 1 562 699 Bank overdraft - - - - 11 380 994 9 706 471 11 380 994 1 562 699
24 SHARE CAPITAL AND RESERVES
204 000 000 Ordinary shares of ZWL0.25 each 500 253 421 500 253 421 51 000 000 51 000 000 Issued and fully paid 110 237 432 Ordinary shares of ZWL0.25 each 270 326 728 270 326 728 27 559 358 27 559 358 5 925 699 Ordinary shares issued under share option scheme 14 851 043 14 851 043 1 514 039 1 514 039 67 557 568 ‘’A’’ Ordinary shares of ZWL0.25 each 165 666 199 165 666 199 16 889 392 16 889 392 450 843 969 450 843 969 45 962 789 45 962 789
25 LEASE LIABILITY
2019 2018 2019 2019 ZWL ZWL ZWL ZWL Non-current 400 000 3 105 675 400 000 500 000 Current 527 234 5 038 585 527 234 811 190
927 234 8 144 260 927 234 1 311 190 The lease liability carrying amount is disclosed as follows: 26.1 OK Zimbabwe Long term portion 400 000 3 105 675 400 000 500 000 Add: Short term portion 527 234 5 038 585 527 234 811 190 927 234 8 144 260 927 234 1 311 190 Lease liability Principal 1 000 000 6 211 350 1 000 000 1 000 000 Repayment/(Finace charges capitalised) (72 766) 1 932 910 (72 766) 311 190
927 234 8 144 260 927 234 1 311 190 This OK Zimbabwe lease is a Build Operate and Transfer agreement for the establishment of a super market building which OK Zimbabwe funded the construction of the building for its own occupation for a period of nine years and eleven months. The estimated cost of construction is ZWL 1 000 000 and the interest rate is 10 % per annum. 26 BORROWINGS 26.1 Long term loans Export Import Bank of India (EXIM) - 89 629 782 - 14 430 000 Government of Zimbabwe 162 307 704 858 250 271 162 307 704 138 174 513 Zimbabwe Asset Management Corporation (ZAMCO) 17 384 581 104 281 108 17 384 581 16 788 799
179 692 285 1 052 161 161 179 692 285 169 393 312 Less current portion of loan - - - -
179 692 285 1 052 161 161 179 692 285 169 393 312 26.2 Short term loans CBZ - 3 388 012 - 545 455 26.3 Borrowing terms Export Import Bank of India (EXIM) This is a USD 13 005 760 (principal and interest) loan guaranteed by the Reserve Bank of Zimbabwe, taken for the purposes of financing the purchase of coal mining equipment. Interest is charged at a rate of LIBOR + 3.5 % p.a. The Governement of Zimbabwe took over the loan in February 2019. Government Of Zimbabwe As part of the ongoing restructuring plan, the Government of Zimbabwe through the Ministry of Finance and Economic Development issued treasury bills of USD 41 million and USD 18.216 million in settlement of the Mota Engil and RBZ/PTA Bank loan, respectively. The Government of Zimbabwe has agreed that the Government support be treated as a loan payable over 15 years with a 7% interest per annum in accordance with the provisions of the scheme of arrangement. An additional USD 52.3 million worth of treasury bills were issued towards the Scheme of Arrangement bringing the total support from the Government of Zimbabwe to USD 111.5 million worth of treasury bills, as approved by the Ministry of Finance and Economic Development.
Zimbabwe Asset Management Corporation (ZAMCO) Zimbabwe Asset Management Corporation (ZAMCO) took over USD 16 201 625 (principal and interest) outstanding on the BancABC loan on 1 September 2015 in a debt restructuring exercise. However, this amount was converted through the scheme of arrangement to a debenture amounting to USD 15 571 475 from 14 December 2017. The interest is charged on the debenture at the rate of 7% per annum on the daily debit balance and compounded semi annually. The maturity date for the debenture is 14 December 2025.
27 TRADE AND OTHER PAYABLES Trade and other payables- Long term 2019 2018 2019 2019 ZWL ZWL ZWL ZWL Trade 465 107 488 558 236 907 465 107 488 89 873 683 Other 83 517 573 761 744 867 83 517 573 122 637 568
548 625 061 1 319 981 774 548 625 061 212 511 251 Trade and other payables- Current Trade 104 882 523 102 355 881 104 882 523 16 478 846 Other 71 564 016 137 675 668 71 564 016 22 165 176
176 446 539 240 031 549 176 446 539 38 644 022 28 INCOME TAX LIABILITY Balance at 1 January 10 054 850 62 454 193 10 054 850 10 054 850 Movement - - - - Balance at 31 December 10 054 850 62 454 193 10 054 850 10 054 850 29 PROVISIONS Provision for rehabilitation (note 30.1) 13 069 319 53 937 346 13 069 319 8 683 675 Other provisions (note 30.2) 12 579 434 46 449 006 12 579 434 7 478 085
25 648 753 100 386 352 25 648 753 16 161 760 29.1 Provision for rehabilitation At 1 January 8 683 675 44 830 463 8 683 675 7 217 507 Charged to profit or loss: Additional provisions made during the year 4 385 644 9 106 883 4 385 644 1 466 168 Amounts used during the year - - - - At 31 December 13 069 319 53 937 346 13 069 319 8 683 675 The Company has an obligation to undertake rehabilitation and restoration when environmental disturbance is caused by the ongoing mining activities. The provision for rehabilitation costs recognised in these financial statements relates to previously mined areas. The rehabilitation provision included in the financial statements is an estimate of the cost that will be incurred for the rehabilitation and restoration of the environment. The Directors are aware of the Com pany’s responsibility for the rehabilitation and restoration of the environment and have come up with an estimate of the costs that would be incurred to rehabilitate and restore the mined areas. 29.2 Other provisions Death benefits 4 901 005 25 440 454 4 901 005 4 095 801 Leave pay and bonus provisions 7 678 429 21 008 552 7 678 429 3 382 283
12 579 434 46 449 006 12 579 434 7 478 084
30 EVENTS AFTER REPORTING PERIOD
Since 31 December 2019, the spread of COVID-19 has severely impacted many local economies around the globe. In many countries, businesses are being forced to cease or limit operations for long or indefinite periods of time. Measures taken to contain the spread of the virus, including travel bans, quarantines, social distancing, and closures of non-essential services have triggered significant disruptions to businesses worldwide, resulting in an economic slowdown. Global stock markets have also experienced great volatility and a significant weakening. Governments and central banks have responded with monetary and fiscal interventions to stabilise economic conditions. The Company has determined that these events are non-adjusting subsequent events. Accordingly, the financial position and results of operations as of and for the year ended 31 December 2019 have not been adjusted to reflect their impact. The duration and impact of the COVID-19 pandemic, as well as the effectiveness of government and central bank responses, remains unclear at this time. It is not possible to reliably estimate the duration and severity of these consequences, as well as their impact on the financial position and results of the Company for future periods.
AUDITOR’S STATEMENT
These summary financial statements should be read in conjunction with the complete set of financial statements for the year ended 31 December 2019, which have been audited by Grant Thornton Chartered Accountants (Zimbabwe), in accordance with International Standards on Auditing.
The auditors have issued an adverse audit opinion on the inflation adjusted financial statements with respect to going concern, financial results of equity accounted investments not availed, non-compliance with International Accounting Standard (IAS) 21 - The Effect of Changes in Foreign Exchange Rates, International Accounting Standard (IAS) 29 – Financial Reporting in Hyperinflationary Economies, and the extent to which fair values for assets, transactions and liabilities presented in the consolidated financial statements are affected by the prevailing economic environment.
The Auditors have included a section on key audit matters. The key audit matters were with respect to the Revenue recognition, allowances for credit losses, trade and other payables and income taxes. There is an emphasis of matter regarding the impact of COVID-19 pandemic on the Company’s operations and the fact that it is not possible to reliably estimate the duration and severity of the consequences thereof. The auditor’s report on the inflation adjusted financial statements which form the basis of these financial results is available for inspection at the Company’s registered office.
The Engagement Partner on the audit resulting in this auditor’s report is Farai Chibisa (PAAB Number 0547).
Inflation Adjusted Historical
Inflation Adjusted Historical
Inflation Adjusted Historical
Inflation Adjusted Historical
Inflation Adjusted Historical
Inflation Adjusted Historical
NOTES TO THE ABRIDGED FINANCIAL STATEMENTSfor the year ended 31 December 2019
Hw
ange
Res
ults
Pag
e 4