hy 2021 results presentation refining nz
TRANSCRIPT

REFINING NZHY 2021 RESULTS
PRESENTATION
1
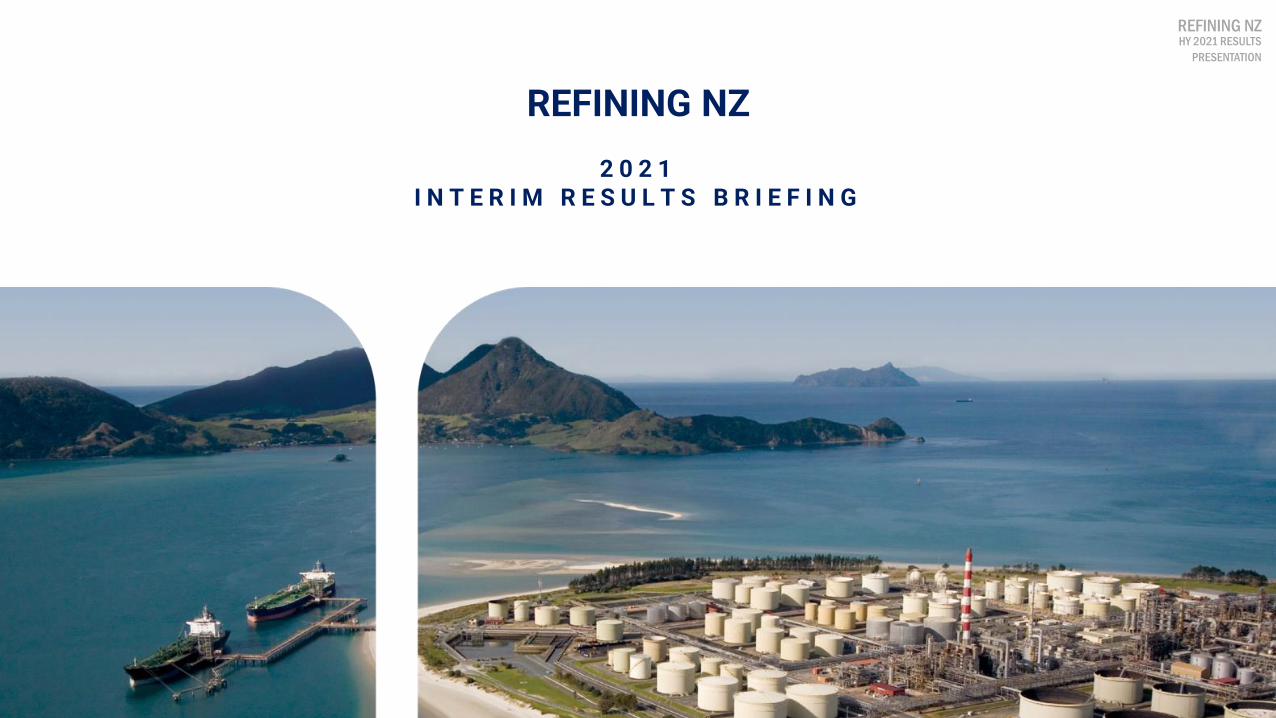
REFINING NZ
2 0 2 1I N T E R I M R E S U L T S B R I E F I N G
REFINING NZHY 2021 RESULTS
PRESENTATION
2
DISCLAIMER• This presentation contains forward looking statements concerning the financial condition, results and operations of The New Zealand Refining Company Limited
(hereafter referred to as “Refining NZ”).
• Forward looking statements are subject to the risks and uncertainties associated with the refining environment, including price and foreign currency fluctuations,
regulatory changes, environmental factors, production results, demand for Refining NZ’s products or services and other conditions. Forward looking statements
are based on management’s current expectations and assumptions and involve known and unknown risks and uncertainties that could cause actual results,
performance or events to differ materially from those expressed or implied in these statements.
• Forward looking statements include among other things, statements concerning the potential exposure of Refining NZ to market risk and statements expressing
management’s expectations, beliefs, estimates, forecasts, projections and assumptions. Forward looking statements are identified by the use of terms and
phrases such as “anticipate”, “believe”, “could”, “estimate”, “expect”, “goals”, “intend”, “may”, “objectives”, “outlook”, “plan”, “probably”, “project”, “risks”, “seek”,
“should”, “target”, “will” and similar terms and phrases.
• Readers should not place undue reliance on forward looking statements. Forward looking statements should be read in conjunction with Refining NZ’s financial
statements released with this presentation. This presentation is for information purposes only and does not constitute legal, financial, tax, financial product advice
or investment advice or a recommendation to acquire Refining NZ’s securities and has been prepared without taking into account the objectives, financial
situation or needs of individuals. Before making an investment decision, you should consider the appropriateness of the information having regard to your own
objectives, financial situation and needs and consult an NZX Firm or solicitor, accountant or other professional adviser if necessary.
• In light of these risks, results could differ materially from those stated, implied or inferred from the forward-looking statements contained in this announcement.
Refining NZ does not guarantee future performance and past performance information is for illustrative purposes only. To the maximum extent permitted by law,
the directors of Refining NZ, Refining NZ and any of its related bodies corporate and affiliates, and their officers, partners, employees, agents, associates and
advisers do not make any representation or warranty, express or implied, as to accuracy, reliability or completeness of the information in this presentation, or
likelihood of fulfilment of any forward-looking statement or any event or results expressed or implied in any forward-looking statement, and disclaim all
responsibility and liability for these forward-looking statements (including, without limitation, liability for negligence).
• Except as required by law or regulation (including the NZX Listing Rules), Refining NZ undertakes no obligation to provide any additional or updated information
whether as a result of new information, future events or results or otherwise.
• Forward looking figures in this presentation are unaudited and may include non-GAAP financial measures and information. Not all of the financial information
(including any non-GAAP information) will have been prepared in accordance with, nor is it intended to comply with: (i) the financial or other reporting
requirements of any regulatory body; or (ii) the accounting principles generally accepted in New Zealand or any other jurisdiction with IFRS. Some figures may be
rounded and so actual calculation of the figures may differ from the figures in this presentation. Non-GAAP financial information does not have a standardised
meaning prescribed by GAAP and therefore may not be comparable to similar financial information presented by other entities. Non-GAAP financial information in
this presentation is not audited or reviewed.
• Each forward looking statement speaks only as of the date of this announcement,19 August 2021. The financial statements referenced in this presentation have
been prepared based on existing Group operations under the current Processing Agreements, as at 18 August 2021.

REFINING NZHY 2021 RESULTS
PRESENTATION
HY 21 PERFORMANCE
STRATEGIC REVIEW
UPDATE

REFINING NZHY 2021 RESULTS
PRESENTATION
4
PERFORMANCE SUMMARY VS PLAN
Safe, reliable and compliant operations
Turnaround 2021 executed safely, on time and within budget
Cash break-even operations at the Fee Floor 1
Conclude import terminal negotiations with customers
Progress required shareholder and lender approvals and detailed planning
Long term plan to unlock infrastructure value
1 Cash neutral excludes Strategic Review restructuring and implementation costs
P
P
Create the time to negotiate with customers
P
P
Refining NZ has maintained cash neutral operations at the Fee Floor, and received a shareholder mandate to proceed with an
import terminal conversion

REFINING NZHY 2021 RESULTS
PRESENTATION
5
HY2021 PERFORMANCE HIGHLIGHTS Safely delivered cash neutral operations at the Fee Floor
HY 21 HY 20
Personal TRCF [1] 0 0.31
ProcessTier 1 [1] 2 0
Tier 2 [1] 0 0
Releases outside of consent 9 1
Refinery Throughput Mbbl 13.1 15.4
RAP Throughput Mbbl 7.1 7.5
Operational availability % 92.3 96.8
Cashflow from operations NZ$M 22 14
Net debt [2] NZ$M 230 231
Operating costs [3] NZ$M 62 88
Capital Expenditure [4] NZ$M 21 22
PSafe operations
PCash neutral at the Fee Floor
PDeliver to customer plan
$
1. For a full definition please refer to the Glossary in Appendix 1
2. Comparative for net debt as at 31 December 2021
3. Excludes natural gas passthrough costs, but includes strategic review and restructuring costs
4. Payments for property, plant and equipment (cashflow basis)

REFINING NZHY 2021 RESULTS
PRESENTATION
6
SAFE OPERATIONS A record performance with no recordable incidents in over 19 months
• 19 months of operations with no recordable incidents, including
through the 2021 turnaround, reflecting a record personal safety
performance for Refining NZ
• Two Tier 1[1] process safety events:
• A fire (which was quickly extinguished with no significant
damage to the plant) occurred in the hydrocracking unit
when shutting down the plant for turnaround
• An LPG pipeline leak was quickly isolated and repaired
• Actions taken to further strengthen existing controls
• Site resource consent, covering refinery and import terminal
operations, renewed for 35 years
• Releases outside of consent involved the unauthorised use of
non-compliant fire-fighting foam during recent fire training
exercises
• Independent investigation into the incident
• Steps promptly taken to mitigate effects of foam discharge
• On-site controls further strengthened
• Ongoing testing to determine if any further treatment or
remediation is required
1 For a full definition please refer to Glossary in Appendix 1
0.0
0.1
0.2
0.3
0.4
0.5
0.6
0.7
0.8
0.9
1.0
0
2
4
6
8
10
2017 2018 2019 2020 2021
#/200k hoursNumber
TOTAL RECORDABLE CASES[1]
Other TRC (medical treatment, restricted work cases) LHS
Lost time injuries LHS
TRCH, RHS
LTIF, RHS
0
2
0 0
2
4
3
0 0
0
0
1
2
3
4
5
6
2017 2018 2019 2020 2021
PROCESS SAFETY INCIDENTSNumber (for calendar year) Tier Two Tier One
REFINING NZHY 2021 RESULTS
PRESENTATION
7
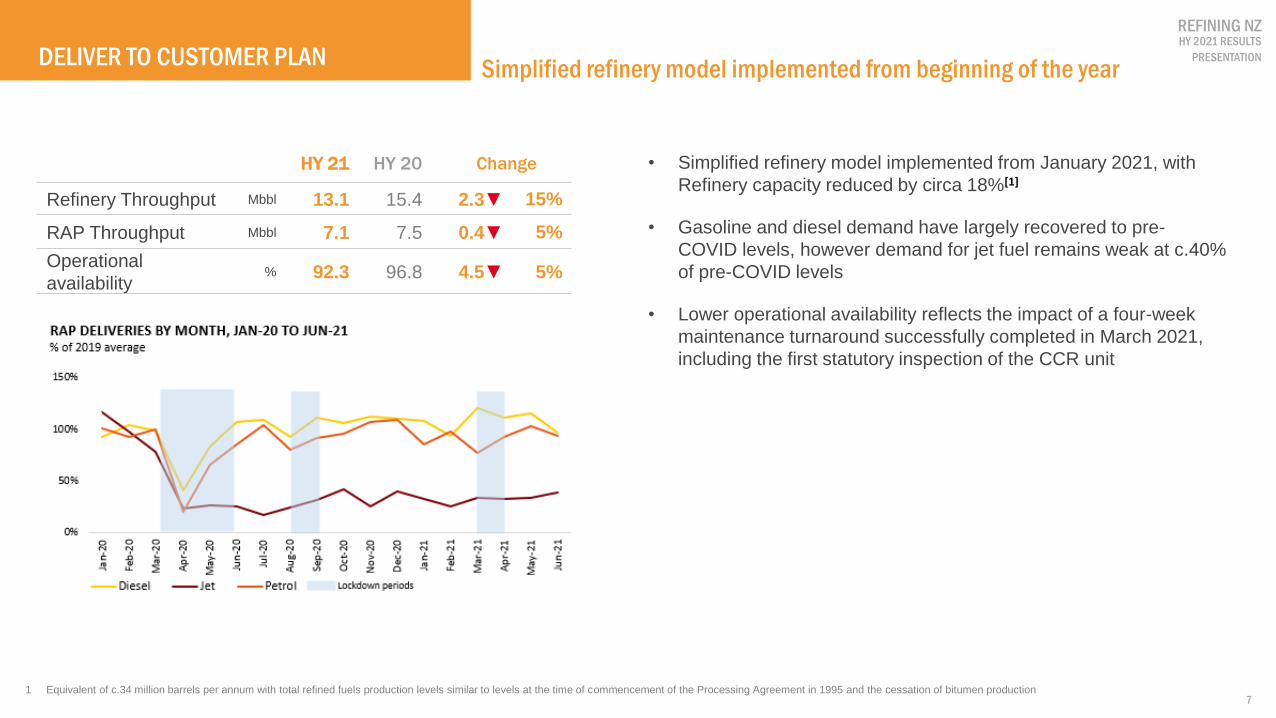
DELIVER TO CUSTOMER PLAN
HY 21 HY 20 Change
Refinery Throughput Mbbl 13.1 15.4 2.3▼ 15%
RAP Throughput Mbbl 7.1 7.5 0.4▼ 5%
Operational
availability% 92.3 96.8 4.5▼ 5%
Simplified refinery model implemented from beginning of the year
• Simplified refinery model implemented from January 2021, with
Refinery capacity reduced by circa 18%[1]
• Gasoline and diesel demand have largely recovered to pre-
COVID levels, however demand for jet fuel remains weak at c.40%
of pre-COVID levels
• Lower operational availability reflects the impact of a four-week
maintenance turnaround successfully completed in March 2021,
including the first statutory inspection of the CCR unit
1 Equivalent of c.34 million barrels per annum with total refined fuels production levels similar to levels at the time of commencement of the Processing Agreement in 1995 and the cessation of bitumen production

REFINING NZHY 2021 RESULTS
PRESENTATION
81 The Singapore Complex Margin is calculated using Platts Dubai crude and Singapore product prices, VLCC freight to Singapore, and the International Energy Agency’s Dubai complex refinery yields adjusted for fuel & loss.
US$/BARRELHY 20 HY 21 Change
Singapore Complex Margin
(SCM)1 (1.60) (2.09) (0.49)
Freight 1.61 1.74 0.13
Product quality 0.76 0.74 (0.02)
Plant availability (0.22) (0.42) (0.20)
Crude cost and yield 1.29 3.24 1.95
Refining NZ uplift 3.42 5.28 1.86
RNZ GRM 1.82 3.19 1.37
REFINING MARGINSWeak refining margins due to excess capacity exacerbated by
COVID-19 demand impacts
• Negative Singapore complex margins continued in HY21
• Stronger Refining NZ uplift due to the lower price for
crudes processed by Refining NZ relative to the Dubai
crude price coupled with a lower fuel oil make
• Fee Floor contributions of c.$29 million (HY20: $39 million)

REFINING NZHY 2021 RESULTS
PRESENTATION
9
HY2021 FINANCIAL SNAPSHOT
1. For further information, please refer to our HY21 Financial Statements, available at http://www.refiningnz.com/investor-centre.aspx
2. For a reconciliation of these Non-GAAP measures, please refer to Appendix 2 and our HY21 Financial Statements for further detail
3. Payments for property, plant and equipment (cashflow basis)
4. For a full definition please refer to the Glossary in Appendix 1
5. HY20 Net Loss after tax impacted by half-year impairment of c.$158 million (net of tax)
Maintained cash break-even operations at the Fee Floor
• Fee Floor in operation since 1H20, protecting
against the full extent of margin and demand
decline
• Refinery revenue lower due principally to reduced
natural gas supply (c.$4.3 million)
• Infrastructure revenue includes c.$5 million in
terminal fees from the import of refined products
during the turnaround
• Four-week maintenance turnaround safely
completed, to schedule and below budget, at a
total cost of $21 million (including $12 million in
HY21)
• Maintained cash neutral operations at the Fee
Floor after implementing simplified refinery
changes, including cost of turnaround
• No dividend
HY 21 HY 20 Change
Revenue - Refinery [1] NZ$M 90.3 96.5 ▼ 6%
Revenue - Infrastructure [1] NZ$M 25.1 22.6 11%
EBITDA [2] NZ$M 41.5 15.4 169%
Adjusted EBITDA [2] NZ$M 34.5 20.5 68%
Capital Expenditure [3] NZ$M 21.0 22.0 ▼ 5%
Free cash flow [4] NZ$M 1.2 (8.3) nm
Net Profit/(Loss) after tax NZ$M (4.9) (186.3) 97%
Net Debt [4] NZ$M 230.1 231.3 ▼ nm

REFINING NZHY 2021 RESULTS
PRESENTATION
10
A significant improvement in EBITDA through refinery simplificationHY21 v HY20 EBITDA COMPARISON
HY 21 HY 20
Processing Fee NZ$M 70.0 70.0
Refinery Throughput Mbbl 13.1 15.4
GRM US$/bbl 3.19 1.82
RAP Throughput Mbbl 7.1 7.5
Pipeline FeeNZ$M
14.9 16.3
Terminal FeeNZ$M
5.3 0.9
Non-cash release includes:
Pension Fund settlement gain $6.2m
Medical Scheme settlement gain $2.7m
Stock Provision HY20 $2.7m

REFINING NZHY 2021 RESULTS
PRESENTATION
HY 21 PERFORMANCE
STRATEGIC REVIEW
UPDATE

REFINING NZHY 2021 RESULTS
PRESENTATION
12
STRATEGIC REVIEW HIGHLIGHTS 1H21
In-principle agreement with bp and Z Energy on commercial terms
Shareholder approval for the Import Terminal Conversion with 99% vote in favour (including Mobil)
Initial assessment complete of potential Marsden Point repurposing options
P
Front End Engineering Design and detailed planning well progressed
On track for Final Investment Decision end of Q3/21 and terminal conversion by mid-2022
P
P
P
P
P
Significant progress made to deliver Strategic Review outcomes
Lender consent for Conversion and funding secured

REFINING NZHY 2021 RESULTS
PRESENTATION
13
TIMELINE FOR STRATEGIC REVIEW
Import terminal
assessment/planning
(July 2020-now)
Final Investment Decision
(FID) / Binding customer
agreements
(Target – end Q3 2021)
Front-end engineering & design and detailed planning
Customer term sheet & TSA negotiations
Refinery run-down planning and execution
Refinery decommissioning (2 years)
Site repurposing (10+ years)
Ongoing terminal works(5-6 years)
Import terminal works
Site repurposing opportunity identification
Shareholder and lender approvals
Workforce developmentWorkforce transition
(2 years)
Import terminal
commencement
(Target – by mid-2022)
Customer consultation & negotiation
Workforce engagement, planning and consultation
Simplified Refinery
implementation
(July 2020 - Jan 2021)
Strategic Review
Phase 1
(April-June 2020)
Consultation with Government, employees, Iwi and community on our future
Refinery Transition Working group formed to support transition
Clear timeline to final decision and for transition
REFINING NZHY 2021 RESULTS
PRESENTATION
14
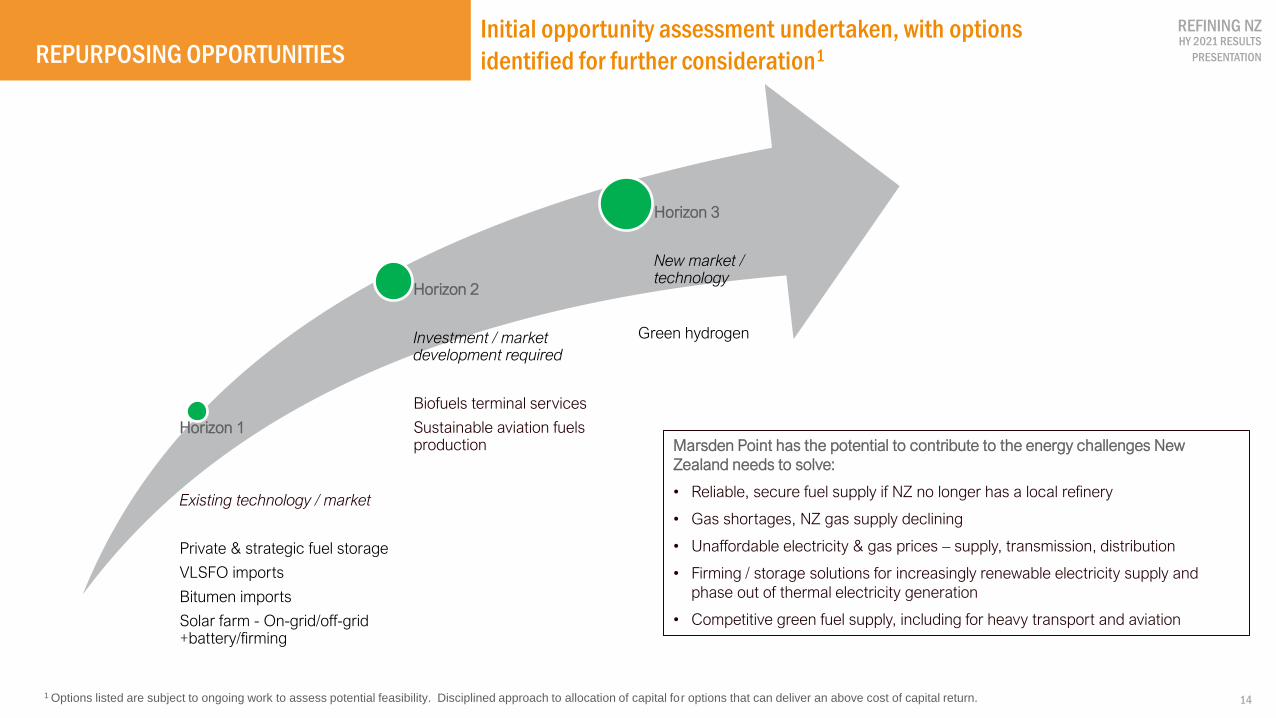
REPURPOSING OPPORTUNITIES
Horizon 1
Existing technology / market
Private & strategic fuel storage
VLSFO imports
Bitumen imports
Solar farm - On-grid/off-grid +battery/firming
Horizon 2
Investment / market development required
Biofuels terminal services
Sustainable aviation fuels production
Horizon 3
New market / technology
Marsden Point has the potential to contribute to the energy challenges New
Zealand needs to solve:
• Reliable, secure fuel supply if NZ no longer has a local refinery
• Gas shortages, NZ gas supply declining
• Unaffordable electricity & gas prices – supply, transmission, distribution
• Firming / storage solutions for increasingly renewable electricity supply and
phase out of thermal electricity generation
• Competitive green fuel supply, including for heavy transport and aviation
Green hydrogen
Initial opportunity assessment undertaken, with options
identified for further consideration1
1 Options listed are subject to ongoing work to assess potential feasibility. Disciplined approach to allocation of capital for options that can deliver an above cost of capital return.
REFINING NZHY 2021 RESULTS
PRESENTATION
15
REFINING NZ
2 0 2 1I N T E R I M R E S U L T S B R I E F I N G
REFINING NZHY 2021 RESULTS
PRESENTATION
16
APPENDIX 1 GLOSSARY
• LTIF – Lost time injury frequency (rolling 12 month per 200,000 hours)
• TRCF – Total recordable case frequency (rolling 12 month per 200,000 hours)
• Tier 1 Process Safety Event (API 754) – A tier 1 Process Safety Event (PSE) is an unplanned or uncontrolled release of any material, including non-toxic and
non-flammable, from a process which results in one or more of the following: A LTI and/or fatality; A fire or explosion resulting in greater than or equal to
$25,000 of direct cost to the company; A release of material greater than the threshold quantities given in Table 1 of API 754 in any one-hour period; A
officially declared community evacuation or community shelter-in-place.
• Tier 2 Process Safety Event (API 754) – A tier 2 Process Safety Event (PSE) is an unplanned or uncontrolled release of any material, including non-toxic and
non-flammable, from a process which results in one or more of the following: A recordable injury; A fire or explosion resulting in greater than or equal to $2,500
of direct cost to the company; A release of material greater than the threshold quantities given in Table 2 of API 754 in any one-hour period.
• Net debt – Net debt comprises total borrowings less cash and cash equivalents
• Operating “cash neutral” – maintaining a “flat” net debt position (i.e. total lender debt, including subordinated notes, less and cash/funds held on deposit),
after paying all operating, capital and funding costs out of the company’s revenue receipts. This excludes Strategic Review restructuring costs.
• Reported EBITDA – Earnings Before Depreciation and Disposal Costs, Impairment of assets, Finance costs and Income Tax in a non-GAAP measure. Please
refer to Appendix II for a reconciliation
• Adjusted EBITDA - Reported EBITDA adjusted for other non-cash expenses, and used for bank covenant purposes
• Free Cash Flow – Net cash generated from operations less investing activities

REFINING NZ2020 ANNUAL RESULTS
PRESENTATION
17
APPENDIX 2 NON-GAAP MEASURES
Refining NZ’s standard profit measure prepared under New Zealand Generally Accepted Accounting Practice (NZ GAAP) is net profit/(loss) after
tax. Refining NZ has used non-GAAP measures when discussing financial performance in this Full-Year Report. The Directors and Management
Team believe that these measures provide useful information as they are used internally to evaluate segmental and total Group performance, to
establish operating and capital budgets as well as being used for bank covenant purposes.
Non-GAAP profit measures are not prepared in accordance with NZ IFRS (New Zealand equivalents to International Financial Reporting
Standards) and are not uniformly defined, therefore the non-GAAP profit measures included in this report are not comparable with those used by
other companies. They should not be used in isolation or as a substitute for GAAP profit measures as reported by Refining NZ in accordance with
NZ IFRS.
GROUP GROUP
30 JUNE 30 JUNE
2021 2020
NOTE $000 $000
Reported net loss after tax for the period (GAAP) (4,914) (186,348)
Add back:
Income tax (785) (70,879)
Net finance costs 5,422 6,406
Impairment of assets 3 - 218,903
Depreciation and disposal costs 41,781 47,300
Reported EBITDA 41,504 15,382
Add back non-cash expenses:
Stock write-offs 682 3,269
Defined benefit pension fund (including settlement) 12 (7,418) 1,720
Non-cash share rights cost 7 115 -
Interest income 47 146
Profit/(loss) on disposal (389) -
Adjusted EBITDA 34,541 20,517

REFINING NZ2020 ANNUAL RESULTS
PRESENTATION
18
REFINING NZ
2 0 2 1I N T E R I M R E S U L T S B R I E F I N G