hy` 4hyjo - centralbank.go.ke · assets for the quarter ended march 31, ... non-performing loans,...
TRANSCRIPT

C E N T R A L B A N K O F K E N Y ACommercial Banks’ Credit Officer Survey January - March 2018
1

C E N T R A L B A N K O F K E N Y ACommercial Banks’ Credit Officer Survey January - March 2018
2
1.0 BACKGROUND
1.1 COMMERCIAL BANKS’ CREDIT OFFICER SURVEY
Credit risk is the single largest factor affecting the soundness of financial institutions and the financial system as a whole. Lending is also the principal business for banks. The ratio of total loans to total assets for the quarter ended March 31, 2018 was 58.42 percent; a decrease of 1.21 percent from 59.44 percent reported in the quarter ended December 2017.
The Central Bank of Kenya (CBK) undertakes a quarterly Credit Officer Survey to identify the potential drivers of credit risk. The Credit Officer Survey requires senior credit officers of banks to indicate their banks perception or actual position in the immediate past quarter and the subsequent quarter in terms of demand for credit, credit standards, interest rates, asset quality and credit recovery efforts.
1.2 SURVEY METHODOLOGY
Senior Credit Officers1 responsible for credit in all operating commercial banks complete the Credit Survey questionnaire.
For the quarter ended March 2018, 40 operating commercial banks and 1 mortgage finance company participated in the Commercial Banks Credit Officer Survey. The survey sought to establish the lending behavior in the banking sector in respect to all the eleven economic sectors. Questions were posed on demand for credit, standards for approving loans, interest rates, non-performing loans, the effect of capping of
1 These are officers involved in most of the credit decisions hence are able to provide reasonably accurate and complete responses from their banks perspective.
CENTRAL BANK OF KENYA (CBK) COMMERCIAL BANKS’ CREDIT OFFICER SURVEY JANUARY - MARCH 2018
interest rates2, credit recovery efforts and questions on implementation of International Financial Reporting Standard (IFRS) 9 on Financial Instruments. The survey questions are generally phrased in terms of changes over the past three months or expected changes over the next three months.
1.3 KENYAN BANKING SECTOR PERFORMANCE
The Kenyan Banking Sector recorded growth in the quarter ended March 31, 2018, compared to the quarter ended December 31, 2017. Some of the sector’s performance indicators are as follows:-
• The aggregate balance sheet increased by 0.74 percent from Ksh.4.05 trillion in December 2017 to Ksh.4.08 trillion in March 2018. This increase was attributed to increased investment in government securities during the period.
• Gross loans decreased by 0.84 percent from Ksh.2,452.67 billion in December 2017 to Ksh.2,432.16 billion in March 2018. This decrease in gross loans was mainly attributable to a decrease in gross loans in the Agriculture, Mining and Quarrying, Trade, Tourism, Transport and Communication and Real Estate sectors.
• Total deposits increased by 1.02 percent from Ksh.2.95 trillion in December 2017 to Ksh.2.98 trillion in March 2018. This was attributed to an increase in local currency deposits.
• The ratio of gross non-performing loans to gross loans increased from 10.66 percent in December 2017 to 11.81 percent in March 2018. This was attributed to a slowdown in business activities.
• The ratio of core capital to total risk-weighted assets increased slightly from 16.05 percent in December 2017 to 16.15 percent as at March 2018. The total capital to total risk-weighted assets ratio decreased from 18.5 percent in December 2017 to 17.43 percent in March 2018.
2The capping of interest rates came into effect on September 14, 2016.

C E N T R A L B A N K O F K E N Y ACommercial Banks’ Credit Officer Survey January - March 2018
3
• Core capital and total capital increased from Ksh.539.59 billion and Ksh.620.92 billion in December 2017 respectively to Ksh.540.52 billion and Ksh.583.34 billion in March 2018 respectively. The core and total capital adequacy ratios remained above the statutory minimum of 10.5 percent and 14.5 percent respectively.
• Return on Assets decreased to 2.62 percent in March 2018 from 2.67 percent in December 2017. This was attributed to the slowdown in business activities, which had a negative impact on profitability. Profit in the quarter ended December 2017 decreased from Ksh.21.86 billion in December 2017 to Ksh.11.46 billion in March 2018.
• Return on Equity increased to 21.78 percent in March 2018 from 20.83 percent in December 2017. There was a considerable decline in the shareholders’ funds compared to the profitability.
• The Average Liquidity Ratio increased to 45.82 percent in March 2018 from 43.7 percent in December 2017. There was an increase in both total liquid assets total and short-term liabilities.
1.4 SUMMARY OF FINDINGS
• Demand for credit: In the first quarter of 2018, the perceived demand for credit remained unchanged in ten sectors. Respondents attributed this to the slowdown in business activities in 2017, which spilled over to the first quarter of 2018. Demand for credit on the other hand increased in the trade sector with respondents attributing this to an increased demand for consumer goods and services.
• Credit Standards3 remained unchanged in all the eleven economic sectors in the first quarter of 2018. This was a similar trend to observations made in quarter 4 of 2017.
Uncertain business environment and expections regarding the general economic activity following the concluded electioneering period affected
3Credit standards are guidelines used by commercial banks in determining whether to extend a loan to an applicant.
most business, making the commercial banks exercise caution in extending credit facilities.
• Level of Interest Rates: In the first quarter of 2018, 46 percent of the respondents indicated that their banks held their interest rates constant; whereas 54 percent of the respondents indicated that their banks decreased their interest rates.
This is an indication that a good number of commercial banks currently have their interest rates at 13.5 percent or below the ceiling of 13.5 percent. It is worth noting that the reduction of the Central Bank Rate (CBR) to 9.5 percent from 10 percent on March 19, 2018 played a key role in the reduction of interest rates.
• Lending to Small and Medium-sized Enterprises (SMEs): Majority of the commercial banks indicated that interest rate capping has negatively affected their lending to SMEs. This negative impact is because interest rate capping has compelled the banks to increase their risk mitigation measures. This has led to the tightening of credit standards, which reduced credit facilities granted to SMEs.
• Non-Performing Loans: During the quarter under review, the levels of NPLs remained unchanged in all the eleven Economic sectors. This was attributed to the effect of the challenging business environment coupled with political uncertainties in 2017 that spilled over to the first quarter of 2018.
• Expected Non-Performing Loans levels during
the next quarter: Generally, the commercial banks expect a drop in the levels of NPLs in the second quarter of 2018 with 46 percent of the respondents indicating so. This expected drop in NPLs is attributed to the enhanced recovery efforts to be implemented by most banks. The banks’ strategy is mainly focused on recovery of Non-Performing Loans.

C E N T R A L B A N K O F K E N Y ACommercial Banks’ Credit Officer Survey January - March 2018
4
• Credit Recovery Efforts: The banks expect to intensify their credit recovery efforts in nine of the eleven economic sectors. Banks intend to intensify credit recovery efforts in the following sectors:-
i. Tourism sector: Banks intend to make good bad debts that arose due to the seasonal fluctuations of cash flows during peak and low seasons as well as the on-going flash floods being experienced in various parts of the country that has affected the tourism industry negatively.
ii. Agriculture sector: due to the low harvest following the ongoing heavy rains being experienced in different parts of the country.
iii. Building and Construction sector to enhance collections from contractor payments by the Government of Kenya, in the second quarter of 2018.
iv. The intensified recovery efforts in six sectors (Manufacturing, Trade, Transport, Personal/Household, Real Estate, and Financial Services sectors) aim at improving the overall quality of the asset portfolio. This is in line with the banks expectations of a conducive business environment during the second quarter of 2018.
• International Financial Reporting Standards (IFRS) 9 on Financial Instruments: Majority of the commercial banks have done an assessment of the impact of IFRS 9 on their performance. It was noted that an additional 10 percent of the commercial banks had assessed the impact of IFRS 9 on their performance. This was indicated by 73 percent of the commercial banks having reported so in the first quarter of 2018 compared to 63 percent reported in quarter four of 2017.
The respondents noted that IFRS 9 would result in probable change in business model, injection of additional capital to cater for the increased provisioning and a reduction in credit risk appetite.
The commercial banks that had not assessed the impact of IFRS 9 indicated that the assessment will be conducted by end of the second quarter of 2018.
2.0 SURVEY FINDINGS
2.1 Demand for Credit
• In the first quarter of 2018, demand for credit remained unchanged in ten economic sectors. These are Mining and Quarrying, Financial Services, Agriculture, Energy and Water, Manufacturing, Transport and Communication, Real Estate, Building and Construction, Tourism, and, Personal/Household sectors.
• Demand for credit on the other hand increased in the Trade sector. This increase was attributed to an improved business environment coupled with sustained macroeconomic stability.

C E N T R A L B A N K O F K E N Y ACommercial Banks’ Credit Officer Survey January - March 2018
5
Chart 1 and Table 1 below present the trend in the demand for credit in the quarter.
Agriculture Manufacturing Buildingandconstruction
MiningandQuarrying Energyandwater Trade Tourism,restaurant
andHotelsTransportandCommunication RealEstate FinancialServices Personal/Househol
d
Increased 21% 34% 26% 5% 26% 49% 26% 18% 21% 8% 39% RemainedUnchanged 68% 61% 58% 87% 64% 41% 53% 59% 58% 76% 47% Decreased 11% 5% 16% 8% 10% 10% 21% 23% 21% 16% 13%
0%
10%
20%
30%
40%
50%
60%
70%
80%
90%
100%
Freq
uecy
Chart 1: Demand for Credit
Table 1: Change in Demand for Credit
March 2018 December 2017
Increased Remained Unchanged Decreased Increased Remained
Unchanged Decreased
Agriculture 21% 68% 11% 16% 55% 29%Manufacturing 34% 61% 5% 24% 47% 29%Building and construction 26% 58% 16% 29% 32% 39%Mining and Quarrying 5% 87% 8% 11% 68% 21%Energy and water 26% 64% 10% 18% 63% 18%Trade 49% 41% 10% 38% 41% 21%Tourism, Restaurant and Hotels 26% 53% 21% 21% 53% 26%
Transport and Communication 18% 59% 23% 31% 41% 28%
Real Estate 21% 58% 21% 24% 42% 34%Financial Services 8% 76% 16% 18% 58% 24%Personal/Household 39% 47% 13% 35% 32% 32%

C E N T R A L B A N K O F K E N Y ACommercial Banks’ Credit Officer Survey January - March 2018
6
2.2 Factors Affecting Demand for Credit
• In the quarter, ended March 31, 2018, all the nine factors affecting demand for credit had no impact on demand for credit as indicated in Chart 2.
• Issuance of debt securities, issuance of equity, internal financing, loans from other banks, loans from non-bank institutions, retention of CBR, cost of borrowing, available investment opportunities
and political risk were cited as having had the least impact on the demand for credit during the quarter under review. This was reported by 87 percent, 87 percent, 82 percent, 77 percent, 71 percent, 69 percent, 67 percent and 56 percent and 41 percent of the respondents respectively.
• Chart 2 and Table 2 present the trend in the factors affecting demand for credit in the quarter under review.
Chart 2: Factors affecting Demand for Credit
InternalFinancing Loansfromotherbanks
Loansfromnonbanks
Issuanceofdebtsecurities Issuanceofequity Costofborrowing
Availableinvestment
opportunitiesRetentionofCBR PoliticalRisk
Increased 3% 8% 3% 3% 3% 31% 26% 28% 23% RemainedUnchanged 82% 77% 71% 87% 87% 67% 56% 69% 41% Decreased 16% 15% 26% 11% 11% 3% 18% 3% 36%
0%
10%
20%
30%
40%
50%
60%
70%
80%
90%
100%
Freq
uency
Table 2: Factors Affecting Demand for Credit
March 2018 December 2017
Increased Remained Unchanged Decreased Increased Remained
Unchanged Decreased
Internal Financing 3% 82% 16% 3% 84% 13%Loans from other banks 8% 77% 15% 3% 78% 19%Loans from non-banks 3% 71% 26% 3% 77% 21%Issuance of debt securities 3% 87% 11% 0% 92% 8%Issuance of equity 3% 87% 11% 0% 89% 11%Cost of borrowing 31% 67% 3% 28% 59% 13%Available investment opportunities 26% 56% 18% 5% 69% 26%
Retention of CBR 28% 69% 3% 16% 79% 5%Political Risk 23% 41% 36% 3% 21% 76%

C E N T R A L B A N K O F K E N Y ACommercial Banks’ Credit Officer Survey January - March 2018
7
Agriculture Manufacturing Buildingandconstruction MiningandQuarrying Energyandwater Trade Tourism,restaurant
andHotelsTransportandCommunication RealEstate FinancialServices Personal/Household
Increased 28% 13% 39% 16% 8% 15% 21% 38% 45% 21% 29% RemainedUnchanged 67% 77% 55% 82% 87% 72% 76% 59% 53% 76% 55% Decreased 5% 10% 5% 3% 5% 13% 3% 3% 3% 3% 16%
0%
10%
20%
30%
40%
50%
60%
70%
80%
90%
100%
Chart 3: Credit Standards
2.3 Credit Standards
• Credit Standards remained unchanged in all the eleven economic sectors in the first quarter of 2018. This was a similar trend to observations made in quarter 4 of 2017.
• Uncertain business environment following the concluded electioneering period affected most business, making the commercial banks exercise caution in extending credit facilities.
• These responses are presented in Chart 3 and Table 3.
Table 3: Credit Standards for Loans to Various Economic Sectors
March 2018 December 2017
Tightened Remained Unchanged Eased Tightened Remained
Unchanged Eased
Agriculture 28% 67% 5% 15% 85% 0%Manufacturing 13% 77% 10% 15% 82% 3%Building and construction 39% 55% 5% 45% 55% 0%Mining and Quarrying 16% 82% 3% 11% 89% 0%Energy and water 8% 87% 5% 8% 89% 3%Trade 15% 72% 13% 23% 74% 3%Tourism, Restaurant and Hotels 21% 76% 3% 26% 71% 3%Transport and Communication 38% 59% 3% 33% 64% 3%Real Estate 45% 53% 3% 42% 58% 0%Financial Services 21% 76% 3% 23% 77% 0%Personal/Household 29% 55% 16% 37% 58% 5%

C E N T R A L B A N K O F K E N Y ACommercial Banks’ Credit Officer Survey January - March 2018
8
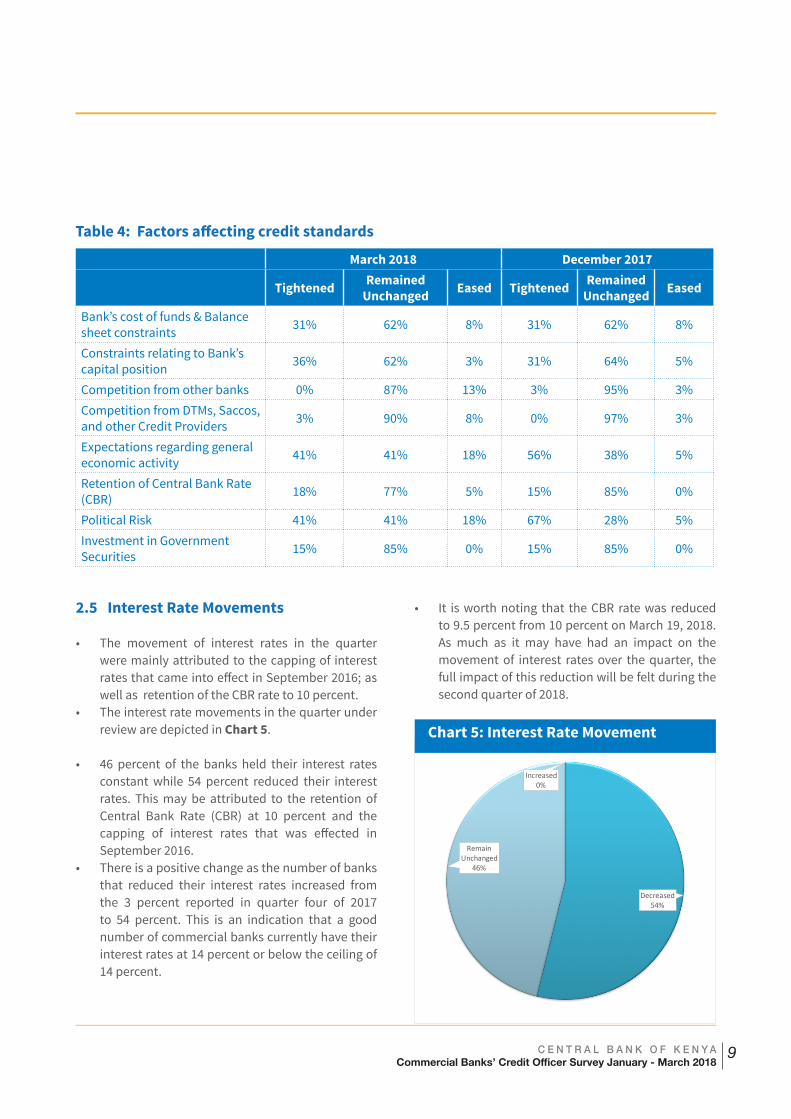
2.4 Factors Affecting Credit Standards
• During the quarter ended March 2018, six factors (competition from DTMs, Saccos and other credit providers, competition from other banks, investment in Government Securities, retention of CBR, constraints relating to banks’ capital position and Banks’ cost of funds) had little impact on credit standards.
• However, political risk due to the uncertainties after the concluded electioneering period and expections regarding the general economic activity were cited as factors that had mixed reactions.
• Political risk and expections regarding the general economic activity had mixed reactions from the respondents with an equal number of respondents (41 percent) indicating that the standards both tightened and remained constant.
• A comparison of the trend in the factors affecting the banks’ credit standards are shown in Chart 4 and Table 4.
Chart 4: Factors affecting credit standards
Bank'scostoffunds&Balancesheetconstraints
ConstraintsrelatingtoBank'scapital
position
Competitionfromotherbanks
CompetitionfromDTMs,Saccos,&otherCreditProviders
Expectationsregardinggeneraleconomicactivity
RetentionofCBR PoliticalRiskInvestment inGovernmentSecurities
Tightened 31% 36% 0% 3% 41% 18% 41% 15% Remainedunchanged 62% 62% 87% 90% 41% 77% 41% 85% Eased 8% 3% 13% 8% 18% 5% 18% 0%
0%
10%
20%
30%
40%
50%
60%
70%
80%
90%
100%
freq
uency
C E N T R A L B A N K O F K E N Y ACommercial Banks’ Credit Officer Survey January - March 2018
9
Table 4: Factors affecting credit standards
March 2018 December 2017
Tightened Remained Unchanged Eased Tightened Remained
Unchanged Eased
Bank’s cost of funds & Balance sheet constraints 31% 62% 8% 31% 62% 8%
Constraints relating to Bank’s capital position 36% 62% 3% 31% 64% 5%
Competition from other banks 0% 87% 13% 3% 95% 3%Competition from DTMs, Saccos, and other Credit Providers 3% 90% 8% 0% 97% 3%
Expectations regarding general economic activity 41% 41% 18% 56% 38% 5%
Retention of Central Bank Rate (CBR) 18% 77% 5% 15% 85% 0%
Political Risk 41% 41% 18% 67% 28% 5%Investment in Government Securities 15% 85% 0% 15% 85% 0%
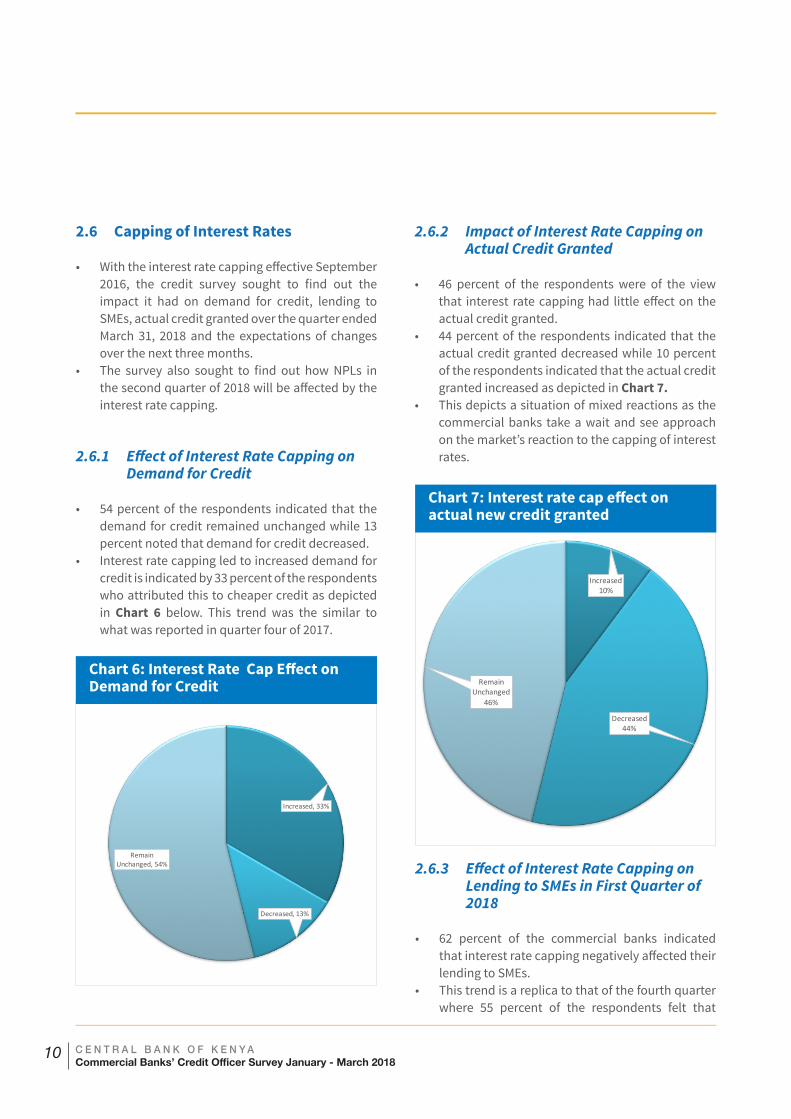
2.5 Interest Rate Movements
• The movement of interest rates in the quarter were mainly attributed to the capping of interest rates that came into effect in September 2016; as well as retention of the CBR rate to 10 percent.
• The interest rate movements in the quarter under review are depicted in Chart 5.
• 46 percent of the banks held their interest rates
constant while 54 percent reduced their interest rates. This may be attributed to the retention of Central Bank Rate (CBR) at 10 percent and the capping of interest rates that was effected in September 2016.
• There is a positive change as the number of banks that reduced their interest rates increased from the 3 percent reported in quarter four of 2017 to 54 percent. This is an indication that a good number of commercial banks currently have their interest rates at 14 percent or below the ceiling of 14 percent.
Increased0%
Decreased54%
RemainUnchanged
46%
• It is worth noting that the CBR rate was reduced to 9.5 percent from 10 percent on March 19, 2018. As much as it may have had an impact on the movement of interest rates over the quarter, the full impact of this reduction will be felt during the second quarter of 2018.
Chart 5: Interest Rate Movement
C E N T R A L B A N K O F K E N Y ACommercial Banks’ Credit Officer Survey January - March 2018
10
Increased10%
Decreased44%
RemainUnchanged
46%
Increased,33%
Decreased,13%
RemainUnchanged,54%
2.6 Capping of Interest Rates
• With the interest rate capping effective September 2016, the credit survey sought to find out the impact it had on demand for credit, lending to SMEs, actual credit granted over the quarter ended March 31, 2018 and the expectations of changes over the next three months.
• The survey also sought to find out how NPLs in the second quarter of 2018 will be affected by the interest rate capping.
2.6.1 Effect of Interest Rate Capping on Demand for Credit
• 54 percent of the respondents indicated that the demand for credit remained unchanged while 13 percent noted that demand for credit decreased.
• Interest rate capping led to increased demand for credit is indicated by 33 percent of the respondents who attributed this to cheaper credit as depicted in Chart 6 below. This trend was the similar to what was reported in quarter four of 2017.
Chart 6: Interest Rate Cap Effect on Demand for Credit
Chart 7: Interest rate cap effect on actual new credit granted
2.6.2 Impact of Interest Rate Capping on Actual Credit Granted
• 46 percent of the respondents were of the view that interest rate capping had little effect on the actual credit granted.
• 44 percent of the respondents indicated that the actual credit granted decreased while 10 percent of the respondents indicated that the actual credit granted increased as depicted in Chart 7.
• This depicts a situation of mixed reactions as the commercial banks take a wait and see approach on the market’s reaction to the capping of interest rates.
2.6.3 Effect of Interest Rate Capping on Lending to SMEs in First Quarter of 2018
• 62 percent of the commercial banks indicated that interest rate capping negatively affected their lending to SMEs.
• This trend is a replica to that of the fourth quarter where 55 percent of the respondents felt that

C E N T R A L B A N K O F K E N Y ACommercial Banks’ Credit Officer Survey January - March 2018
11
Chart 8: Effect of interest rate capping to lending to SMEs
Chart 9: Interest rate cap effect on expected demand for credit in Q2 2018
interest rate capping negatively affected their lending to SMEs.
• Interest rate capping has compelled banks to increase their risk mitigation measures. Tightening of credit standards has led to reduced credit facilities granted to SMEs. This is indicated in \Chart 8.
Yes,62%
No,38%
2.6.4 Interest Rate Cap Effect on Demand for Credit in Second Quarter of 2018
• With regards to the expected demand for credit in the second quarter of 2018, majority of the respondents anticipate that interest rate capping will have little impact on the demand for credit as indicated by 57 percent of the respondents.
• However, 33 percent of the respondents felt that interest capping will lead to an increase in actual credit advanced.
• 10 percent of the respondents felt that the actual credit advanced will decrease. The expected movement on demand for credit in the second quarter is shown in Chart 9.
2.6.5 Effect of Interest Rate Capping on Actual New Credit over the next three months
• In the second quarter of 2018, most of the respondents anticipate that the interest rate capping will have little impact on actual credit advanced as indicated by 59 percent of the respondents. The banks attributed this to tightened credit standards following the capping of interest rates.
• However, 13 percent of the respondents felt that interest rate capping would lead to an increase in new credit advanced while 28 percent felt that the new credit advanced would decrease as indicated in Chart 10.
Increased,33%
Decreased,10%
RemainUnchanged,56%
Remain Unchanged, 57%

C E N T R A L B A N K O F K E N Y ACommercial Banks’ Credit Officer Survey January - March 2018
12
Increased13%
Decreased28%
RemainUnchanged
59%
2.6.6 Expected Effect of Interest Rate Capping on the Level of NPLs
• In the second quarter of 2018, 79 percent of the respondents are of the view that the NPLs would not change since the pricing of the loans has no impact on repayment ability. This is because monthly installments are agreed upfront.
• 8 percent of the respondents expect the capping of interest rates to have a positive impact on NPLs. Respondents have attributed this to the current favorable interest rates, which led to cheaper credit.
• 13 percent of the respondents indicated that NPLs would deteriorate as indicated in Chart 11 below.
Chart 10: Interest rate cap effect on actual new credit granted in Q2 2018
Chart 11: Effect of interest rate capping on NPLs
Increased,33%
Decreased,10%
RemainUnchanged,56%
2.7 Non-Performing Loans (NPLs)
2.7.1 Non - Performing Loans during the quarter ended March 31, 2018
• During the quarter under review, the levels of NPLs remained unchanged in all the eleven Economic sectors.
• The Mining and Quarrying, Energy and Water, Financial Services and Agriculture sectors had the most respondents indicating that the NPLs remained unchanged.
• This was attributed to the effect of the challenging business environment coupled with political uncertainties in 2017 that spilled over to the first quarter of 2018.This is depicted in Chart 12.
Improve8%
Deteriorate13%
RemainConstant79%

C E N T R A L B A N K O F K E N Y ACommercial Banks’ Credit Officer Survey January - March 2018
13
Agriculture Manufacturing Buildingandconstruction
MiningandQuarrying Energyandwater Trade Tourism,restaurantandHotels
TransportandCommunication
RealEstate FinancialServices Personal/Household
Rose 16% 16% 32% 3% 8% 37% 19% 34% 32% 11% 34% Remainedunchanged 59% 47% 50% 78% 76% 39% 51% 42% 45% 66% 39% Fell 24% 37% 18% 19% 16% 24% 30% 24% 24% 24% 26%
0%
10%
20%
30%
40%
50%
60%
70%
80%
90%
Freq
uency
Chart 12: Non-Performing Loans
Table 5: Non Performing Loans Trend Per Economic Sector
March 2018 December 2017
Rose Remained Unchanged Fell Rose Remained
Unchanged Fell
Agriculture 16% 59% 24% 17% 63% 20%Manufacturing 16% 47% 37% 11% 59% 30%Building and construction 32% 50% 18% 28% 47% 25%Mining and Quarrying 3% 78% 19% 3% 81% 17%Energy and water 8% 76% 16% 9% 86% 6%Trade 37% 39% 24% 28% 39% 33%Tourism, Restaurant and Hotels 19% 51% 30% 14% 57% 29%Transport and Communication 34% 42% 24% 29% 46% 26%Real Estate 32% 45% 24% 31% 43% 26%Financial Services 11% 66% 24% 8% 69% 22%Personal/Household 34% 39% 26% 31% 47% 22%
C E N T R A L B A N K O F K E N Y ACommercial Banks’ Credit Officer Survey January - March 2018
14
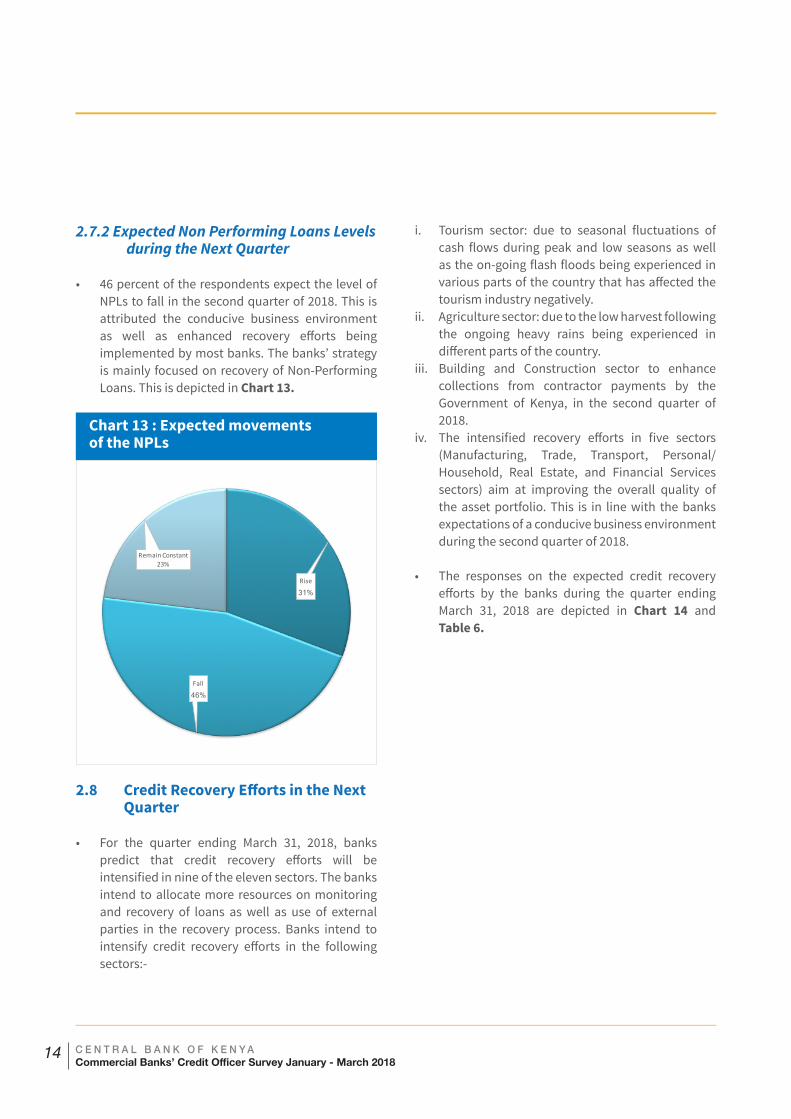
2.7.2 Expected Non Performing Loans Levels during the Next Quarter
• 46 percent of the respondents expect the level of NPLs to fall in the second quarter of 2018. This is attributed the conducive business environment as well as enhanced recovery efforts being implemented by most banks. The banks’ strategy is mainly focused on recovery of Non-Performing Loans. This is depicted in Chart 13.
Chart 13 : Expected movements of the NPLs
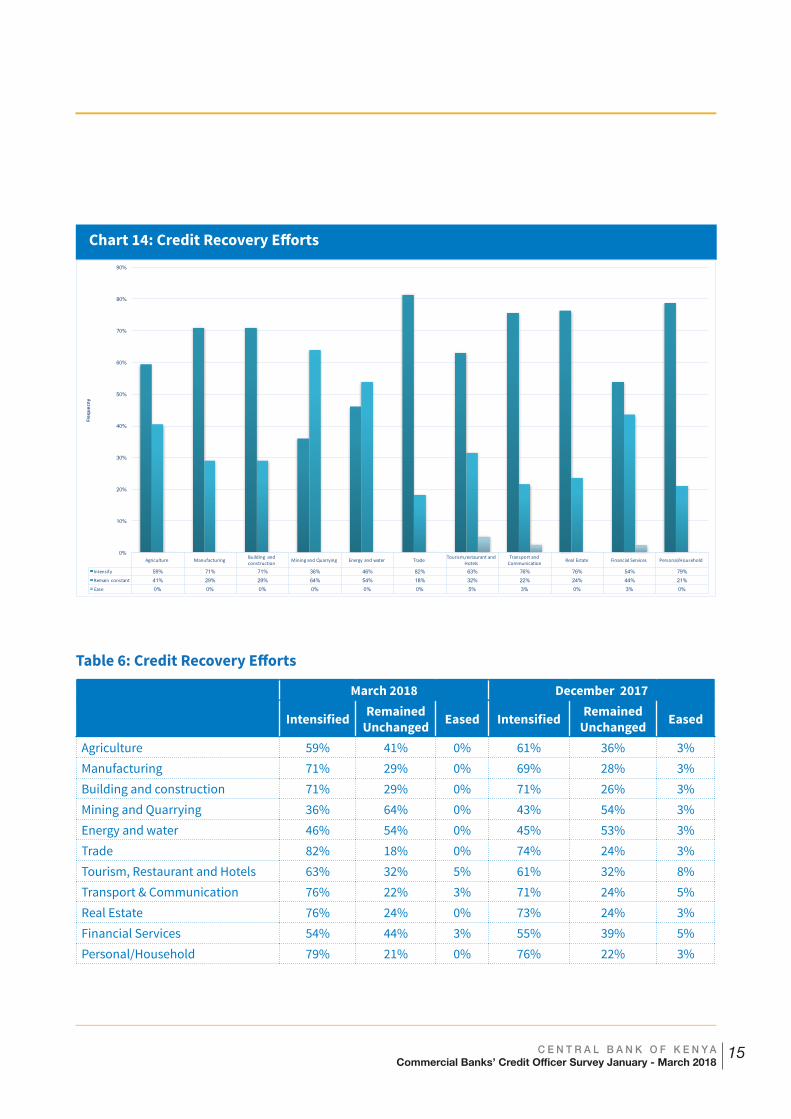
2.8 Credit Recovery Efforts in the Next Quarter
• For the quarter ending March 31, 2018, banks predict that credit recovery efforts will be intensified in nine of the eleven sectors. The banks intend to allocate more resources on monitoring and recovery of loans as well as use of external parties in the recovery process. Banks intend to intensify credit recovery efforts in the following sectors:-
i. Tourism sector: due to seasonal fluctuations of cash flows during peak and low seasons as well as the on-going flash floods being experienced in various parts of the country that has affected the tourism industry negatively.
ii. Agriculture sector: due to the low harvest following the ongoing heavy rains being experienced in different parts of the country.
iii. Building and Construction sector to enhance collections from contractor payments by the Government of Kenya, in the second quarter of 2018.
iv. The intensified recovery efforts in five sectors (Manufacturing, Trade, Transport, Personal/Household, Real Estate, and Financial Services sectors) aim at improving the overall quality of the asset portfolio. This is in line with the banks expectations of a conducive business environment during the second quarter of 2018.
• The responses on the expected credit recovery efforts by the banks during the quarter ending March 31, 2018 are depicted in Chart 14 and Table 6.
Rise
31%
Fall
46%
RemainConstant23%
C E N T R A L B A N K O F K E N Y ACommercial Banks’ Credit Officer Survey January - March 2018
15
Chart 14: Credit Recovery Efforts
Agriculture Manufacturing Buildingandconstruction MiningandQuarrying Energyandwater Trade Tourism,restaurantand
HotelsTransportandCommunication RealEstate FinancialServices Personal/Household
Intensify 59% 71% 71% 36% 46% 82% 63% 76% 76% 54% 79% Remainconstant 41% 29% 29% 64% 54% 18% 32% 22% 24% 44% 21% Ease 0% 0% 0% 0% 0% 0% 5% 3% 0% 3% 0%
0%
10%
20%
30%
40%
50%
60%
70%
80%
90%
Freq
uecny
Table 6: Credit Recovery Efforts
March 2018 December 2017
Intensified Remained Unchanged Eased Intensified Remained
Unchanged Eased
Agriculture 59% 41% 0% 61% 36% 3%Manufacturing 71% 29% 0% 69% 28% 3%Building and construction 71% 29% 0% 71% 26% 3%Mining and Quarrying 36% 64% 0% 43% 54% 3%Energy and water 46% 54% 0% 45% 53% 3%Trade 82% 18% 0% 74% 24% 3%Tourism, Restaurant and Hotels 63% 32% 5% 61% 32% 8%Transport & Communication 76% 22% 3% 71% 24% 5%Real Estate 76% 24% 0% 73% 24% 3%Financial Services 54% 44% 3% 55% 39% 5%Personal/Household 79% 21% 0% 76% 22% 3%
C E N T R A L B A N K O F K E N Y ACommercial Banks’ Credit Officer Survey January - March 2018
16
Yes73%
No
27%
2.9 International Financial Reporting Standard (IFRS) 9 on Financial Instruments
• In July 2014, the International Accounting Standards Board (IASB) issued the final International Financial Reporting Standard (IFRS) 9 on Financial Instruments Standard. This initiative resulted to the replacement of International Accounting Standard (IAS) 39, on Financial Instruments (Recognition and Measurement).
• The main objective of the new IFRS 9 is to provide users of financial statements with more useful information about an entity’s expected credit losses on financial instruments.
• Institutions are required to recognize expected credit losses at all times and to update the amount of expected credit losses recognized at each reporting date to reflect changes in the credit risk of financial instruments.
• Given that the implementation of IFRS 9 was expected to come into effect beginning January 1, 2018, the Central Bank of Kenya sought to assess:-
i. The commercial banks’ preparedness in the implementation of the IFRS 9; and
ii. the impact it would have on the commercial banks.
• Commercial banks are currently required to ensure sufficiency of capital to cover all potential risks on an ongoing basis. Commercial banks in Kenya are required to maintain a capital adequacy ratio of 14.5 percent, which includes a capital conservation buffer of 2.5 percent.
An analysis of the outcome of the assessment on IFRS 9 is detailed below.
2.9.1 Impact of IFRS 9 on commercial banks performance and position
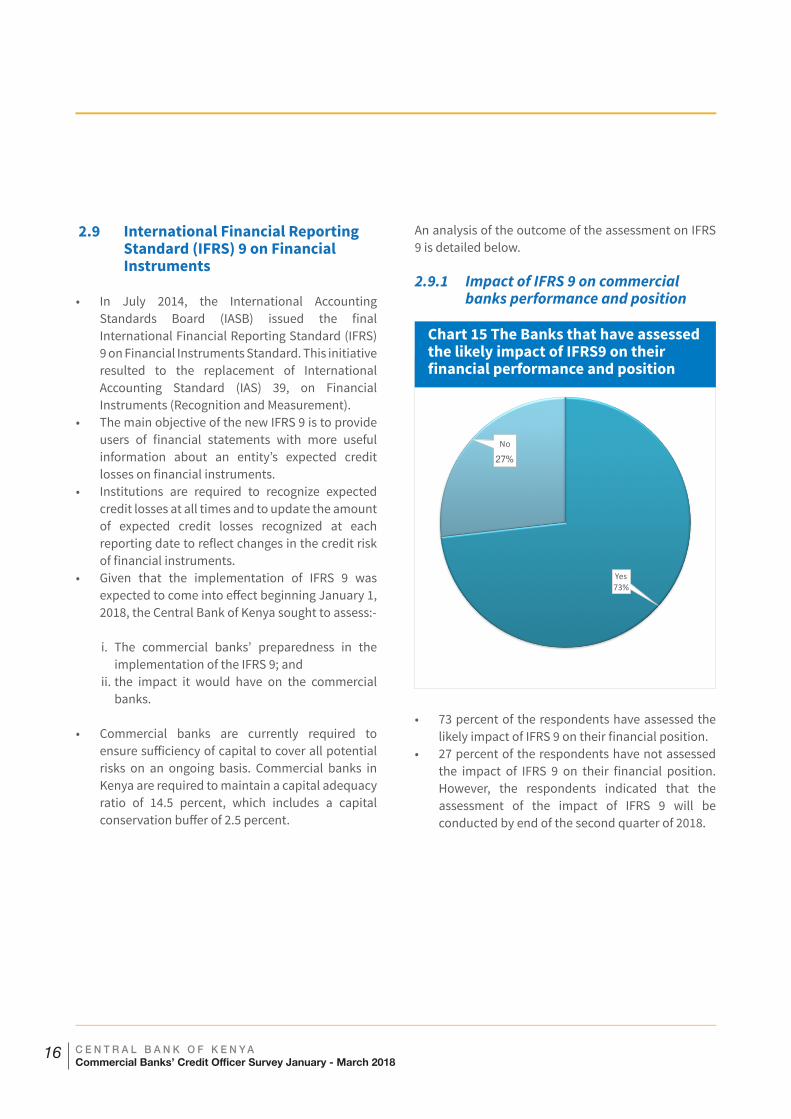
Chart 15 The Banks that have assessed the likely impact of IFRS9 on their financial performance and position
• 73 percent of the respondents have assessed the likely impact of IFRS 9 on their financial position.
• 27 percent of the respondents have not assessed the impact of IFRS 9 on their financial position. However, the respondents indicated that the assessment of the impact of IFRS 9 will be conducted by end of the second quarter of 2018.

C E N T R A L B A N K O F K E N Y ACommercial Banks’ Credit Officer Survey January - March 2018
17
2.9.2 Impact of IFRS 9 on Credit Risk
• Respondents indicated that the implementation of IFRS 9 will have a negative impact on the banks’ profitability. Lending to unsecured facilities will be highly unlikely given that provisioning levels are expected to increase under IFRS 9. This will reduce the banks’ credit risk appetite.
• Most of the respondents indicated that implementation of IFRS 9 will result in banks tightening their credit standards. They will be more inclined to secured lending as opposed to unsecured facilities.
2.9.3 Impact of IFRS 9 on Business Model
• Most of the respondents have indicated that implementation of IFRS 9 will result in banks reviewing their business models, strategic objectives and credit policies in order to realign with the IFRS 9 requirements. Further, banks intend to tighten their credit standards and as a result, banks will be skewed towards collateral based lending as opposed to unsecured lending.
2.9.4 Challenges envisaged in the Implementation of IFRS 9
The commercial banks have indicated that they envisage challenges that may limit the implementation of IFRS 9. Some of the cited challenges include:
• Capital constraints due to increased provisioning. • Review of policies that in essence will affect the
business model.• Inadequate technical skills and modeling
capabilities. • Cost implication for the relevant technology and
personnel training. • Different sources of information and reliability of
data.
As a mitigation measure, banks have indicated that they are currently exploring injection of additional capital, enhancing staff capacity through training as well as reviewing their policies and procedures. This is aimed at ensuring full compliance with IFRS 9.

C E N T R A L B A N K O F K E N Y ACommercial Banks’ Credit Officer Survey January - March 2018
18
LIST OF RESPONDENTS
1. African Banking Corporation Ltd.2. Bank of Africa Kenya Ltd.3. Bank of Baroda (K) Ltd.4. Bank of India. 5. Barclays Bank of Kenya Ltd.6. Chase Bank (K) Ltd.7. Citibank N.A Kenya.8. Commercial Bank of Africa Ltd.9. Consolidated Bank of Kenya Ltd.10. Credit Bank Ltd.11. Co-operative Bank of Kenya Ltd.12. Development Bank of Kenya Ltd.13. Diamond Trust Bank (K) Ltd.14. DIB Bank Kenya Ltd.15. Ecobank Kenya Ltd.16. Equity Bank Ltd.17. Family Bank Ltd.18. Guaranty Trust Bank (Kenya) Ltd.19. First Community Bank Ltd.20. Guardian Bank Ltd.21. Gulf African Bank Ltd.
22. Habib Bank A.G Zurich.23. I & M Bank Ltd.24. Jamii Bora Bank Ltd.25. KCB Bank Kenya Ltd.26. Middle East Bank (K) Ltd.27. Mayfair Bank Ltd.28. National Bank of Kenya Ltd.29. NIC Bank Ltd.30. M Oriental Bank Ltd.31. Paramount Bank Ltd.32. Prime Bank Ltd.33. Standard Chartered Bank (K) Ltd.34. SBM Bank (Kenya) Ltd.35. Spire Bank Ltd.36. Sidian Bank Ltd.37. Stanbic Bank Kenya Ltd.38. Trans-National Bank Ltd.39. Victoria Commercial Bank Ltd.40. UBA Kenya Bank Ltd.41. HFC Ltd.

C E N T R A L B A N K O F K E N Y ACommercial Banks’ Credit Officer Survey January - March 2018
19

C E N T R A L B A N K O F K E N Y ACommercial Banks’ Credit Officer Survey January - March 2018
20