hybrid machine learning for classification and explanation...
TRANSCRIPT

109
CHAPTER - V
HYBRID MACHINE LEARNING FOR
CLASSIFICATION AND EXPLANATION ABILITY
5.1 CBR Applications
Case based reasoning has been applied to solve different types of tasks like decision assistance and diagnosis, electronic commerce, customer support, medicine, and tutoring and help systems.
In decision assistance and diagnosis
Decision support, or assistance, helps a user by providing useful information or advice without necessarily providing a complete solution [13]. CASELine is used by British Airways to diagnose and repair Boeing 747- 00 jets. Cognitive Systems implemented it using the CBR software development tool- ReMind. CASELine uses nearest neighbor to look up repair and maintenance information, using a two-digit fault number, error message, or a variable-length fault description. CASELine retrieves solution descriptions that have a high probability of fitting the current problem situation. CASELine is important in assisting airplane technicians in finding the quickest and best possible solution during the brief time the airplane is on the ground between flights.
CASEY combined case-based and rule-based reasoning to aid in the diagnosis of heart failure. CASEY attempted to determine the differences between similar cases and use the applicable diagnosis. If the differences between the two similar cases were very significant, it tried to adapt the case and explain it. CBR is being applied in medical image research. One such system uses two-layer CBR architecture for interpreting computed tomography images. The first CBR layer performs lower level segment identification, and the second CBR layer performs an overall interpretation of the image. SCINA is another CBR-based image understanding system. It automatically performs a diagnosis of coronary artery disease from a stored case base of image data
A Top Management Fraud Diagnostic Tool (TMFDT) was developed by the multinational accounting firm of Deloitte and Touch. TMFDT is a CBR tool that assists auditors in determining the likelihood of top management fraud happening within a company. TMFDT was implemented using Cognitive Systems' Remind CBR tool. Several experienced auditors were questioned to help identify the characteristics of top management, which could indicate fraud is occurring. They identified about 160 case features, which were important in assessing potential fraud situations. After these features were identified, the case base was populated with several hundred real-

110
world cases. Deloitte and Touch used precision and noise to evaluate TMFDT, using both nearest-neighbor indexing and inductive indexing. Precision is defined as the number of correct fraud cases retrieved per total number of cases retrieved. Noise is defined as the number of incorrect fraud cases retrieved per total number of cases retrieved.
In electronic commerce
CBR has been applied to electronic commerce. Electronic commerce can be defined as the exchange of information, goods, or service; through electronic networks (internet). CBR is a promising tool for managing knowledge required in the sales process. CBR is being applied at the beginning of the sales process, where the customer searches for the product he or she wants to buy. The middle phase of the sales process includes the customer and the supplier negotiating between the customer's requirements and the supplier's price. Currently, only simple catalogues are available on the Internet for this. After the sale is completed, the customer may need additional information or assistance with the product. This usually occurs through customer support call centers, and CBR is being used heavily in this task.
In customer support
Several companies are employing CBR technology to assist in the after sales support of their products. These companies hope that they can shift some of the calls to their call centers to self-service Web applications to answer customer product questions. Some of the companies that have employed these technologies are Lucas Arts and Broderbund. Compaq developed a CBR system, SMART (Support Management Automated Reasoning Technology)[13], to provide its front-line help-desk workers with a tool to help find past solutions to the customer's current problem. SMART allows the help-desk operators to type in the description of the problem in natural language. The SMART system then searches the case base for a similar problem. A stored case contains the problem description, questions to ask the user, and a solution. If the front-line help-desk operator cannot answer the question, the call is escalated to an experienced engineer, who then proceeds to solve the problem. The engineer then updates the case base with the new solution to the problem, making it available to the front-line help-desk operators.
In tutoring and help systems
Case-based reasoning can be used to support the learning process in teaching systems and to provide adaptive user modeling to tailor the system to the individual user's learning approach. One aspect of a knowledge-based tutoring system is its ability to model the learner's current knowledge and knowledge acquisition processes. It should try to determine these user properties and use this knowledge to support and give advice to the learner [80]. Case-based methods can be used to adapt the tutoring system interface to the user's needs and adaptively learn together with the user. In

111
case-based teaching systems, the goal is to provide the user with cases to help her to understand new concepts and to solve current problems presented in the on-line lesson
In Medicine
In MIT Koton designed a program called CASEY [13]. It analyses descriptions of patients with heart disease and to produce a diagnostic explanation of the symptoms of the patient’s condition. CASEY integrates case-based and causal reasoning with a model-based expert system. Protos is an exemplar-based learning apprentice. It is not domain specific but it has been applied in the field of clinical audiology. It is used to classify cases into categories and to find an exemplar that closely matches the current input case. Lopez and Plaza designed BOLERO, which diagnoses the cause of pneumonia in patients so they can be treated. It learns not only from its successes but also its failures.
5.2 Desired features of Machine learning algorithm
Good performance, the ability to deal with missing and noisy data, transparency of diagnostic knowledge, ability to explain the decision and ability to reduce the number of tests required to obtain good diagnosis are some of the desired features expected from the machine leaning system for medical diagnosis [6]. Below list contains the desired features and their meanings:
Good performance
The algorithm must be able to extract significant information from the available data. The diagnostic accuracy on new cases must also be as high as possible.
The ability to deal with missing and noisy data
Medical data typically suffer from unfilled (missing), uncertain and error data. The machine learning algorithm must be good enough to deal with this type of erroneous data.
Transparency of diagnostic knowledge
The knowledge generated by the machine learning algorithm and its explanation of decisions must be transparent to the physician.

112
Reduction of the number of tests
In medical practice, the collection of patient data is often expensive, time consuming, and harmful for the patients. Therefore it is desirable to have a classifier that is able to reliably diagnose with a small amount of data about the patients. There is need to find the right sub set of data for training the classifier.
Explanation ability
The system must be able to explain decisions when diagnosing new patients.
Table 5.1 The Appropriateness of ANN and CBR in Medical Diagnosis [6]
Classifier Perfor-
mance
Transpar-
ency
Expla-
nations
Redu-
ction
Missing
Data
Handling
Decision Tree Builders
(Assistant-R)
Good Very Good Good Good Acceptable
Case based reasoning
(K-Nearest Neighbor)
Very Good
Poor Acceptable No Acceptable
The past researches say that the performance of the Classification Tree and Case Based Reasoning are always good. The hybrid method performance is going to be good because both Classification Tree and case based reasoning is very good in performance. Machine learning with very good classification performance and acceptable explanation ability is the main objectives of this research. Although Case Based Reasoning is poor in transparency, the Classification Tree has the very good ability and Good Explanation ability through the classification tree diagram and tree rules. The hybrid machine learning method is then going to have overall explanation ability with very good classification performance.
5.3 K-nearest neighbor method
K-nearest neighbor (K-NN) is a classification technique that looks to similar problems that they have previously solved to solve the new problem. It decides in which class to place a new case by examining some number the “k” in k-nearest neighbor of the most similar cases or neighbors. It counts the number of case for each class, and assigns the new case to the same class to which most of its neighbors belong.

113
The Figure 5.1 has totally 9 near by cases for the new case N. The new case N would be assigned to the class X because the seven X’s within the ellipse outnumbered the two Y’s[5]. To retrieve the nearby similar cases K-NN find the distance between the new case N and the nearby case X or Y. If the calculated distance is less than the fixed boundary value then it will be consider for counting. We use the Euclidean distance to measure the similarity between two different cases. Two similar cases will have the minimum distance among themselves.
Figure 5.1 K-nearest neighbor [5]
5.4 Draw back in the Single Classification Method and the need of the
Hybrid Method
Data mining is the nontrivial extraction of implicit, previously unknown, interesting and potentially useful information from data [21]. Data mining helps in decision making. Now a day’s hospitals and health care institutions are well equipped with monitoring and other data collection devices. Data is collected and shared with other hospital information systems. Due to the idiosyncracies of the medical profession, physician desperately needs a helping hand to take an efficient and intelligent decision.
Good performance on diagnostic accuracy, the ability to appropriately deal with missing and with noisy data, the transparency of diagnostic knowledge, the ability to explain decisions are the some of the desired features expected from the good machine learning system for medical diagnostic tasks [22]. Lot of machine learning algorithms are available (like backpropagation in neural network, K-NN from Case based Reasoning and modified towing splitting rule in Classification Tree ) in the market, but the main problem is not a single machine learning algorithm has all the expected features for the medical diagnosis tasks. For example backpropagation algorithm has very good diagnostic accuracy performance but it has poor transparency
X X X X X Y
N
X X
Y

114
and explanation ability. K-NN has the explanation ability but it does not have generalization. It’s transparency of knowledge representation is poor. CT model has very good transparency but it has very ordinary performance to handle the missing and noisy data. Every single algorithm has its own merits and demerits. Physician needs a new approach which will have more supporting features to the medical diagnosis task.
5.5 Related Literature.
Classification, clustering, prediction, association, rule extraction and sequence detection are the various types of problems we can solve through data mining. The techniques used in data mining are from different fields like statistics, machine learning and pattern recognition. Machine Learning is the study of computer algorithms that improve machine learning automatically through experience [23]. Abdel and Kenneth summarized the principle of machine learning approaches to ECG classification. They evaluated and proved that machine learning algorithms are highly accurate in medical diagnosis [24]. Artificial neural network, Case based reasoning and Classification Tree algorithms are coming under the machine learning field.
Neural networks have been successfully applied to a variety of real world classification tasks in industry, business and science [25]. Applications include bankruptcy prediction [26], handwriting recognition [27], speech recognition [28], product inspection [29], fault detection [30], medical diagnosis [31 - 33], and bond rating [34]. Case-based reasoning (CBR) is an approach to problem solving that emphasizes the role of prior experience during future problem solving [35]. CASEY gives a diagnosis for the heart disorders [36]. GS.52 is a diagnostic support system for dysmorphic syndromes. NIMON is a renal function monitoring system, COSYL that gives a consultation for a liver transplanted patient [37] and ICONS presents suitable calculated antibiotics therapy advised for intensive care patients [38]. Medical Informatics Research Group at Ain Shams University developed successful applications in cancer and heart diseases [39].
Tzung and Gang applied decision tree methods to medical data mining problems [40]. Christine and Hamish developed a medical diagnosis system using classification tree (FT Tree) and an LR model (FT LR). It predicted the probability of a patient with chest pain is having an myocardial infarction (MI) [41].
Some researchers used Hybrid approach in the medical diagnosis task.
Siddharth and Shruthi developed the design of a two tier Neural Inter-network based Medical Diagnosis System (NIMD) that uses k-Nearest Neighbor Classification for Diagnosis pruning. The system is essentially two tiered with the first tier handling diagnosis pruning. The second tier consists of separate modules for each disease that handles the actual detection of the disease based on the intensities of the various symptoms reported by the patient [42]. David and Magnus designed a Decision

115
Support System for Parkinson's disease. They proposed a method based on ANNs and SVMs to aid the physician in the diagnosis of PD [43].
Many systems have been developed based on single ANN, CBR and CT methods. We proposed Hybrid classifiers system using the CBR and CT methods for medical diagnostic task.
5.6 Proposed Model and its Algorithm
Every single machine learning algorithm has its own advantages and disadvantages. K-NN algorithm (CBR) and Modified towing splitting rule (CT) are used in the new proposed model. The working procedure of hybrid classifier system is explained below in the form of an algorithm and flowchart (Figure 5.2) in detail. Solomon and Kulkarni have developed a multiple classifiers using the Artificial Neural Network, Case Based Reasoning and Classification Tree to give more reliability in the time of medical diagnosis [49].
Algorithm
Step-1: Create a two different Datasets namely S1 and S2 for training and
testing the Hybrid classifier system.
Step-2: Train the Hybrid classifiers system (which has a separate CBR and
CT classifier inside) using the Training Dataset S1.
Step-3: For all the input data in the testing dataset S2 do the following
steps.
i. Calculate the outputs using the CBR and CT classifiers.
ii. Compare the outputs. If both are same then CBR and CT classifier’s
same output will be the output of the Hybrid classifier system.
Otherwise compare the output success probability of the KNN (CBR)
and CT Classifier systems and select the maximum success probability
classifier output as the Hybrid Classifier Output.

116
Flowchart
Yes
No
Start
Create two different datasets namely S1 and S2 for training and testing the Hybrid classifier system.
Train the multiple classifiers system using the dataset S1.
For every test case in dataset S2, calculate the classification using KNN (CBR) and CT classifiers.
Both the Classifier’s output is
same?
The CBR and CT classifiers output will be the output of the Hybrid classifier
system.
Compare the outputs. If both are
same then CBR and CT classifier’s
same output will be the output of
the Hybrid classifier system.
Otherwise compare the output
success probability of the KNN
(CBR) and CT Classifier systems
and select the maximum success
probability classifier output as the
Hybrid Classifier Output.
Figure 5.2 Multiple Classifiers System

117
5.7 Experiments and its Results
We tested the proposed Hybrid classifier system with the Pima Indian Diabetes
Dataset. Below sections 5.7.1, 5.7.2, 5.7.3 shows training and testing classification
and miss classification performance of individual Case Based Reasoning and
Classification Tree models and the proposed Hybrid classifier system for the Pima
Indian diabetes disease dataset. The diabetes dataset has taken from the URL.
http://archive.ics.uci.edu/ml/datasets/Pima+Indians+Diabetes. From the overall 768
cases 514 cases are used for training and remaining 154 test cases are used for testing
the classifier performance.
5.7.1 KNN Training Information
We have carried out 10 different test cases using the different random samples in the
Pima Indian Diabetes Dataset. Below table 5.2 shows the training in the KNN System
and the best K value in the test case 2.
Test Case 2 training and testing Information:
Best K Value Selection
In the time of training, the system substitutes the various values of k and calculates
the corresponding training and validation (testing) Error rates. We have given the
input value k=20 to the system. It has generated the training and testing errors for the
20 different k values. The system automatically finds the best k value based on the
Testing error Value. For the k value 14 the Error Rate is 16.23 and this is the
minimum validation error value among the set of 20 k values. The system has chosen
the minimum k value 14 as the best k value. The following table 5.2 shows the
training and testing error values for different k values and the selection of the best k =
14.

118
Table 5.2 Validation error log for different k and Best K=14
Value of k % Error Training % Error Validation
1 0.00 17.53
2 10.91 20.78
3 10.42 18.83
4 13.52 17.53
5 11.56 17.53
6 13.52 19.48
7 13.52 18.83
8 13.68 17.53
9 14.82 18.18
10 15.15 18.83
11 14.50 18.18
12 14.66 17.53
13 14.17 19.48
14 14.66 16.23 <--- Best k
15 14.82 16.88
16 14.98 17.53
17 15.31 17.53
18 15.96 18.18
19 15.31 16.23
20 15.96 16.23
Below Figure 5.3 shows the Training Error Curve for the different values of K in the
time of training. For the values of k=5 the error value is 11.56. Maximum error 15.96
came for the k value 20.

119
Figure 5.3 KNN Training Error Curve for Different K Values

120
Figure 5.4 KNN Validation Error Curve for Different K Values
Above Figure 5.4 shows the Validation Error for the various values of K. for the k
value 14 it gave the minimum testing error value 16.23%. For the K value 14, 19 and
20 it gave the minimum validation error value 16.23%. The value 14 is selected as a
best k value and used in the time of validation for classification because it came first
in the sequential order.
Classification Performance on Training Data
Following table 5.3 and 5.4 show the Classification Confusion Matrix and Error
Report for the training dataset which contains 614 cases. Class 1 points to “+ive to
Diabetes” and class 0 points to “-ive to Diabetes”. The KNN system classifies 524
cases out of 614 cases correctly and miss classifies 90 cases out of 614 cases wrongly.

121
The KNN Correct classification performance rate is 85.34% and the miss
classification Error Rate is 14.66%.
Table 5.3 Training Data scoring - Summary Report (for k=14)
Classification Confusion Matrix
Predicted Class
Actual Class 1 0
1 169 44 0 46 355
Table 5.4 Training Error Report
Error Report Class # Cases # Errors % Error
1 213 44 20.66 0 401 46 11.47
Overall 614 90 14.66
Classification Performance on Validation (Testing) Data
Following table 5.5 and 5.6 show the Classification Confusion Matrix for the
validation (testing) dataset which contains 154 cases. Class 1 points to “+ive to
Diabetes” and class 0 points to “-ive to Diabetes”. The KNN system classifies 129
cases out of 154 cases correctly and miss classifies 25 cases out of 154 cases wrongly.
The KNN Correct classification performance rate is 83.77% and the miss
classification Error Rate is 16.23%.
Table 5.5 Validation Data scoring - Summary Report (for k=14)
Classification Confusion Matrix
Predicted Class
Actual Class 1 0
1 41 14 0 11 88

122
Table 5.6 Validation (Testing) Error Report
Error Report
Class # Cases # Errors % Error
1 55 14 25.45 0 99 11 11.11
Overall 154 25 16.23
KNN Classifiers Correct and Miss Classification Performance for the 10
different test cases.
Below table 5.7 contains the report of the 10 different test cases correct and miss
classification information in the form of numbers. Among the 10 cases test case 1
gave minimum miss classification number 16 out of 154 test cases. Test case 9 gave
maximum miss classification number 32 out of 154 test cases. The average correct
classification number was 129.8 out of 154 and the average miss classification
number was 24.2.
Table 5.7 KNN Correct Classification Number for 10 different Test Cases.
KNN (CBR) Classifier’s Total Correct Classification and Miss
Classification Numbers for 154 Test Cases
Test .No Correct Classification Number Miss Classification
Number
1 138 16
2 129 25
3 127 27
4 133 21
5 128 26
6 136 18
7 125 29
8 129 25
9 122 32
10 131 23
Average
129.8
24.2
We have converted the number of correct classification number and miss
classification error numbers in terms of percentage. Below table 5.8 contains the
correct classification accuracy and miss classification error rate in terms of Percentage
(%). The test no 1 gives the minimum miss classification error rate 10.39% and the

123
test case 9 gave the maximum 20.78%. Over all the average correct classification
accuracy is 84.29% and the miss classification Error rate was 15.71%.
Table 5.8 KNN Correct Classification Accuracy for 10 different Test Cases
KNN(CBR) Classifier’s Correct Classification Accuracy and
Miss Classification Error Rate for 154 Test Cases
Test .No Correct Classification Accuracy
Miss Classification Error
Rate
1 89.61 10.39
2 83.77 16.23
3 82.47 17.53
4 86.36 13.64
5 83.12 16.88
6 88.31 11.69
7 81.17 18.83
8 83.77 16.23
9 79.22 20.78
10 85.06 14.94
Average 84.29 15.71
5.7.2 CT Training Information
We have carried out 10 different test cases using the different random samples in the
Pima Indian Diabetes Dataset using the Classification Tree technique. Below section
shows the training and testing in the Classification Tree System for the test case 2.
Test Case 2 training and testing Information:
Classification tree is built through a process known as binary recursive partitioning. This is an iterative process of splitting the data into partitions, and then splitting it up further on each of the branches.
Initially, it start with a training set in which the classification label (Class Value 1 and 0) is known (pre-classified) for each record. All of the records in the training set are together in one big box. The algorithm then systematically tries breaking up the records into two parts, examining one variable at a time and splitting the records on the basis of a dividing line in that variable (e.g insulin > 142). The aim is to attain as

124
homogeneous set of labels (Class 1 or 0) as possible in each partition. This splitting or partitioning is then applied to each of the new partitions. The process continues until no more useful splits can be found.
In the time of training the algorithm used 7 decision nodes for the purpose of splitting
the training dataset. The training dataset contains 614 patient data. The classification
tree contains two types of nodes. One type is decision node; it is represented in the
form of the circle. Another type is terminal node; it is represented in the form of the
rectangle shape. In the time of training, a full tree is created. The full tree contains 7
decision nodes and the 8 terminal nodes. Class 1 represents “+ive for Diabetes” and
Class 0 represents “-ive for Diabetes”. The following table 5.9 and Figure 5.5 Shows
the training error and training error curve for the classification tree. For the decision
nodes 1 to 5 it gave the error rate 15.31% and for the decision nodes 6 and 7 it gave
the error rate 12.7%.
Table 5.9 Training Log (Growing the full tree using Training data)
# Decision Nodes % Error
0 34.69
1 15.31
2 15.31
3 15.31
4 15.31
5 15.31
6 12.7
7 12.7

125
Figure 5.5 Training Error Curve for Different Decision Nodes

126
Full tree Diagram
Following Figure 5.6 show the diagram of full classification tree created out of the
training data. Xlminer software automatically gives the full tree rules which derived
from the tree for easy understanding in the time of explanation. Full Tree Rules are
represented in the form of a Figure 5.10.
Figure 5.6 Full Tree Diagram for Training Data

127
Table 5.10 Full Tree Rules (Using Training Data)
#Decision Nodes 7 #Terminal Nodes 8
Level Node
ID
Parent
ID
Split
Var
SplitVal
ue
Case
s
Left
Chil
d
Right
Child Class Node Type
0 0 N/A insulin 142 614 1 2 0 Decision
1 1 0 insulin 130.14 379 3 4 0 Decision
1 2 0 preg 4.5 235 5 6 1 Decision
2 3 1 Pg 106 169 7 8 0 Decision
2 4 1 Pg 124.5 210 9 10 0 Decision
2 5 2 age 27.5 108 11 12 1 Decision
2 6 2 dbp 74.660 127 13 14 1 Decision
3 7 3 N/A N/A 95 N/A N/A 0 Terminal
3 8 3 N/A N/A 74 N/A N/A 0 Terminal
3 9 4 N/A N/A 157 N/A N/A 0 Terminal
3 10 4 N/A N/A 53 N/A N/A 0 Terminal
3 11 5 N/A N/A 56 N/A N/A 0 Terminal
3 12 5 N/A N/A 52 N/A N/A 1 Terminal
3 13 6 N/A N/A 57 N/A N/A 1 Terminal
3 14 6 N/A N/A 70 N/A N/A 1 Terminal
The full classification tree contains 4 levels starting from the level 0 to 3. The
terminal nodes for class 1 and class 0 are in the last level-3. The decision nodes are
located in the in between levels level 0 to 2. The level 0 had one decision node. It
used the spilt variable called insulin (2-Hour serum insulin). It made the first split
partition. The insulin split variable split value is 142. In the first level there are two
decision nodes namely insulin and preg (Number of time pregnant). The second level
have 4 decision nodes namely Pg (Plasma glucose level), age and dbp (Diastolic
blood pressure).
XLMiner: Classification Tree - Prune Log (Using Validation Data)
Xlminer software used the validation data to prune the tree to give the Minimum Error
tree. The validation dataset contains 154 patient dataset. For the decision nodes 1 and
2 it gave the Error rate 17.53% and for decision nodes 3 to 7 it gave the same error
rate value 12.33%. It automatically selected the decision nodes number 3 as the best
number for the minimum error tree. Following table 5.11 and Figure 5.7 Show the
decision nodes and Error rate % in the form of the table and the graph.

128
Table 5.11 Best Pruned Tree and Minimum Error Tree
# Decision Nodes
% Error
7 12.337662 6 12.337662 5 12.337662 4 12.337662
3 12.337662 <-- Min.Err. & Best Pruned Tree
2 17.532468 1 17.532468 0 35.714286
Figure 5.7 Testing Error Value Curve for Different Decision Nodes

129
Best Pruned Tree Using Validation Data
Circle denotes a DECISION NODE
Rectangle denotes a TERMINAL NODE
Figure 5.8 Best Pruned Tree (Using Validation Data)
The Minimum Error Tree or Prune tree has 3 decision nodes and 4 terminal nodes.
The prune tree has 4 levels. Level 0 has the spilt variable insulin (2-Hour serum
insulin) with the splitting value of 142. The first level decision node has the preg
(Diabetes pedigree function) split variable with the splitting value of 4.5. The second
level decision node has the age spilt variable with the splitting value of 27.5. The
following table 5. 12 contain the prune tree rules for further explanation.

130
Table 5.12 Classification Tree - Prune Tree Rules (Using Validation Data)
#Decision Nodes
3 #Terminal
Nodes 4
Level
Node
ID
Parent
ID
Split
Var
Split
Value Cases
Left
Child
Right
Child
Class Node Type
0 0 N/A insulin 142 154 1 2 0 Decision 1 1 0 N/A N/A 88 N/A N/A 0 Terminal 1 2 0 preg 4.5 66 3 4 1 Decision 2 3 2 age 27.5 31 5 6 1 Decision 2 4 2 N/A N/A 35 N/A N/A 1 Terminal 3 5 3 N/A N/A 16 N/A N/A 0 Terminal 3 6 3 N/A N/A 15 N/A N/A 1 Terminal
Classification Performance on Training Data
Following table 5.13 and 5.14 shows the Classification Confusion Matrix and Error
Report for the training dataset which contains 614 cases. Class 1 points to “+ive to
Diabetes” and class 0 points to “-ive to Diabetes”. The CT system classifies 536 cases
out of 614 cases correctly and miss classifies 78 cases out of 614 cases wrongly. The
Classification Tree Correct classification performance rate is 87.30% and the miss
classification Error Rate is 12.70%.
Table 5.13 Training Data scoring - Summary Report
Classification Confusion Matrix
Predicted Class
Actual Class 1 0
1 157 56 0 22 379
Table 5.14 Training Error Report
Error Report
Class # Cases # Errors % Error
1 213 56 26.29 0 401 22 5.49
Overall 614 78 12.70

131
Classification Performance on Validation (Testing) Data
Following table 5.15 and 5.16 show the Classification Confusion Matrix and the Error
Report for the validation (testing) dataset which contains 154 cases. Class 1 points to
“+ive to Diabetes” and class 0 points to “-ive to Diabetes”. The Classification Tree
system classifies 135 cases out of 154 cases correctly and miss classifies 19 cases out
of 154 cases wrongly. The CT Correct classification performance rate is 83.77% and
the miss classification Error Rate is 12.34%.
Table 5.15 Validation Data scoring - Summary Report
Classification Confusion Matrix
Predicted Class
Actual Class 1 0
1 43 12 0 7 92
Table 5.16 Training Error Report
Error Report
Class # Cases # Errors % Error
1 55 12 21.82 0 99 7 7.07
Overall 154 19 12.34
CT Classifier’s Correct and Miss Classification Performance for the 10 different
test cases.
Below table 5.17 contains the report of the 10 different test cases correct and miss
classification information in the form of numbers. Among the 10 cases test case 3
gave minimum miss classification number 13 out of 154 test cases. Test case 7 gave
maximum miss classification number 29 out of 154 test cases. The average correct
classification number was 131.7 out of 154 and the average miss classification
number was 22.3.

132
Table 5.17 CT Correct Classification Number for 10 different Test Cases.
CT Classifier’s Total Correct Classification and
Miss Classification Numbers for 154 Test Cases
Test .No Correct Classification Number Miss Classification
Number
1 135 19
2 135 19
3 141 13
4 130 24
5 133 21
6 131 23
7 125 29
8 131 23
9 126 28
10 130 24
Average 131.7
22.3
We have converted the number of correct classification number and miss
classification error numbers in terms of percentage. Below table 5.18 contains the
correct classification accuracy and miss classification error rate in terms of Percentage
(%). The test no 3 gives the minimum miss classification error rate 8.44% and the test
case 7 gave the maximum 18.83%. Over all the average correct classification
accuracy is 85.52% and the miss classification Error rate was 14.48%.

133
Table 5.18 CT Correct Classification Accuracy for 10 different Test Cases.
CT Classifier’s Correct Classification Accuracy and
Miss Classification Error Rate for 154 Test Cases
Test .No Correct Classification Accuracy
Miss Classification Error
Rate
1 87.66 12.34
2 87.66 12.34
3 91.56 8.44
4 84.42 15.58
5 86.36 13.64
6 85.06 14.94
7 81.17 18.83
8 85.06 14.94
9 81.82 18.18
10 84.42 15.58
Average 85.52 14.48
5.7.3 Hybrid Classifier Information
We have carried out 10 different test cases using the different random samples in the
Pima Indian Diabetes Dataset using the new proposed Hybrid algorithm which
mentioned in the Section 5.6.
Hybrid Classifier’s Correct and Miss Classification Performance for the 10
different test cases.
Below table 5.19 contains the report of the 10 different test cases correct accuracy and
miss classification error information in the form of numbers. Among the 10 cases test
case 1 gave minimum miss classification number 15 out of 154 test cases. Test case 7
gave maximum miss classification number 25 out of 154 test cases. The average
correct classification number was 133.3 out of 154 and the average miss classification
number was 20.7.

134
Table 5.19 Hybrid Classifier’s Correct Classification Number for 10 different
Test Cases.
Hybrid Classifier’s Total Correct Classification and
Miss Classification Numbers for 154 Test Cases
Test .No Correct Classification Number
Miss Classification
Number
1 139 15
2 137 17
3 138 16
4 131 23
5 132 22
6 131 23
7 129 25
8 131 23
9 130 24
10 135 19
Average
133.3
20.7
We have converted the number of correct classification number and miss
classification error numbers in terms of percentage. Below table 5.20 contains the
correct classification accuracy and miss classification error rate in terms of Percentage
(%). The test no 1 gives the minimum miss classification error rate 9.74% and the test
case 7 gave the maximum 16.23%. Over all the average correct classification
accuracy is 86.56% and the miss classification Error rate was 13.44%.
135
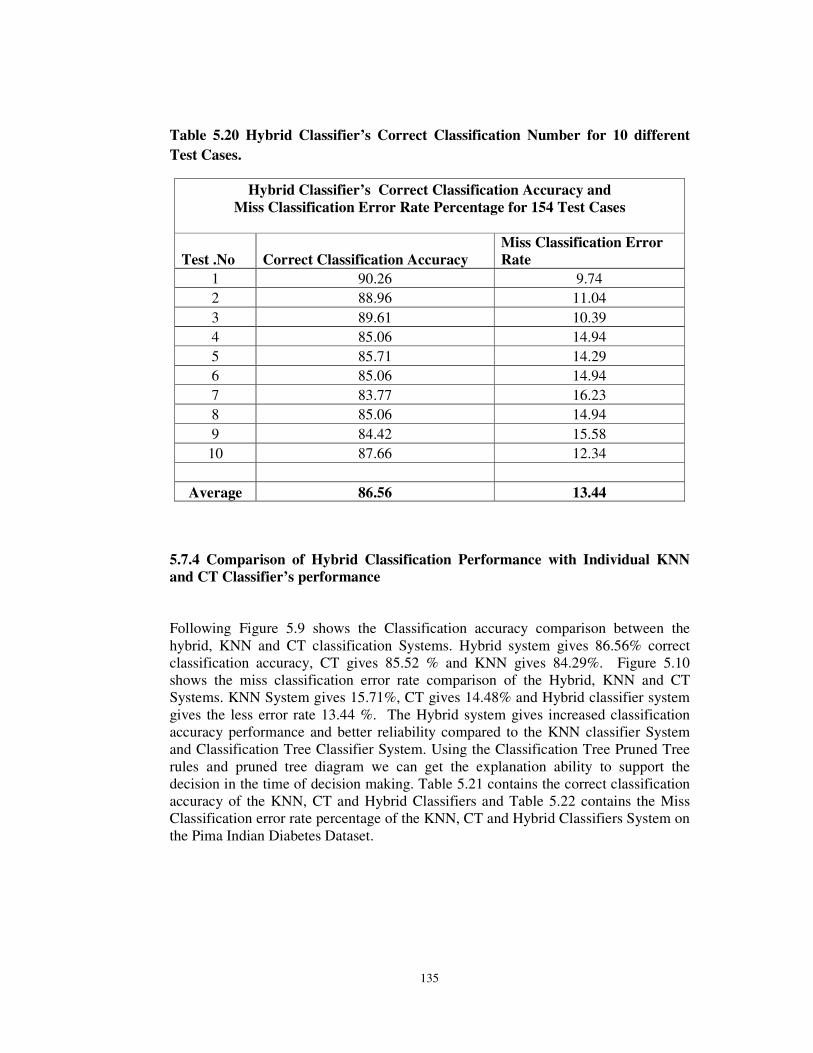
Table 5.20 Hybrid Classifier’s Correct Classification Number for 10 different
Test Cases.
Hybrid Classifier’s Correct Classification Accuracy and
Miss Classification Error Rate Percentage for 154 Test Cases
Test .No Correct Classification Accuracy
Miss Classification Error
Rate
1 90.26 9.74
2 88.96 11.04
3 89.61 10.39
4 85.06 14.94
5 85.71 14.29
6 85.06 14.94
7 83.77 16.23
8 85.06 14.94
9 84.42 15.58
10 87.66 12.34
Average 86.56 13.44
5.7.4 Comparison of Hybrid Classification Performance with Individual KNN
and CT Classifier’s performance
Following Figure 5.9 shows the Classification accuracy comparison between the hybrid, KNN and CT classification Systems. Hybrid system gives 86.56% correct classification accuracy, CT gives 85.52 % and KNN gives 84.29%. Figure 5.10 shows the miss classification error rate comparison of the Hybrid, KNN and CT Systems. KNN System gives 15.71%, CT gives 14.48% and Hybrid classifier system gives the less error rate 13.44 %. The Hybrid system gives increased classification accuracy performance and better reliability compared to the KNN classifier System and Classification Tree Classifier System. Using the Classification Tree Pruned Tree rules and pruned tree diagram we can get the explanation ability to support the decision in the time of decision making. Table 5.21 contains the correct classification accuracy of the KNN, CT and Hybrid Classifiers and Table 5.22 contains the Miss Classification error rate percentage of the KNN, CT and Hybrid Classifiers System on the Pima Indian Diabetes Dataset.

136
Table 5.21 Correct Classification Accuracy of KNN, CT and Hybrid Classifiers
S.No Classifier Type Classification Accuracy
1 KNN 84.29%
2 CT 85.52%
3 Hybrid 86.56%
Table 5.22 Miss Classification Error Rate of KNN, CT and Hybrid Classifiers
S.No Classifier Type Miss Classification Error
Rate (%)
1 KNN 15.71%
2 CT 14.48%
3 Hybrid 13.44%
Figure 5.9 Classification Accuracy Comparisons of KNN, CT and Hybrid Classifiers

137
Figure 5.10 Miss Classification Error Rate Comparisons of KNN, CT and
Hybrid Classifiers
5.8 Chapter Summary
The performance of the classifier depends on the dataset it is used for training and testing. Every machine learning algorithm has its own merits and demerits. There is no single machine learning algorithm which is going to give the best result for all the type of datasets. Data mining in medical field is a challenging task because of the complexity in the medical domain. In this research Hybrid classifiers system gave the reliability and performance which is the two top most expected priorities in the medical diagnosis task. The proposed method gave 86.56% classification performance which is more than the individual k-NN and CT system performances. The proposed hybrid method is tested on the 10 different test datasets from the Pima Indian Diabetes Dataset. The experimented results proved that the hybrid system gives more reliability and classification accuracy compare to the individual K-Nearest Neighbor of Case Based System and the Classification Tree System.
Miss Classification Error Rate Comparison between Hybrid, KNN and CT
Classifiers

138