hybrid music recommendation using k-means...
TRANSCRIPT
Hybrid Music Recommendation using K-MeansClustering
Gurpreet Singh150259
Vishal Kashyap150815
Jaskirat Singh150302
Pratham Verma150519
Bishal150193
Abstract
With the expanding digital music industry, the need for good music recommendationsystems is becoming more and more relevant. Popular methods such asCollaborative Filtering have been around for a while, and are used extensively.However, the method of Collaborative Filtering is extremely slow. To tackle this,we aim to use K-Means clustering on the user-features modelled using the user’slistering history and MFCC features of the songs, in order to reduce the scope ofsimilarity, and run collaborative filtering for a user only on the cluster he belongs to.This method does not limit the scope of the suggestions, while also providing speedto CF. Another problem with CF is that it is based purely on exploitation, and not onexploration. Hence we provide a simple strategy to provide recommendations basedon pure exploration.
1 Introduction
The concept of recommendation systems is perhaps the most upfront application of machine learning. With the digitalmarket comprising of over 50% of the recording industry, the problem of Music Recommendation Systems (MRS)has become more relevant over the years.
MRS is of great help for music fans making it easier for them to explore wide collection of songs from a huge groundof versatility and that too based on his taste and preferences. Almost all streaming services such as Apple Music,Spotify, Google Play Music, etc. use recommendation systems to provide new song recommendations to their users.
1.1 Problem Statement
In a typical recommendation system, there is a set of users, and a set of items. Each user rates a subet of items.The task of the recommendation system is to recommend a user u a list of items I, sorted with the order ofrelevance to the user. We have a similar goal.
For a given user u, we need to provide at most N suggestions most relevant to his previous listening history.The relevance of the suggestions is measured using truncated mAP (mean Average Precision).
1
1.2 Motivation
Most of the current MRS use collaborative filtering (CF), which is based on the idea of providing recommendationsbased on the responses of other users on a given song. Though this approach is evidently very successful andaccurate on huge databases of user responses, however it suffers from three major problems Speed, Sparsityand Scalability.
The idea of computing similarity between each user becomes inefficient for recommendation purposes, if thereare a large number of users. This calls for a simple and efficient method that sustains the accuracy of CF aswell as increase the speed of the recommendations, without much overhead of pre-processing.
As an added side effect, clustering also reduces the sparsity of the user-item ratings (per cluster), which helpsin providing more accurate recommendations.
Another caveat of using pure Collaborative Filtering is that the user gets stuck in similar recommendationsforever, without enough variation. Henceforth, we try to look on another approach to provide variations in therecommendations provided to the user.
2 Related Work
There are many studies which explore the patterns in the user-item ratings in order to cluster the users or items,effectively reducing the dataset as described earlier.
Ungar et al [1] used Repeated Clustering and Gibbs Sampling directly on the Ratings Matrix to cluster users basedon the user’s rating history and cluster items based on the users who have rated the corresponding item.
H. Chen and L. Chen [2] proposed Content Based filtering on the user’s history, to compute the user’s interest indifferent group of items. For clustering the items, they used inherent features of the MIDI songs.
Dong Kim et al [3] computed the user’s interest based on their proposed Dynamic K-Means Clustering. They usedSTFT (Shortes Time Fourier Transform) features of songs, and infer the user’s interest based on the user’s history.
There are other studies which use demographic or latent user features for clustering.Yoshii et al propsed a hybrid solution to collaborative filtering using latent user features. They used a “bag of timbres”to cluster items, and used these to model the users. Kim et al used users’ demographic features to cluster the users,and then used Collaborative Filtering on the group’s rating matrix as well as individual rating’s matrix and providedweighted recommendations based on the two approaches.
We propose a combination of the above two approaches, except that we cluster the users based on features modelledusing a “bag of songs” approach, and use Collaborative Filtering for a user using only the cluster that the user belongsto as the neighbourhood.
Along with this, we also propose a simple exploration approach to provide recommendations. Since most recommendationstrategies in use are based on exploitation, the user generally gets trapped in a bubble, without much variation.Henceforth, we propse a hybrid of exploration and exploitation techniques. In the following section, we discussthe standard method of Collaborative Filtering, and then later, we explain our proposed solution to tackle the the threeproblems of Collaborative Filtering.
3 Collaborative Filtering
Collaborative Filtering is used in almost all commercial recommendor systems. It is based on the simple idea ofproviding recommendations based on the rating history of similar users. There are two approaches to collaborativefiltering.
2

3.1 Model Based
Model-based recommendation systems involve building a model based on the dataset of ratings. In otherwords, we extract some information from the dataset, and use that as a "model" to make recommendationswithout having to use the complete dataset every time. [4]
There are many model-based CF algorithms such as Bayesian networks, clustering models, latent semanticmodels, etc. Most commonly, dimensionality reduction is used.
We represent the user-item relation as a ratings matrix R where Rij represents the rating that user i hassubmitted for item j. Also, the Rij = 0 if the user i has not used / rated the item j. This allows us to cast the
problem as a low-rank matrix factorization. The user and item features thus obtained can be used to predictthe remaining values of ratings matrix.
Model based CF can provide recommendations fast, however it is very difficult to add users or items in thismethod. This makes the method practically inefficient. Also, the ratings matrix being too sparse causes themethod to be inaccurate.
3.2 Memory Based
In this method, we direcly use the ratings data to provide suggestions / recommendations. In user-basedapproach, we compute the similarity between different users and the predicted rating for an item is computed asthe aggregation of the ratings for the same item given by similar users. Correspondingly, there is an item-basedapproach as well.
Similar to the case of model-based, we have a ratings matrix, and the set of unrated entries have the value 0.The most common measure to compute the user-user similarity is the Cosine Similarity Function
similarity (up, uq) =
∑j Rpj ·Rqj
‖Rp‖22 ‖Rq‖22
The most common formula for rating aggregation is the weighted sum of the ratings with the weights as theuser-user similarity
Rpj = K∑i
similarity (up, ui) ·Rij
The main advantage of memory-based methods is that we can add users and items without any extra hassle,which is not the case with model-based CF. However, computing user-user similarity between all the users isextremely slow, therefore, it becomes a necessity to reduce the dataset. For this, we propose clustering users,and computing the similarity only between uses of the same cluster. We use the same similarity metric as wellas the rating aggregation formula.
3.2.1 Locality of the Scoring Function
We can exploit the locality of our similarity function, and add a more generalized version of the scoringas suggested by Aoilli [5]. Hence, our new similarity metric becomes the Cosine Similarity powered to c.
similarity (up, uq) =
( ∑j Rpj ·Rqj
‖Rp‖22 ‖Rq‖22
)c
3

4 Methodology
Our approach to providing suggestions is based on four steps
1. Cluster songs using extracted MFCC features
2. Model user features based on their listening history and cluster probabilities of the songs
3. Cluster users based on their modelled features
4. Use User-Based Memory Collaborative Filtering to provide relevant suggestions.
We also propose a simple approach to provide suggestion based purely on exploration, which can be used togetherwith CF based approach to provide mixed recommendations.
4.1 Clustering songs using MFCC features
MFCC (Mel-Frequency Cepstral Coefficients) features have been popularly used in genre classification [6].MFCC features approximate the human auditory system’s response to signals. [7] The features are computedover a window of signals. We refer to this window as timbres.
In order to compute the item features, we find the mean and the standard deviation of each MFCC featuresof all the timbres of that song. We use these to cluster songs using Soft K-Means Algorithm, with a diagonalcovariance matrix.
4.2 Computing User Features
Since we are using Soft K-Means to cluster songs, for each song, we have the cluster weights i.e. a vector oflength k with each element as probability of that song belonging to the kth cluster. Using these as featuresvectors, for each user i, we can aggregate this over the songs the ith user has listened to. This serves as a soft“bag of songs” for each user, and hence the user’s features.
Let the cluster probabilities for song j be represented by γj and the set of songs user i has listened to berepresented by Ii, then we represent the user features for the ith user (ui) as
ui =1
|Ii|∑j∈Ii
γj
Each index l of ui represents the inclination of the user i towards the cluster l of the songs. We use thesefeatures to further cluster the users, before we finally perform CF.
4.3 Clustering Users
We have the user features modelled as explained in the previous section. We use these to cluster the users,using Soft K-Means with diagonal covariance matrix. We use EM algorithm to solve this, with the latentvariables as the cluster assignment.
4.4 Providing Recommendations
As mentioned earlier, we provide recommendations using both exploitation as well as exploration. For theexploitation part, we use Collaborative Filtering on clustered users, whereas for the exploitation, we use songs’clusters to provide recommendations from different clusters.
4

4.4.1 Exploitaion
As explained in Section 2.2, we use memory based collaborative filtering on the user clusters, and rankthe suggestions based on their predicted rating. This can also be seen that the similarity between userswho belong to different clusters is inherently 0. Therefore, we can rewrite the similarity metric fromSection 2.2
similarity (up, uq) =
∑
j Rpj ·Rqj
‖Rp‖22 ‖Rq‖22cluster (up) = cluster (uq)
0 else
Using this metric, we need not differentiate on the ranking aggregation or the sorting of the recmomendations.Therefore, we find the estimated ratings for each user-song pair, and for each user, report the top songs(at most N ) which have non-zero predicted rating.
4.4.2 Exploration
The main idea of exploration is to allow variations in the suggestions provided to the user. The quitepopular method Multi Armed Bandits allows providing mixed recommendations for both exploration andexploitation, however, it utilizes the repurchase value of items. Since in providing music recommendations,there must be no song that is repeated, we cannot directly use the method. Also, since our aim is to providepure exploration, we use a different approach.
As opposed to Multi-Armed Bandits, instead of choosing one song, for each user, we first sample a cluster(from the clusters of the songs) and then provide a single recommendation from this cluster. The samplingof clusters is done using a multinoulli, with the mixinf proportions for the lth cluster given as follows
P[zi = l
]=
1
K
√|Sl|∑
j∈Ωi∩Sl R−1ij
Here, Sl represents the set of songs in the cluster l and Ωi represents the set of songs user i has listenedto. K is the normalization factor.
These cluster proportions weigh the clusters which user has not extensively explored and weighs downthe clusters for which the user has provided lower ratings.
After sampling a cluster, we sort the songs for that cluster in the descending order of their popularitymultiplied by the cluster weight. The popularity of a song is essentially the sum of ratings that all usershave given for that song. We recommend the top song which the user has not yet listened to.
rj,l =∑i
Rij × P [ cluster(j) = l ]
This allows us to present songs which are more popular, and which better represent the clusters which wehave sampled.
We can provide k recommendations based on exploration by iterating this process.
We can provide suggestions based on exploitation and exploration in 4-1 ratio, i.e. For every 4 songs recommendedusing exploitation, we recommend 1 song based on exploration.
5

5 Experiments and Results
5.1 Dataset
We have used the Taste Profile Subset (a subset of the MSD Dataset [8]) which was previously used in thefamous MSD Challenge by Kaggle [9]. This dataset provides a list of user-song-count triplets for 1.1 millionunique users and 1 million unique songs.
We got the MFCC features for all the songs from MSD Benchmarks provided by Information Managementand Preservation [10]. They have provided means and standard deviations for all dimenstions of the extractedMFCCs from timbres. The extracted MFCCs are 13 dimensional, and hence the dimensions for song featuresobtained is 26.
5.1.1 Pre-processing
The following table tells us that the dataset is highly sparse, and thus very prone to overfitting.
Count Minimum Maximum Mean Median
Users per Song 1 110479 125.794 13
Songs per User 10 4400 47.457 27
For the purpose of training, we have removed users who have listened to lesser than 50 songs. After thisstep, we were left with approximately 300,000 users.
Also, we have replaced count with a binary value, 1 iff the user has listened to the song. Since the countdoesn’t necessarily represent the rating of a song, we ignore it, and set Rij = 1 iff user i has listened tothe song j at least once.
5.1.2 Train-Evaluation Split
We split the dataset into training and evaluation set based on the users in a 9:1 ratio, i.e. 90% of userswere considered into the training set, and 10% of the users were considered in the evaluation dataset. Thesplit is made after shuffling the users.
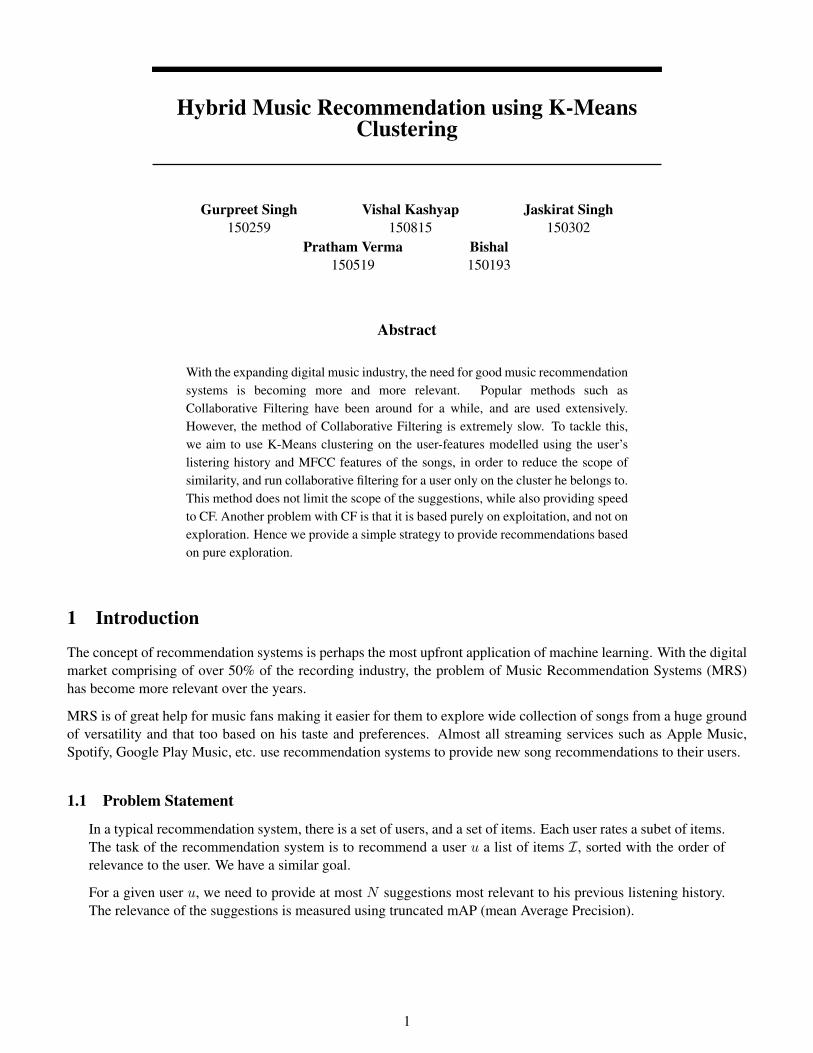
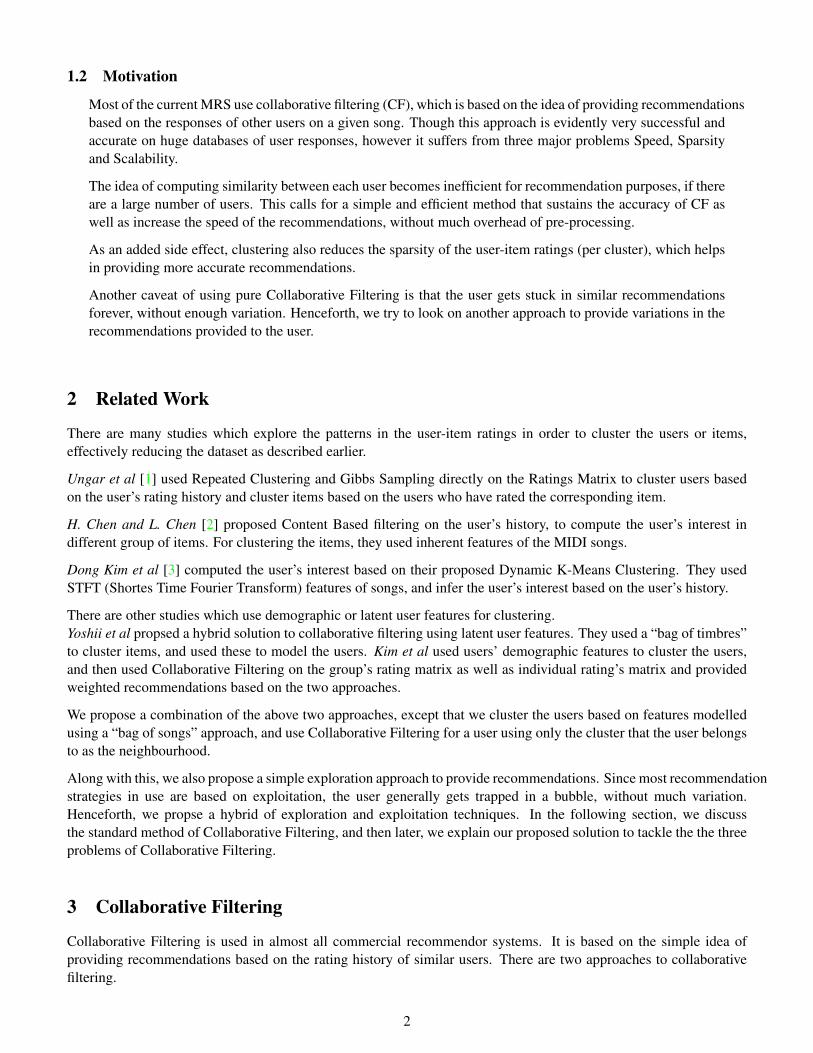
5.2 Number of Clusters for Songs
For the purpose of choosing the number of clustering, we used K-Means algorithm with diagonal covariancematrix over 500 iterations, used the elbow method to determine the optimal number of clusters.
Using the elbow method, we can infer that the optimal number of clusters for songs is ks = 10.
5.3 Number of Clusters for Users
Similar to the previous section, we used K-Means algorithm with diagonal covariance matrix over 500 iterations,and then used the elbow method to determine the optimal number of clusters for the users.
Using the elbow method, we can infer that the optimal number of clusters for users is ku = 20.
6

Figure 1: K-Means Variance Plot for Songs Clustering
Figure 2: LDA Plot of Track Features after GMM on 10 clusters
5.4 Recommendations based on Exploitation
After clustering users, we use Collaborative Filtering on all clusters independently, as explained in section4.4.1. Since A/B testing is not possible, we use truncated mAP@N (Mean Average Precision) to compareaccuracies for different localization exponents.
7

Figure 3: K-Means Variance Plot for Users Clustering
Figure 4: LDA Plot of User Features after GMM on 20 clusters
5.4.1 Truncated Mean Average Precision
In the case of recommendations, without A/B testing, it is difficult to correctly estimate the accuracy of arecommendor system. Since we cannot put a negative score on any recommendation, as we do not knowthe user’s opinions on that tracks, it makes sense to consider only the precision.
8

mAP is a very popular metric in estimating the accuracy of a recommendor system. It was also used inthe MSD dataset as the evaluation metric. It is essentially the mean of the average precision for everyuser.
For every user i, first the average precision is calculated as the average of the Precision@k for every recallpoint i.e. for every suggestion ranked at k that the user has listened to, we take the precision over the firstk recommendations and we compute the average over all such k’s. To calculate the mAP, simply averageover the average precisions for all users.
From the following table, we can infer that for user-user similarity, the optimal localization exponent is 7, as itprovides the highes mAP@500.
Localization Exponent (c) mAP@500
1 0.153092110732
2 0.206804120034
3 0.24325832841
4 0.262761192183
5 0.272772400673
6 0.27679672424
7 0.278189125154
8 0.277665534322
9 0.276124011391
If we compare the value with the highest mAP obtained by the winner of the MSD Challenge, who got thebest mAP@500 value equal to 0.17144, we have a significantly higher computed mAP. Although this is nota proper benchmark as the evaluation set is different, however, we can still infer that our model is good, andcompares well to other recommedor systems.
We also show the suggestions generated for the first use r in our evaluation set in the plot in Figure 5. Thesuggestions are generated with the localization exponent c = 7. The blue points represent the songs that theusers has listened to, whereas the black points represent the songs recommended to the user.
We can see that the recommendations are close enough to the actual tracks the user has listened to, and hencecan conclude the suggestions might be relevant.
5.5 Recommendations based on Exploration
Since exploration is purely based on A/B testing, we cannot have any benchmark test for this factor. We showthe explored recommendations for the first user in our evaluation set in the plot (Figure 6). Similar to theexploitaion case, the blue points represent the songs that the user has listened to, whereas the black pointsrepresent the songs recommended to the user.It can be observed that the recommendations based on exploration are quite random, as well as very dissimilarto the songs already listened to by the user. Therefore, we can conclude that the suggestions provided fromour approach satisfy the necessities of pure exploration based recommendor system.
9

Figure 5: Recommendations based on Exploitation to a User (c = 7)
Figure 6: Recommendations based on Exploration to a User
6 Conclusion
From the results, we can conclude that our exploitation approach provides good and relevant suggestions, and comparableto existing approaches to Collaborative Filtering, wheras our exploration strategy provides sufficient amount ofvariation to the recommendations.
10

Our results suggests that clustering does not have a major effect on the quality of recommendations, while reducingthe time taken to generatate predictions by a huge factor. Since GMM and K-Means are fast algorithms, we have alsoensured that the overhead of pre-processing is not very huge. Also, adding new users and songs is easy since we neednot recompute the clusters very often, moreover, since we are using Memory-Based Collaborative Filtering which caneasily handle additional users and tracks, without much recompution overhead.
7 Future Work
We can change the User-User Similarity metric to Localized Adjusted Cosine Similarty [5] for better and moreaccurate recommendations. Also, we can use item-based collaborative filtering, which has been shown to be havebetter results [5] and is considered more stable.
When the number of users increase, say over 100 millions (such as the case for Spotify [11]), we can try landmarkingthe users, based on the number of items they have rated and their cluster weights, and provide recommendationsconsidering only those users. Another approach could be to user hierarchical clustering, and collapsing inner-clustersinto a group, and converting the items set to be a bag of items from all the users in the group.
In order to tackle the cold-start problem of Collaborative Filtering, we can try providing weighted suggestions based onartist-artist similarity, and other demographic features of the user [12]. We can also expand the concept of explorationto artists, and explore on artists rather that tracks’ clusters.
References
[1] Lyle H. Ungar and Dean P. Foster. Clustering methods for collaborative filtering.
[2] Hung-Chen Chen and Arbee L.P. Chen. A music recommendation system based on music data grouping anduser interests, 2001.
[3] Dong-Moon Kim, Kun-su Kim, Kyo-Hyun Park, Jee-Hyong Lee, and Keon Myung Lee. A musicrecommendation system with a dynamic k-means clustering algorithm, 2007.
[4] Northfield Carleton College. Model-based recommendation systems.
[5] Fabio Aiolli. A preliminary study on a recommender system for the million songs dataset challenge, 2012.
[6] Francois Pachet Jean-Julien Aucouturier. Improving timbre similarity : How high’s the sky, 2004.
[7] Wikipedia. Mel-frequency cepstrum.
[8] Thierry Bertin-Mahieux, Daniel P.W. Ellis, Brian Whitman, and Paul Lamere. The million song dataset, 2011.
[9] Kaggle. The msd challenge, 2011.
[10] ifs.tuwien.ac.at. Million song dataset benchmarks.
[11] Spoitify. Current statistics of spotify.
[12] Byeong Kim, Qing Li, Chang Seok Park, Si Gwan Kim, and Ju Yeon Kim. A new approach for combiningcontent-based and collaborative filters, 07 2006.
11