hybrid plasma yearly report 2008 - pnnl
TRANSCRIPT
PNNL-18497
Prepared for the U.S. Department of Energy Under Contract DE-AC05-76RL01830
Annual Report for Hybrid Plasma Reactor/Filter for Transportable Collective Protection Systems—Phase 1B
Control: BA07PRO040 GB Josephson KG Rappe RG Tonkyn JG Frye June 2009

2
DISCLAIMER This report was prepared as an account of work sponsored by an agency of the United States Government. Neither the United States Government nor any agency thereof, nor Battelle Memorial Institute, nor any of their employees, makes any warranty, express or implied, or assumes any legal liability or responsibility for the accuracy, completeness, or usefulness of any information, apparatus, product, or process disclosed, or represents that its use would not infringe privately owned rights. Reference herein to any specific commercial product, process, or service by trade name, trademark, manufacturer, or otherwise does not necessarily constitute or imply its endorsement, recommendation, or favoring by the United States Government or any agency thereof, or Battelle Memorial Institute. The views and opinions of authors expressed herein do not necessarily state or reflect those of the United States Government or any agency thereof.
PACIFIC NORTHWEST NATIONAL LABORATORY
operated by BATTELLE
for the UNITED STATES DEPARTMENT OF ENERGY
under Contract DE-AC05-76RL01830
Printed in the United States of America
Available to DOE and DOE contractors from the Office of Scientific and Technical Information,
P.O. Box 62, Oak Ridge, TN 37831-0062; ph: (865) 576-8401 fax: (865) 576 5728
email: [email protected]
Available to the public from the National Technical Information Service, U.S. Department of Commerce, 5285 Port Royal Rd., Springfield, VA 22161
ph: (800) 553-6847 fax: (703) 605-6900
email: [email protected] online ordering: http://www.ntis.gov/ordering.htm

3
Annual Report for Hybrid Plasma Reactor/Filter for Transportable Collective Protection Systems—Phase 1B
GB Josephson KR Rappe RK Tonkyn JG Frye June 2009
Control: BA07PRO040
Prepared for Defense Threat Reduction Agency Under Contract MIPR9GO89XR066 Pacific Northwest National Laboratory Richland, Washington 99352

4
Hybrid Plasma/Filter for transportable collective protection systems— Phase 1b Yearly Report
Summary
Conventional collective protection systems typically employ HEPA filters for biological/radiological protection and activated carbon filters for chemical agent protection. Pacific Northwest National Laboratory (PNNL) and Edgewood Chemical and Biological Command (ECBC) are performing an assessment of a Hybrid Plasma/Filter system as an alternative to conventional methods for collective protection. The key premise of the hybrid system is to use highly reactive species (e.g. oxygen radicals, hydroxyl radicals, etc.) created in a nonthermal plasma (NTP) reactor to destroy the majority (~75% ‐ 90%) of an incoming threat, and then use single‐pass filtration to polish the remaining threat (and harmful reaction by‐products) to levels appropriate for breathing. This report covers activities during the second year of a planned three year assessment. During the first year a parallel plate NTP test reactor was designed and fabricated. The parallel plate design is scalable on three dimensions by increasing the width, length, and the number of flow channels. During scale‐up the gap between electrodes (plasma area) must be kept nearly constant to maintain practical operating voltages (<25kV). Incorporating catalysts into the NTP can improve the destruction of chemical threats and reduce energy requirements. During the second year two catalyst formulations were prepared and deposited onto 1/16th inch extrudates and then poured into the NTP reactor. The catalyst formulations were based upon a standard oxidation catalyst (Code 936 from Megtec) and a low temperature oxidation catalyst (Ce0.9Pr0.1O2) developed at PNNL. The second year also investigated a new hybrid concept to utilize the oxidizing capacity of ozone generated in the plasma for subsequent oxidation of contaminants retained in a high capacity zeolite‐based sorbent. Because activated carbon is not compatible with ozone another sorbent needs to be employed besides the current standard ASZM‐TEDA carbon. As a first‐guess selection a standard y‐zeolite was selected for initial testing. Testing confirmed that ozone could be used to oxidize adsorbed contaminants, but the oxidation was slow and only occurred when the adsorbent was catalyzed to decompose ozone. Ozone decomposition releases active oxygen or peroxyl radicals. These are postulated to be the actual oxidizers since ozone doesn’t react with adsorbed contaminants alone. Chemical testing utilized a high priority TIMs rated by a National Institute of Justice report to have a High hazard index (ethylene oxide, C2H4O), and an HD agent surrogate (methyl mercaptan, CH3SH) containing the “S” structural component, which is shown to also poison catalysts. Both contaminants illustrated an advantage of a packed NTP reactor. With modest plasma power both methyl mercaptan and ethylene oxide were deposited on the reactor packing and removed from the air stream without undergoing full mineralization or creating volatile partial oxidation products. Each was eventually mineralized in the NTP reactor releasing their mineralization products (CO2 and acid gas) over time. This was a fortuitous result that would likely only occur with “reactive” threats that could undergo

5
similar condensation reactions like CH3SH or polymerizations like ethylene oxide. However, the effect, though problematic for testing (leading to carbon imbalance), is advantageous when the objective is to remove the threat from the air stream without generating hazardous by‐products. Ethylene oxide (EtOx):
EtOx was readily destroyed by packed bed NTP reaction with modest energy input (95+% destruction with 90 J/L).
Packing the NTP reactor reduced the energy requirements by >80% vs. an open plasma with no packing; specific energy 35 J/L with packing (uncatalyzed) vs. 294 J/L with open flow channel.
Catalyzing the reactor packing further reduced the energy requirements; specific energy 22‐28 J/L (catalyzed) vs. 35 J/L (uncatalyzed). Both oxidation catalysts tested showed similar results.
High ambient humidity required greater energies for NTP reactor destruction.
Both oxidation catalysts (Ce0.9Pr0.1O2 and 3:1 Pt:Pd) were poisoned by products from sulfur containing contaminants.
Methyl Mercaptan(CH3SH):
Methyl mercaptan has a dampening effect on the nonequilibrium plasma discharges in an operating NTP reactor. It is postulated that the dampening comes from the high electron x‐section of sulfur so this effect could be useful to respond to any “S” containing threat.
Methyl mercaptan undergoes a plasma catalyzed condensation forming dimethyldisulfide, which is less volatile than methyl mercaptan.
Oxidation reaction of methyl mercaptan produces formaldehyde (which was tested last year) and SO2. The SO2 is adequately subsequently captured by the system adsorbents and remains in the system (probably as some form of sulfate).
The captured sulfate will poison system catalysts. Adsorber/ozone reactor
EtOx and methyl mercaptan react with ozone from the NTP reactor when the adsorbent is catalyzed to decompose ozone.
The adsorption capacity of the y‐zeolite selected to demonstrate the ozone reactor proof of principle was too low to be a practical absorber. Additional work is needed to identify a practical adsorbent that can be catalyzed for ozone decomposition.

6
Contents
Summary ............................................................................................................................................. 4
1.0 Chemical Destruction Testing .................................................................................................... 7
1.1 Introduction ........................................................................................................................ 7
1.2 Experimental ...................................................................................................................... 7
1.3 Conclusions—Chemical Destruction Testing .................................................................... 8
2.0 Adsorption Testing ................................................................................................................... 10
2.1 Conclusions—adsorption testing ...................................................................................... 10
3.0 Hybrid Plasma Single Pass Filtration Performance Assessment .............................................. 12
3.1 Conclusions (preliminary)—Hybrid Plasma Assessment ................................................ 13
4.0 Reactor Design and Fabrication ............................................................................................... 15
5.0 Catalysts ................................................................................................................................... 16
6.0 Appendix 1—Chemical Destruction Testing ............................................................................ 17
Results/Discussion ........................................................................................................... 17
7.0 Appendix 2—Adsorption Testing ............................................................................................ 34
8.0 Appendix 3—Reactor Fabrication ............................................................................................ 38
9.0 Appendix 4—Catalyst Preparation ........................................................................................... 40

7
1.0 Chemical Destruction Testing
1.1 Introduction PNNL and ECBC are performing an assessment of a Hybrid Plasma/Filter system as an alternative to conventional methods for collective protection. The key premise of the hybrid system is to use highly reactive species (e.g. oxygen radicals, hydroxyl radicals, etc.) created in a nonthermal plasma (NTP) reactor to destroy the majority of an incoming threat, and then use single‐pass filtration to polish the remaining threat (and harmful reaction by‐products) to levels appropriate for breathing. This report covers activities during the second year of the project. During the second year the treatment of ethylene oxide (ETOx), methyl‐mercaptan (CH3SH) and acetonitrile (CH3CN) was investigated. In addition, catalyst sulfur poisoning was investigated by running experiments on ETOx before and after exposure to CH3SH. Finally, results from the first year testing suggested that the system design could be improved by using a reactive adsorbent post‐plasma. The function of this post‐plasma sorbent would be to prevent the release of the contaminant during an exposure event and then allow the post‐event oxidation utilizing ozone produced at relatively low power in the plasma (i.e. an ozone reactor). This strategy would greatly reduce the required power and size of the plasma device. To the extent that the catalyst was self cleaning, it would also extend the life of the system. During this second year the ozone reactor was demonstrated at lab scale using a y‐zeolite adsorbent.
1.2 Experimental The experimental setup for our chemical destruction experiments was similar to year 1 work. We used compressed gases or a liquid bubbler to deliver the contaminant to our plasma‐catalysis system at a known concentration and flow rate. Water was added using a bubbler and the flow through the bubbler assumed to be fully saturated. The relative humidity was calculated by the ratio of the bubbler flow to the total flow. The “bath” gas was obtained from a zero air bottle containing 20% oxygen with the remainder nitrogen. In the final flow the oxygen percent was diluted slightly by the addition of the contaminant in pure nitrogen. Experiments during the second year of the hybrid plasma project utilized our three‐electrode parallel plate reactor assembly. Each electrode was formed from 65 mm x 65 mm alumina plates, with a 3 mm gap between electrodes. The two outer electrodes were grounded, and the high voltage applied to the interior electrode. Each electrode consisted of conductive paint applied to one alumina plate, with a second alumina plate placed on top and glass seal around the edges. The electrode edges were sealed except at the connection point—more detail is given in the year 1 annual report. The reactor assembly was sealed inside a short section of PVC pipe with silicone sealant. End‐caps equipped with ¼ inch tube fittings adapted the reactor to our tubing manifold. The electrode gap was filled with 1 mm alumina beads either uncoated for “blank” experiments or coated with one of the two oxidation catalysts. On occasion the gap was left empty to quantify the effect of packing vs. no packing. Downstream of the

8
plasma reactor we added two catalytic reactors fashioned from ½” quartz tubing. The first reactor was the test reactor for the adsorption ozone reactor concept and contained a small quantity of copper‐exchanged Y zeolite (Cu‐Y). The second reactor contained an ozone destruction catalyst, Carulite‐200 from Carus Corporation. This catalyst is a proprietary blend of predominantly manganese dioxide with copper The plasma reactor primary voltage was supplied by a computer‐controlled AC power supply connected to a high voltage transformer. The frequency was varied between 100 and 400 Hz. Software developed at PNNL adjusted RMS voltage to control input power based upon real‐time measurements of voltage and current. Input and output gases were analyzed using a Nicolet Magna 750 FTIR equipped with a 10 meter path length mirrored cell (volume ~ 2 liters) held at a pressure of 100 torr. After calibrating the instrument using purchased gas standards, test mixtures were analyzed using methods developed for the contaminants and by‐products using software supplied by Nicolet. Up to four possible sampling points were used—before or after the plasma device or after each of the downstream catalyst beds. Although the physical setup didn’t change noticeably in the second year, we did change our experimental method in many cases for improved analytical detection and to account for varying byproduct distributions. In addition to steady‐state tests, we ran pulsed contamination experiments consisting of a pulse of contaminant added for a limited duration of time. The contaminant level and known oxidation products were monitored in the final exhaust during and after the exposure until concentrations returned to baseline. Experiments conducted in this manner provide a representation of an actual exposure event, and are less time consuming than steady‐state testing. We also ran adsorption tests only on the downstream catalyst beds. For these experiments we removed the plasma reactor entirely, as its large volume made data interpretation difficult. The results and discussion of results are detailed in Appendix 1.
1.3 Conclusions—Chemical Destruction Testing Our tests indicate that a low temperature oxidation catalyst within a plasma reactor can be
effective in the destruction of ethylene oxide. The energy required to destroy 1/e of the input material dropped significantly when we added pure (uncatalyzed) Al2O3 beads to the plasma, and dropped even further when the Al2O3 was impregnated with an oxidation catalyst.
Exposure to methyl mercaptan, CH3SH, greatly reduced the oxidative effectiveness of the Pd/Ce0.9Pr0.1O2catalyst, presumably through poisoning via SO3 or SO4 salts. Similarly, the ozone decomposition catalyst (MnO2) was poisoned by exposure to CH3SH.
Simple design of a hybrid plasma/filtration system would consider three basic mechanisms to remove contaminants from breathing air: 1) destruction in NTP reactor, 2) adsorption on single‐pass filter, or 3) reaction in single‐pass filter. Both contaminants tested (EtOx and CH3SH) demonstrated a fourth mechanism that can be helpful to remove contaminants from breath air—polymerization (condensation). EtOx was very effectively removed from the air stream in the NTP reactor, but a carbon balance showed significant carbon remained in the reactor. Similarly CH3SH reacted on the NTP reactor beads (and adsorbent beads) forming dimethlydisulfide, which is less volatile than CH3SH.

9
Tests with acetonitrile and CH3SH confirm that adsorbed materials can be oxidized “post‐event” by ozone. The oxidation is relatively slow and requires catalytic decomposition of ozone within the sorbent bed.
Effective application of an ozone reactor/scrubber with the NTP will require higher adsorbent capacities and reaction rates.

10
2.0 Adsorption Testing
To design a hybrid plasma system that will adsorb (and subsequently react) contaminants that escape the NTP reactor the adsorption rate and capacity of the contaminant on the adsorbent must be known. Adsorption testing was conducted for chemicals that were tested during the current phase 1B of work, acetonitrile, ethylene oxide, and methyl mercaptan. The design parameters for adsorption were determined for use with the Wheeler model of adsorption. Where: C0 – is the inlet concentration of contaminant, g/L C—is the outlet concentration of contaminant, g/L kv—adsorption rate constant of the contaminant on the adsorbent, min‐1 ρB—is the bulk density of the adsorbent, g/L Q—is the gas flow rate, L/min W—is the weight of adsorbent, g We—is the adsorption capacity of the adsorbent for the contaminant, g/g t—is the exposure time of the sorbent bed to Co, min. When the log of the concentration data is plotted against time, the y‐intercept and the slope of the data curve relate to the Wheeler model parameters as such:
From the y‐intercept and the slope, the key design parameters can be calculated: the adsorption rate constant, kv and the major determining factor for the size of an adsorption bed, the adsorption capacity, We. The experimental methods, results, and discussion of adsorption results are detailed in Appendix 2.
2.1 Conclusions—adsorption testing
The primary purpose of testing in 2008 was to prove the principle of utilizing ozone as an oxidant to destroy adsorbed contaminants. This was accomplished and it was discovered that key to accomplishing the in‐situ destruction was to decompose the ozone. The initial selection of zeolite was satisfactory for conducting laboratory experiments, but was not a good candidate for a system design. The adsorption capacities of the selected Y‐zeolite were very low. This was good for lab testing because experiments could use a bed length that was long enough to ignore inlet/outlet effects but the bed saturated quickly so the experiments could be completed in reasonable testing times. In system design one wants much high adsorption capacities to minimize the amount of adsorbent required (weight and volume). The adsorption capacities for the initially selected Y‐zeolite were very low—between 0.0002 g/g and 0.003 g/g. In other words, to adsorb 1 g of contaminant would take between 300 g and 5000 g of y‐
tW
QCW
Q
k
C
CC
eB
V 00ln
Q
kWercepty
B
V
int
eB
V
W
Ckslope
0

11
zeolite. These adsorption capacities are very poor compared to carbon. Hence a primary objective of development for this technology is the selection of a significantly better adsorbent.

12
3.0 Hybrid Plasma Single Pass Filtration Performance Assessment
During the first two years of hybrid plasma testing the technology concept has matured and data for a pre‐conceptual design has been gathered. Incorporating an adsorption bed directly after the NTP reactor and catalyzing that adsorbent to be an ozone reactor offers an attractive potential improvement to the standard ASZM‐TEDA carbon filter, which must be replaced. The ozone reactor can be a self‐regenerating adsorber that can significantly extend the time between replacements. A simple process flow is shown below.
Hybrid Plasma Ozone Filter/Reactor Concept Schematic
To provide an assessment of a hybrid plasma technology a preliminary conceptual design has been completed for a system to treat 220 CFM of air contaminated with 1000 ppm (1800 mg/m3) of ethylene oxide (EtOx). The desired CT performance objective for such a system is to be 1,000,000 mg‐min/m3. Based on testing conducted this year the following performance parameters are used to estimate the overall system performance measures. Power is determined primarily from the power vs. destruction parameters of the NTP reactor. The NTP reactor is considered to operate normally between 30 J/L and 50 J/L (3.1‐5.2 kW for a 220 CFM system). When an attack occurs the power can be raised to a peak level of 200 J/L (21 kW). Based upon testing (not taking advantage of NTP catalysts) the specific energy (1/e) for EtOx is 57 J/L. If the NTP reactor is operated at 100 J/L during the attack (note this is below absolute peak) the EtOx leaving the reactor would be reduced 83% leaving about 300 mg/m3 in the air stream. A modest adsorber (e.g. to remove 75%) would reduce the EtOx in the treated air to 75 mg/m3, which is well below the IDLH levels for EtOx, 1440 mg/m3.1
1 National Institute of Justice, Guide for the Selection of Chemical Agent and Toxic Industrial Material Detection Equipment for Emergency First Responders, NIJ Guide 100-00, Vol. II, June 2000.
NTP Reactor
Adsorber/Ozone Reactor
Acid-gas Scrubber

13
Table 1 shows the estimated performance measures for a hybrid plasma system compared to the treatment objectives.
Table 1: Collective Protection System Performance Measures—220 CFM system
Reactor Pwr Sup. Ozone
Acid Gas Filter
hardware @ 50% Total per/cfm objective
vol. (ft3) 4 3 5 5 1.5 18.5 0.08 0.3wt (lbs) 400 200 250 200 37 525 1612 7.3 5power (kW) 3.1 0 0 0 3.1 0.014 0.12peak pwr 21 21 0.095
Basis of estimates: Reactor—The power supply and reactor electrode area are sized to provide up to 200 J/L in attack conditions. Since attacks are very infrequent the power usage is based upon a standard power delivery of 30‐50 J/L to react environmental contaminants and generate ozone to keep the adsorber clean. The electrode area is based upon 2007 laboratory testing on acetonitrile where 10 watts was delivered to the two‐cell laboratory reactor, a power density of 1.34 kW/L of flow channel volume. The overall reactor size is estimated to be 2ftx2ftx1ft deep and consists of seventy (70) 4 mm deep flow channels. Between each flow channel is an electrode between 2 mm thick Al2O3 plates. In the lab testing 1 mm thick Al2O3 plates were used, but it is anticipated that a larger area plate will also require a thick plates to maintain durability. During FY2009 testing the adsorption capacity of the y‐zeolite was very low. The required adsorbent based on the capacity of this year’s testing would be enormous. Rather than use this year’s data, which is obviously not representative of an adequate adsorbent, the size of the ozone reactor is estimated based upon a residence time of 1 sec for the 220 CFM flow. The ozone catalyst, if incorporated as a separate scrubber would require a residence time of 0.5 seconds. It is expected that catalyzing the adsorbent to decompose O3 while providing adsorption capacity will require more volume than just decomposing O3. Doubling the volume requirement seems to be a reasonable assumption, but has yet to be demonstrated. Determining ozone reaction/decomposition and optimizing adsorption is the primary objective of the next phase of this technology development. The system assumes a polishing carbon filter with a 0.25 second retention time, although it is hoped that a polishing filter will not be needed. The size of the acid gas scrubber is mainly determined by the generation of acid gases during normal operation, which is very low, but is continuous during operation of the system. Acid gases are generated in copious amounts during an attack, but the total time of an event is only a few hours.
3.1 Conclusions (preliminary)—Hybrid Plasma Assessment
At this early stage of development the estimated performance measures for the hybrid‐plasma Performance size and power appear attractive compared to the targets. The weight, however, is not attractive. Major contributors are the power supply, reactor (heavy dielectrics) and the ceramic adsorbents, which are heavier than carbon. The performance of the NTP reactor, however, is quite

14
attractive at significantly lower powers than previously tested, when NTP is considered as a single‐technology alternative.
15
4.0 Reactor Design and Fabrication
Reactor design and fabrication is a key technical capability for the high‐voltage electrically driven technology employed in the Hybrid Plasma/Filter project. The key issue for high‐voltage scale up is to create larger reactor volumes (to handle higher flow rates) without increasing gap distances between electrodes. As the reactor is scaled, the gap distance must be kept the same to maintain reasonable operating voltages of the reactor. The fundamental breakdown voltage to create a discharge in air is ~20 kV/cm. If the gap distance between electrodes increases upon scale‐up, the operating voltage must increase to maintain the breakdown voltage. Quickly, practical aspects to prevent breakdown of dielectic materials and unwanted shorting of high‐voltage electrodes make fabrication of equipment very expensive. Commercial electrical equipment such as transformers are readily available and relatively inexpensive up to operating voltages of ~30 kV. Above ~30 kV, special liquid filled transformers are required resulting in increased costs and problems associated with equipment transportation. To maintain a modest operating voltage, two basic design approaches can be employed: (1) repeating array of tubular electrodes or (2) parallel plate electrode. Early NTP research at PNNL was primarily conducted employing a concentric cylindrical reactor with a center high‐voltage electrode inside a dielectric tube (e.g. quartz or alumina). This configuration is easy to fabricate for small scale experiments but can only be approximated with a repeating array for scale‐up. This project has advanced the parallel plate fabrication technology. During the first year, three (3) lab‐scale parallel plate NTP reactors were fabricated. The first two reactors utilized one 3 mm flow channel with opposing electrodes on each side. The third reactor utilized two 3 mm flow channels with a single high voltage electrode discharging through dielectrics on both sides to neutral electrodes. This arrangement creates two flow channel and demonstrates the stacking scale‐up concept. A sketch of the third reactor is shown in Figure A1 in Appendix 1. This reactor was used for all of the lab testing conducted during year two. Details of the reactor fabrication were reported in the first year’s annual report. Scale‐up was further demonstrated during the second year. A larger (30X) reactor was built using the same parallel plate concept, which should be suitable for breadboard testing at a later phase of this project. Pictures of the 30X reactor are shown in Appendix 3.

16
5.0 Catalysts
A forty‐five pore per inch alpha‐alumina reticulated foam was employed as catalyst support in the original hybrid plasma catalyst preparations for minimizing pressure drop through the catalyst bed. The reticulated foam oxidation catalyst inserts measured 3mm x 195mm x 155mm. The porous alpha alumina catalyst substrates cut to these dimensions were very fragile, and catalyst fabrication on the substrates was anticipated to be difficult. Therefore, it was decided instead that the oxidation catalysts would be prepared on ~ 1mm diameter porous gamma alumina beads. Two separate oxidation catalyst compositions were prepared separately on the same type of bead support. A separate catalyst, located downstream of the plasma reactor, facilitates adsorption of volatile toxic agents and close coupled ozone decomposition. Oxygen radical species formed via ozone decomposition then facilitate destruction of adsorbed toxic agents. The two oxidation catalyst compositions used were a Pd/Ce0.9Pr0.1O2 and a Pt‐Pd / Al2O3 catalyst. The Pd/Ce0.9Pr0.1O2 catalyst had previously been identified as a very active CO oxidation catalyst that showed high activity at or near room temperature. The Pt‐Pd / Al2O3 catalyst recipe was obtained from Megtec for their 936 commercial 3‐way oxidation catalyst. The catalyst composition used in the downstream adsorber was a Cu‐exchanged Y‐zeolite, obtained as a 1/16” diameter extrudate. The NTP plasma catalyst chambers required ~ 182 cc of total catalyst volume, or ~ 91 cc of each of the two oxidation catalysts. The downstream catalyst bed volume used was ~ 500 cc. Specifics of the catalyst preparation are included in Appendix 4.

17
6.0 Appendix 1—Chemical Destruction Testing
Results/Discussion Ethylene Oxide We have tested ethylene oxide (EtOx) for adsorption on CuZ‐Y and MnO2, for destruction directly in a nonthermal plasma (NTP) discharge, and for destruction in a catalyzed plasma reactor. The catalyzed plasma experiments utilized the two PNNL catalysts supported on 1 mm Al2O3 beads, as previously discussed. Uncatalyzed Al2O3 beads were also tested to quantify the effect of packing without catalyst. With no packing in the parallel plate nonthermal plasma (NTP) discharge, ethylene oxide (EtOx) was surprisingly stable, requiring ~300 J/L of plasma energy to reach ~1/e (63% destruction) of the input level. At 300 J/L, a significant quantity of HNO3 (40 ppm) produced. Reaction products were primarily CO2 and CO produced at a 1:2 ratio, respectively. Potential partial degradation products that could be formed from the decomposition of EtOx include formaldehyde, formic acid, acetaldehyde or oligomers of EtOx. However, no organic partial oxidation products were detected with the FTIR. Below very high plasma powers there was a noticeable gap in the carbon balance. The most likely reason was that some of the EtOx was polymerizing within the NTP discharge. This likelihood was supported by noticeable deposits in the reactor and lines. These deposits were not analyzed.
0
100
200
300
400
500
0 50 100 150 200
EtOx in PlasmaEmpty reactor; 14% RH EtOx
EtOxHNO3
Power (J/l)
~ 309
~ 294
0
50
100
150
0 50 100 150 200
EtOx in PlasmaEmpty reactor; 14% RH
CO
CO2
Power (J/l) Figure 1: Ethylene oxide destruction in an open NTP reactor EtOx destruction using uncatalyzed Al2O3 beads in the NTP reactor was more promising. The steady‐state results at 14 and 50 % RH yielded 1/e energy densities of 35 and 57 J/l, respectively. The presence of the Al2O3 beads increased the efficiency of the process. The ratio of CO2 to CO increased from 1:2 to greater than 4:1 (240 ppm vs. 50 ppm), indicating more complete oxidation.

18
0
50
100
150
200
250
300
0
200
400
600
800
1000
0 50 100 150 200 250 300 350 400
EtOx on Al2O3 beads1.5slm; 50%RHC2H4O
CO2COHNO3
O3
Time (Minutes)
AddEtOx
1W 2W
EtOxOff
3W
1W
AddEtOx
0
50
100
150
200
250
0 20 40 60 80 100
EtOx on Al2O3vs Power at 14&50%RH
EtOx (50%RH)
EtOx(14%RH)
Power (J/l)
~ 35J/l
~ 57J/l
Figure 2: Ethylene oxide destruction in an uncatalyzed NTP reactor—products vs. power
We can draw some useful information from the figure on the left. The rapid rise of EtOx upon addition indicates that Al2O3 beads adsorb a relatively small amount of ethylene oxide. Once the plasma was turned on the signal was very slow to reach steady state. We attribute some of this effect to a gradual temperature increase in the reactor. As supporting evidence for this, the water signal always increased temporarily when plasma power was increased and decreased temporarily when it was decreased. It is also possible that the slow approach to steady state is due to changing conditions in the reactor, i.e. gradually coating the catalyst beads with carbon compounds. To check this possibility we turned off the ethylene oxide (at ~270 min. in the Figure 2) while leaving the plasma on. Both CO and O3 responded immediately, but CO2 dropped very slowly. The immediate rise in ozone and drop in CO indicates that the two are closely linked, as suggested by the gas phase plasma chemistry noted above. The slow response of carbon dioxide confirmed that much of the CO2 arises from material that is stuck on the catalyst, which then reacts with oxidants formed in the NTP. Because not much ethylene oxide adsorbed onto the catalyst initially, the source of the CO2 must be some sort of EtOx reaction product that does adsorb (e.g. polymerization products). This is a very useful result, since it means that the reactor can remove ethylene oxide from the inlet stream by storing reaction products for slower oxidation after the fact. It was this observation that suggested the possibility of changing the hybrid‐plasma protection strategy that we have noted above. The Pd/Ce0.9Pr0.1O2 oxidation catalyst was noticeably more reactive than the bare beads, yielding 1/e energy densities of 22 and 47 J/l at 14 and 50% relative humidity, respectively. As with the bare beads, the majority of carbon in the output gas was CO2, although the balance was not complete.

19
0
50
100
150
200
250
0 10 20 30 40 50 60 70
EtOx on Pr/Ce Oxidation Catalystvs Power at 14% RHEtOx
Power (J/l)
~ 22 J/l
0
50
100
150
200
250
0 20 40 60 80 100 120 140
EtOx on Pr/Ce Oxidation Catalystvs Power at 50% RH
EtOx
Power (J/l)
~ 47 J/l
Figure 3: Ethylene oxide destruction in a Pr:CeO2 catalyzed NTP reactor—products vs. power To show that the carbon imbalance was due to condensation of organic reaction products, the plasma was left on overnight (with just air + water input) to see how long the catalyst would take to completely “burn off” the accumulated carbon. Figure 4 shows that CO2 produced by the reactor after all carbon inputs were stopped. The output CO2 concentration dropped very slowly as carbon was removed from the Pd/Ce0.9Pr0.1O2 beads. Ozone increased as the carbon disappeared. The CO2 output integrated over time accounts for 80% of the carbon initially “lost” from the ethylene oxide destruction experiments.
0
10
20
30
40
50
60
70
80
0
50
100
150
200
250
0 100 200 300 400 500 600 700
Pr:Ce Catalyst"Cleaning" Catalyst Overnight
CO2
HNO3
O3
Time (minutes)
0.67W = 40 J/l
Figure 4: Long‐term CO2 emissions from a NTP reactor bed after inputs have stopped Figure 5 shows the test results for experiments using 3:1 Pt:Pd catalyst in the NTP reactor. The results are very similar to the Pd/Ce0.9Pr0.1O2 catalyst. Both oxidation catalysts were more energy efficient than bare alumina, and both seemed to be similarly affected by a reactor heating effect.

20
0
50
100
150
200
250
0 20 40 60 80 100
EtOx on 3:1 Pt:Pd/Al2O38.4 g; 1.5slm; 14 and 50% RH
EtOx v.s P at 14% RHEtOx vs P at 50% RH
Power (J/l)
~ 28 J/l
~ 55 J/l
Figure 5: Ethylene oxide destruction in a Pt:Pd catalyzed NTP reactor Pulsed exposure experiments‐‐EtOx destruction was tested using a pulsed‐exposure method, as illustrated in Figure 6 below. The testing consisted of exposing the NTP reactor to a pulse of contaminant and integrating the response. A 460 ppm pulse of contaminant was added for 1 minute while the reactor output was monitored. The destruction was determined as the reduction in the time integrated total EtOx detected in units of ppm‐minutes. For a steady flow these units represent the mass of EtOx detected. Comparing the pulsed exposure result to the steady state result we can see that they were very similar, and perhaps even a little smoother. The advantage of running the experiment in this manner is two‐fold. First, the experiment takes less time, and second, the test is a representation of an actual exposure event.
0
20
40
60
80
100
20 40 60 80 100 120
Pulsed EtOx testPr-Ce Catalyst; 50% RH
C2H4O
Time
0 J/l30 J/l
60 J/l
90 J/l
120 J/l
0
100
200
300
400
500
0 20 40 60 80 100 120 140
EtOx Out vs J/l on Pr/CeSteady State vs "pulsed exposure"
EtOx OutEtOx
Power (J/l)
PPM Out
PPM-Minutes Out
Figure 6: Ethylene oxide destruction in a Pr:CeO2 catalyzed NTP reactor—Pulsed experiments The final tests run on ethylene oxide compared the oxidation efficiency before and after exposure to a sulfur compound (methyl mercaptan). The purpose of the test was to investigate catalyst poisoning and evaluate the reversibility of that poisoning via exposure to a NTP discharge. Figure 7 shows the results of this test.

21
0
50
100
150
200
250
300
350
240 250 260 270 280 290 300 310
Plasma Destruction of EtOxover Pr/CeO
2
EtOx
Time
1.25 W 0.75 W
64 ppm
6 ppm
0
50
100
150
200
250
300
0
50
100
150
200
250
300
350
0 50 100 150 200 250
ETOx in Plasma with Pr/CeO2After CH3SH treatment
COCO2CH2O
EtOx
Time
320 ppm ETOx addedInlet values
Inlet0.75 W 1.25 W
Figure 7: EtOx destruction in a plasma reactor—before and after sulfur “poisoning” The figure on the left shows the initial EtOx destruction on clean catalyst. EtOx was introduced to the NTP reactor @ 320 ppm and allowed to reach steady state. When the NTP was turned on at 1.25W (~47 J/L) the EtOx immediately dropped to ~6 ppm (98% destruction). The plasma power was then reduced to 0.75W (~28 J/L) and the destruction was reduced. The outlet EtOx gradually increased to a new steady‐state concentration of ~64ppm (80% destruction). The poisoning stage of the experiment involved leaving the plasma on at 1.25 W and replacing the EtOx with 320 ppm CH3SH for 5 hours. The total exposure was ~6400 mM of sulfur. The figure on the right shows the retest after poisoning exposure. With the plasma off, EtOx was re‐introduced to the NTP reactor and the outlet concentration increased over an hour to near steady‐state. The power was turned on @ 0.75W and the EtOx concentration immediately dropped to near the “unpoisoned” result, but the concentration gradually increased to a level with significantly less destruction than before “poisoning”. Increasing the power to 1.25W improved the destruction and created more CO2, but the performance was obviously diminished. Clearly, the EtOx destruction efficiency degraded considerably after CH3SH exposure.
0
50
100
150
200
0 50 100 150 200 250 300
EtOx on Pr/Ce at 0.75WAfter poisoning
EtOx
Time_1
y = m1*(1-exp(-x/m2))ErrorValue
0.41379189.31m1 0.3419372.646m2
NA12215Chisq
NA0.99524R2
Extrapolates to 189 ppm
0
50
100
150
0 10 20 30 40 50 60 70
EtOx on Pr/Ce at 1.25 WAfter Poisoning
EtOx
Time
Extrapolates to 70 ppm
y = m1 + m2*exp(-x/m3)
ErrorValue0.7231670.503m1 0.6648869.929m2 0.4413114.647m3
NA2602.7Chisq
NA0.97545R2
Figure 8: Forecast steady‐state after catalyst poisoning Due to the extremely slow response of the system we extrapolated the values for the poisoned catalyst, as shown in Figure 8. The fits were excellent.
22
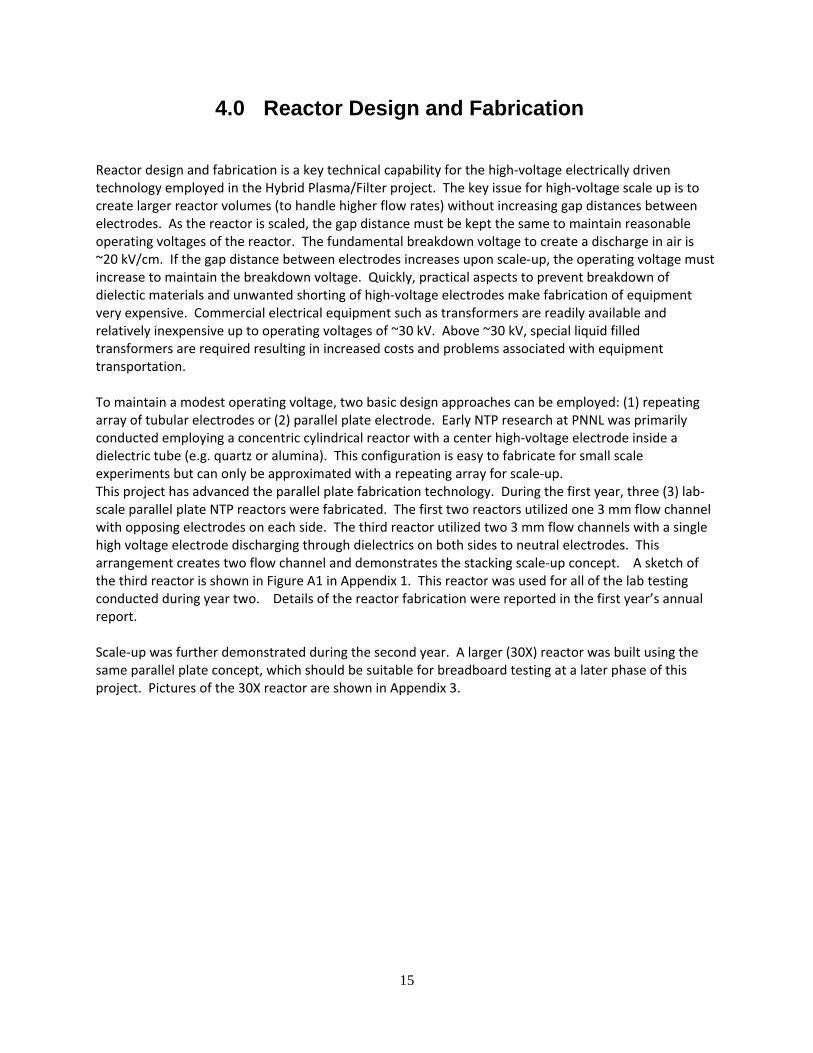
To determine if the “poisoning” could be reversed the plasma was left on overnight and repeated the EtOx destruction test, with no effect noticeable. The steady state results were 196 and 74 ppm, essentially the same as found before treating overnight in plasma, see Figure 9. The final result was that the 1/e value (specific energy) increased from 17 to 42 J/l—very similar to the pure Al2O3 case. Evidently, the catalytic properties of the Pd/Ce0.9Pr0.1O2 were mostly lost. This is not surprising, as sulfur is a well‐known oxidation catalyst poison, often attributed to sulfate formation on the active sites.
0
50
100
150
200
250
300
350
0 10 20 30 40 50 60
Poisoning of Pr/CeO2 by CH3SH
ETOx (clean beads)
ETOx (after exp.)
Power (J/l)
" ~ 17 J/l "
" ~ 42 J/l "
Figure 9: EtOx destruction—catalyst poisoning by sulfur Methyl Mercaptan Methyl mercaptan (CH3SH) was selected as a surrogate for threats containing reduced sulfur sites (e.g. sulfur mustard or H2S). In our initial test of CH3SH the first thing we discovered was its propensity to condense, forming dimethyldisulfide (DMDS), CH3SSCH3. The presumed stoichiometry is as follows.
2 CH3‐S‐H ‐‐> CH3‐S‐S‐CH3 + H2 (DMDS was identified in the vapor but H2 cannot be measured with FTIR) DMDS is a low boiling (~75C) liquid that will condense at room temperature. However the volatility of DMDS is sufficient that it eventually evaporates from the bed. Figure 10 shows the results of adsorption tests on Cu‐Y (left) and MnO2 (right). The results show a very different response to the two materials. MnO2 greatly facilitates the condensation reaction compared to Cu‐Y.

23
0
50
100
150
200
250
300
350
0 20 40 60 80 100
CH3SH on Cu-Y1.0 gm; 7/8" bed; ~15%RH
~317ppm in @ 1.6slmCH3SHDMDS
Time
0
50
100
150
200
250
300
350
40 60 80 100 120 140
CH3SH on MnO22.46 gm; ~15%RH
~317ppm in @ 1.6slm
CH3SHDMDS
Time
CH3SHOff
Inlet
Figure 10: Adsorption of CH3SH on scrubber beds, Cu catalyzed y‐zeolite and MnO2
The next test determined how CH3SH responded to the plasma. The presence of CH3SH had an extreme dampening effect on the strength and frequency of plasma discharges, as noted on an oscilloscope as well as by watching ozone production. We were able to somewhat counteract this tendency by reducing the AC frequency (400 to 100 Hz) and increasing the voltage across the gap to maintain the same power input. This seemed to re‐establish the evidence of microdischarges on the oscilloscope especially at low power. Note that this effect occurred with both packed and open plasma reactors, and is presumably a result of the electron attachment capability of CH3SH. Atomic sulfur has one of the highest electron affinities outside of the halogens, and this would be expected to carry over to a simple molecule like CH3SH. Problems with the plasma reactor, particularly at low energy, led to power‐destruction curves with an unusual shape, suggesting less efficient power transfer than with other contaminants. Figure 11 shows the power vs. destruction for CH3SH on uncatalyzed Al2O3 beads.
0
50
100
150
200
250
300
350
0 20 40 60 80 100 120 140
CH3SH vs Pwr on Al2O3 beads"cold" (not fit) vs warmed up
CH3SH (15%RH)Not fit
Power in (J/l)
~ 22 J/l
0
20
40
60
80
100
0
200
400
600
800
1000
1200
1400
1600
0 50 100 150 200 250
CH3SH in Plasma with Al2O3
CH3SHDMDSSO2CH2O
O3
Time
1.5 W
Add 340 ppmCH3SH CH3SH to
170 ppm
Water off(briefly)
Figure 11: Methyl mercaptan destruction in a plasma reactor In Figure 11 (left) the two red points indicate early test results when the reactor was first powered up. After the reactor was brought up to full power the power was gradually reduced, creating the data points in blue. These data points trace out a very smooth exponential decay curve. The observed hysteresis likely indicates thermal effects.

24
Figure 11 on the right shows FTIR data. Note the immediate drop in ozone upon addition of 340 ppm CH3SH. The ozone concentration quickly dropped from ~ 1000 ppm to ~ zero as the byproduct concentrations rose. The drop is too large to be chemically induced. It is believed the physics of the plasma are changed enough to reduce ozone formation. Reducing the input CH3SH to 170 ppm caused the ozone concentration to recover to ~ 100 ppm while the output DMDS and CH3SH dropped nearly to zero. Both figures suggest that NTP oxidizes CH3SH reasonably well, but changes to the plasma induced by CH3SH reduce O3 production and severely hinder the oxidation process. Figure 10 also shows the first appearance of a significant organic partial oxidation by‐product, formaldehyde. The partial oxidation reaction can be expressed as:
CH3‐S‐H 2O2 ‐‐> CH2O + H2O + SO2 Formaldehyde is an intermediate in the oxidation pathway of methyl mercaptan and is not a final product. Testing with the Pd/Ce0.9Pr0.1O2 catalyst gave results similar to uncatalyzed Al2O3. Because of the difficulty conducting steady state tests with CH3SH, we also ran some pulsed exposure tests. For these tests we added 350 ppm CH3SH for 15 minutes at various power levels. The CH3SH and product concentrations are time integrated after each pulse. The results of several pulses at different power levels are shown in Figure 12. At low power some CH3SH disappears and CH3SSCH3 appears, indicative of condensation. As power increases more oxidation products appear. Above 60J/l, CH3SH and DMDS are both eliminated and the CH2O intermediate reaches its peak. At powers above 70 J/L we would expect CH2O to be eliminated and CO to diminish; CO2 continues to increase as the reaction approaches full oxidation. As can be seen in the figure on the right neither S nor C is fully accounted for over the pulse integration periods suggesting that some amounts of both atoms are retained. The carbon balance improves at higher power inputs (high CO2 output), but it is not clear where the sulfur goes. A possibility is some sort of sulfate salt or possibly sulfuric or sulfurous acid, neither of which was detected.
0
50
100
150
200
250
300
350
0
20
40
60
80
100
120
140
160
0 10 20 30 40 50 60 70
CH3SH
Input CH3SH
DMDSCOCO2SO2CH2O
Power (J/L)
350 Moles CH3SH in
CH3SH on Pr/CeO2 Cat "CT" test: M out
0
50
100
150
200
250
300
350
400
0
50
100
150
200
250
300
350
400
0 20 40 60 80 100 120 140 160
CH3SH on Pr/CeO2 Cat "CT" test: 15minX347 ppm @1.5slm
M out during CT vs Power
C_total S_total Input CH3SH
Power (J/L)
350 Moles CH3SH in
Figure 12: Methyl mercaptan destruction products and overall “C” and “S” balances vs.
power input The next tests were to measure CH3SH destruction with the 3:1 Pt/Pd beads in the plasma reactor. The steady state results are shown below.

25
0
50
100
150
200
250
300
350
400
0 100 200 300 400 500
CH3SH on Pt/Pd in Plasma10.9g 3:1 Pt/Pd on Al2O3; 1.6slm; 15%RH
CH3SHCODMDSCH2OSO2
Time
350 ppm in
28J/l
38J/l47J/l
66J/l94J/l
s
0
50
100
150
200
250
300
350
400
0 20 40 60 80 100
CH3SH vsPower10.9g 3:1 Pt/Pd on Al2O3; 1.6slm; 15%RH
CH3SHCODMDSCH2OSO2HNO3
J/l In
Figure 13: Methyl mercaptan destruction in NTP reactor with Pt/Pd catalyst Again the results were similar to an NTP reactor with uncatalyzed Al2O3. At low power the primary product formed was DMDS, but as the power was increased other products appeared, including CO, CH2O and SO2. Overall, the energy requirements for destruction were higher than with the Pd/Ce0.9Pr0.1O2 catalyst. Although the data were not exponential in form, we can compare the 1/e points, of specific energies in any case. Specific energies were 58 J/l with Pt:Pd vs. 35 J/l with Pd/Ce0.9Pr0.1O2. Post NTP reactor processing: In the experimental setup we had two separate post‐plasma packed‐bed reactors. The first contained copper‐exchanged Y zeolite extrudates (Cu‐Y) and the second contained a bed of commercially obtained manganese dioxide (MnO2) extrudates. In order to asses the effectiveness of these post‐reactor “polishing” reactors, we used a valve system that allowed us to sample the gas stream at one of four places: at the inlet, after the plasma, after the Cu‐Y bed and after the MnO2 bed. In the following figures, sampling positions are identified as P‐2 for post plasma, P‐3 for post Cu‐Y and P‐4 for post MnO2. The MnO2 catalyst is known to catalytically remove ozone. We are interested in its potential to use ozone reactions on either of these catalysts to also remove contaminant or partial oxidation products exiting the plasma. Figures 14 and 15 below show results with CH3SH using a Pt:Pd oxidation catalyst in plasma followed by the two catalyst beds. Figure 14 shows the contaminant by products and Figure 15 shows ozone, with CO2 displayed in both. Methyl mercaptan is not shown because it was not detected. As can be seen in Figure 14, during the CH3SH exposure the catalysts in the CuY and MnO2 beds did not alter the CO and CO2 generated in the plasma. This is not surprising, as no ozone escaped the plasma until some time after the CH3SH was turned off. When CH3SH was turned off, CO2 began to increase steadily while CH3SH and DMDS quickly disappeared. As can be seen in Figure 15, CO2 production increased in unison with ozone.

26
0
50
100
150
200
0 10 20 30 40 50 60 70 80
CH3SH on Pt/Pd Cat in Plasma
11g; 1.6slm; 15%RH
COCO2HNO3DMDSCH2OSO2
Time
P-2 P-3 P-4
P-2 P-3
P-2
P-3 P-4 P-2
P-2 P-3 P-4
CH3SH Off
P-2: Post PlasmaP-3: Post CuYP-4: Post MnO2
94 J/l 19 J/l
Figure 14: Methyl mercaptan destruction in NTP reactor with Pt/Pd catalyst

27
0
20
40
60
80
100
120
140
0
80
160
240
320
400
480
560
0 10 20 30 40 50 60 70 80
CH3SH on Pt/Pd Cat in Plasma
11g; 1.6slm; 15%RH
CO2 O3
Time
P-2 P-3 P-4
P-2 P-3
P-2
P-3 P-4
P-2
P-2 P-3 P-4
CH3SH Off
P-2: Post PlasmaP-3: Post CuYP-4: Post MnO2
94 J/l 19 J/l
Figure 15: Post‐plasma results on Cu‐Y and MnO2 A relatively small percentage of CO2 was produced post‐plasma, as evidenced by the small increase between position 2 and positions 3 and 4. Most CO2 derived from oxidation of organic residuals in the NTP reactor. The CO concentration was steady with the NTP reactor power at 94 J/L at any post‐reactor sampling position. Not only was all the CO produced in the plasma, but its concentration did not depend on the presence or absence of CH3SH in the input stream, suggesting that it is formed from surface species on the Pt:Pd beads, and not from CH3SH directly. Comparing the O3 concentration leaving the ozone scrubber at the beginning and end of the experiment indicates clearly that the scrubber efficiency was significantly reduced by exposure to the CH3SH. To determine if the system was self‐cleaning, it was left running overnight at 0.5 W (20J/l). Post plasma: CO/CO2/O3 = 1/7/114 HNO3 ~ 5 ppm Post CuY: CO/CO2/O3 = 1/7/113 HNO3 ~2 ppm Post MnO2: CO/CO2/O3 = 1/9/96 HNO3 ~ 4 ppm The O3 destruction of MnO2 did not recover. We confirmed this result by putting in fresh catalyst beds, which under the same conditions led to the following: Post plasma: CO/CO2/O3 = 3/10/150 HNO3 ~ 7 ppm Post CuY: CO/CO2/O3 = 1/13/148 HNO3 ~3 ppm Post MnO2: CO/CO2/O3 = 2/16/0 HNO3 ~ 1 ppm

28
With the new MnO2 beads, no O3 escapes, proving that the catalytic activity was indeed damaged by sulfur deposition. In addition to damaging the catalytic oxidation of EtOx mentioned above, exposure to CH3SH also poisons the ozone destruction capability of MnO2. In order to assess the effects of CuY, MnO2 and the combination on CH3SH treatment we ran some pulsed exposure, or “CT” tests, on first CuY alone (3 gms), then on MnO2 alone (2.3 gms), and finally on a combination of the two (1.5gm CuY/2.5gm MnO2 ) in a single bed. The exposure was for 15 minutes of 320 ppm CH3SH at 1.6 slm, or a total CT of ~9000 mg‐min/m3. For these tests the plasma reactor was emptied and left on at a moderate power (30J/l) during exposure. The objective of the test was to determine whether the hybrid plasma system can adsorb the contaminant during a timed exposure event, and then oxidize it later using the ozone produced in the plasma. The plots below show the results of exposing fresh Y‐zeolite to the output of an unpacked plasma reactor running at 30 J/l. The plot on the left shows the major components. The plot on the right shows the lesser components on a smaller scale.
0
50
100
150
200
250
300
350
0
100
200
300
400
500
600
700
0 50 100 150
CH3SH DestructionMT Plasma Reactor + CuY
CH3SHDMDS
SO2O3
Time
Plasma Out System Out
AddCh3SH
AddCh3SH
IN
AddCh3SH
Ch3SHOff
4W 1W
Off
0.5 W 0W
AddCh3SH
0
50
100
150
0
50
100
150
200
250
300
350
0 50 100 150
CH3SH DestructionMT Plasma Reactor + CuY
COCO2
HNO3CH2O
SO2CH3SH
Time
Plasma Out System Out
AddCh3SH
AddCh3SH
IN
AddCh3SH
Ch3SHOff
4W 1W
Off
0.5 W 0W
AddCh3SH
Figure 16: CH3SH treated in a bare plasma and with Cu‐Y The results indicate that the plasma chemistry initially forms SO2 and formaldehyde, along with some CO. However as the concentration of ozone deteriorates, the output converts to mainly DMDS and CH3SH. The second exposure of CH3SH shows how completely the plasma chemistry has changed. The output is mainly CH3SH. After plasma + CuY treatment, only DMDS and a small amount of CO were observed. This is a useful result, indicating that CH3SH is adsorbed (and converted to DMDS) by the Y‐zeolite. The partial reaction product, CH2O, doesn’t make it through the adsorber. With proper design and sufficient adsorber capacity the DMDS could be retained in the adsorber and no undesirable products pass through the system. We note that no SO2 appeared downstream of the CuY, suggesting that it is removed by the zeolite in some fashion. Ozone and SO2 could feasibly react to form SO3 or SO4, either of which could deposit on the catalyst. Turning up the plasma power created a small CO/CO2 signal after the fact, but the amount produced was small‐‐ 500 ppm O3 produced less than 40 ppm CO + CO2.

29
Figure 17 shows a continuation of the test shown in Figure 16 after CH3SH is again started at the ~130 min. mark. After approximately 20 minutes of CH3SH addition, CH3SH appeared at the end of both adsorber/catalyst beds, though in a relatively small amount. It looked like DMDS was dropping at the same time. It is expected that if the CH3HS addition had continued the DMDS would have dropped off and CH3SH approached inlet values, but at this point the catalyst was well saturated with DMDS and/or CH3SH so the inlet CH3SH was shut off and the plasma turned on to see how well we could clean off the catalyst. DMDS slowly dropped, reaching zero just as ozone appeared. O3 slowly rose to steady state, along with a small CO2 signal. CO slowly dropped during this period, and there was no CH3SH or DMDS. Changing the power changed concentrations, but nothing else. After investigation of the plasma, we observed the CO2 dropping. This proves that some oxidation is occuring on the CuY, but it is extremely inefficient. For 1500 ppm O3, the yield is only 20 ppm CO2.
0
20
40
60
80
100
0
500
1000
1500
2000
2500
3000
0 50 100 150 200
CH3SH DestructionMT Plasma Reactor + CuY
CH3SHCOCO2
HNO3DMDS
O3
Time
CH3SHOf
Plasma to 2W Plasma
to 1WPlasma
to 2W
Plasma to 3W
Plasma Out
O3 BreaksThrough
Figure 17: Cleaning CuY catalyst after saturation with CH3SH We ran similar tests over 2.3 grams of fresh MnO2 catalyst. With the plasma off, as expected, most CH3SH was converted to DMDS on MnO2. By the end of the exposure the carbon and sulfur balance approached 100%, although the integrated results suggest ~22% of the CH3SH did not leave the system. Turning off the CH3SH and turning on the plasma produced a small CO2 signal, as well as some O3 breakthrough. Cleaning the catalyst at 3W plasma power produced an initial CO2 burst followed by a very steady production of ~30 ppm CO2 along with a trace of CO. Ozone out was ~1000 ppm. This is more efficient “post” oxidation than with CuY, but still very inefficient in any absolute sense. The empty plasma results at 1 W show mainly SO2, CH2O and CO production in the plasma. As usual the byproducts rapidly decline after initially adding CH3SH, presumably as the plasma changes and ozone disappears.

30
0
50
100
150
200
0
500
1000
1500
2000
0 50 100 150 200 250 300
CH3SH Destruction Empty Plasma Reactor + MnO2
CH3SHDMDS
O3
Time
P-2
0W
CH3SHOn
2W
3W
0.5W
CH3SHOn
3W
P-2
1W
CH3SHOn
3W
1W
CH3SHOn
1W P-2 P-21W
0
50
100
150
200
250
300
0
500
1000
1500
2000
0 50 100 150 200 250 300
CH3SH Destruction Empty Plasma Reactor + MnO2
COCO2
CH2OSO2
O3
Time
P-2
0W
CH3SHOn
2W
3W
0.5W
CH3SHOn
3W
P-2
1W
CH3SHOn
3W
1W
CH3SHOn
1W P-2 P-21W
Figure 18: CH3SH treated in an open NTP reactor and after an MnO2 adsorber/reactor Both CuY and MnO2 can adsorb CH3SH and then react with ozone to slowly oxidize it. We therefore decided to test the combination, thinking that the MnO2 would be a final ozone clean‐up catalyst. We packed a bed consisting of 1.5gm CuY followed by 2.5gm MnO2. Two exposure tests were run on fresh catalysts, using 1 W of plasma power (38J/l). For one test the system outlet products were monitored. In a second test the plasma outlet products were monitored. Chronologically, the system outlet test was done first because the catalysts were unexposed at that time, but we show the plasma out result first in Figure 19.
0
20
40
60
80
100
120
140
0
50
100
150
200
250
300
0 5 10 15 20 25
CT Test on CuY-MnO2 SystemPlasma Out at 38 J/l
CO
CO2
DMDS
CH2O
SO2
O3
CH3SH
TIme
330 ppm CH3SH In
0
50
100
150
200
250
300
350
0
40
80
120
160
0 5 10 15 20 25
CT Test on CuY-MnO2 SystemPlasma Out at 38 J/l
CH3SHS_totC_tot
SO2
Time
~330 ppm CH3SH In
Figure 19: CH3SH treated in a bare plasma and after a mixed Cu‐Y zeolite MnO2 adsorber/reactor There were no surprises in the plasma output results. There was early production of SO2 and CH2O that decayed away. The carbon and sulfur balances were reasonable but not complete. Only ~43% of the CH3SH disappeared in the plasma at 38J/l, with a relatively small amount (9.5%) reappearing as dimethyl‐disulfide (DMDS), the condensation product. Results of a similar CT test (pulsed contaminant) on the combined catalyst system are shown in Figure 20.

31
-10
0
10
20
30
40
50
60
70
0 20 40 60 80 100
CT Test on CuY-MnO2 SystemSystem Out at 38J/l
COCO2O3
DMDSCH3SH
Time
330 ppm x 15minCH3SH In
System Out(1W)
Ozone Breakthroughwith CO2 production
Figure 20: CH3SH treated in a bare plasma followed by Cu‐Y and MnO2 Not surprisingly most of the DMDS and all of the CH3SH disappears on the adsorber/reactor beds. We know from separate adsorption tests that the CH3SH will deposit on both CuY and MnO, tending to come off as DMDS. Note that none of the SO2 or CH2O gets through the catalyst. We do see CO during the exposure but not afterwards. Approximately 20 minutes after the exposure was over there was a small burst of CO2 just as ozone appeared in the exhaust. Evidently carbon is stored on the catalyst(s) and is oxidized by ozone quite awhile after the adsorption step. The wait time did not allow one to see if the CO2 out would balance the carbon, but the burst obtained with the appearance of O3 suggests that carbon can be slowly cleaned off the catalyst. It is clear that for a single shot exposure, the combination of plasma + CuY + MnO2 would do a good job at removing CH3SH. While some fraction of the removal is due to adsorption, there is also oxidation occurring. The fate of the sulfur is largely unknown, although a reasonable fraction is oxidized to SO2 in the plasma. However SO2 is held up on the catalysts, where it likely remains as sulfate. We have established that on either Cu‐Y or MnO2 it is possible to adsorb material during an exposure event which can subsequently be oxidized using a relatively low power plasma. We presume that ozone produced in the plasma is the main oxidizer, and recognize that the efficiency is not great. However this result does bring up the possibility of finding adsorbing materials that can be cleaned more efficiently in situ using a small steady stream of ozone. Further research is needed to determine the fate of sulfur in these materials. Acetonitrile Acetonitrile (CH3CN) was tested in year one of the project as a cyanide containing simulant. We returned to CH3CN in year two in order to test our hypothesis that a plasma‐catalysis system can operate in the adsorb‐then‐oxidize manner that we have discussed above. In normal operation we expect the plasma to be on at a low power, only to be turned up high during a contamination incident. An improved concept is that a catalyst downstream of the plasma can be used to adsorb the

32
contaminant of interest, which can then be oxidized in place by ozone produced in the plasma. In this mode we expect to apportion the oxidation between the plasma and the downstream bed. Our preliminary tests were designed as proof‐of‐principle experiments. In Figure 21 below we show results with 3.1 gm of fresh Cu‐Y catalyst. For representation of an actual exposure event, the catalyst was pre‐exposed to air for several hours @ 30 J/l plasma power at 10% RH. We then applied a short, concentrated pulse of CH3CN (900 ppm for 3 minutes) to the inlet stream, at which point we increased the plasma power to 100 J/l. We monitored CH3CN, CO and CO2 downstream of the reactor.
80
60
40
20
0
80604020
30J/l 100J/l 30J/l
CH3CN Out: ~1270 ppm-min out
CH3CN in: ~2940 ppm-min
CO+CO2 out: ~ 1010 ppm-min
980 ppmCH3CN infor 3 min
(CT~5400)
CO CO2 CH3CN
Figure 21: Results for CH3CN on a Cu‐Z‐Y catalyst downstream of the plasma. The CH3CN exposure was long enough that CH3CN broke through, although the catalyst was not nearly saturated. During the exposure and for the next 60 minutes the plasma was left on at 100 J/l, at which point the power was reduced to 30 J/l. The quantitative results were as follows. During the exposure to 8.1 mg of CH3CN, 0.17 mg escaped the catalyst. During the next hour another 3.6 mg desorbed. We measured up to 90 and 70 ppm of CO and CO2, respectively, during the exposure. The CO disappeared immediately after we stopped the flow of CH3CN, but CO2 was continually produced over the next hour, at a low but nearly constant concentration. After 50 minutes or so we reduced the power back to 30 J/l, with the result that CH3CN jumped back up a few ppm (6 to 21) and CO2 dropped from 9 to 2 ppm. This proves that it was indeed CH3CN that was being oxidized from the catalyst almost an hour after the exposure was stopped. We decided to try similar experiments on our MnO2 ozone catalyst, which is known to react with ozone. Figure 22 below shows a pulsed exposure test on 6.7 grams MnO2. We again pre‐treated the catalyst for some time with ozone (30J/l; 10% RH at 1.5 slm) and water. During and after the exposure (~980 ppm; 5 minutes; CT~9000) the plasma power was set at 100 J/l. Again during the pulse we observed CH3CN breakthrough, but not saturation of the catalyst. In this case, during the exposure we made much more CO2 than CO, suggesting that most of the CO formed in the plasma was oxidized to CO2. Overall, the carbon mass balance was excellent: ~140 mM CH3CN lost and ~240 mM CO2 recovered. The maximum possible was 280 mM, so this is almost complete oxidation. However the destruction of CH3CN was not complete—with either catalyst a fair amount of acetonitrile came out post‐exposure.

33
350
300
250
200
150
100
50
0
220200180160140
980 ppm CH3CN in
30 J/l 30 J/l 100 J/l100 J/l 30 J/l off
CO2: 3560 ppm-minCO: 47 ppm-min
CH3CN out: 2790 ppm-minCH3CN in: 4900 ppm-min CO
CO2 CH3CN
Figure 22: Results for CH3CN on a MnO2 catalyst downstream of the plasma. We expect that with proper sizing of the catalyst bed it would be possible to prevent any CH3CN from escaping during the exposure, but whether it would be desorbed during the oxidation step is not known. These were simply proof‐of‐principle experiments suggesting that with the proper materials and sizing one might be able to use an adsorb‐then‐destroy strategy rather than try to get full destruction in a single pass through an NTP reactor.

34
7.0 Appendix 2—Adsorption Testing
Acetonitrile adsorption testing Adsorption tests were conducted at 14% RH and at 50% RH. Adsorption was consistently reduced at higher humidity so the higher humidity data must be used for design, because it represents the worse case.
Figure 23: Acetonitrile adsorption on copper exchanged Y‐zeolite Figure 24 shows the adsorption data as a log of the concentration vs. time. The y‐intercept is 3.1 and the slope is ‐0.55 min‐1 yielding an adsorption rate constant of 434 min‐1 and an adsorption capacity of 2.0x10‐3 g acetonitrile/g y‐zeolite.

35
Figure 24: Wheeler adsorption parameters for acetonitrile adsorption on Cu exchanged Y‐zeolite
Ethylene oxide (EtOx) adsorption testing Figure 25 shows the adsorption isotherms for EtOx adsorption @ 50% RH on Cu exchanged Y‐zeolite.
Figure 25: Adsorption of EtOx on Cu exchanged Y‐zeolite
36
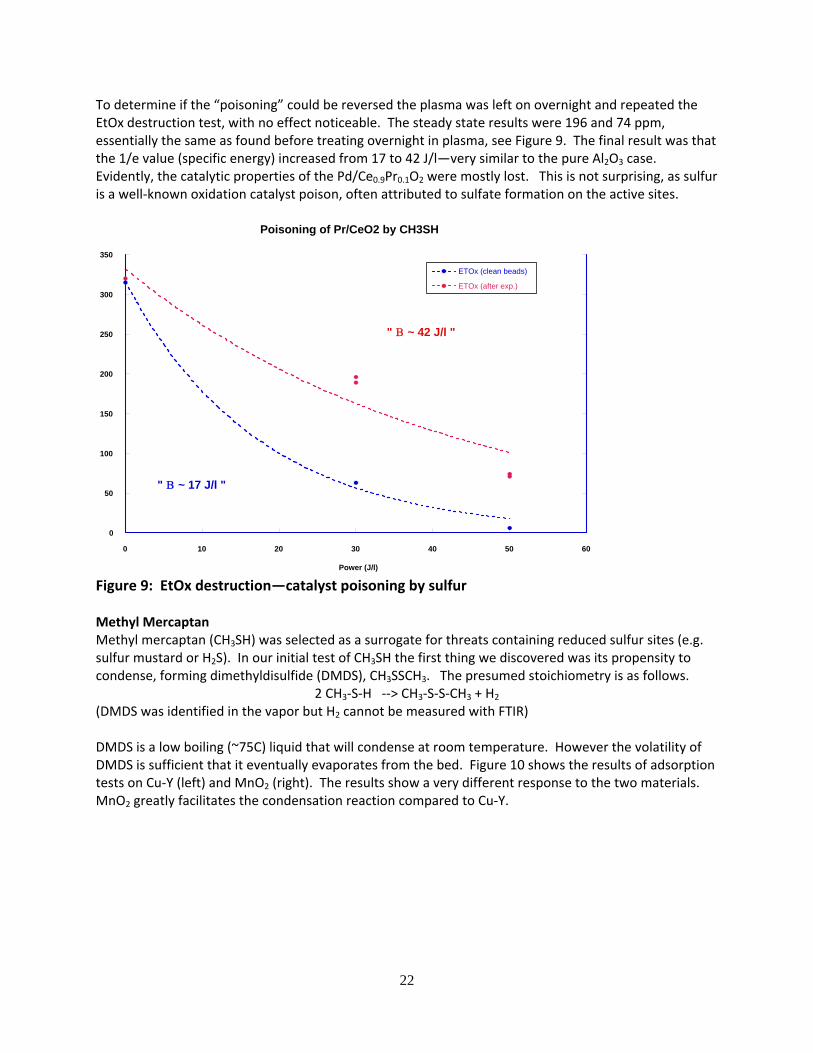
Figure 26 shows the adsorption data as a log of the concentration vs. time. The y‐intercept is 3.6 and the slope is ‐3.9 min‐1 yielding an adsorption rate constant of 833 min‐1 and an adsorption capacity of 2.0x10‐4 g EtOx/g y‐zeolite.
Figure 26: Wheeler adsorption parameters for ethylene oxide adsorption on Cu exchanged Y‐zeolite
Methyl mercaptan (CH3SH) adsorption testing Figure 27 shows the adsorption isotherms for methyl mercaptan adsorption @ 50% RH on Cu exchanged Y‐zeolite. Figure 28 shows the adsorption data as a log of the concentration vs. time. The y‐intercept is .11 and the slope is ‐0.22 min‐1 yielding and adsorption rate constant of 80 min‐1 and an adsorption capacity of 4.8x10‐4 g CH3SH/ g of y‐zeolite.

37
Figure 27: Methyl mercaptan adsorption on Cu exchanged Y‐zeolite
Figure 28: Wheeler adsorption parameters for methyl mercaptan adsorption on Cu exchanged Y‐zeolite

38
8.0 Appendix 3—Reactor Fabrication
The 30X NTP reactor was a two cell reactor constructed from six 195 mm x 185 mm x 1 mm 96% alumina plates. Three plates were screenprinted with an 85Ag‐15Pd electrode 155mm x155mm on one side. Two served as the neutral electodes and one served as the high voltage electrode. The electrode plates were then dried in a drying oven and fired at 1000ºC for 1 hour. Each of the electrodes was then screenprinted with Ferro 2051 ISO‐OHM Dielectric Paste to bond the electrode plate to a matching alumina plate to completely cover the metal electrode, thus creating a metal electrode completely encapsulated within a dielectric barrier (except for the electrode lead where the connecting wiring would be attached). The parts were then dried in a drying oven, assembled with superglue (to provide a temporary seal) and fired at 850ºC for 12 minutes to melt the dielectric paste and create a permanent dielectric seal. The lab‐scale reactors were “potted” into a 3” PVC pipe so the system could be plumbed and flow directed through the reactor (or collector).
Figure 29: Cross section of lab‐scale reactor in test pipe.

39
The 30X reactor used a flow distributor made of polycarbonate (and insulator and clear) on each end of the reactor to provide plumbing connections for the reactor.
Figure 30: 30X reactor with inlet feed manifold
Figure 31: 30X reactor with plasma discharge filling open gap between plates, no catalyst
Alumina plate (neutral electrode)
Plumbing manifold
Hi‐voltage electrode between flow channels
Plumbing inlet

40
9.0 Appendix 4—Catalyst Preparation
Pr‐CeOx / Al2O3 Catalyst (58562‐85‐1)
This catalyst composition (Pr0.1Ce0.9Ox) was one that was being used by Dr. Liyu Li at PNNL for near‐room temperature CO oxidation. Dr. Li was kind enough to give us enough of this catalyst to prepare our beaded catalyst. His precursor powder was prepared by thermally decomposing a mixture of Pr(III) Nitrate and (NH4)2Ce(IV) Nitrate (molar ratio of Pr:Ce =1:9). The resulting powdered catalyst was ballmilled in water to produce a slurry containing ~ 15% solids. The slurry mixture was used then to coat the catalyst composition onto 1mm diameter porous, gamma alumina beads (obtained from Sasol; product code 610110). The beads were placed into a plastic sieve then lowered into the slurry mixture for dip coating (like slip casting). After each coating, the beads were dried, then reweighed to check the weight gain. Following the final dip‐coating step, the entire batch of catalyst was calcined at 400°C for 4 hours to anchor the catalyst to the support.
Pt‐Pd / Al2O3 Catalyst (58562‐88‐1)
The desired commercial 3‐way oxidation catalyst that was desired for this application was Megtec, Inc.’s Code 936 catalyst. When we contacted them to see if we could obtain any of their material, we were told that the material was only available as 1/8” x 3/16” pellets. When the idea of crushing their pellets to a size fraction that we could use was put forward, we were told that crushing the pellets wasn’t recommended (metals may have been edge coated on their catalyst). They did volunteer that the metals that were used in their catalyst were Pt and Pd, and that the metals were used in a 3 to 1 ratio of Pt to Pd (molar ratio). The weight loading of their catalyst was ~ 1% as the reduced metals. So, we were going to have to fabricate our own 3‐way catalyst, based on what they had told us. This catalyst was also fabricated on the Sasol 1mm alumina beads, but the metals were added as a solution of the metal nitrates using the 3 to 1 Pt to Pd molar ratio described for the Code 936 catalyst. For a 100g batch of the Sasol 1mm alumina beads, the total impregnation solution volume was calculated to be ~46 cc (0.46cc/g x 100g). The total weight of metals needed for the catalyst is 1.0101g (0.1553g of Pd and 0.8545g of Pt). The impregnation solution was prepared using pre‐assayed Pd and Pt nitrate solutions obtained from Engelhard/BASF. The Sasol 1mm alumina beads were impregnated with the ~46cc of Pd/Pt nitrate solution using a rotary tumbler. The catalyst was aged for ~1hour, following impregnation with the metals solution, then was dried to nearly dry with a heat gun. The drying of the catalyst was completed by placing the catalyst in a vacuum oven (set at ~110°C; under house vacuum) to dry over night. The catalyst was subsequently reduced in a tube furnace at 250°C, while flowing ~200 sccm of an 8% H2 in He gas mixture.
Cu‐exchanged Y‐Zeolite Catalyst (58562‐92‐1) This catalyst was prepared using ~ 550cc of Zeolyst CBV100CY (~ 1/16” diameter extrudates). This material is ~ 80% CBV100 zeolite powder and ~20% gamma alumina, added as a binder. The CBV100 portion of the material is supplied from the vendor in the Na form. The manufacturer lists the Na2O content of CBV100 powder as 13.0% by wt. (equivalent to ~ 9.644g of Na+ per 100g of CBV100 powder or 0.4195 mole Na+ per 100g of powder). In order to obtain nearly complete exchange of the Na+ within the zeolite with Cu+2, it was decided to use ~ 120% of the necessary amount of Cu+2 in each of two cation

41
exchange treatments. The weight of the ~550cc of the CBV100CY extrudates was ~ 318.94g. Therefore, the weight of Cu(NO3)2 • 5H2O used to prepare the cation exchange solution was ~ 713.19g (2.569 moles) added to ~ 2 liters of D.I. water. Approximately ½ of the exchange solution was used for each of the two exchanges. After completing the two cation exchange treatments, the zeolite was washed several times to remove unbound Na+ ions. The washings were monitored using a conductivity meter to determine when most of the free Na+ ions had been washed out. Washing was ended when the rinse solution’s conductivity had dropped to less than 50 µmhos. After the catalyst washing was completed, the light blue‐colored Cu‐exchanged zeolite extrudates were dried at 120°C in a Blue M oven over a weekend.