hydorthermal carbonization (htc): valorisation of organic
TRANSCRIPT
Hydorthermal Carbonization (HTC):
Valorisation of organic waste and sludges for hydrochar production and biofertilizers
IEA Bioenergy: Task 36
October 2021
xxxx: xx
IEA Bioenergy: Task XX
Month Year
xxxx: xx
Copyright © 2020 IEA Bioenergy. All rights Reserved
ISBN, 978-1-910154-90-8
Published by IEA Bioenergy
The IEA Bioenergy Technology Collaboration Programme (TCP) is organised under the auspices of the International Energy Agency (IEA) but is functionally and legally autonomous.
Views, findings and publications of the IEA Bioenergy TCP do not necessarily represent the views or policies of the IEA Secretariat or its individual member countries
Hydrothermal Carbonization (HTC):
Valorisation of organic waste and sludges for hydrochar production of biofertilizers
Authors: Giovanni Ciceri, Marisa Hernandez Latorre, Maneesh Kumar Mediboyina and Dr Fionnuala Murphy
Edited by Mar Edo, Beau Hoffman, Inge Johansson and Daniel Roberts
Title of publication
Subtitle of publication
Authors and / or acknowledgements here
Edited by
IEA Bioenergy: Task 36
October 2021

3
Index PREFACE ........................................................................................................... 4
SUMMARY .......................................................................................................... 5
BACKGROUND ..................................................................................................... 6
WASTE SOURCE AND LOGISTICS ................................................................................ 7
TECHNICAL ASPECTS ............................................................................................ 10
ECONOMIC ASPECTS ............................................................................................ 12
ENVIRONMENTAL ASPECTS ..................................................................................... 12
POLICY ASPECTS ................................................................................................. 14
SOCIAL ASPECTS ................................................................................................. 14
LIFE CYCLE ASSESSMENT ....................................................................................... 15
Description of the case study ............................................................................... 15
Goal and Scope ............................................................................................... 15
Description of the system studied.......................................................................... 15
Life Cycle Inventory .......................................................................................... 16
Life Cycle Impact Assessment .............................................................................. 18
Results ......................................................................................................... 18
LESSONS LEARNED / RECOMMENDATIONS22
4
PREFACE
This is the second of a case study compilation to explore lessons on material and energy valorisation of waste within the framework of IEA Bioenergy Task 36. The set of case studies will be published during 2021 covering social and public acceptance aspects, barriers in Waste-to-Energy (WtE) implementation, success stories for decentralized solutions, and integration of WtE within material and/or nutrient recovery. The purpose of these case studies is to showcase examples from which countries can get inspiration and support in implementing suitable policies and solutions in the waste/resource management and WtE sector that would facilitate their transition towards circularity.
IEA Bioenergy Task 36, working on the topic ‘Material and Energy Valorisation of Waste in a Circular Economy’, seeks to raise public awareness of sustainable energy generation from biomass residues and waste fractions including MSW as well as to increase technical information dissemination. As outlined in the 3-year work programme, Task 36 seeks to understand what role energy from waste and material recycling can have in a circular economy and identify technical and non-technical barriers and opportunities needed to achieve this vision.
See http://task36.ieabioenergy.com/ for links to the work performed by IEA Bioenergy Task 36.
5
SUMMARY
Hydrothemal Carbonization (HTC) technology has demonstrated to successfully convert biowaste and sludge – which are input feedstocks - into high quality hydrochar, sometimes considered to be a more valuable product than biochar materials. Several HTC industrial plants operate in Europe. Ingelia, an HTC technology developer, operates its own industrial HTC plant in Valencia (Spain) since 2010, CPL Industries Ltd operates an HTC Plant in the UK which was commissioned in 2018 and a third plant is under construction in Belgium, expected to start operations in 2021. Ingelia HTC technology has been proven at commercial scale, reaching TRL9.
The HTC process acts as an acceleration of the natural coal formation process, working at moderate pressure and temperature (20 bar and 210 ºC for the Ingelia process), allowing the dehydration of the organic matter and increasing the C-content up to 60 wt.%. By means of HTC, feedstock with high moisture content converts into a coal-like product called hydrochar. The Ingelia HTC technology includes separation equipment for impurities that are present in the waste such as sands, stones, pieces of metals or glass. However, there are some inorganic components in the carbon structure, such as Ca, K, or P, that can be reduced by specific washing and chemical post-treatment steps. As a result of the HTC process, most of the carbon content of different wet organic waste streams is concentrated and retained within the obtained hydrochar.
HTC process represents a solution for the valorisation of biowaste streams, while generating a carbon-based solid fraction, hydrochar, that can be used as an energy source, a soil ameliorant, or as a feedstock to produce bioproducts. The hydrochar is chemically stable and storable, preventing the emission of methane if the feedstock would be landfilled. The moisture present in the feedstock condensates after the HTC process, and solubilises elements like N, P, K, etc. These elements represent a liquid biofertilizer that potentially can be used as a substitution of chemical fertilizers. The HTC process provides a source of renewable carbon whose properties can be adapted to its final application. The hydrochar can undergo specific post-treatment to reduce the content of specific nutrients to the limits accepted in the industry and energy sector, or to modify moisture content and density (by palletisation or briquetting) with the aim of delivering a product that can be sold as a natural resource for fossil coal substitution.
A life cycle assessment was carried out to determine the potential environmental impacts (global warming, freshwater eutrophication, and terrestrial acidification) of a large-scale HTC plant processing 78 000 ton of wet biowaste and sludge per year in Italy. The analysis highlighted three major contributors to overall environmental impacts; electricity and thermal energy used in the process, CO2 produced in the process, and the organic content in the waste streams impacting the environment when applied to land. The analysis shows that there is potential for improving the environmental performance of the HTC process by optimising energy use and using greener sources of energy.
6
BACKGROUND
It is estimated that 139 Mton of biowaste and more that 10 Mton of sewage sludge are generated in EU every year 1. Biowaste includes food and garden waste in mixed municipal solid waste (MSW), and waste from the food and drink industry. The biowaste can be separated at origin or collected in the mixed waste fraction. The waste handling options for the biowaste range from anaerobic digestion and composting, incineration, and landfilling. In the EU, biowaste usually constitutes 35 wt.% of the total mixed waste, but ranges from 18 wt.% up to 60 wt.%, and an important part of it is treated by the less preferable options in the waste hierarchy. On average, 41 % of MSW is landfilled2 while for some Member States (e.g., Poland and Lithuania) this percentage exceeds 90 %. The amount of sewage sludge landfilled in Europe in 2017 was 282 kton. These figures show that there is still room for further improvement of management of some major waste streams, especially as there is an increasing drive to move towards more ‘circular’ approaches to waste management.
Coal is steadily leaving the energy market in many developed economies due to a combination of environmental policies and competition with increasingly cost-competitive renewable energies. The International Energy Agency (IEA) recently published the World Energy Outlook 20193, drawing up three scenarios for the world coal consumption until 2040. In the Sustainable Development Scenario, industrial coal use decreases, but coal remains as an important fuel, reflecting the difficulty and high costs of finding substitutes for coal in the industrial processes. Coal remains the backbone of the iron and steel industry and cement sub-sectors, and its use in the chemical sub-sector keeps increasing, particularly in China. In the Sustainable Development Scenario, industrial coal consumption is estimated to be 844 Mton. Hydrochar can provide a great opportunity to replace fossil coal as it offers a carbon-designed adapted chemical composition to the customer needs, CO2 free (carbon neutral) and available in the local market.
Table 1. Hydrochar average chemical composition and properties. daf: dry and ash free; db:dry basis
C (% daf)
H (% daf)
N (% daf)
S (% daf)
Moisture (%)
Ash (% dry)
Volatile (% db)
Fixed C (% db)
60 6 1.5 0.1-0.3 <9 >10 65 25
The table below (Table 2) shows the industrial analysis of pulverized coal comparing the hydrochar with
different types of coali4.
All the reported hydrochar examples showed beneficial characteristics for usage in blast furnace (BFs), like a low sulphur content, which increases the quality of pig iron and steel, a low ignition point, and a good flammability. Some critical aspects have been identified in the ash content, ranging from 6 % of orange peel hydrochar, to 13% of green waste hydrochar, and grindability, lower than 60 for organic waste hydrochar. Grindability, ash content and ash melting point have been identified to be critical aspects. Orange peel hydrochar have been identified as the highest quality material, capable to increasing the steel quality if mixed with fossil coal. The mixing approach of hydrochar and fossil coal is representing an attractive opportunity for the application of HTC to the steel sector. The process allows to produce bio-coal by using different types of residues at the same time and at different percentages, so that the content of ashes can be controlled whether by mixing the original feedstocks or the hydrochar produced from different feedstocks. A 100 % replacement of pulverized fossil coal
1 IEA (2019), World Energy Outlook 2019, IEA, Paris https://www.iea.org/reports/world-energy-outlook-2019 2 Eurostat, Municipal Waste 2008 3 IEA (2019), World Energy Outlook 2019, IEA, Paris https://www.iea.org/reports/world-energy-outlook-2019 4 4 EUBCE 2018 Evaluation of utilising Ingelia hydrochar produced from organic residues for Blast Furnaces Injection
7
in blast furnaces could be achievable only upgrading the Ingelia bio-coal into a material with higher fixed C content, e.g. by slow pyrolysis.
Table 2. EUBCE 2018 Evaluation of utilising Ingelia hydrochar produced from organic residues for Blast Furnaces Injection
Sample C
(% db) H
(db %) N
(db %) S
(db %) Moisture (db %)
Volatile (% db)
Ash (% db)
Fixed C (% dry)
O (% db)
Lingyuan anthracite
77.38 3.61 0.86 0.90 0.84 13.21 15.02 70.93 1.35
Shenhua bituminous coal
65.12 4.05 0.92 0.34 5.05 35.88 8.58 49.49 15.94
Hydrochar from green waste
50.94 4.95 1.43 0.38 2.58 57.82 15.97 23.63 23.75
Hydrochar from organic fraction
58.61 6.72 2.24 0.31 2.11 68.76 12.88 16.25 17.13
Hydrochar from orange peel
58.06 5.08 1.56 0.166 3.51 59.66 6.18 30.65 25.45
Energy facilities and industries from different sectors have shown interest in using hydrochar as raw material for substituting coal or as biofuel in the energy sector. However, the average ash and volatile carbon content (Table 1) needs to be reduced in order to increase the quality of the final product. Research and trials carried out by Ingelia showed that it is possible to transform the hydrochar into a high-quality carbon-based material, similar to coking coal (classified as a critical raw material according to the 2020 CRM list of EC5), by applying post-treatment to the hydrochar for ash separation and thermal treatment to increase the fixed carbon content.
A by-product of the HTC process is a liquid biofertilizer, containing soluble alkali elements and highly assimilable nutrients. Research carried out in cooperation with IVIA (the public Institute for Agricultural Research in Valencia, Spain) and technology institute AINIA (Valencia, Spain), showed that the HTC liquid phase can be considered as an enriched effluent increasing plant growth, acting as a biofertilizer or for feeding Anaerobic Digestion (AD) plants, generating biogas. Due to the HTC process conditions, this liquid biofertilizer is free from microorganism or bacteria. Heavy metals present in the feedstock are retained in the hydrochar. After some enrichment steps, a suitable concentration of nutrients can be achieved, and the liquid phase represents a potential commercial biofertilizer.
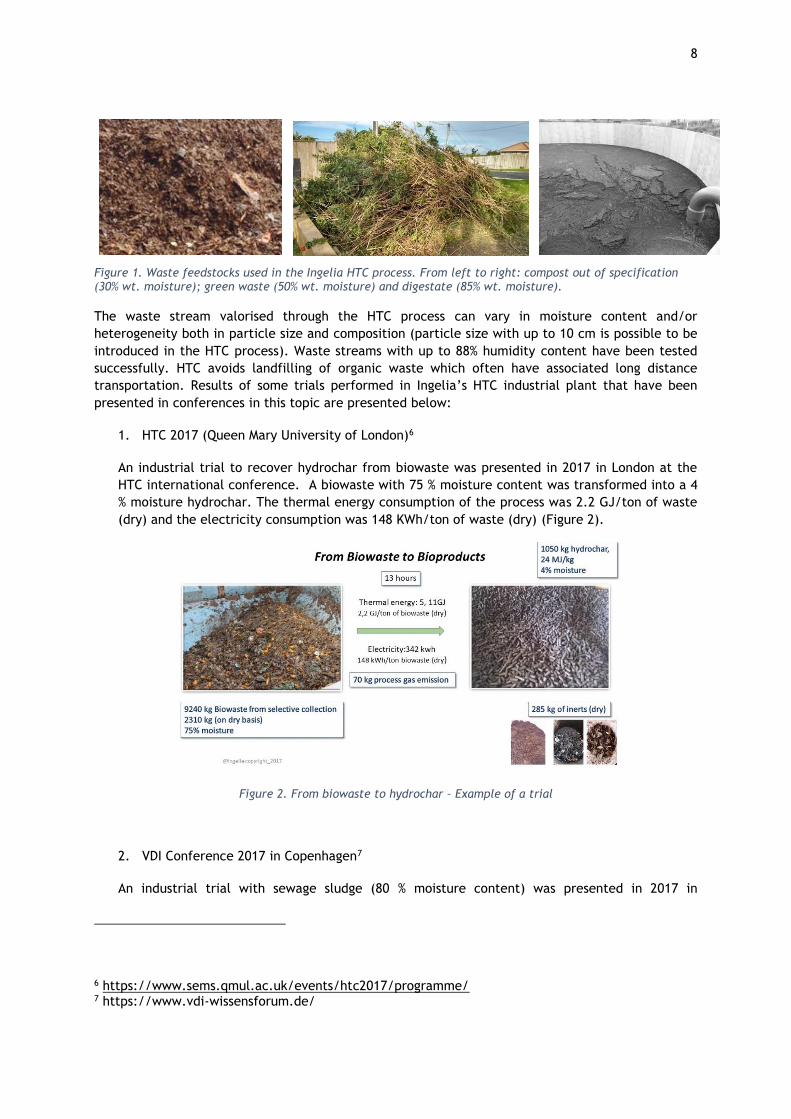
WASTE SOURCE AND LOGISTICS
Heterogeneous waste streams with a high moisture content can be difficult to store and manage
without a specific treatment. In addition, decomposition or fermentation generates CO2 and CH4
emissions into the atmosphere. HTC provides a solution for converting these waste streams into stable
and valuable products. Many kinds of organic waste streams can be used in the HTC process to produce
bio-carbon and biofertilizers. As an example, waste streams shown in Figure 1 have been tested at
Ingelia industrial plant. HTC can be also a solution for biowaste streams with high content of plastics
(up to -15 % on dry base) that cannot undergo composting.
5 https://ec.europa.eu/docsroom/documents/42849
8
Figure 1. Waste feedstocks used in the Ingelia HTC process. From left to right: compost out of specification (30% wt. moisture); green waste (50% wt. moisture) and digestate (85% wt. moisture).
The waste stream valorised through the HTC process can vary in moisture content and/or
heterogeneity both in particle size and composition (particle size with up to 10 cm is possible to be
introduced in the HTC process). Waste streams with up to 88% humidity content have been tested
successfully. HTC avoids landfilling of organic waste which often have associated long distance
transportation. Results of some trials performed in Ingelia’s HTC industrial plant that have been
presented in conferences in this topic are presented below:
1. HTC 2017 (Queen Mary University of London)6
An industrial trial to recover hydrochar from biowaste was presented in 2017 in London at the
HTC international conference. A biowaste with 75 % moisture content was transformed into a 4
% moisture hydrochar. The thermal energy consumption of the process was 2.2 GJ/ton of waste
(dry) and the electricity consumption was 148 KWh/ton of waste (dry) (Figure 2).
Figure 2. From biowaste to hydrochar – Example of a trial
2. VDI Conference 2017 in Copenhagen7
An industrial trial with sewage sludge (80 % moisture content) was presented in 2017 in
6 https://www.sems.qmul.ac.uk/events/htc2017/programme/ 7 https://www.vdi-wissensforum.de/
9
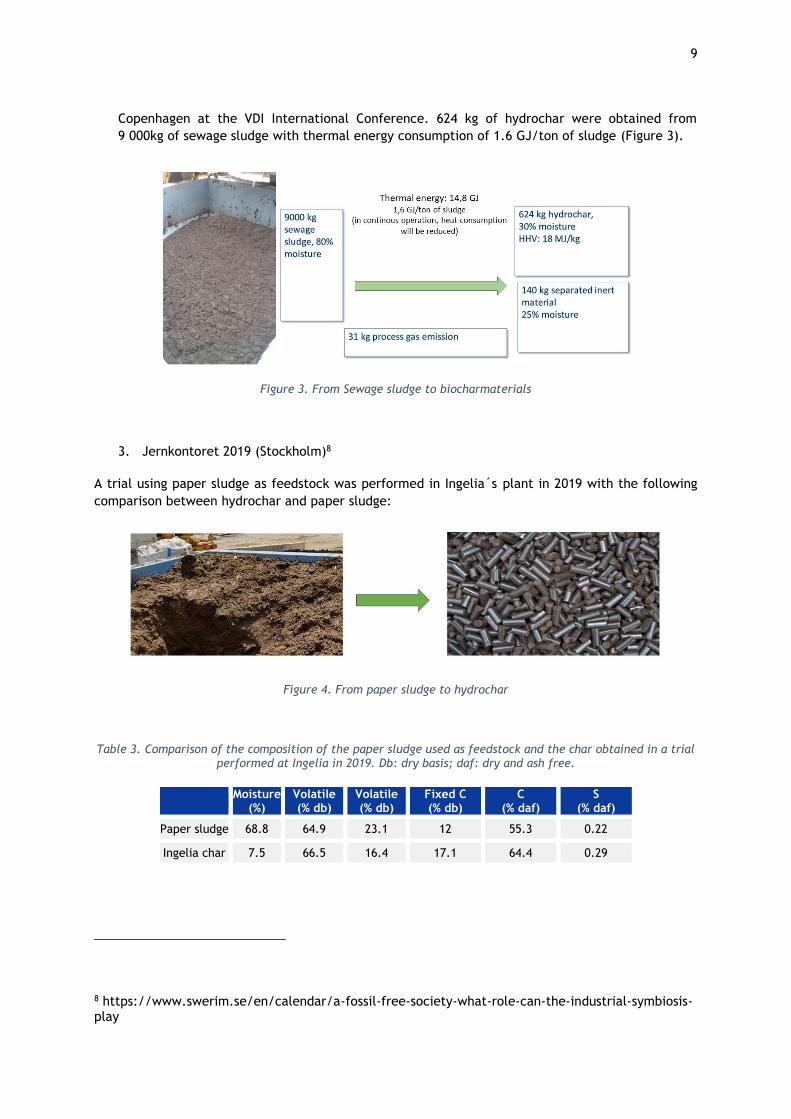
Copenhagen at the VDI International Conference. 624 kg of hydrochar were obtained from
9 000kg of sewage sludge with thermal energy consumption of 1.6 GJ/ton of sludge (Figure 3).
Figure 3. From Sewage sludge to biocharmaterials
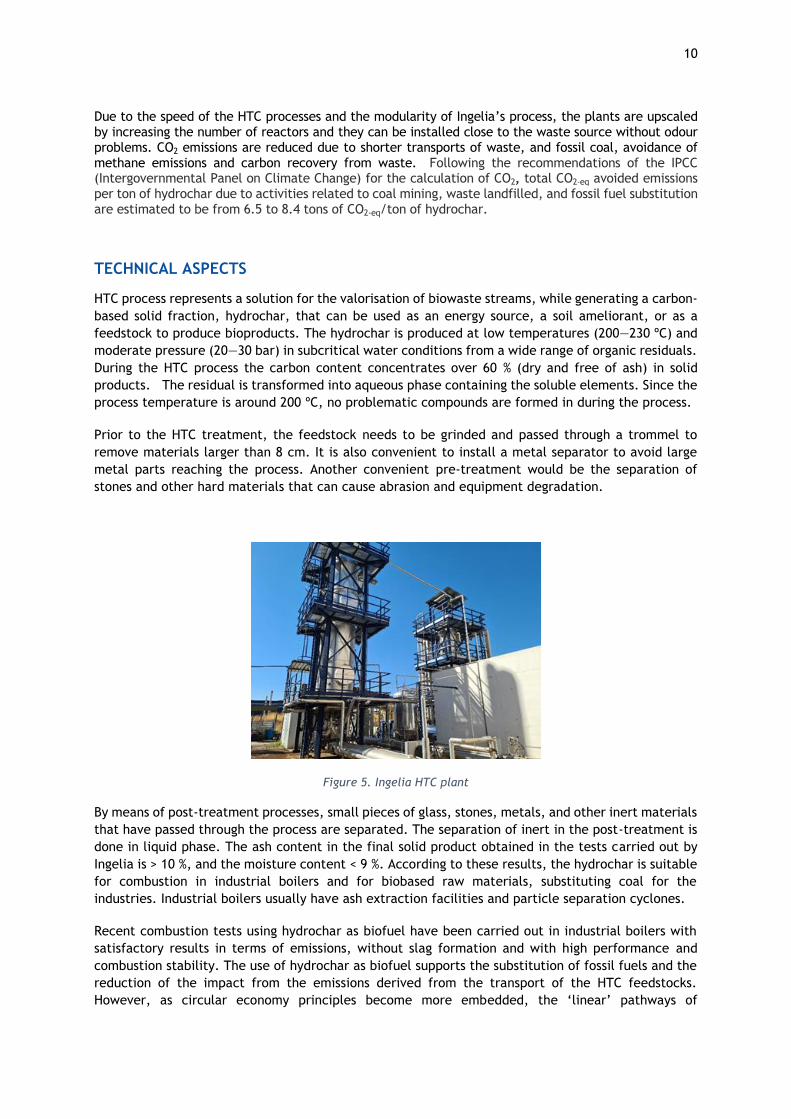
3. Jernkontoret 2019 (Stockholm)8
A trial using paper sludge as feedstock was performed in Ingelia´s plant in 2019 with the following
comparison between hydrochar and paper sludge:
Figure 4. From paper sludge to hydrochar
Table 3. Comparison of the composition of the paper sludge used as feedstock and the char obtained in a trial performed at Ingelia in 2019. Db: dry basis; daf: dry and ash free.
Moisture
(%) Volatile (% db)
Volatile (% db)
Fixed C (% db)
C (% daf)
S (% daf)
Paper sludge 68.8 64.9 23.1 12 55.3 0.22
Ingelia char 7.5 66.5 16.4 17.1 64.4 0.29
8 https://www.swerim.se/en/calendar/a-fossil-free-society-what-role-can-the-industrial-symbiosis-play
10
Due to the speed of the HTC processes and the modularity of Ingelia’s process, the plants are upscaled by increasing the number of reactors and they can be installed close to the waste source without odour problems. CO2 emissions are reduced due to shorter transports of waste, and fossil coal, avoidance of methane emissions and carbon recovery from waste. Following the recommendations of the IPCC (Intergovernmental Panel on Climate Change) for the calculation of CO2, total CO2-eq avoided emissions per ton of hydrochar due to activities related to coal mining, waste landfilled, and fossil fuel substitution are estimated to be from 6.5 to 8.4 tons of CO2-eq/ton of hydrochar.
TECHNICAL ASPECTS
HTC process represents a solution for the valorisation of biowaste streams, while generating a carbon-
based solid fraction, hydrochar, that can be used as an energy source, a soil ameliorant, or as a
feedstock to produce bioproducts. The hydrochar is produced at low temperatures (200—230 ºC) and
moderate pressure (20—30 bar) in subcritical water conditions from a wide range of organic residuals.
During the HTC process the carbon content concentrates over 60 % (dry and free of ash) in solid
products. The residual is transformed into aqueous phase containing the soluble elements. Since the
process temperature is around 200 ºC, no problematic compounds are formed in during the process.
Prior to the HTC treatment, the feedstock needs to be grinded and passed through a trommel to
remove materials larger than 8 cm. It is also convenient to install a metal separator to avoid large
metal parts reaching the process. Another convenient pre-treatment would be the separation of
stones and other hard materials that can cause abrasion and equipment degradation.
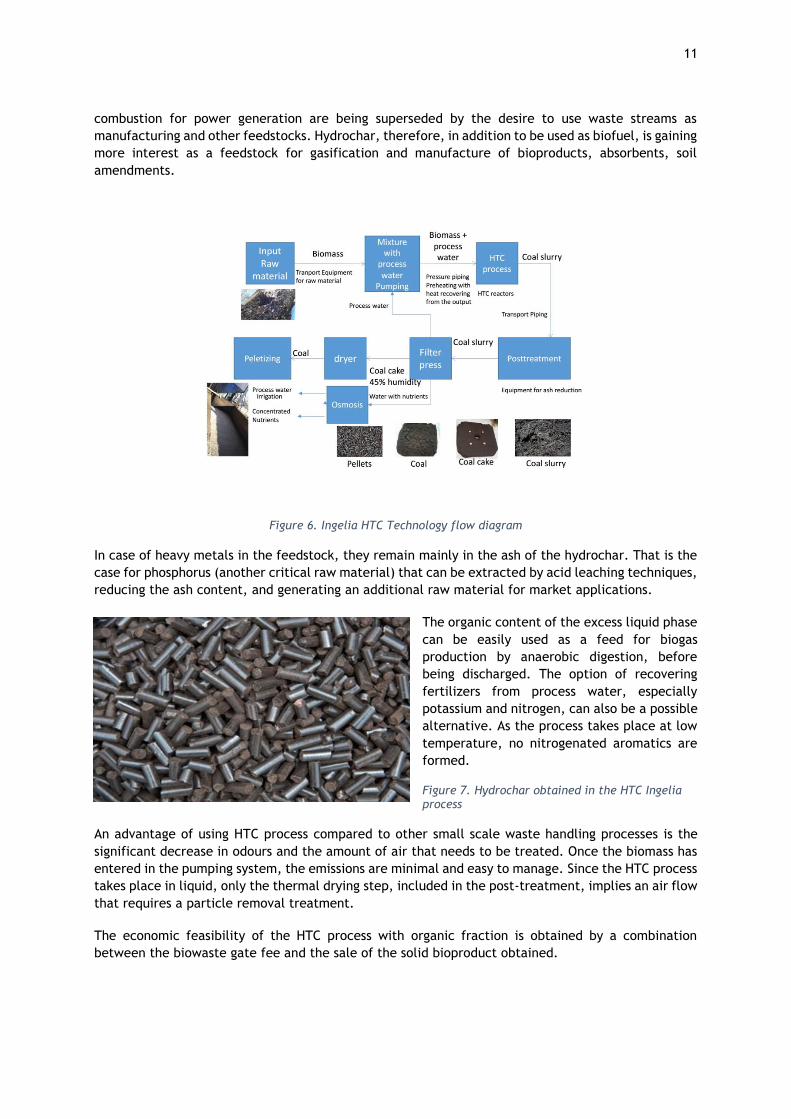
Figure 5. Ingelia HTC plant
By means of post-treatment processes, small pieces of glass, stones, metals, and other inert materials
that have passed through the process are separated. The separation of inert in the post-treatment is
done in liquid phase. The ash content in the final solid product obtained in the tests carried out by
Ingelia is > 10 %, and the moisture content < 9 %. According to these results, the hydrochar is suitable
for combustion in industrial boilers and for biobased raw materials, substituting coal for the
industries. Industrial boilers usually have ash extraction facilities and particle separation cyclones.
Recent combustion tests using hydrochar as biofuel have been carried out in industrial boilers with
satisfactory results in terms of emissions, without slag formation and with high performance and
combustion stability. The use of hydrochar as biofuel supports the substitution of fossil fuels and the
reduction of the impact from the emissions derived from the transport of the HTC feedstocks.
However, as circular economy principles become more embedded, the ‘linear’ pathways of
11
combustion for power generation are being superseded by the desire to use waste streams as
manufacturing and other feedstocks. Hydrochar, therefore, in addition to be used as biofuel, is gaining
more interest as a feedstock for gasification and manufacture of bioproducts, absorbents, soil
amendments.
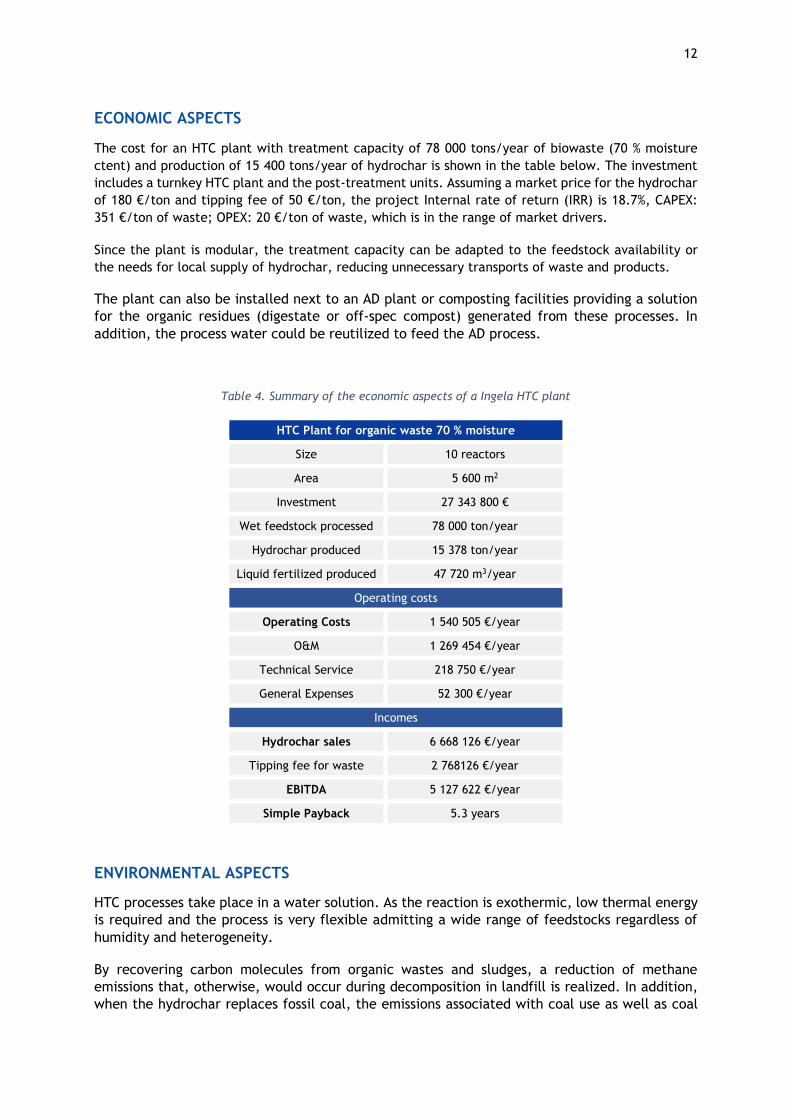
Figure 6. Ingelia HTC Technology flow diagram
In case of heavy metals in the feedstock, they remain mainly in the ash of the hydrochar. That is the
case for phosphorus (another critical raw material) that can be extracted by acid leaching techniques,
reducing the ash content, and generating an additional raw material for market applications.
The organic content of the excess liquid phase
can be easily used as a feed for biogas
production by anaerobic digestion, before
being discharged. The option of recovering
fertilizers from process water, especially
potassium and nitrogen, can also be a possible
alternative. As the process takes place at low
temperature, no nitrogenated aromatics are
formed.
Figure 7. Hydrochar obtained in the HTC Ingelia process
An advantage of using HTC process compared to other small scale waste handling processes is the
significant decrease in odours and the amount of air that needs to be treated. Once the biomass has
entered in the pumping system, the emissions are minimal and easy to manage. Since the HTC process
takes place in liquid, only the thermal drying step, included in the post-treatment, implies an air flow
that requires a particle removal treatment.
The economic feasibility of the HTC process with organic fraction is obtained by a combination
between the biowaste gate fee and the sale of the solid bioproduct obtained.
12
ECONOMIC ASPECTS
The cost for an HTC plant with treatment capacity of 78 000 tons/year of biowaste (70 % moisture
ctent) and production of 15 400 tons/year of hydrochar is shown in the table below. The investment
includes a turnkey HTC plant and the post-treatment units. Assuming a market price for the hydrochar
of 180 €/ton and tipping fee of 50 €/ton, the project Internal rate of return (IRR) is 18.7%, CAPEX:
351 €/ton of waste; OPEX: 20 €/ton of waste, which is in the range of market drivers.
Since the plant is modular, the treatment capacity can be adapted to the feedstock availability or
the needs for local supply of hydrochar, reducing unnecessary transports of waste and products.
The plant can also be installed next to an AD plant or composting facilities providing a solution
for the organic residues (digestate or off-spec compost) generated from these processes. In
addition, the process water could be reutilized to feed the AD process.
Table 4. Summary of the economic aspects of a Ingela HTC plant
HTC Plant for organic waste 70 % moisture
Size 10 reactors
Area 5 600 m2
Investment 27 343 800 €
Wet feedstock processed 78 000 ton/year
Hydrochar produced 15 378 ton/year
Liquid fertilized produced 47 720 m3/year
Operating costs
Operating Costs 1 540 505 €/year
O&M 1 269 454 €/year
Technical Service 218 750 €/year
General Expenses 52 300 €/year
Incomes
Hydrochar sales 6 668 126 €/year
Tipping fee for waste 2 768126 €/year
EBITDA 5 127 622 €/year
Simple Payback 5.3 years
ENVIRONMENTAL ASPECTS
HTC processes take place in a water solution. As the reaction is exothermic, low thermal energy
is required and the process is very flexible admitting a wide range of feedstocks regardless of
humidity and heterogeneity.
By recovering carbon molecules from organic wastes and sludges, a reduction of methane
emissions that, otherwise, would occur during decomposition in landfill is realized. In addition,
when the hydrochar replaces fossil coal, the emissions associated with coal use as well as coal
13
mining activities are avoided. Estimations on global emissions of coal mine methane (CMM) were
around 40 Mton in 2018, equal to around 1 200 Mton of CO2-eq. In 2018 the global coal production
was 5 566 Mton. Based on these figures, it can be assumed that 0.22 ton CO2-eq/ton coal were
emitted due to liberation of methane contained in coal seams (mining emissions).
Following the World Bank report on waste management, 1.6 billion tons CO2-eq greenhouse gas
emissions were generated from solid waste treatment and disposal in 20169. This is driven
primarily by disposing of waste in open dumps and landfills without and without landfill gas
collection systems. Food waste accounts for nearly 50% of emissions. Almost 2 billion tons of
waste were generated in 2016, of which 44 % was food and green waste. 800 Mtons of CO2-eq
emissions are attributable to landfilling of 887.5 Mtons of waste, which means that approximately
the disposal of one ton of waste is responsible for 0,9 tons of CO2-eq emissions. The conversion
ratio from waste to hydrochar, assuming 70 % of humidity in the waste, is 0.18 tons of
hydrochar/ton of waste, so that we can calculate that 4.9 ton of CO2-eq are avoided in non-
controlled landfills per ton of hydrochar produced.
Methane emissions from organic waste when deposited in controlled landfills as in most cases in
Europe are estimated following the method from the IPCC report10. Methane emissions depend
on several factors: the waste composition, the management method, and climatic conditions.
The CO2-eq avoided emissions due to activities related to coal mining, waste landfilled, and fossil
fuel substitution are estimated in the table below.
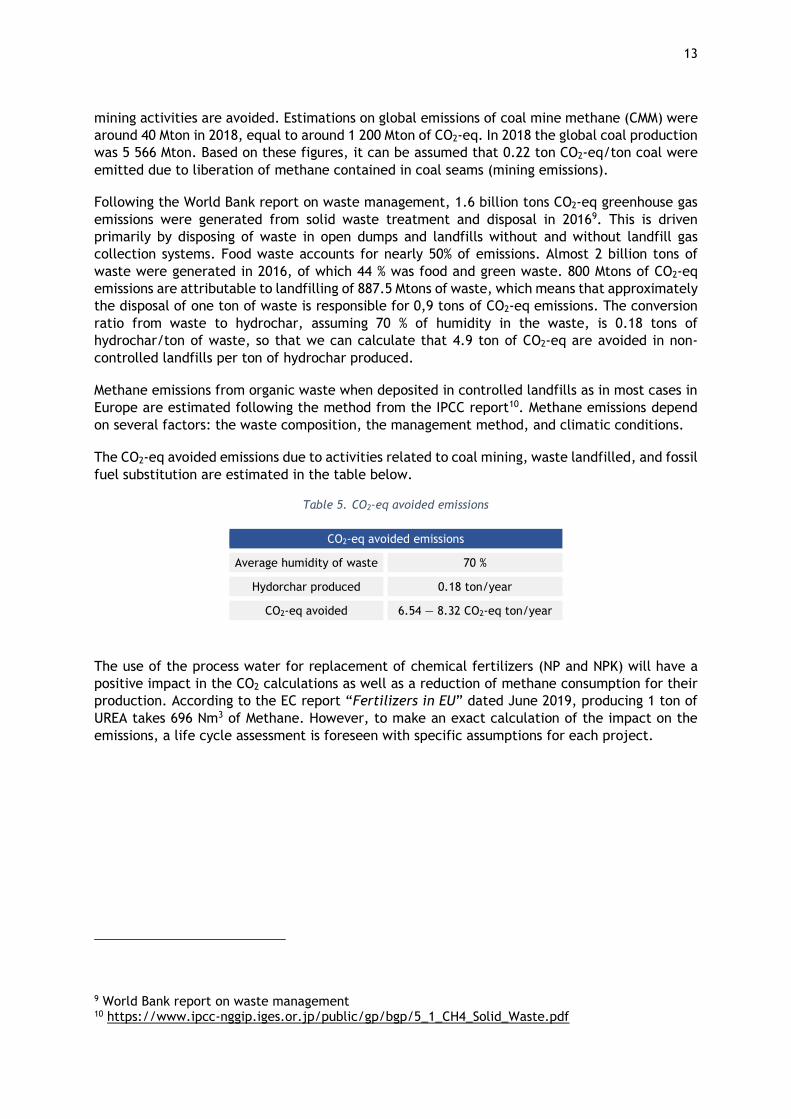
Table 5. CO2-eq avoided emissions
CO2-eq avoided emissions
Average humidity of waste 70 %
Hydorchar produced 0.18 ton/year
CO2-eq avoided 6.54 — 8.32 CO2-eq ton/year
The use of the process water for replacement of chemical fertilizers (NP and NPK) will have a
positive impact in the CO2 calculations as well as a reduction of methane consumption for their
production. According to the EC report “Fertilizers in EU” dated June 2019, producing 1 ton of
UREA takes 696 Nm3 of Methane. However, to make an exact calculation of the impact on the
emissions, a life cycle assessment is foreseen with specific assumptions for each project.
9 World Bank report on waste management 10 https://www.ipcc-nggip.iges.or.jp/public/gp/bgp/5_1_CH4_Solid_Waste.pdf
14
POLICY ASPECTS
The following EU policies support the construction of HTC Plants:
• EU Circular Economy Action Plan11
• Waste framework directive12
• Waste landfilling
• Sewage Sludge directive 86/278/EEC
• EU climate action13
Ingelia has worked hard to certify and standardize the hydrochar according to EU legislation. So far,
the hydrochar from green waste, agricultural waste and food waste has been included in the Technical
Specification of ISO 17225-814. Currently, national standardization bodies are working on it for it to
be adopted in different countries. Also the Joint Research Centre, based on the work of the Strubias
group, on Sept.2019 made a publication titled “Technical proposals for selected new fertilising
materials under the Fertilising Products Regulation (Regulation (EU) 2019/1009” where HTC process
and hydrochar have been requested to be added respectively, as permitted core process and new
component material category (CMC ZZ (pyrolysis & gasification materials)), also opening the
possibility to use sewage sludge as input (new Product Function Categories (PFCs) of EU fertilising
products).
Additionally, Ingelia has already initiated the REACH procedure with the European Chemical Agency,
to ensure a safe product for commercialization. In Italy, Ingelia obtained positive feedback from the
Environment Protection Agency, demonstrating that the HTC plant capacity to turn organic wastes
and sludges into hydrochar, usable for different scopes, such as energy or soil conditioning. Two plants
are in operation with biowaste as feedstock, one in Spain and one in the UK and a third plant is under
construction in Belgium with biowaste as feedstock.
SOCIAL ASPECTS
Besides enabling energy and carbon recovery from wastes there are further advantages derived from the HTC process:
• Water is also generated in the HTC process originating from the biowaste humidity. After the micro- and nanofiltration process a liquid fertilizer is generated that potentially could be reused for agriculture.
• Fertilizer companies will reduce their CO2 emissions by incorporating the biofertilizers produced in the plants, so that an improved ecosystem will be created around each project.
• Job creation for plants operation will be created. Around 8 people are required to operate a plant of 10 reactors.
11 https://ec.europa.eu/environment/circular-economy/pdf/new_circular_economy_action_plan.pdf 12 https://ec.europa.eu/environment/waste/framework/ 13 https://eur-lex.europa.eu/legal-content/EN/TXT/?uri=CELEX:52015PC0594 and https://ec.europa.eu/clima/policies/eu-climate-action_en
14 https://www.iso.org/standard/71915.html
15
• A beneficial impact on the local economy will be created around the plants’ location, due to supply of materials, spare parts and maintenance.
LIFE CYCLE ASSESSMENT
Description of the case study
The aim of this task was to carry out a life cycle assessment (LCA) to assess the environmental impacts
of a large-scale HTC plant for conversion of biowaste and sludge (i.e., green waste, food waste,
organic fraction of MSW, and digestate) to high quality hydrochar in Italy. The processing capacity of
this plant was assumed to process 78 000 ton of wet biowaste per year. The LCA results are intended
to identify the environmental impacts/benefits of different biowaste based hydrochar pellets at a
large-scale plant in Italy. This LCA study was carried out in accordance with ISO Standards15,16, and
has been internally reviewed. The details of the study, results and conclusions are outlined in the
following sections.
Goal and Scope
The functional unit (FU) is defined as one ton of dry biowaste treated by the HTC plant. The selection
of this FU in line with other published LCA studies on waste management17,18, and allows comparison
with other waste management processes. The potential environmental impacts are expressed
according to this unit.
The specification of the geographical boundaries is an important aspect in LCA as location can
influence factors such as biowaste composition, technology type (including waste recovery), and the
electricity gid mix. This LCA analysis is based on Italy where possible. The scope of the study is limited
to the HTC plant and assumed to be located near to the AD or composting facilities to avoid
unnecessary transport of feedstock. Moreover, providing a solution for the reutilisation of digestate
and water within the process.
Description of the system studied
The study represents a ‘gate-to-gate’ LCA and as such the system boundary includes processes from
raw material pumping to the operation of the HTC to disposal of waste stream. The aspects of the
life cycle considered are resource extraction (for all materials and energy inputs) and operation of
the HTC plant. The HTC process includes pumping of feedstock into the reactor, drying and
pelletizing, and disposal of post treated ash and treated water. It is important to note that the analysis
does not consider upstream impacts from the production of feedstock, hence the ‘zero burden
assumption’ is used which suggests that the waste carries none of the upstream burdens into the
waste treatment site. This approach is in line with other published studies which assess the
15 ISO, ISO 14040:2006 – Environmental management – life cycle assessment – principles and framework. 2006. 16 ISO, ISO 14044:2006 – Environmental management – Life cycle assessment – requirements and guidelines. 2006. 17 Cherubini, F., S. Bargigli, and S. Ulgiati, Life cycle assessment (LCA) of waste management strategies: landfilling, sorting plant and incineration. Energy, 2009. 34(12): p. 2116-2123. 18 Owsianiak, M., Ryberg, M.W., Renz, M., Hitzl, M. and Hauschild, M.Z., 2016, Environmental performance of hydrothermal carbonization of four wet biomass wase streams at industry-relevant scales. ACS Sustainable Chemistry & Engineering, 4(12), pp: 6783-6791.
16
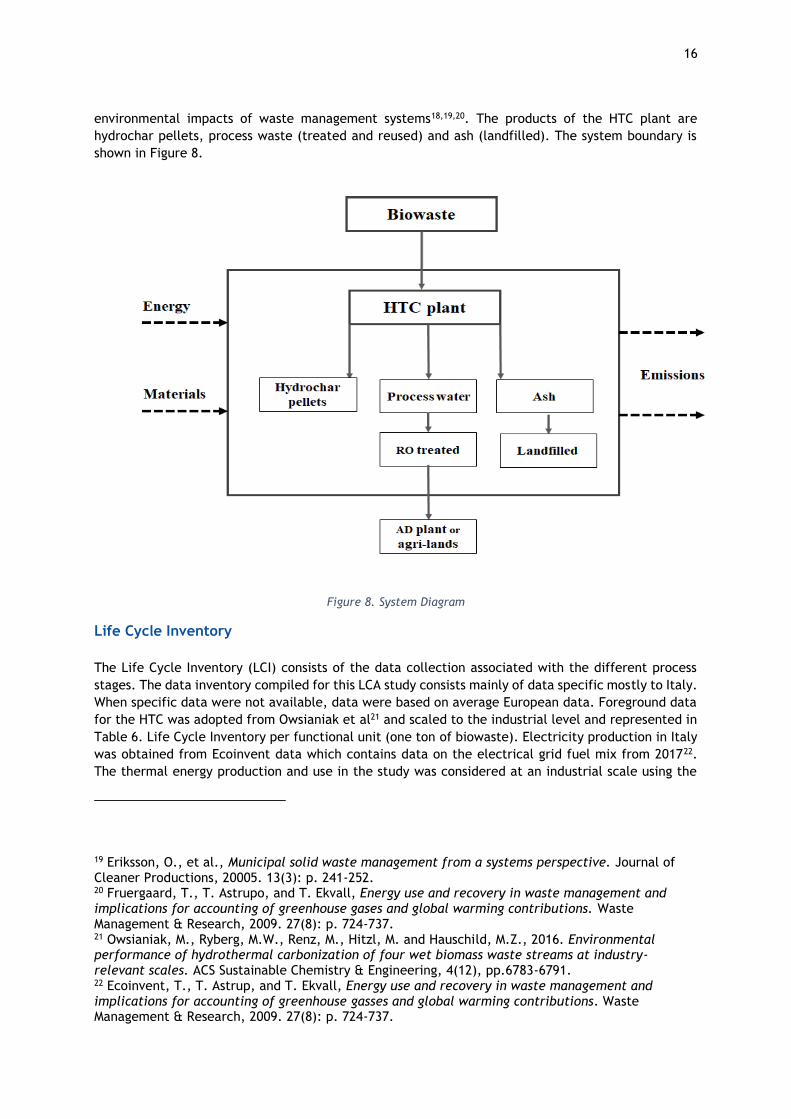
environmental impacts of waste management systems18,19,20. The products of the HTC plant are
hydrochar pellets, process waste (treated and reused) and ash (landfilled). The system boundary is
shown in Figure 8.
Figure 8. System Diagram
Life Cycle Inventory
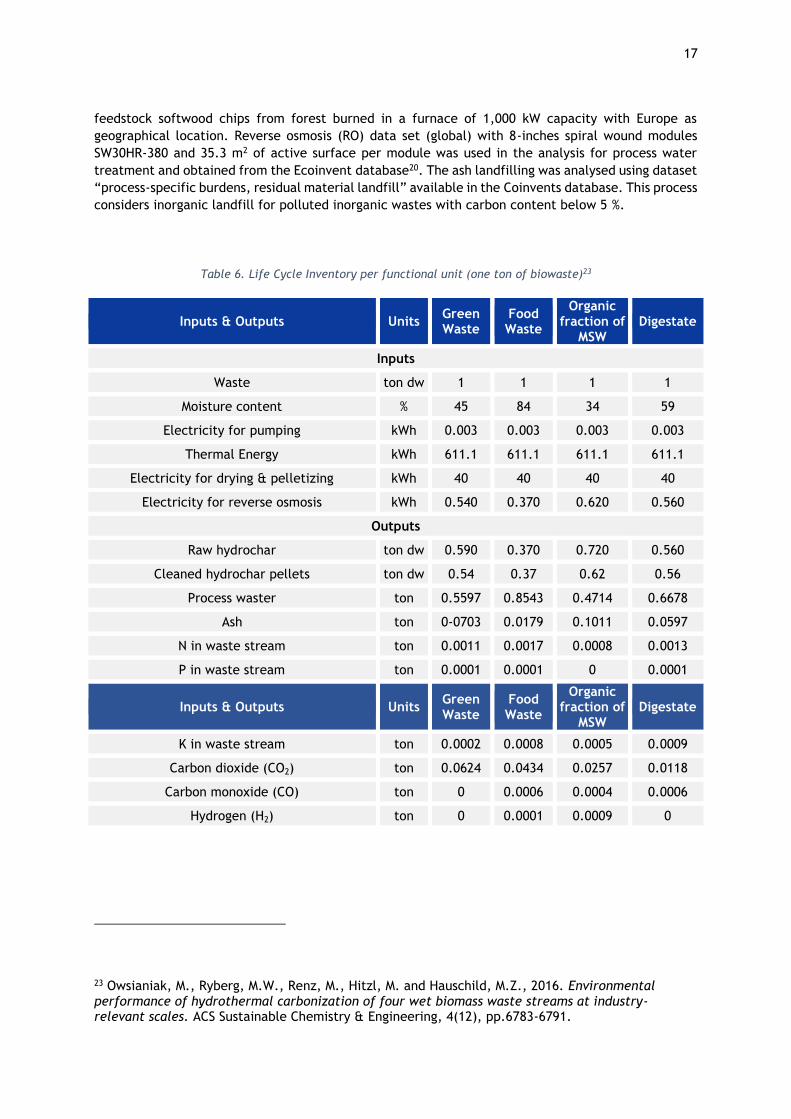
The Life Cycle Inventory (LCI) consists of the data collection associated with the different process
stages. The data inventory compiled for this LCA study consists mainly of data specific mostly to Italy.
When specific data were not available, data were based on average European data. Foreground data
for the HTC was adopted from Owsianiak et al21 and scaled to the industrial level and represented in
Table 6. Life Cycle Inventory per functional unit (one ton of biowaste). Electricity production in Italy
was obtained from Ecoinvent data which contains data on the electrical grid fuel mix from 201722.
The thermal energy production and use in the study was considered at an industrial scale using the
19 Eriksson, O., et al., Municipal solid waste management from a systems perspective. Journal of Cleaner Productions, 20005. 13(3): p. 241-252. 20 Fruergaard, T., T. Astrupo, and T. Ekvall, Energy use and recovery in waste management and implications for accounting of greenhouse gases and global warming contributions. Waste Management & Research, 2009. 27(8): p. 724-737. 21 Owsianiak, M., Ryberg, M.W., Renz, M., Hitzl, M. and Hauschild, M.Z., 2016. Environmental performance of hydrothermal carbonization of four wet biomass waste streams at industry-relevant scales. ACS Sustainable Chemistry & Engineering, 4(12), pp.6783-6791. 22 Ecoinvent, T., T. Astrup, and T. Ekvall, Energy use and recovery in waste management and implications for accounting of greenhouse gasses and global warming contributions. Waste Management & Research, 2009. 27(8): p. 724-737.
17
feedstock softwood chips from forest burned in a furnace of 1,000 kW capacity with Europe as
geographical location. Reverse osmosis (RO) data set (global) with 8-inches spiral wound modules
SW30HR-380 and 35.3 m2 of active surface per module was used in the analysis for process water
treatment and obtained from the Ecoinvent database20. The ash landfilling was analysed using dataset
“process-specific burdens, residual material landfill” available in the Coinvents database. This process
considers inorganic landfill for polluted inorganic wastes with carbon content below 5 %.
Table 6. Life Cycle Inventory per functional unit (one ton of biowaste)23
Inputs & Outputs Units Green Waste
Food Waste
Organic fraction of
MSW Digestate
Inputs
Waste ton dw 1 1 1 1
Moisture content % 45 84 34 59
Electricity for pumping kWh 0.003 0.003 0.003 0.003
Thermal Energy kWh 611.1 611.1 611.1 611.1
Electricity for drying & pelletizing kWh 40 40 40 40
Electricity for reverse osmosis kWh 0.540 0.370 0.620 0.560
Outputs
Raw hydrochar ton dw 0.590 0.370 0.720 0.560
Cleaned hydrochar pellets ton dw 0.54 0.37 0.62 0.56
Process waster ton 0.5597 0.8543 0.4714 0.6678
Ash ton 0-0703 0.0179 0.1011 0.0597
N in waste stream ton 0.0011 0.0017 0.0008 0.0013
P in waste stream ton 0.0001 0.0001 0 0.0001
Inputs & Outputs Units Green Waste
Food Waste
Organic fraction of
MSW Digestate
K in waste stream ton 0.0002 0.0008 0.0005 0.0009
Carbon dioxide (CO2) ton 0.0624 0.0434 0.0257 0.0118
Carbon monoxide (CO) ton 0 0.0006 0.0004 0.0006
Hydrogen (H2) ton 0 0.0001 0.0009 0
23 Owsianiak, M., Ryberg, M.W., Renz, M., Hitzl, M. and Hauschild, M.Z., 2016. Environmental performance of hydrothermal carbonization of four wet biomass waste streams at industry-relevant scales. ACS Sustainable Chemistry & Engineering, 4(12), pp.6783-6791.
18
Life Cycle Impact Assessment
Environmental impacts considered include terrestrial acidification (TA) expressed in kg SO2-
equivalents, freshwater eutrophication (EP) expressed in kg PO4-equivalents, and global warming
potential (GWP) expressed in kg CO2-equivalents. ReCiPe 2016 Midpoint (H) methodology24 was used
in characterising the environmental impacts.
Results
Table 7. Life cycle impacts for processing of 1 ton of biowaste to hydrocar pellets shows the results
of the impact assessment for different biowaste conversion to hydrocar at an HTC plant with 78 000
ton per annum capacity. The table shows the impacts per ton of biowaste treated, with major
contributing factors (CO2/phosphates, electricity, and thermal energy) highlighted across the study.
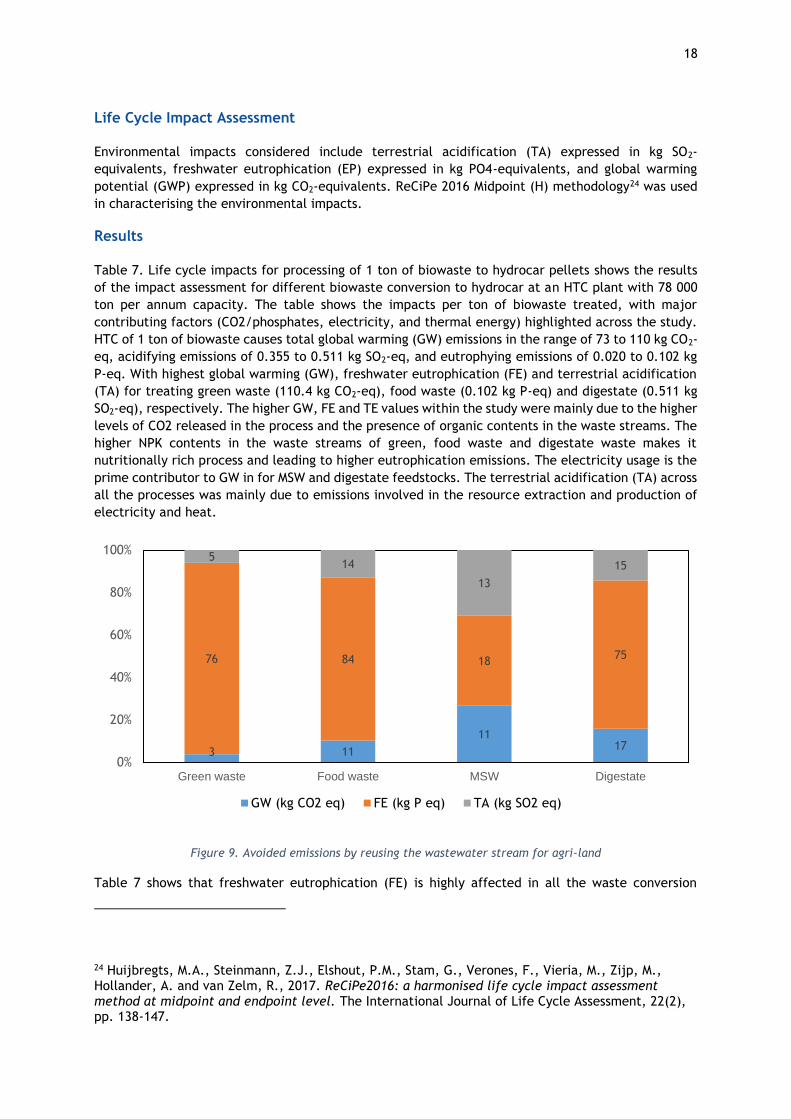
HTC of 1 ton of biowaste causes total global warming (GW) emissions in the range of 73 to 110 kg CO2-
eq, acidifying emissions of 0.355 to 0.511 kg SO2-eq, and eutrophying emissions of 0.020 to 0.102 kg
P-eq. With highest global warming (GW), freshwater eutrophication (FE) and terrestrial acidification
(TA) for treating green waste (110.4 kg CO2-eq), food waste (0.102 kg P-eq) and digestate (0.511 kg
SO2-eq), respectively. The higher GW, FE and TE values within the study were mainly due to the higher
levels of CO2 released in the process and the presence of organic contents in the waste streams. The
higher NPK contents in the waste streams of green, food waste and digestate waste makes it
nutritionally rich process and leading to higher eutrophication emissions. The electricity usage is the
prime contributor to GW in for MSW and digestate feedstocks. The terrestrial acidification (TA) across
all the processes was mainly due to emissions involved in the resource extraction and production of
electricity and heat.
Figure 9. Avoided emissions by reusing the wastewater stream for agri-land
Table 7 shows that freshwater eutrophication (FE) is highly affected in all the waste conversion
24 Huijbregts, M.A., Steinmann, Z.J., Elshout, P.M., Stam, G., Verones, F., Vieria, M., Zijp, M., Hollander, A. and van Zelm, R., 2017. ReCiPe2016: a harmonised life cycle impact assessment method at midpoint and endpoint level. The International Journal of Life Cycle Assessment, 22(2), pp. 138-147.
3 11
1117
76 84 1875
514
13
15
0%
20%
40%
60%
80%
100%
Green waste Food waste MSW Digestate
GW (kg CO2 eq) FE (kg P eq) TA (kg SO2 eq)
19
processes except MSW, where all three impacts were almost equally avoided. Reusing the process
water, and displacement of NPK-based fertilisers in the field would reduce the eutrophication
emissions in the current process significantly, ranging from a 17.62 to 76.10% reduction depending on
the feedstocks. The higher range of avoided FE emissions can be attributed to the presence of
nutritionally rich (NPK contents) in the process water stream (Table 1). Whereas GW and TA impacts
are reduced to a lesser extent, however, have a more significant impact in the HTC process with MSW
as feedstock.
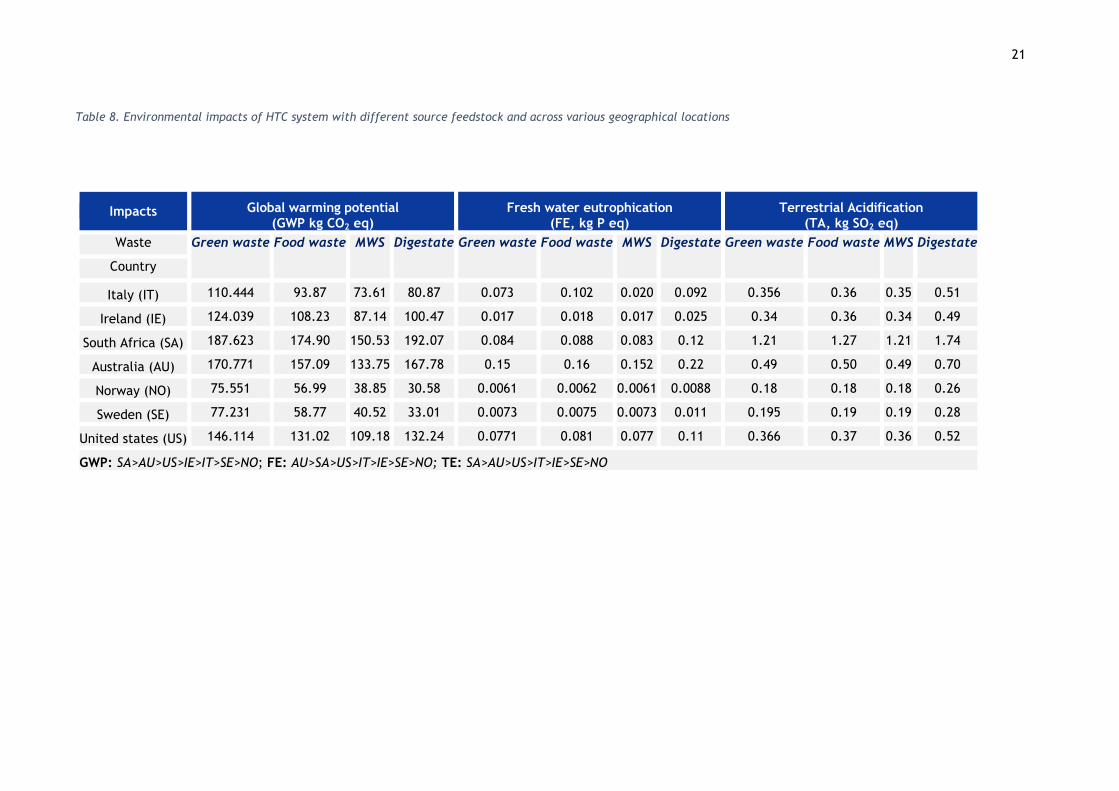
Table 8 demonstrates the comparative impacts associated with HTC technology utilising different resources across various geographical locations. The aim of this comparative analysis was to ascertain the impacts of HTC technology if it was operating in different parts of the world. It is evident in Table 7 that energy consumption esp. electricity is one of the major contributing elements that can be linked directly to the impacts of the system. Therefore, considering the average electricity grid mix from different countries would provide an estimation of emissions that would facilitate the stakeholders to strategically plan the establishment of HTC plant in future in a particular location or country by keeping environmental sustainability in mind.
The LCA analysis revealed that the GWP and TA were higher for the HTC technology when South Africa
(SA) is the place of operation, whereas FE was higher in case of Australia (AU). Higher GWP and TA can
be attributed to the source of production of electricity in SA i.e., primarily coal which accounts for 88.8%
of the total electricity produced in the country. Whereas FE was dominating in AU electricity grid mix
due to its higher phosphate emissions (68 times) involved in electricity production than SA based
electricity. However, Norway (NO) was found to be best in terms of impacts as the primary energy for
electricity production is 98% renewable leading to lower emissions in comparison to other countries fossil
dominating electricity production Moreover the hierarchy of the impacts with respective to the countries
analysed i.e., from higher to lower values is also shown in the bottom of the Table 8.
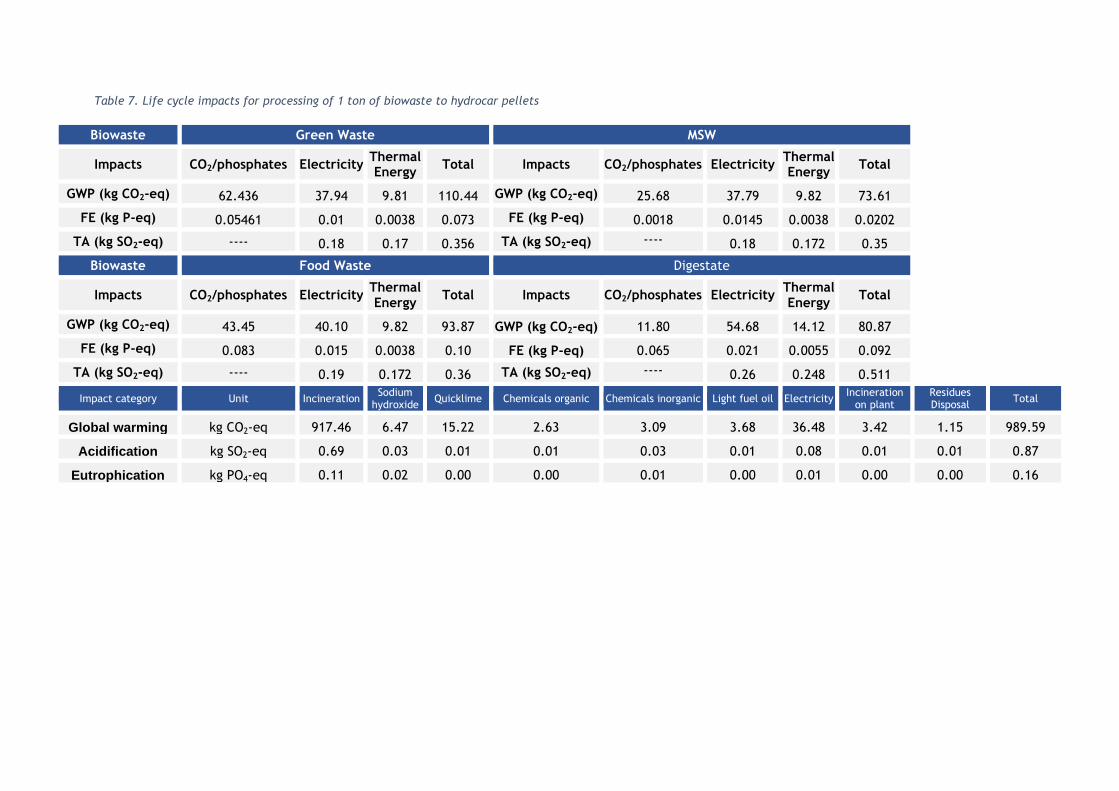
Table 7. Life cycle impacts for processing of 1 ton of biowaste to hydrocar pellets
Biowaste Green Waste MSW
Impacts CO2/phosphates Electricity Thermal Energy
Total Impacts CO2/phosphates Electricity Thermal Energy
Total
GWP (kg CO2-eq) 62.436 37.94 9.81 110.44 GWP (kg CO2-eq) 25.68 37.79 9.82 73.61
FE (kg P-eq) 0.05461 0.01 0.0038 0.073 FE (kg P-eq) 0.0018 0.0145 0.0038 0.0202
TA (kg SO2-eq) ---- 0.18 0.17 0.356 TA (kg SO2-eq) ---- 0.18 0.172 0.35
Biowaste Food Waste Digestate
Impacts CO2/phosphates Electricity Thermal Energy
Total Impacts CO2/phosphates Electricity Thermal Energy
Total
GWP (kg CO2-eq) 43.45 40.10 9.82 93.87 GWP (kg CO2-eq) 11.80 54.68 14.12 80.87
FE (kg P-eq) 0.083 0.015 0.0038 0.10 FE (kg P-eq) 0.065 0.021 0.0055 0.092
TA (kg SO2-eq) ---- 0.19 0.172 0.36 TA (kg SO2-eq) ---- 0.26 0.248 0.511
Impact category Unit Incineration Sodium
hydroxide Quicklime Chemicals organic Chemicals inorganic Light fuel oil Electricity
Incineration on plant
Residues Disposal
Total
Global warming kg CO2-eq 917.46 6.47 15.22 2.63 3.09 3.68 36.48 3.42 1.15 989.59
Acidification kg SO2-eq 0.69 0.03 0.01 0.01 0.03 0.01 0.08 0.01 0.01 0.87
Eutrophication kg PO4-eq 0.11 0.02 0.00 0.00 0.01 0.00 0.01 0.00 0.00 0.16
21
Table 8. Environmental impacts of HTC system with different source feedstock and across various geographical locations
Impacts Global warming potential (GWP kg CO2 eq)
Fresh water eutrophication (FE, kg P eq)
Terrestrial Acidification (TA, kg SO2 eq)
Waste Green waste Food waste MWS Digestate Green waste Food waste MWS Digestate Green waste Food waste MWS Digestate
Country
Italy (IT) 110.444 93.87 73.61 80.87 0.073 0.102 0.020 0.092 0.356 0.36 0.35 0.51
Ireland (IE) 124.039 108.23 87.14 100.47 0.017 0.018 0.017 0.025 0.34 0.36 0.34 0.49
South Africa (SA) 187.623 174.90 150.53 192.07 0.084 0.088 0.083 0.12 1.21 1.27 1.21 1.74
Australia (AU) 170.771 157.09 133.75 167.78 0.15 0.16 0.152 0.22 0.49 0.50 0.49 0.70
Norway (NO) 75.551 56.99 38.85 30.58 0.0061 0.0062 0.0061 0.0088 0.18 0.18 0.18 0.26
Sweden (SE) 77.231 58.77 40.52 33.01 0.0073 0.0075 0.0073 0.011 0.195 0.19 0.19 0.28
United states (US) 146.114 131.02 109.18 132.24 0.0771 0.081 0.077 0.11 0.366 0.37 0.36 0.52
GWP: SA>AU>US>IE>IT>SE>NO; FE: AU>SA>US>IT>IE>SE>NO; TE: SA>AU>US>IT>IE>SE>NO
22
LESSONS LEARNED / RECOMMENDATIONS
HTC process offers a unique way to recover materials from organic wastes and sludges which are otherwise difficult and expensive to be valorised. This novel technology has been developed at industrial scale during the last 10 years and represents a very stable and simple process which simulates an accelerated process similar to the natural formation of coal. The products generated within the HTC plants can be adapted to the industry’s requirements by applying further post-treatments enabling the industries to substitute fossil coal, reducing the CO2 emissions and encouraging circular economy.
Environmental authorisations for HTC plants should be as simple as possible in order to shorten the time to market of this new and interesting process to valorise organic waste. A coordinating group of experts could give general advice to public administrations in order to simplify the procedures.