hydration knowledge and intake in high school student athletes
TRANSCRIPT
Illinois State University Illinois State University
ISU ReD: Research and eData ISU ReD: Research and eData
Theses and Dissertations
3-6-2019
Hydration Knowledge and Intake in High School Student Athletes Hydration Knowledge and Intake in High School Student Athletes
Erin Ortiz Illinois State University, [email protected]
Follow this and additional works at: https://ir.library.illinoisstate.edu/etd
Part of the Human and Clinical Nutrition Commons
Recommended Citation Recommended Citation Ortiz, Erin, "Hydration Knowledge and Intake in High School Student Athletes" (2019). Theses and Dissertations. 1055. https://ir.library.illinoisstate.edu/etd/1055
This Thesis is brought to you for free and open access by ISU ReD: Research and eData. It has been accepted for inclusion in Theses and Dissertations by an authorized administrator of ISU ReD: Research and eData. For more information, please contact [email protected].

HYDRATION KNOWLEDGE AND INTAKE IN HIGH SCHOOL STUDENT ATHLETES
ERIN ORTIZ
53 Pages
Heat related illness is one of the leading causes of death in high school athletes. Proper
hydration strategies have been shown to decrease heat related illness in college and professional
athletes. However, limited research has been conducted on the hydration habits of high school
athletes. The increase in high school sports participation has put more athletes at risk for
dehydration. The purpose of this study is to investigate the hydration status and impact of an
educational intervention on hydration habits of high school student athletes, by assessing their
current understanding of hydration and monitoring their fluid intake, during practice. There is
limited research on hydration habits of high school athletes.
Sixteen female high school tennis players participated in this study. Data was collected
on the player’s pre/post practice body weight and pre/post water bottle weight, during an initial-
session, post-session, and follow-up session. During the initial-session, the researcher performed
a series of educational sessions on hydration for the team and coaches. The researcher assessed
hydration knowledge by giving participants replica hydration questionnaires at the beginning and
conclusion of the study. A paired-sample t-test was used to compare differences in average
weight change and percent weight change between the initial-session/post-session and initial-
session/follow-up session. A paired-sample t-test was also used to analyze the average fluid
ounces consumed and percent change in water bottle weight between initial-session/post-session

and initial-session/follow-up session. A paired-sample t-test was used to assess the differences
between the pre/post hydration questionnaire, body weight, and fluid intake.
There were no significant differences (p>0.05) between the initial-session and the post-
session in regards to changes in percent body weight change or fluid intake. However, there were
significant differences (p=0.006) in percent body weight change between the initial-session
(0.00±0.50%) and the one-month follow-up session (-1.05 ±0.80%). Drinking habits during the
follow-up session did not appear to be similar to the intervention period. Significant differences
(p>0.001) were noted between the initial-session (15.87± 6.00oz.) and follow-up session (0.00±
7.40oz.) in ounces of fluid consumed. The researcher found significant differences (p=0.00)
between the percent weight change in water bottles between the initial-session (56.87±11.40oz.)
and the follow-up session (27.25±15.17oz.). There were no significant differences between the
results of the pre/post-hydration questionnaire.
The findings from this study indicated that participants were more aware of their drinking
habits during the intervention period. Participants had similar drinking habits and saw less of a
decrease in their post training percent body weight change in the initial-session and post-session.
When researchers returned to the site to conduct their one-month follow-up session they found
that participants drinking habits did not resemble the intervention period (initial/post-session).
The teams overall fluid consumption had dropped and there were greater decreases in their post
training percent body weight change. Many factors may have influenced changes in fluid
consumption, but more research is needed on hydration status and the impact of hydration
education in high school student athletes.
KEYWORDS: Dehydration, Female Athletes, Weight Loss, Fluid Intake, Heat-Related Illness

HYDRATION KNOWLEDGE AND INTAKE IN HIGH SCHOOL STUDENT ATHLETES
ERIN ORTIZ
A Thesis Submitted in Partial
Fulfillment of the Requirements
for the Degree of
MASTER OF SCIENCE
Department of Family and Consumer Sciences
ILLINOIS STATE UNIVERSITY
2019

Copyright 2019 Erin Ortiz
HYDRATION KNOWLEDGE AND INTAKE IN HIGH SCHOOL STUDENT ATHLETES
ERIN ORTIZ
COMMITTEE MEMBERS:
Jennifer Barnes, Chair
Sally Arnett-Hartwick
Dale Brown

i
CONTENTS
Page
TABLES iii
CHAPTER I: INTRODUCTION 1
Methodology 3
Participants 3
Experimental Design 3
Initial-Session 4
Educational Sessions 5
Post-Session 5
Follow-up Session 6
Statistical Analyses 6
Results 7
Pre/Post Body Weight 7
Pre/Post Water Bottle Weights (Fluid Intake) 8
Pre/Post Questionnaire Results 8
Discussion 9
CHAPTER II: LITERATURE REVIEW 28
Effects of Dehydration on Sports Performance 28
Fluid Recommendations on Youth Athletes 31
Previous Literature on Hydration Studies in Youth Athletes 35
REFERENCES 41
APPENDIX A: HYDRATION QUESTIONNAIRE 46

ii
APPENDIX B: MATERIALS FOR EDUCATIONAL SESSIONS 50

iii
TABLES
Tables Page
1. Weather Data Collected During Study 13
2. Initial-Session Pre/Post Body Weight Averages 14
3. Post-Session Pre/Post Body Weight Averages 15
4. Follow-up Session Pre/Post Body Weight Averages 16
5. Differences In Average Weight Change and Percent Weight Change
Initial-Session vs. Post-Session 17
6. Comparisons between Average Weight Change and Percent Weight Change
Initial-Session vs. Post-Session 18
7. Average Weight Change and Percent Weight Change Initial-Session
vs. Follow-up 19
8. Comparisons between Average Weight Change and Percent Weight Change
Initial-Session vs. Follow-up Session 20
9. Initial-Session Water Intake and Water Bottle Weight Averages 21
10. Post-Session Water Intake and Water Bottle Weight Averages 22
11. Follow-up Session Water Intake and Water Bottle Weight Averages 23
12. Paired T-Test Initial-Session vs. Post-Session Average Water Intake and
Percent Average Weight Change in Water Bottles 24
13. Paired T-Test Initial-Session vs. Follow-up Session Average Water Intake and
Percent Average Weight Change in Water Bottles 25
14. Paired T-Test for Pre/Post Questionnaire Number and Percentage Correct 26
15. Comparisons between Pre/Post Test Multiple Choice Questions 27

1
CHAPTER I: INTRODUCTION
Participation in high school sports is on the rise (National Federation of State High
School Associations, 2018). This increase in sports participation puts more athletes at risk for
dehydration. Dehydration occurs when fluid losses are not properly replaced (Nuccio, Barnes,
Carter, & Baker, 2017). According to a report conducted by the Centers for Disease Control,
(CDC) heat illness was the leading cause of death among high school athletes between 2005-
2009 (Yard, Gilchrist, Haileyesus, Murphy, Collins, McIlvain, & Comstock, 2010). Signs of heat
illness begin to manifest with as little as a 1% decrease in body weight, due to dehydration. As a
result, athletes may experience decreases in cognition, performance, and reaction time
(McDermott et al., 2017; Rowland, 2011). Coaches, athletic trainers, and parents should take
measures to educate students on proper hydration techniques; to help decrease heat related
illness. The America Academy of Pediatrics recommends that children and adolescents should be
regularly educated on proper hydration habits, and fluids should be easily accessible during
practices and games (Bergeron, Devore, & Rice, 2011).
Previous studies have shown that adolescents lack knowledge on hydration and they are
failing to replenish fluid losses during and after practice. Many of the participants in these
studies began practice in a dehydrated state (Arnaoutis et al., 2013; Arnaoutis et al., 2015;
Gibson, Stuart-Hill, Pethick, & Gaul, 2012; Phillips, Sykes, & Gibson, 2014). The literature on
hydration status in adolescent and youth athletes is growing; however, most past studies have
focused their research on adult athletes. There is limited research in the United States on this
topic (Arnaoutis et al., 2013; Arnaoutis et al., 2015; Gibson, Stuart-Hill, Pethick, & Gaul, 2012;
Phillips, Sykes, & Gibson, 2014). The current research in the United States on this topic has
centered on football.

2
There are many ways to monitor hydration status. Measuring pre/post body weight is one
of the best indicators of hydration status. Other studies used sweat rates and urine specific
gravity (USG) as markers for dehydration (Arnaoutis et al., 2013; Arnaoutis et al., 2015; Gibson,
Stuart-Hill, Pethick, & Gaul, 2012; Phillips, Sykes, & Gibson, 2014). Existing research on
hydration status in youth and adult athletes has primarily been limited to a single occasion or a
three-day period. These studies did not provide education on hydration techniques or follow-up
with the participants. This current study was one of the first to include a one-month follow-up
session and an educational intervention on hydration. The researcher monitored fluid intake and
hydration status through pre/post body weight measurements and pre/post water bottle weight.
The purpose of this mixed-methods study was to educate high school athletes on fluid
intake and increase their knowledge of proper hydration techniques. Due to the lack of
information on hydration status among high school athletes, this study aims to add to the
literature and promote future studies on hydration status in high school sports.
Two research questions were investigated during this study. The first research question
was: are high school student athletes properly hydrating during and after practice? The second
research question was: would this educational intervention help influence the hydration status of
high school student athletes during practice? It was hypothesized that high school student
athletes are not properly hydrating during and after practice. It was also hypothesized that the
educational intervention would help influence the hydration status in high school student athletes
during practice.

3
Methodology
Participants
Institutional Review Board (IRB) approval was obtained prior to administration of this
study, though Illinois State University’s Office of Research Ethics and Compliance. The sample
population was chosen by contacting local athletic directors and coaches via email.
Approximately, 20 high school athletic directors and coaches in Central Illinois were contacted.
My researcher received interest from two coaches. However, at the last minute one team had to
drop out of the study due to changes in the coaching staff. Sixteen high school female tennis
players participated in this study. The participants ranged between the ages of 14-18. The
majority of the participants were high school sophomores.
Experimental Design
The researcher held an informational session with parents, coaches, and players prior to
the administration of the study. During this informational session, the researcher provided
participants, coaches, and parents with a verbal explanation of the study. Written parental
informed consent and minor assent was obtained, at the informational session. All participants
completed the pre-hydration questionnaire and initial-session; however; due to school conflicts,
not all the participants were able to complete the follow-up session. Only nine participants
completed the follow-up session.
A longitudinal mixed methods research design was implemented. Participants who
agreed to take part in this study were given a 32-ounce Nalgene water bottle as compensation.
Each water bottle was labeled with an identification code that the players used as their ID
throughout the study. Students were instructed to bring these water bottles to practice, to measure
their fluid intake. Participants completed a pre-test hydration questionnaire at the informational

4
session (see Appendix A for complete questionnaire). The researcher modified their
questionnaire based on previous studies that had been conducted on hydration (Trammell, 2007).
The pre/post hydration questionnaire contained two sections. The first section gathered
background information on the participant’s grade level and practice habits. The second part
consisted of a series of True/False questions and short answer questions. Participant’s hydration
status was observed and measured using a water bottle during the initial-session, post-session,
and follow-up session. Participants pre/post practice body weight was collected during the
initial-session, post-session, and the follow-up session.
Initial-Session
The initial-session took place during mid-August. The researcher collected and
monitored the player’s hydration status and weight during two typical, 2-hour training sessions,
which were two days apart. Players were weighed pre/post practice to measure changes in body
mass. Body weight has been shown to be one of the best indicators of hydration status (Gibson,
Stuart-Hill, Pethick, & Gaul, 2012). At the beginning of practice, players were asked to weigh in
on a Healthometer Split Mat Digital Scale. Body weight was recorded to the nearest 0.1 pound.
Participants were encouraged to void their bladders before practice, but the researcher was
unable to enter the school prior to practice and could not monitor this factor. Players left
immediately after practice and did not void their bladders at the school. Players remained clothed
with shoes and socks during weigh-ins. Pre-water bottle weight was taken at the same time as
pre-body weight. Before participants stepped onto the scale, they placed their water bottle onto a
Taylor Stainless Steel Scale. The Taylor Scale was calibrated before each session, to set the
reading at 0.0 grams. The weight of each water bottle was recorded to the nearest gram. The
researcher remained on the tennis courts to monitor water breaks and fluid intake. The researcher

5
took notes on water brakes and fluid refills. The participants did not refill their water bottles
during practice because no water foundation was located near the tennis courts. At the end of
practice, players were asked to step back on the scale and weigh their water bottle. Pre-practice
and post-practice weight were calculated using the following equation: %body mass loss= (pre-
body mass—post-body mass)/pre-body mass *100 (Gibson, Stuart-Hill, Pethick, & Gaul, 2012).
A body weight loss greater than 1% was indicative of dehydration (Arnaoutis et al., 2015). Water
bottle weight was measured using the equation: (pre-water bottle weight—post-water bottle
weight) =total fluid consumed in practice.
Educational Sessions
The educational sessions on hydration were held during the initial-session. Information
regarding the educational sessions can be found in Appendix B. The coach agreed to end practice
fifteen minutes early on both days. The sessions were held in the high school practice gym.
Participants gathered around the researcher’s computer and listened to a PowerPoint
presentation. The sessions lasted between 10-15 minutes. Three topics were covered including
signs and symptoms of dehydration, proper hydration techniques for athletes, and
monitoring/increasing fluid intake were held during the initial-session. The researcher provided
handouts for the students including a urine color chart and a chart created by the Academy of
Nutrition and Dietetics on individualized hydration intake. Participants and coaches were
encouraged to ask questions during these educational sessions.
Post-Session
One week following the initial-session, the researcher returned to the high school tennis
courts to conduct the post-session. The researcher collected and monitored the players’ hydration
status and weight during two typical, 2- hour training sessions, which were two days apart. The

6
researcher followed the same protocols for collecting body weight and water bottle weight as in
the initial-session. No educational hydration sessions were held during the post-session.
Follow-up Session
The follow-up session was executed one month following the initial-session. The purpose
of the follow-up session was to test the validity of the study and to determine if the hydration
intervention was successful. The researcher returned to the high school tennis courts to gather
information on pre/post body weight and water bottle weight. The follow-up session took place
mid-tennis season. At this time in the season, the coaches shortened the practices to 1 hour and
15 minutes to give the players more recovery time. Only half of the team participated in the
follow-up session. The high school juniors and seniors had prior engagements for school. Nine
participants completed the follow-up session. The researcher collected body weight and water
bottle weight during the first follow-up session. The researcher followed the same protocols for
gathering data as in the previous pre/post sessions. During follow-up session two, players weight
was not collected, but participants were given the post-hydration questionnaire (see Appendix A
for complete questionnaire). The post-hydration questionnaire was identical to the pre-hydration
questionnaire. The participant’s pre/post questionnaire answers were compared and tested for
reliability. The hydration questionnaires also assessed the participant’s hydration knowledge at
the beginning and end of the study.
Statistical Analyses
The data collected from this study was analyzed using SPSS and Microsoft Excel. Data
collected on pre/post body weight and pre/post water bottle weight was entered into Microsoft
Excel spreadsheets. The Excel sheets were formulated to calculate the body weight change,
%body weight change, and fluid ounces consumed. This data was entered into SPSS to look for

7
any significant changes between the pre/post and follow-up sessions. At the same time, a paired
t-test was run using SPSS to gauge the effectiveness of the hydration intervention and its impact
on fluid intake. The pre/post questionnaire contained seven questions that were graded. The
number correct and percentage correct for the pre/post questionnaire were entered into SPSS. A
paired t-test was run to compare the participant’s pre/post-test multiple choice selections.
Results
Sixteen high school female tennis players participated in this study. The athletes ranged
in age from 14-18 years old. One player completed the initial session but did not complete the
post-session or follow-up session. Two players joined the study on the first day of practice. The
researcher was only able to collect pre/post weight once during the follow-up session, due to
conflicts with the team’s schedule. During the follow-up session, body weight and fluid intake
was collected on nine participants. The high school juniors and seniors had prior commitments
for school. In addition to data collection, the researcher kept notes on the weather conditions
during practice (Table 1). Similar weather conditions were observed at each practice.
Pre/Post Body Weight
The differences in average weight change for each session are shown in Tables 2-4.
When looking at individual participant’s data, most of players lost between 0%-2% of their body
mass. Improvements were seen in the combined team average percent weight loss between the
pre-session and post-session. There were no significant differences found between the initial-
session and post-session for average weight change or percent weight change. Table 6 shows the
team’s average weight change for the initial-session (0.20±0.83lbs.) and the post-session was
(0.23±0.64lbs.). During the follow-up, there was a significant difference in the percent weight
change between the pre-session and the follow-up session. The average weight change for the

8
pre-session was (0.20±0.83 lbs.) and the follow-up (0.84±1.05lbs.) can be seen in Table 8. The
percent weight change between the pre-session (0.00±0.50%) and the follow-up session
(-1.05±0.80%) was found to be statistically significant (p=0.006).
Pre/Post Water Bottle Weights (Fluid Intake)
A wide range of fluid volumes were consumed. Tables 7-9 reveal the drinking habits of
the participants in this study. During the follow-up session, five players substituted their water
intake with a sports drink. Water bottle weights were converted from grams to ounces using the
following correction factor. Weight Change -180 (weight of empty water bottle)/28.93. Percent
weight change was calculated by dividing the post-water bottle weight by the pre-water bottle
weight. There was a statically significant difference between the average percent weight change
between initial-session and the post-session p<0.001 (Table 12). Table 13 shows that the average
ounces consumed (p<0.001) and average percent weight change (p<0.05) were statistically
significant between the initial-session and the follow-up session.
Pre/Post Questionnaire Results
The participants’ True/False answers from the pre/post hydration questionnaire were
compared after the study completed, to look for trends. The results did not present any
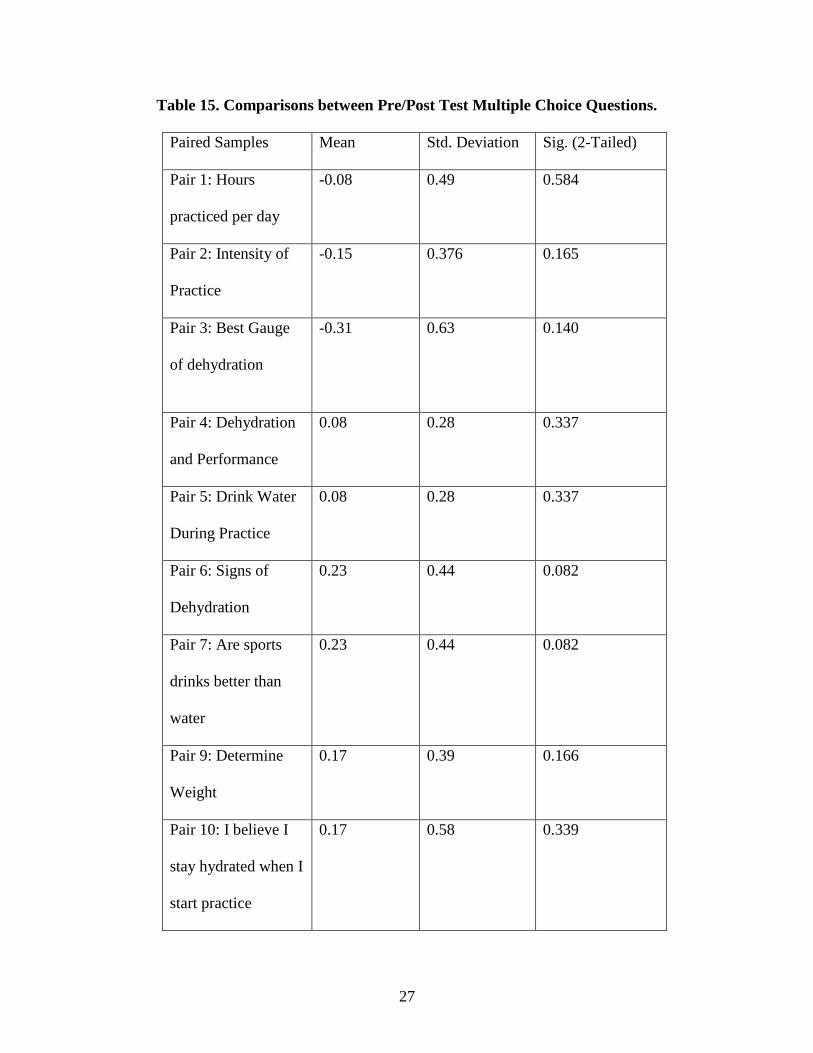
significant differences between answers in the pre/post-test (Table 14). Even though none of the
multiple-choice questions appeared to have statistical significance, pair six and seven did show a
trend with a p-value of 0.082 (Table 15). Many of the participants’ scores remained the same
between the pre-survey and post-survey. On the post-survey, the first multiple-choice question
was the number one question that was answer incorrectly. The correct answer is true, but 10
participants selected false.

9
Discussion
This present study is one of the first assessments of high school female athletes that
utilized both an educational intervention while monitoring change in fluid intake and percent
body weight. The findings of this study suggests that drinking habits of high school athletes
needs to be further investigated to establish standards for dehydration. A few athletes
experienced a percent body mass loss of greater than 2%, which has been associated with
decreases in performance and cognition (Travis, T., Erdman, K.A, & Burke, L.M, 2016). The
athletes in this study did not appear to have decreases in performance, but the researcher was
only monitoring hydration status. Other studies on adolescent athletes have found similar results,
regarding weight loss during practice. Many of the athletes in these studies began practice in a
dehydrated state and maintained this status throughout the practice (Bergeron, Waller, &
Marinik, 2006; Gibson, Stuart-Hill, Pethick, & Gaul, 2012; Phillips, Sykes, & Gibson, 2014).
One of the prominent findings from this study was the drinking behaviors of the
participants, during the initial-session and the follow-up session. There was a decrease in average
ounces consumed (p<0.0001) and the percent weight change in water bottle weight (p=0.005).
These findings suggest that players may have reverted to their pre-study drinking habits after the
conclusion of post-session. This may infer that during the initial-session and post-session
participants many have been more aware of their drinking habits and consumed more fluids than
during the follow-up session. These results are different from the findings found by Bergeron et
al. (2006), which found there were no significant differences in fluid intake between trials.
Both this current study and the study by Bergeron et al. (2006) found that the percent
weight changes between trials were significant. In both studies, participants had the greatest
differences in their percent body weight change during the follow-up session. Participants had a
10
larger decrease in percent body weight lost at the end of practice during the follow-up session
than during the initial-session and post-session. These results suggest that players may not be
properly hydrating during the tennis season and more education on hydration may be needed. It
may also be important to provide educational opportunities to teach parents and coaches about
hydration guidelines for youth athletes. Youth athletes many also benefit from personalized
hydration plans. Studies in Italy and the United States showed that personalized hydration plans
help reduced body mass losses during practice and helped improved performance during
practices and games (Francescato et al., 2019; McDermott et al., 2009).
Hydration status may have been influenced by many factors. The players arrived at
practice after a full day of school and other school related activities. Previous studies conducted
on adolescent athletes have taken place during the summer months when school was not in
session or in controlled environments. In addition, since past studies have focused on elite
athletes, these athletes practice year-round and many may not attend school regularly. The
drinking habits of elite athletes many be different than non-competitive youth athletes. Elite
athletes may have better access to resources about hydration and fluid intakes. The participants
used in this study were non-elite high school female student athletes. Hydration education had
not been provided to this team prior to this study.
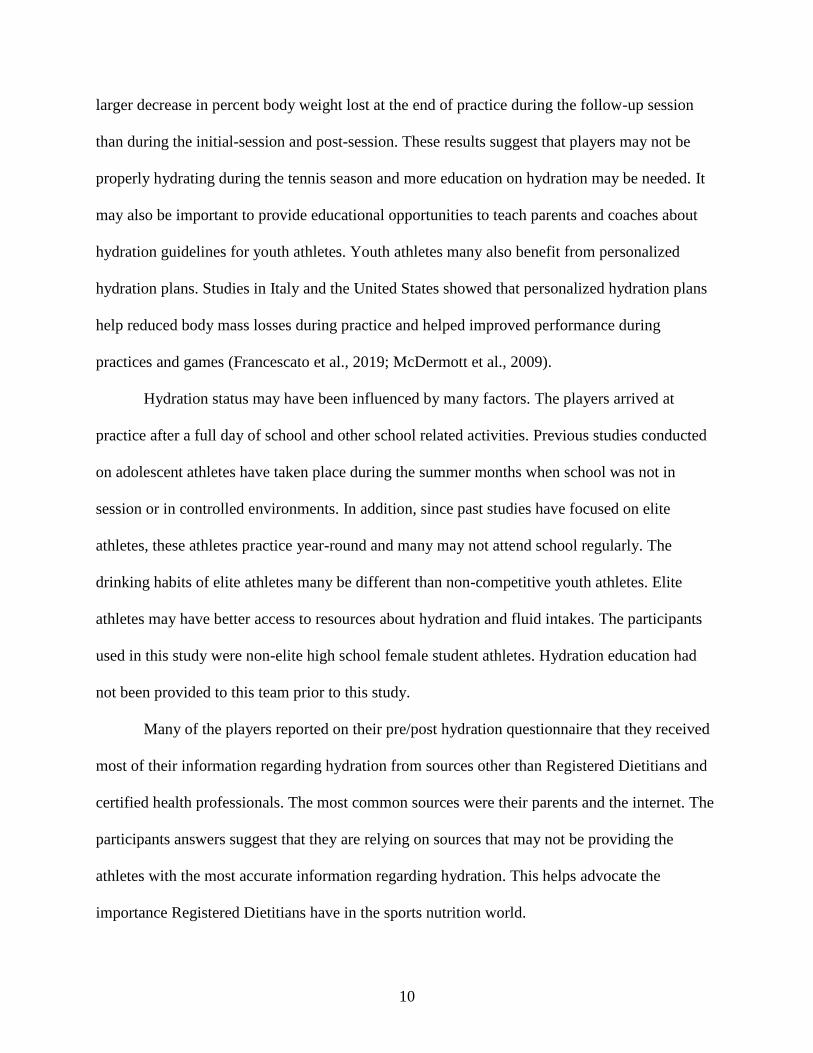
Many of the players reported on their pre/post hydration questionnaire that they received
most of their information regarding hydration from sources other than Registered Dietitians and
certified health professionals. The most common sources were their parents and the internet. The
participants answers suggest that they are relying on sources that may not be providing the
athletes with the most accurate information regarding hydration. This helps advocate the
importance Registered Dietitians have in the sports nutrition world.

11
The only significant finding between the initial-session and follow-up session one was
the percent average weight change in the water bottle weight (p=0.006). Percent weight loss was
not found to be significant between the initial-session and follow-up session, but many of the
players did have a decrease in their post practice weight loss (Tables 2-5). This data is
encouraging because players may have been more cognizant of the drinking habits right after the
educational sessions on hydration.
Even though there were no significant findings between the pre/post hydration
questionnaire; a trend was seen in pair six and seven (p=0.082). It may have been beneficial to
review the educational sessions before the participants took the post hydration questionnaire.
Many of the players rushed through the post hydration questionnaire so they could get to practice
on time. It should also be noted that two of the participants were foreign exchange students and
English was not their first language. In future studies, it may be beneficial to have the
questionnaire and educational sessions available in multiple languages.
Limitations of this study included the small sample size. Only 16 students participated
and only female athletes were used for this study. It would be better to have a larger sample size
and include both genders in future studies, so these results can be extrapolated to a larger
population. Participants were not instructed to use the bathroom prior to or after practice was
over. Players may have seen differences in weight if this had occurred. Many other studies on
elite youth athletes have used urine specific gravity as one of their markers to indicate hydration
status (Phillips et al., 2014; Gibson et al., 2013; Kavouras et al., 2012; Arnaoutis et al., 2015).
This longitudinal study took place across the span of a month. However, future studies would
benefit from longer time periods. It would be beneficial to follow high school athletes throughout
the entire season to note differences in fluid intake and pre/post weight. Parents were not

12
involved with this study. Since, many of the participants specified that they received most of
their hydration knowledge from their parents, it would be beneficial to include them in future
studies.
The findings from this study provide evidence that more research is needed on hydration
status in high school athletes. In addition, future studies should be completed over a longer
duration and include parental education. It also may be beneficial to examine the players fluid
intake during competitions; these results may better demonstrate the differences in fluid intake
and body weight. More effective guidelines need to be developed for high school athletes—
current sports nutrition guidelines only pertain to individuals over the age of 18. With the rise in
high sports participation, it is crucial that guidelines are established for high school student
athletes.

13
Table 1. Weather Data Collected During Study
Training Session Temperature
Initial-session 1 79oF with clouds
Initial-session 2 82oF with humidity, partly cloudy
Post-Session 1 82oF, windy, partly cloudy
Post-Session 2 80oF
Follow-up 1 88oF, windy, partly cloudy

14
Table 2: Initial-Session Pre/Post Body Weight Averages
ID number Averages Weight Change Average %Weight Change
HS405 0 0%
HS504 -0.1 0%
HS605 0.2 0%
HS706 0.2 0%
HS810 0.6 1%
HS900 -0.5 0%
HS423 2.2 2%
HS533 -0.8 0%
HS760 0.8 1%
HS870 -1.3 -1%
HS960 0.1 0%
HS473 0.4 0%
HS584 -0.4 0%
HS613 1 1%
HS655 0.6 0%
Team Average 0.3 1.0%

15
Table 3: Post-Session Pre/Post Body Weight Averages
ID number
Average Weight
Change Average %Weight Change
HS405 0 0.0%
HS504 -0.3 -0.2%
HS605 0.6 0.6%
HS706 1.1 1.0%
HS810 0.7 0.6%
HS900 -0.8 -0.7%
HS423 1.5 1.1%
HS533 0.4 0.2%
HS760 0.6 0.4%
HS870 -0.4 -0.3%
HS960 -0.4 -0.3%
HS473 -0.3 -0.2%
HS584 0 0.0%
HS655 0.5 0.5%
HS613 0 0.0%
Team
Average 0 0.0%

16
Table 4: Follow-up Session Pre/Post Body Weight Averages
ID number
Average Weight
Change Average % Wt. Change
HS504 1.6 -1.2%
HS605 0 0.0%
HS706 0.8 -0.7%
HS810 0.2 -0.2%
HS533 2 -1.1%
HS655 1.4 -1.0%
HS870 1 -0.8%
HS960 3 -2.5%
HS584 2.6 -2.0%

17
Table 5. Differences in Average Weight Change and Percent Weight Change
Initial-Session vs. Post-Session
Paired Samples Test
Paired Samples Mean Std.
Deviation
Sig (2-Tailed)
Pair 1: Average
Weight Change
-0.03 0.64 0.844
Pair 2: Percent
Weight Change
0.08 0.60 0.584

18
Table 6. Comparisons between Average Weight Change and Percent Weight Change
Initial-Session vs. Post-Session
Paired Samples Mean Number Std. Deviation
Pair 1 Avgwtchange .200 15 .8281
Avgwtchange1 .233 15 .6433
Pair 2 Perwtchange .267 15 .7037
Perwtchange1 .180 15 .5102

19
Table 7. Average Weight Change and Percent Weight Change Initial-Session vs. Follow-up
Paired Samples Test
*p-value set at 0.05
Paired Samples Mean Std.
Deviation
Sig (2-Tailed)
Pair 1: Average
Weight Change
-0.64 1.60 0.141
Pair 2: Percent
Weight Change
1.05 0.86 *0.006

20
Table 8. Comparisons between Average Weight Change and Percent Weight Change
Initial-Session vs. Follow-up Session
Paired Samples Statistics
Paired Samples Mean Number Std. Deviation
Pair 1 AverageWtCh .200 15 .8281
AverageWtCh1 .840 15 1.0480
Pair 2 Peravgwtchange .000 9 .5000
Peravgwtch1 -1.052 9 .7989

21
Table 9. Initial-Session Water Intake and Water Bottle Weight Averages
Water Bottle ID
Average Water Intake
(ounces)
Average Percent Weight
Change
HS405 17 60
HS504 21 66
HS605 15 51
HS706 13 50
HS810 15 51
HS900 3 24
HS423 23 77
HS533 17 57
HS760 19 63
HS870 14 52
HS960 27 81
HS473 18 67
HS584 13 47
HS777 8 37

22
Table 10. Post-Session Water Intake and Water Bottle Weight Averages
Water Bottle
ID
Average Water Intake
(ounces)
Average Percent Weight
Change
HS405 14 20
HS504 15 32
HS605 15 33
HS706 20 52
HS810 19 39
HS900 8 16
HS423 15 42
HS533 5 28
HS655 19 43
HS760 11 31
HS870 7 17
HS960 17 33
HS473 7 11
HS584 15 44
HS613 7 41

23
Table 11. Follow-up Session Water Intake and Water Bottle Weight Averages
Water Bottle
ID
Average Water Intake
(ounces)
Average Percent Weight
Change
HS504 0 15
HS605 6 29
HS706 -1 13
HS810 16 54
HS533 14 46
HS870 0 15
HS960 3 22
HS584 4 24

24
Table 12. Paired T-Test Initial-Session vs. Post-Session Average Water Intake and Percent
Average Weight Change in Water Bottles
*p-value set at 0.05
Paired Samples Mean Std. Deviation Sig. (2-Tailed)
Pair 1: Average
Ounces Water
Consumed
2.93 7.66 0.160
Pair 2: Average
Percent Change
in Water Bottle
Weight
26.77 17.65 0.000

25
Table 13. Paired T-Test Initial-Session vs. Follow-up Session Average Water Intake and
Percent Average Weight Change in Water Bottles
Paired Samples Mean Std. Deviation Sig. (2-Tailed)
Pair 1: Average
Ounces Water
Consumed
15.87 8.98 0.000
Pair 2: Average
Percent Change
in Water Bottle
Weight
29.63 20.50 0.005
*p-value set at 0.05

26
Table 14. Paired T-Test for Pre/Post Questionnaire Number and
Percentage Correct
*p-value set at 0.05
Paired Samples Mean Std. Deviation Sig. (2-Tailed)
Pair 1: Number
Correct
0.23 0.83 0.337
Pair 2: Percent
Correct
7.07 17.56 0.172
27
Table 15. Comparisons between Pre/Post Test Multiple Choice Questions.
Paired Samples Mean Std. Deviation Sig. (2-Tailed)
Pair 1: Hours
practiced per day
-0.08 0.49 0.584
Pair 2: Intensity of
Practice
-0.15 0.376 0.165
Pair 3: Best Gauge
of dehydration
-0.31 0.63 0.140
Pair 4: Dehydration
and Performance
0.08 0.28 0.337
Pair 5: Drink Water
During Practice
0.08 0.28 0.337
Pair 6: Signs of
Dehydration
0.23 0.44 0.082
Pair 7: Are sports
drinks better than
water
0.23 0.44 0.082
Pair 9: Determine
Weight
0.17 0.39 0.166
Pair 10: I believe I
stay hydrated when I
start practice
0.17 0.58 0.339

28
CHAPTER II: LITERATURE REVIEW
Effects of Dehydration on Sports Performance
In 2010, a report conducted by the Centers for Disease Control found the leading cause of
death and disabilities in high school student athletes was heat related illness (Yard et al., 2010).
These findings along with heat acclimation guidelines from the National Athletics Trainer’s
Association (NATA) have helped promote the importance of educating high school athletes
about hydration status and dehydration. NATA recommends that high school coaches implement
a 14-day heat acclimation period for summer/fall sports. During the first five days, teams should
be limited to one practice that last no longer than 3 hours. Sports that required protective
equipment can only permit the use of helmets for the first 1-3 days of practice and full equipment
should not be worn until day six. When two practices are held in one day, a three-hour break
period must be given between practices (Casa et al., 2009).
These guidelines can help reduce heat related illness. The increase is sports over the past
ten years emphasizes the importance of carrying out NATA’s guidelines, to prevent heat related
illnesses in youth athletes. In 2018, The National Federation of State High School Associations
(NHFS) reported, nearly eight million high school students participated in sports programs
(NHFS, 2018). This increase in sports participation puts more students at risk for dehydration
because student athletes may lack knowledge on hydration and the signs and symptoms of
dehydration.
Previous research on youth and adult athletes has indicated that athletes are not properly
hydrating throughout the day. However, many of these studies have not attempted to educate
athletes on proper hydration techniques. Maintaining a hydrated status is vital to sports
performance. The human body is 70-80% water. Water plays an important role in the body. It

29
regulates body temperature, keeps tissue moist, lubricates joints, and hydrates muscles. Every
system in our body is dependent on water (Meyer, Volterman, Timmons, & Wilk, 2012). In fact,
we will die after a few days if we do not have water. It is important for athletes to replenish fluid
losses, not only during games and practices, but consistently though out the day.
During exercise, the core temperature of the body rises. Exercising in hot and humid
temperatures can cause a 2-3oC rise in core body temperature. This rise in body temperature can
lead to heat exhaustion if the proper measures are not taken (Maughan & Shirreffs, 2010). The
body naturally compensates for a temperature increase during exercise by sweating. When
athletes fail to replenish sweat losses, dehydration can occur. When the body is dehydrated, our
plasma and blood volumes drop (hypovolemia), which places strain on our cardiovascular
system, central nervous system, and leads to a rise in our body temperature (Travis, T., Erdman,
K.A., & Burke, L.M., 2016). Proper hydration strategies can help offset dehydration and restore
our bodies to a healthy state. Athletes can learn to recognize when they are becoming dehydrated
through education and learning how their bodies react in humid environments. Coaches and
athletic trainers can assist by making fluids readily available to athletes during practices
(Bergeron, Devore, & Rice, 2011).
Youth and adolescents are more susceptible to dehydration. They have underdeveloped
thermoregulation systems causing decreased sweat rates and increased core temperatures during
exercise. Young athletes have a greater surface area for their body weight and do not fare well in
high heat. The most significant factor that increases their risk of dehydration is failing to
recognize when they feel thirsty (Sawka, Cheuvront, & Carter, 2005). Youth athletes are most at
risk for dehydration and heat related illnesses during the summer months. The American
Academy of Pediatrics (2011) defined heat exhaustion as a moderate heat illness in which an

30
individual is unable to maintain blood pressure and adequate cardiac output. This can result from
strenuous exercise or physical activity when temperatures are above 400C (104oF). On the other
hand, exertional heat stoke can occur when the core body temperature climbs above 400C
(Bergeron, Devore, & Rice, 2011).
A special report from the Centers for Disease Control (2010) reviewed heat related illness
in high school athletes around the country. They found that during the month of August, athletes
were most likely to experience heat related illnesses. They warned that high school football
players are ten times more likely to suffer from a heat related illness compared to other high
school athletes (Yard et al., 2010). They added that obesity and increased body weight in football
players escalated their risk of heat illness. Excess body fat decreases heat loss and increases core
body temperature in athletes. This factor can cause issues for any athlete that is overweight or
obese. Moyen et al. (2016) found that obese females had lower chest-sweat sensitivity compared
to non-obese females during passive heat stress. If athletes are properly hydrating during
practices and games, they are at an increased risk of developing heat illness. Heat illness can be
reduced if student athletes are given time to acclimate to the heat and are educated on hydration
(McDermott et al., 2017).
NATA recommends that athletes should be given seven to fourteen days to acclimate to
the heat. This process involves gradually increasing the intensity and duration of the physical
activity. These guidelines are especially important during the first few weeks of the season
(McDermott et al., 2017). Dehydration is not limited to hot weather. During the winter, water is
lost through heat exchange by the lungs. In the winter, our thirst mechanisms are diminished.
Athletes who participate in summer and winter sports should follow the same fluid
recommendations throughout the year (Sawka, Cheuvront, & Carter, 2005).

31
Armstrong et al. (1998) suggested that preventing dehydration beings with educating
student athletes. One simple way to educate young athletes on hydration status is with a urine
test. Athletes will learn to recognize hydration status through their urine color. The researchers of
this article provided ways their results could be used in practical applications. They suggested
that if athletes achieve a clear to pale yellow urine color after practice they will reduce the effects
of dehydration (Armstrong et al., 1998).
Fluid Recommendations on Youth Athletes
Research has shown that a body water loss of 1-2 % causes an increase in body
temperature. This equates to 1.5 to 3 pounds for athletes weighing 150 pounds. If body water
losses exceed 3%, athletes may experience decreases in performance, cramps, and medical
complications: heat stroke, heat exhaustion, or death (Meyer, Volterman, Timmons, & Wilk,
2012). A review on college and professional athletes found that signification dehydration (>2%
body mass loss) was linked to decreases in performance, cognition, coordination, and reaction
time (Nuccio, Barnes, Carter, & Baker, 2017). Nuccio et al. (2017) discovered that soccer
players reported the more significant dehydration rates (>2% body mass loss) compared to
professional adult rugby, America football, basketball, and tennis players.
A study on trained cyclists contradicted the current guidelines regarding hydration. The
participants participated in three phases: dehydration, rehydration, and time trial. Each phase was
separated by six days to avoid acclimation to the environment. In the dehydration phase
participants achieved a percent body mass loss of 3% before entering the rehydration phase.
During the rehydration phase, participants received an infusion of saline containing sodium,
potassium, magnesium, and chloride at 100% of their change in body mass (euhydration), 33%
of their change in body mass (2% hypohydration) or no saline (3% hypohydration). After they

32
completed the rehydration phase, study participants completed a 25km cycling time trial. The
researcher compared the time trail completion times between the three groups. Hydration was
achieved during the time trial by using the same amount of saline from the rehydration period.
No differences were noted between the three groups. The 2% hypohydration and 3%
hypohydration groups finished the time trail 0.02-0.03 seconds faster than the euhydration group.
The results from this study showed that hydration status did not have an effect on aerobic
performance (Wall et al., 2015).
However, the results from Walls study may not translate to endurance athletes who are
shown to be at an increased risk for dehydration, due to higher sweat losses during exercise
(Maughan & Shirreffs, 2010). Many youth and adolescent athletes participate in endurance
sports and may be unaware of ways to monitor %body mass loss. Many studies have utilized
pre/post body weight by using the following equation: % body mass loss= (pre-body mass—post
body mass)/pre-body mass* 100) (Gibson, Stuart-Hill, Pethick, & Gaul, 2012). The National
Federation of State High School Associations and Sports Medicine Advisory Committee (2014)
endorsed that all student athletes should be weighed before and after warm or hot weather
practices. They recommend that students should be weighed in shorts and a t-shirt. Coaches and
athletic trainers can use this information to monitor their team’s dehydration status throughout
practice and the season (NFHS, 2014). The objective of pre/post body weight is to educate
athletes about the best ways to try and maintain their body weight during practice.
Calculating fluid intake for student athletes is based on many factors including: age, body size,
diet, sweat volume, and health conditions (American Academy of Pediatrics, 2011). The
Academy of Nutrition and Dietetics has not published a position paper on hydration guidelines
for youth and adolescents, but they have provided recommendations for hydration intake on
33
event days. Athletes should drink 12-22 ounces of cool water approximately 1-2 hours prior to
the event. A few minutes before the event starts they should drink about 10-20 ounces of cool
water. During the event, they should try to consume 4-6 ounces every 15 minutes. After the
event, they should rink 16-24 ounces for every pound they have lost (Academy of Nutrition and
Dietetics Nutrition Care Manual, 2018).
Other recommendations for fluid intake in adolescent athletes include the Dietary
Reference Intakes (DRIs) for water in 14-18 years old: 10 cups for females and 14 cups for
males. Active adolescents may need more depending on their activity level. The American
Academy of Pediatrics (AAP) recommends that adolescents between the ages of 14-18 years old,
consume 9-13 ounces of water every 15 minutes during practice. This equates to 36-52 ounces
(4.5 -6.5 glasses of water) per hour. Water intake should not be limited to practices and games.
Athletes should be encouraged to consume and additional 6-8 cups of water every day (AAP,
2011).
However, other research suggests that fluid guidelines for adolescents during exercise
should be 13 mL/kg (6 mL/lb.) for every hour of exercise. For a 150 lb. (69.2 kg) athlete, this
equates to approximately 890 mL/hr. or 30 oz/hr. (Rowland, 2011). Maintaining a hydrated state
should not stop after practice. Rowland (2011) suggested that student athletes should be
replenishing fluid losses post workout at a rate of 4 mL/kg (2 mL/lb.) per hour. If athletes fail to
restore lost fluids post workout, the next day they may start practice in a dehydrated state.
Athletes who begin practice in a dehydrated state are at great risk for developing heat related
illness (Poole, Stearns, & Lopez, 2017). Coaches, athletic trainers, and parents should encourage
regular fluid intake throughout the day to help prevent heat related illness.

34
Even though student athletes may reach for thirst quenching sport and energy drinks, the
American Academy of Pediatrics recommends that water should be the number one choice for
replenishing fluids for adolescents (AAP, 2011). Water is the best choice for adolescent and
youth athletes that exercise less than 90 minutes. If young athletes are not keen on drinking plain
water, they can boost the flavor of plain water by adding fruit or a low-sugar liquid water
enhancer. Sports drinks can be useful during periods of excessive heat and intense exercise.
Sport drinks are enhanced with electrolytes sodium and potassium, as well as carbohydrates to
help refuel muscle glycogen levels and help postpone fatigue. However, they should complement
a student athlete’s water intake. Adolescent tennis players observed in a crossover design study
comparing water intake and carbohydrate/electrolyte drinks (CHO-E) were followed during a
three-week training session. The CHO-E drinks were found to lower core temperature better than
water (Bergeron et al., 2006). Moreover, it should be noted that mean fluid intake of CHO-E
drinks was greater than water, but participants also noted great gastrointestinal discomfort during
the CHO-E trial period. This study once again emphasizes the importance on determining
individualized hydration strategies.
Student athletes should avoid drinking sports drinks that contain over 6-8 grams of
carbohydrates per serving. Excessive intake of carbohydrates during exercise can lead to
gastrointestinal discomfort (AAP, 2011). Youth and adolescents should avoid drinking beverages
that contain caffeine, high amounts of sugar, and carbonation. These drinks can cause side
effects that include bloating, nausea, and restlessness at night (Bergeron, Waller, & Marinik,
2006).
In addition to dehydration, student athletes should be educated on hyponatremia, or low
sodium levels. Exercise associated with hyponatremia occurs when serum sodium levels drop

35
below 135 mmol/L. Endurance athletes, who exercise longer than 4 hours, are more susceptible
to hyponatremia. Menstruating female athletes tend to be at a greater risk for developing
hyponatremia because they have lower sweating rates, which can alters the body’s response to
rapid swelling (Hew-Butler et al, 2017). Data collected on runners in the 2002 Boston and 2006
London marathons found that 13% of the runners displayed asymptomatic hyponatremia. Many
of the symptoms of hyponatremia resemble dehydration. These symptoms include muscle
weakness, dizziness, coma, seizures, and death. Athletes should be aware of how much fluid they
are consuming during practice to avoid both dehydration and hyponatremia (McDermott et al.,
2017).
Previous Literature on Hydration Studies in Youth Athletes
Past studies on hydration status have indicated that adolescents are not the only ones
inadequately hydrated. A review conducted by Nuccio et al. (2017) found that professional
soccer players are failing to meet fluid recommendations. On average, soccer players lose more
than 2% of their body weight during a 90-minute training period. However, soccer skills and
cognition did not appear to be impaired when body weight losses where under 2.5%. Other
sports including American football, rugby, basketball, and tennis reported mild dehydration.
Dehydration did not appear to inhibit performance until body mass losses were greater than 3%
(Nuccio, Barnes, Carter, & Baker, 2017).
Previous literature on hydration intake in adolescent athletes have focused on collecting
data on junior athletes during practice. Many of the studies utilized pre/post body weight and
urine specific gravity (USG) to gather information on hydration status. International studies have
indicated that many athletes begin practice in a dehydrated state and maintain this status

36
throughout practice and post-exercise (Arnaoutis et al., 2013; Arnaoutis et al., 2015; Gibson,
Stuart-Hill, Pethick, & Gaul, 2012; Phillips, Sykes, & Gibson, 2014).
Gibson et al. (2012) found that 45% of the participants entered practice in a dehydrated
state. The researchers observed 34 soccer players during practice. They recruited soccer players
from three age groups and attended seven soccer practices. Their findings showed that one water
break was allowed six of the seven practices and during one practice no water break was
provided. Players’ fluid intake was low, and they were unable to replace mean losses during
practice. They found variability between sweat loses and fluid intake among the participants.
This study suggested that hydration guidelines should be tailored to meet the individual needs of
the athletes (Gibson, Stuart-Hill, Pethick, & Gaul, 2012).
Phillips et al. (2014) and Arnaoutis et al. (2013) also found that soccer players were
entering practice in a dehydrated state. A study on youth soccer players at summer camp found
that 90% of the participants entered practice in a dehydrated state. Soccer players maintained this
state throughout the camp. At the end of the first week, dehydration was observed in 97.2% of
players. Even with fluids available, participants lost an average of -0.61 pounds. The researchers
suggested that body weight loss many have occurred through involuntary dehydration (Arnaoutis
et al., 2013). Involuntary dehydration occurs when the body is repeatedly exposed to stressors
including exercise, hot environments, and dehydration. These stressors can delay the body’s
ability to replace fluid losses because the body’s stimulus for thirst appears to be diminished
(Greenleaf, 1992). Involuntary dehydration has been observed in other studies. Youth athletes
were provided with available fluids and water breaks, but they were still not meeting fluid
requirements (Arnaoutis et al. 2013). Coaches and athletic trainers should be diligent in
reminding athletes to drink fluids. Results from studies on soccer players have suggested that

37
more research needs to be conducted on hydration guidelines and athletes may benefit from
education on hydration. The theme of adolescent athletes coming to practice in a dehydrated
state is consistent throughout the literature. Studies on tennis players, football players, basketball
and volleyball players found that these athletes are starting practice in a dehydrated state
(Bergeron, Waller, & Marinik, 2006; Kavouras et al., 2012; Yeargin et al., 2010).
Yeargin et al. (2010) targeted high school football players and found that most players
could replenish fluid losses during practice. However, high school football players did fail to
exercise proper rehydration strategies outside of practice. This resulted in players maintaining a
mild dehydrated state throughout the pre-season workouts (Yeargin et al., 2010). One of the few
studies that incorporated a hydration intervention noted increases in performance of adolescent
volleyball players (Kavouras et al., 2012). These studies concluded that more strategies should
be taken to educate athletes about pre/post training hydration tactics. This is one of the few
studies that has observed student athletes.
Yeargin (2009) collaborated with researchers throughout the country to conduct a study
on hydration status, sweat rates, and hydration education in youth football players. The football
players were observed for five days during summer camp. Data was collected on their sweat
rates and hydration status prior to administration of the study. A hydration questionnaire was
also given to participants at the beginning of the study to assess their current understanding of
their hydration habits and awareness. The football players were assigned to either an intervention
or control group. Participants in the intervention group were provided with educational sessions
on hydration after dinner on days 2-4 of the camp. These short educational sessions provided
players with information on the importance of hydration, hydration indices, and ways to improve
hydration status before and after practice. The control group was not provided with any extra

38
information on hydration during the camp. The intervention group did a better job of maintaining
their body weight and consuming fluids throughout the camp. Participants were able to replace
fluid losses during practices but not on game days. Results showed that the participants were
knowledgeable of their hydration habits, but campers noted that hydration may have been
impaired by lack of water breaks and crowded water stations. This study suggests that youth
athletes may be able to understand the importance of hydration but are unable to achieve a proper
hydration status due to limited water breaks and recovery time (McDermott et al., 2009).
Many past studies on hydration have not compared hydration habits between males and
females. Francescato et al. (2019) explored the hydration behaviors and pre/post-exercise
differences in hydration status between adolescent female and male soccer players. In addition,
they analyzed the effects of a personalized hydration session compared to ad libitum fluid
session. The participants completed both sessions. There appears to be a striking difference
between female and male soccer players regarding ad libitum fluid intake versus their
personalized hydration strategies. Male soccer players drank significantly less water when they
were instructed to drink water ad libitum compared to when they were given a personalized
hydration plan. Whereas, female soccer players drank similar amounts of water in the ad libitum
session and personalized hydration session. This data suggests that gender should be taken into
consideration when developing a hydration plan (Francescato et al., 2019).
Very few studies have provided an educational intervention to teach athletes about
hydration strategies. Three studies on adolescent athletes assessed whether an education
intervention could improve fluid intake. Volleyball and basketball players in Greece were
separated into a control and intervention group. The intervention group was provided with
additional information on hydration throughout the study. This information included a one-hour

39
lecture on the benefits of hydration, explanation of the urine color chart, and improved water
accessibility. The participants were observed over five days. On the second day of the study,
there appeared to be no differences in drinking habits between the control and intervention
group. On the fourth day of the study, only 66.1% of the intervention group participants were
classified as dehydrated compared to the control group where 96.7% of the participants were
classified as dehydrated. Their findings showed that the hydration invention proved to be helpful
in increasing fluid intake over a 2-day period. Athletes in the intervention group also had
improved endurance performance (Kavouras et al., 2012).
Volleyball players in Hawaii were also provided with an educational session on
hydration. The study was broken down into four observational periods. The first week was the
control period when individual hydration habits and sweat rates were determined. At the end of
the control period, an educational session on hydration was presented to the study participants,
coaches, and parents. During the third week of the study, participants were provided with
individualized hydration plans based on their sweat rates. Researchers required coaches to
provide six water breaks during a 2-hour practice. The last part of the study was a follow-up
session to conclude if any changes had been made to hydration habits. The one-day education
session did not prove to be beneficial, but they did find that when participants were prescribed
individual plans their fluid intake was improved. Adolescents may need repeated exposure to
hydration information for it to be beneficial (Cleary et al., 2012).
A hydration intervention provided to 120 college athletes in India was shown to improve
the knowledge, attitudes, and hydration practices of athletes. The athletes were placed in either a
control or intervention group. A week before the study commenced, data was collected on the
participants height, weight, BMI, and body composition. The intervention group was provided

40
with a week-long hydration education program. The researchers covered topics including
importance of fluids and its benefits, including dehydration, hydration status, and sports drinks.
Each session ran for one hour. During the last week of the study, all participants were asked to
complete a knowledge, attitudes, and hydration practices questionnaire (KAP). The intervention
group had improved hydration knowledge, attitudes, and hydration practices overall. Females
performed better on the KAP questionnaire, but males in the intervention group were less
dehydrated than females. The control group found no differences between the male and female
groups in regard to hydration. The results of this study showed that an intervention helped
improve athletes’ knowledge on hydration and hydration status (Sobana & Mirmala-Many,
2012).
Previous research has validated the need to fill the gaps in the literature. Many studies
have relied on short-term observations of hydration status in athletes and do not provide follow-
up data. Future studies should include the coaches and parents during the intervention period.
Educating coaches and parents may lead to improved hydration habits in adolescent athletes
because they can better monitor the students drinking habits. These steps may help prevent heat-
related illness in adolescent athletes and prompt improved drinking behaviors in high school
athletes.

41
REFERENCES
American Academy of Pediatrics. (2011). Clinical report--sports drinks and energy drinks for
children and adolescents: Are they appropriate? doi:10.1542/peds.2011-0965
Anastasiou, C. A., Kavouras, S. A., Arnaoutis, G., Gioxari, A., Kollia, M., Botoula, E., &
Sidossis, L. S. (2009). Sodium replacement and plasma sodium drop during exercise in the
heat when fluid intake matches fluid loss. Journal of Athletic Training, 44(2), 117-123.
doi:10.4085/1062-6050-44.2.117
Arnaoutis, G., Kavouras, S. A., Kotsis, Y. P., Tsekouras, Y. E., Makrillos, M., & Bardis, C. N.
(2013). Ad libitum fluid intake does not prevent dehydration in suboptimally hydrated
young soccer players during a training session of a summer camp. International Journal of
Sport Nutrition and Exercise Metabolism, 23(3), 245-251. doi:10.1123/ijsnem.23.3.245
Arnaoutis, G., Kavouras, S., Angelopoulou, A., Skoulariki, C., Bismpikou, S., Mourtakos, S., &
Sidossis, L. (2015). Fluid balance during training in elite young athletes of different
sports. Journal of Strength and Conditioning Research, 29(12), 3447-3452.
doi:10.1519/JSC.0000000000000400
Ayotte, J., David, & Corcoran, M. P. (2018). Individualized hydration plans improve
performance outcomes for collegiate athletes engaging in in-season training. Journal of the
International Society of Sports Nutrition, 15(1), 27-10. doi:10.1186/s12970-018-0230-2
Benton, D., Young, H., & Jenkins, K. (2015). The development of the predisposition to
dehydration questionnaire. Appetite, 87, 76-80. doi:10.1016/j.appet.2014.11.029
Bergeron, M. F., Waller, J. L., & Marinik, E. L. (2006). Voluntary fluid intake and core
temperature responses in adolescent tennis players: Sports beverage versus water. British
Journal of Sports Medicine, 40(5), 406-410. doi:10.1136/bjsm.2005.023333

42
Bergeron, M. F., Devore, C., & Rice, S. G. (2011). Policy statement--climatic heat stress and
exercising children and adolescents. Pediatrics, 128(3), e741. doi:10.1542/peds.2011-1664
Casa, D. J., Csillan, D., Armstrong, L. E., Baker, L. B., Bergeron, M. F., Buchanan, V. M., . . .
Yeargin, S. W. (2009). Preseason heat-acclimatization guidelines for secondary school
athletics. Journal of Athletic Training, 44(3), 332-333. doi:10.4085/1062-6050-44.3.332
Cleary, M. A., Hetzler, R. K., Wasson, D., Wages, J. J., Stickley, C., & Kimura, I. F. (2012a).
Hydration behaviors before and after an educational and prescribed hydration intervention in
adolescent athletes. Journal of Athletic Training, 47(3), 273-281. doi:10.4085/1062-6050-
47.3.05
Cotugna, N., Vickery, C. E., & McBee, S. (2005). Sports nutrition for young athletes. The
Journal of School Nursing, 21(6), 323-328. doi:10.1177/10598405050210060401
Francescato, M. P., Venuto, I., Buoite Stella, A., Stel, G., Mallardi, F., & Cauci, S. (2019). Sex
differences in hydration status among adolescent elite soccer players. Journal of Human
Sport and Exercise, 14(2) doi:10.14198/jhse.2019.142.02
Ganio, M. S., Tucker, M. A., Moyen, N. E., Butts, C. L., Treece, K., Burchfield, J. M., . . .
Smith, A. J. (2016). Effects of obesity and mild hypohydration on local sweating and
cutaneous vascular responses during passive heat stress in females. Applied Physiology,
Nutrition, and Metabolism, 41(8), 879-887. doi:10.1139/apnm-2016-0142
Gibson, J. C., Stuart-Hill, L. A., Pethick, W., & Gaul, C. A. (2012). Hydration status and fluid
and sodium balance in elite Canadian junior women's soccer players in a cool
environment. Applied Physiology, Nutrition, and Metabolism = Physiologie Appliquee,
Nutrition Et Metabolisme, 37(5), 931. doi:10.1139/H2012-073

43
Hew-Butler, T., Loi, V., Pani, A., & Rosner, M. H. (2017). Exercise-associated hyponatremia:
2017 update. Frontiers in Medicine, 4, 21. doi:10.3389/fmed.2017.00021
Kavouras, S. A., Arnaoutis, G., Makrillos, M., Garagouni, C., Nikolaou, E., Chira, O., . . .
Sidossis, L. S. (2012a). Educational intervention on water intake improves hydration status
and enhances exercise performance in athletic youth. Scandinavian Journal of Medicine &
Science in Sports, 22(5), 684-689. doi:10.1111/j.1600-0838.2011.01296.x
Leggett, T., Williams, J., Daly, C., Kipps, C., & Twycross-Lewis, R. (2018). Intended hydration
strategies and knowledge of exercise-associated hyponatraemia in marathon runners: A
questionnaire-based study. Journal of Athletic Training, 53(7), 696-702. doi:10.4085/1062-
6050-125-17
Maughan, R. J., & Shirreffs, S. M. (2010). Development of hydration strategies to optimize
performance for athletes in high-intensity sports and in sports with repeated intense
efforts. Scandinavian Journal of Medicine & Science in Sports, 20, 59-69.
McDermott, B. P., Anderson, S. A., Armstrong, L. E., Casa, D. J., Cheuvront, S. N., Cooper, L.,
&, Roberts, W. O. (2017). National athletic trainers' association position statement: Fluid
replacement for the physically active. Journal of Athletic Training, 52(9), 877-895.
doi:10.4085/1062-6050-52.9.02
McDermott, B. P., Casa, D. J., Yeargin, S. W., Ganio, M. S., Lopez, R. M., & Mooradian, E. A.
(2009). Hydration status, sweat rates, and rehydration education of youth football
campers. Journal of Sport Rehabilitation, 18(4), 535-552. doi:10.1123/jsr.18.4.535
Meyer, F., Volterman, K. A., Timmons, B. W., & Wilk, B. (2012). Fluid balance and
dehydration in the young athlete.American Journal of Lifestyle Medicine, 6(6), 489-501.
doi:10.1177/1559827612444525

44
National Federation of State High School Associations (NFHS). (2018). High School Sports
Participation Increases for 29th Consecutive Year. Retrieved from:
https://www.nfhs.org/articles/high-school-sports-participation-increases-for-29th-
consecutive-year/
Nuccio, R., Barnes, K., Carter, J., & Baker, L. (2017). Fluid balance in team sport athletes and
the effect of hypohydration on cognitive, technical, and physical performance. Sports
Medicine, 47(10), 1951-1982. doi:10.1007/s40279-017-0738-7
Phillips, S. M., Sykes, D., & Gibson, N. (2014). Hydration status and fluid balance of elite
European youth soccer players during consecutive training sessions. Journal of Sports
Science & Medicine, 13(4), 817-822. Retrieved
from https://www.ncbi.nlm.nih.gov/pubmed/25435774
Poole, J. A., Stearns, R. L., & Lopez, R. M. (2017). Heat acclimatization and exertional heat
illness prevention in youth football programs. Strength and Conditioning Journal, 39(2), 69-
Rowland, T. (2011). Fluid replacement requirements for child athletes. Sports Medicine, 41(4),
279-288. doi:10.2165/11584320-000000000-00000
Sawka, M. N., Burke, L. M., Eichner, E. R., Maughan, R. J., Montain, S. J., & Stachenfeld, N. S.
(2007). American college of sports medicine position stand. exercise and fluid
replacement. Medicine and Science in Sports and Exercise, 39(2), 377. Retrieved
from https://www.ncbi.nlm.nih.gov/pubmed/17277604
Sawka, M. N., Cheuvront, S. N., & Carter, R. (2005). Human water needs. Nutrition
Reviews, 63(6 Pt 2), S39. doi:10.1111/j.1753-4887.2005.tb00152.x
Sobana, R.M., & Nirmala-Many, J. (2014). Effect of Hydration Education on College Athlete’s
Hydration Status and KAP. International Journal of Science and Research, 3(7).

45
Thomas, T., Erdman, K.A., & Burke, L.M. (2016). Position of the academy of nutrition and
dietetics, dietitians of Canada, and the American college of sports medicine: Nutrition and
athletic performance. Journal of the Academy of Nutrition and Dietetics, 116(3), 501-528.
doi:10.1016/j.jand.2015.12.006
Trammell, J. E. (2007). Assessment of hydration knowledge, attitude, behaviors and fluid
replacement effectiveness of collegiate athletes Available from ProQuest Central (Alumni
Edition). Retrieved from https://search.proquest.com/docview/304886272
Wall, B. A., Watson, G., Peiffer, J. J., Abbiss, C. R., Siegel, R., & Laursen, P. B. (2015). Current
hydration guidelines are erroneous: Dehydration does not impair exercise performance in
the heat. British Journal of Sports Medicine, 49(16), 1077-1083. doi:10.1136/bjsports-2013-
092417
Yard, E. E., Gilchrist, J., Haileyesus, T., Murphy, M., Collins, C., McIlvain, N., & Comstock, R.
D. (2010). Heat illness among high school athletes — United States, 2005–2009. Journal of
Safety Research, 41(6), 471-474. doi:10.1016/j.jsr.2010.09.001
Yeargin, S. W., Casa, D. J., Judelson, D. A., McDermott, B. P., Ganio, M. S., Lee, E. C., . . .
Maresh, C. M. (2010). Thermoregulatory responses and hydration practices in heat-
acclimatized adolescents during preseason high school football. Journal of Athletic
Training, 45(2), 136-146. doi:10.4085/1062-6050-45.2.136

46
APPENDIX A: HYDRATION QUESTIONNAIRE
Code: ___________ ID:____________
Pre-Survey: Hydration Questionnaire
1. Male ______ Female ______
2. What high school do you attend? _______________________
3. What sport do you play? ____________________
4. Indicate year in school
a. Freshman
b. Sophomore
c. Junior
d. Senior
5. On average, how many hours a day do you practice? (**Circle One**)
a. < 3 hours b. 3-5 hours c. 5-7 hours d. >7 hours
6. How would you rate the intensity of your practices?(** Circle One**)
a. Very Low b. Low c. Moderate D. High
The next section consists of a series of true and false questions. Read each statement carefully and
circle the best answer.
1. Thirst is the best gauge of dehydration.
a. True b. False

47
2. Dehydration decreases athletic performance
a. True b. False
3. An athlete should not drink water or any fluids during practice
a. True b. False
4. Excessive sweating, thirst, and cramping are signs of dehydration
a. True b. False
5. Sports drinks are better than water because they contain carbohydrates
a. True b. False
6. An athlete should drink 2-3 glasses of water or sports drinks several hours before
competition
a. True b. False
7. A good way for an athlete to determine how much fluids to consume after practice is to
weight before and after practice
a. True b. False
8. I believe I am hydrated when I start practice
a. True B. False
9. How many glasses of water do you drink per day? ____________________
10. How many water bottles (32 oz) do you drink during practice? ______________
11. Where do you receive most of your information regarding hydration?

48
Code: __________ ID:____________
Post-Survey: Hydration Questionnaire
1. On average, how many hours a day do you practice? (**Circle One**)
a. < 3 hours b. 3-5 hours c. 5-7 hours d. >7 hours
2. How would you rate the intensity of your practices? (** Circle One**)
a. Very Low b. Low c. Moderate D. High
The next section consists of a series of true and false questions. Read each statement carefully and
circle the best answer.
1. Thirst is the best gauge of dehydration.
a. True b. False
2. Dehydration decreases athletic performance
a. True b. False
3. An athlete should not drink water or any fluids during practice
a. True b. False
4. Excessive sweating, thirst, and cramping are signs of dehydration
a. True b. False
5. Sports drinks are better than water because they contain carbohydrates
a. True b. False
6. An athlete should drink 2-3 glasses of water or sports drinks several hours before
competition
a. True b. False

49
7. A good way for an athlete to determine how much fluids to consume after practice is to
weight before and after practice
a. True b. False
8. I believe I am hydrated when I start practice
a. True B. False
9. How many glasses of water do you drink per day? ____________________
10. How many water bottles (32 oz) do you drink during practice? ______________
11. Where do you receive most of your information regarding hydration?

50
APPENDIX B: MATERIALS FOR EDUCATIONAL SESSIONS
Slide 1
SIGNS AND SYMPTOMS OF
DEHYDRATIONErin Ortiz, RD
Slide 2
FUNCTIONS OF WATER
Our bodies are 70-80%
water
Every tissue, cell, and organ
in our body needs water
Water plays an important
part in maintaining our
internal body temperature
Functions of water:
Maintain homeostasis
Water helps transport nutrients and
oxygen
Moistens body tissues (eyes, mouth,
skin)
Main part of all body fluids (Duyff,
2012)
Slide 3
DEHYDRATION
Dehydration occurs when fluids are not replaced
One of the first signs of dehydration is thirst
One of the best ways to monitor dehydration is by using body
weight
A loss of greater than 1% of your body weight during exercise can
lead to impaired performance
We will be looking at your body
weight to help monitor dehydration.
We will be measuring your pre/post
body weights during practice.

51
Slide 4
FACTORS EFFECTING DEHYDRATION
Temperature: hotter temperatures cause the body to perspire
more
Intensity of Exercise: harder workouts, leads to more sweat loss
Body Size: larger athletes sweat more
Gender: male athletes typically sweat more
Fitness Level: well-trained athletes sweat more, at lower body
temperatures.
Sowell Jennings and Nelson Steen,
1995
Slide 5 LOOK OUT FOR THESE SYMPTOMS
Excessive Thirst
Dry Mouth
Fatigue
Headache
Increased Breathing Rate
Dizziness
Muscles Spasms
Swollen Tongue
Impaired Physical Performance
Dark Urine
https://www.youtube.com/watch?v=A
LHObkStAt0 (tennis video at 0.59)
Go over Urine Colors
Slide 6

52
Slide 1
MONITORING AND INCREASING FLUID INTAKE
ERIN ORTIZ
Slide 2
REVIEW OF S/S OF DEHYDRATION
• WHAT WERE SOME OF THE SIGNS AND SYMPTOMS OF
DEHYDRATION?
• FATIGUE
• DRY MOUTH
• THIRST
• DECREASES IN PERFORMANCE
Urine Color Chart [online image].
(2018). Retrieved from:
https://www.quora.com/How-
dangerous-is-a-peach-colored-urine.
Slide 3
WHAT TO DRINK
• ACTIVITIES UNDER 60 MINUTES: DRINK WATER
• ACTIVITIES OVER 60 MINUTES: WATER+ SPORTS DRINK (GATORADE, PROPEL, POWER AID)
• LOOK FOR SPORTS DRINKS THAT CONTAIN 6-8% CARBOHYDRATES
• SPORTS DRINKS CONTAINING MORE THAN 8% CARBOHYDRATES MANY INCREASE STOMACH
CRAMPS
• AVOID ENERGY DRINKS! (IHSA BANS CAFFEINE (GUARANA))
If a student is working out for less than
60 minutes, but it is hot and humid
outside, add a sports drink
If students are working out leisurely
they most likely will only need water
Avoid energy drinks, they are full of
sugar and some may contain high
amounts of caffeine (students need to
be aware of IHSA rules on caffeine
consumption)

53
Slide 4
TIPS FOR INCREASING FLUID INTAKE
• CARRY A WATER BOTTLE WITH YOU
• INFUSE WATER WITH FRUITS OR VEGETABLES
• HAVE A GLASS WATER, LOW-FAT MILK, OR 100% JUICE AT EACH MEAL
• SNACK OF FRUITS AND VEGETABLES
• GRAB A SIP OF WATER EACH TIME YOU WALK BY A WATER FOUNTAIN
Many Fruits and Vegetables are high in
water content
Other Foods also contain water
Slide 5
QUESTIONS?