hydraulic conditioning to manage potable water discolouration
TRANSCRIPT

Hydraulic conditioning to manage potable water discolouration
SHARPE, Rebecca <http://orcid.org/0000-0002-2783-9215>, BIGGS, Catherine and BOXALL, Joby
Available from Sheffield Hallam University Research Archive (SHURA) at:
http://shura.shu.ac.uk/17071/
This document is the author deposited version. You are advised to consult the publisher's version if you wish to cite from it.
Published version
SHARPE, Rebecca, BIGGS, Catherine and BOXALL, Joby (2019). Hydraulic conditioning to manage potable water discolouration. Proceedings of the Institution of Civil Engineers - Water Management, 172 (1), 3-13.
Copyright and re-use policy
See http://shura.shu.ac.uk/information.html
Sheffield Hallam University Research Archivehttp://shura.shu.ac.uk

Hydraulic conditioning to manage potablewater discolouration&1 Rebecca L. Sharpe BSc (Hons), MSc, PhD
Lecturer, Department of the Natural & Built Environment, SheffieldHallam University, Sheffield, UK (corresponding author:[email protected])
&2 Catherine A. Biggs BEng (Hons), PhD, AMIChemE, MRSCProfessor, Pennine Water Group, Department of Chemical andBiological Engineering, The University of Sheffield, Sheffield, UK
&3 Joby B. Boxall MEng (Hons), PhD, CEng, CEnvProfessor, Pennine Water Group, Department of Civil and StructuralEngineering, The University of Sheffield, Sheffield, UK
1 2 3
Results are reported from studies conducted using a unique laboratory-based, full-scale, temperature-controlled pipefacility to examine the impact of conditioning shear stress on discolouration risk, as characterised by bulk watersamples (turbidity, iron and manganese) and biofilm pipe wall measurements. The facility uniquely allowed forreplication of the dynamics of an operational network but with rigorous control, thus yielding fully representativeresults overcoming the limitations of bench-scale or operational studies. The effect of the daily variation in flow (andboundary shear stress) was observed to be greater than the effect of the average daily flow rate at reducingdiscolouration risk. This is useful for informing operation and maintenance strategies, specifically that regularlyimposing cycles of flow variation are more effective than increasing total average flow rates at limiting discolourationrisk. The application of such knowledge aids the development of cost-effective, proactive, operational interventions tomanage discolouration.
1. Introduction
1.1 BackgroundDiscoloured water is the dominant water-quality-relatedcustomer complaint within the UK water industry and is a sig-nificant issue internationally. Although termed discolouration,the regulated parameter is turbidity because the aestheticimpact is due to suspension of fine particulate material (Boxallet al., 2001). The Drinking Water Inspectorate (DWI) regulatesthe UK water industry for drinking water quality and has setturbidity standard at customers’ taps at 4 NTU (nephelometricturbidity units) (DWI, 2000). Water leaving treatment works isregulated at 1 NTU, but by the time it reaches the customer itcan fail to reach the distribution standard (Bristol Water,2008). Even if one considers external particle sources, such assource water and ingress due to negative pressures (Fox et al.,2015), it is clear that processes within the network contributeconsiderably to increased turbidity by the time the waterreaches taps. The main cause of this is thought to be themobilisation of material layers from pipe walls due to changesin hydraulic conditions, such as increases in flow, whichincrease shear stress and thus the forces acting to mobiliseaccumulated material (Boxall et al., 2001). Hydraulic con-ditions within operational systems are complex, commonlyexhibiting a diurnal pattern in flow driven by consumption,but also due to events and incidents such as bursts. Processes
leading to particle accumulation include physical, chemicaland biological factors (Vreeburg and Boxall, 2007). Previousknowledge and understanding of the processes that influencethe accumulation and mobilisation of material have been devel-oped in experimental investigations through laboratory, pilotand field flushing studies (controlled increase of the pipe flowrate intended to mobilise material (Husband et al., 2008)) andby way of model theories (Boxall et al., 2001). However, dueto the limitations of such approaches, there remains significantuncertainty, including the exact nature of the influence ofnormal (daily) hydraulic conditions within operationalnetworks.
1.2 Discolouration experimental researchConditions in operational distribution networks are complex,uncertain and inadequately understood or quantified. Networkconditions vary considerably and are sensitive to physico-chemical and biological conditions (Block, 1992).Discolouration events, resulting in customer contacts, areunpredictable and happen over a short time period, makingthem difficult to study in operational networks (Vreeburg andBoxall, 2007). Controlled discolouration events (flushing) arepossible and these have shown strong correlations betweenincreased turbidity and iron (Fe) and manganese (Mn) levels(Seth et al., 2004). In particular, the long-term network
1
Water Management
Hydraulic conditioning to managepotable water discolourationSharpe, Biggs and Boxall
Proceedings of the Institution of Civil Engineers
http://dx.doi.org/10.1680/jwama.16.00038Paper 1600038Received 26/04/2016 Accepted 05/09/2017Keywords: water supply
ICE Publishing: All rights reserved

conditions prior to flushing are also often unknown, variedand uncontrolled. It is therefore very difficult to conductdetailed investigations into the build-up of accumulates anddiscolouration risk in operational networks.
Bench-scale testing devices such as Propella and annular reac-tors like the Robbins device (Kharazmi et al., 1999) andRototorque provide alternatives to field studies, providingpotential for the control of influential factors such as nutrientsupply. Many of these devices include plugs inserted into thesurface so that accumulates can be analysed (Flemming, 2002).Donlan (2002) developed a reactor that incorporated remova-ble ‘biofilm growth surfaces’ allowing formation under differ-ent shear stress conditions. Although these have been veryuseful in providing continuous non-destructive sets ofinformation, the conditions do not effectively replicate someimportant aspects of a drinking water distribution system(DWDS). Bench-scale tests do not recreate the DWDS bound-ary layer hydraulics and turbulence, or the correct ratio ofbulk water to surface area and transfer between these.Hydraulic conditions in bench-scale tests are often simplydefined by reference to, and control of, the speed of rotation.The hydraulic conditions generated are complex and poorlyrepresent pipeline hydraulic conditions. Most bench-scaleinvestigations assess material accumulation and detachmentunder steady-state hydraulic conditions, which never occur inoperational distribution systems. Furthermore, most bench-scale research studies have only investigated accumulation(e.g. Batte et al., 2003; Murga et al., 2001; Schwartz et al.,1998). Few bench-scale studies have attempted to simulatemobilisation due to hydraulic changes; those that have, crudelyincreased the speed of rotation (Abe et al., 2011, 2012). Suchstudies can only observe the loss from the wall, not the bulkwater response. A recent investigation by Luo et al. (2015)confirmed such limitations, finding that bioreactors provide anunrealistic representation of biofilm growth in operationalsystems.
The investigations reported by Husband et al. (2008) provide acompromise between bench-scale and operational networksby using a 90 m long recirculating high-density polyethylene(HDPE) pipe facility within a controlled laboratory environ-ment. Week-long investigations were completed at a constantconditioning flow rate of 0·3 l/s, before being flushed by smallflow increments (15 min each). The data generated demon-strated a positive relationship between shear stress and turbid-ity, validating the basis of the prediction and control ofdiscolouration in distribution systems (Podds) model (Boxallet al., 2001). A second experiment involving four month-longstudies measured the impact of constant and varied flow onturbidity. During the first flushing step more material wasmobilised during the constant-flow trials than during variableflow. It was therefore concluded that, during steady-state flow,weaker particle layers develop than during variable flow. Thevariability in flow was hence deemed a significant factor in
determining the risk of discolouration. However, there wereseveral limitations to the experiment. Firstly, there was notemperature control and variable elevated temperatures arelikely to influence chemical and biological processes. Inaddition, the experiment only recorded turbidity and so pro-vided no further insight into the material mobilised or the pro-cesses involved. Furthermore, while the length of the facilitywas significant, it was not sufficient to be certain that pipesurface effects entirely dominated the effects of the tank andancillary fittings and fixtures. Finally, the facility was a singleloop, offering no simultaneous replication, and there may havebeen variations in the source water between repeats with differ-ent hydraulic conditions.
Other pilot-scale research studies have been conducted, butthese too have significant limitations. Martiny et al. (2003)sampled biofilm and bulk water from a model water distri-bution system supplied with untreated groundwater. The exper-iment solely investigated steady-state hydraulic conditions. Steelplugs were inserted in a 12·2 m loop for biofilm sampling, butwere not designed flush to the pipe wall, so would have pro-duced locally significant distortion of the boundary layer andturbulence regime. Lehtola et al. (2005) investigated the differ-ences in water quality and the formation of biofilms in apilot-scale distribution system comparing copper and plastic(polyethylene) pipes. Research design limitations included thesize of the network, which did not effectively recreate theboundary layer hydraulics and the turbulence regime ofoperational systems, and hence the exchange with bulk waterfor the correct ratio of bulk water to pipe surface area.
1.3 Hydraulic conditioning and discolouration riskHydraulic conditioning has been suggested as a managementstrategy to reduce discolouration risk. The ‘self-cleaning’method employed in the Netherlands constitutes keeping thevelocity higher than 0·4 m/s in order to reduce build-up(Van den Boomen et al., 2004). It was suggested that, due tolow velocity, particles can accumulate in areas such as redun-dant loops and oversized pipes, and 0·4 m/s was shown to be apragmatically effective value for the Netherlands. Alternatively,Boxall et al. (2001) assumed the existence of cohesive materiallayers accumulated within the DWDS and that layers formedduring conditions of high average flow were stronger thanlayers formed during lower average flow. This approach hasbeen supported by UK (Husband and Boxall, 2010) andinternational (Boxall and Prince, 2006) DWDS field trials. Infurther support, Cook (2010) found a correlation betweendecreased conditioning shear stress and increased frequency ofcustomer contacts regarding discolouration. Such investi-gations were based on field studies and therefore the previousconditioning hydraulic demand profiles, water chemistry andbiology were uncertain. For example, work by Blokker et al.(2010), which considered stochastic demand prediction,suggested that the Dutch threshold should be increased by0·2–0·25 m/s.
2
Water Management Hydraulic conditioning to managepotable water discolourationSharpe, Biggs and Boxall
Offprint provided courtesy of www.icevirtuallibrary.comAuthor copy for personal use, not for distribution

While such works clearly show the influence of hydraulic con-ditions, there is uncertainty over whether the peak or averagehydraulic conditions are important, or some combination ofthe two. This ambiguity is attributable to the uncertainty offlow in individual pipes of operation networks, which is onlyavailable from one-dimensional hydraulic models that attemptto simulate an idealised 24 h period. Further work, such asthat conducted by Smith et al. (1999) using a pipe test facility,has suggested that the interactions that occur during low-flowor night-time stagnation conditions are important in processesleading to aesthetic water-quality issues. However, this studywas conducted for cast-iron pipes and was likely dominated byion release and accumulation in the bulk water during thelow-flow period.
In summary, while modelling and bench-top experiments canhelp predict system responses to events, studies in operationsystems have too many uncontrolled factors and uncertaintiesand do not allow for deeper understandings of controllingenvironmental factors. Research in a controlled laboratory isrequired to determine the impact of different shear stressprofiles and whether it is the peak, average or variability of theflow pattern that is the most important factor in discolourationrisk.
2. Research aimsThe aim of this research was to investigate the impact ofhydraulic conditions on material accumulation on pipe wallswithin a DWDS and the subsequent mobilisation (discolour-ation) response of this material due to flushing. Specifically,the impact of different net flow rates and diurnal patterns wasstudied. A key advance of the research was ensuring thathydraulic and temperature conditions were fully representativeof operational systems, but with the control and replication ofa laboratory environment. The value of this research is to helpto inform intervention strategies to best manipulate hydraulicconditions to manage discolouration risk.
3. Materials and methods
3.1 Experimental pipe facilityAn internationally unique, large-scale, experimental pipe loopfacility housed in a temperature-controlled room was usedfor the experiments (Figure 1). The use of a pipeline funda-mentally addresses the issues with bench-top systems (as setout in Section 1.2) while providing the control and repetitionnot possible in operational systems (Section 1.3).
The facility comprises three loops, controllable to representdifferent hydraulic regimes. The loops are exact replicates, pro-viding confidence in the results. The laboratory temperaturewas controlled by means of cooling units (±1°C), with thewater temperature monitored for confirmation. The length ofthe pipe loop ensured that pipe surface effects were dominantover others (e.g. the effects of ancillary fittings and fixtures).
HDPE pipes were chosen to correspond to the design of amodern DWDS. Each coil had a final straight section forhydraulic control and flow measurement. The pipe diameterwas selected to be representative of the dominant pipe dia-meter by length of UK DWDSs (based on data reported byUK Water Industry Research (UKWIR, 2003)). Unlike bench-scale experiments, the realistic volume to area ratio and turbu-lence regime of the test loop facility fully replicated theexchange processes and interactions between the bulk fluid andthe pipe wall of operational systems (e.g. nutrient and particleexchange). The full-scale nature of the facility, includinghydraulic and turbulence regimes, also meant that the bound-ary layer conditions and hence surface forces were fullyrepresentative.
The system was supplied with water from the local distributionsystem, characterised by a peat upland source, a treatmentsystem based on iron coagulation, high standard final filtersand free chlorine disinfection and residual. There was �10 kmof predominantly cast-iron trunk main and one service reser-voir before the water reached the laboratory, with no localdistribution systems and minimal pipe connectivity prior tothe laboratory. Once filled from this source, the system wasoperated with a trickle turnover to achieve the desired waterage, providing a renewal of bulk water material includingchlorine residual. Bulk and incoming water quality weresampled throughout.
The facility was operated in a recirculating manner with asingle enclosed tank. Water was transferred to the loops bya single variable-speed pump and then a three-way manifold.Overall system pressure was computer-controlled by the pumpspeed, with flow rates through each of the loops independentlycomputer-controlled by valves at the end of each loop, beforebeing returned to the tank. Each loop thus had a residencetime as a function of the hydraulic conditions created withinit, and this was independent of the system residence timecontrolled by the overall trickle feed and drain. A single tankwas selected such that the loops shared the same bulk water,allowing for seeding and mixing between the loops. This isrepresentative of a complex, looped operational network whereinteracting pipe conditions occur upstream of any given pipelength, and ensured that any difference between the loops waspurely a function of the hydraulic conditions created withinthat loop.
To achieve the study aims, coupons were required to investigatethe amount of material accumulation on the pipe wall.Pennine Water Group coupons (Deines et al., 2010) were used,allowing for direct observation of material on the pipe wall.These coupons consist of an HDPE disc, which follows thepipe curvature, with a removable flat section for microscopy(Figure 1(e)). The flat microscope section is only 4·5 mm wide,such that the deviation from pipe curvature approaches that ofroughness heights used to represent plastic pipes in hydraulic
3
Water Management Hydraulic conditioning to managepotable water discolourationSharpe, Biggs and Boxall
Offprint provided courtesy of www.icevirtuallibrary.comAuthor copy for personal use, not for distribution

modelling, thus minimising distortion of the boundary layerflow (Douterelo et al., 2014).
3.2 Experiment design
3.2.1 Experimental design overviewUsing the unique facility, two experiments were conductedconsisting of a 28 d accumulation phase followed by short-duration flushing (substantially increased flow) phases formaterial mobilisation. The experiments were conducted todetermine the impact of hydraulic conditions on discolourationrisk, defined here as the quantity of material accumulated onthe pipe wall and the amount mobilised into the bulk waterafter imposed flushing. The environmental variable controlledand studied was hydraulic conditions during the accumulationphase. One experiment investigated the impact of steady-state
conditioning shear stress on material behaviour; the othercompared this with, and explored the effect of, diurnal flowpatterns.
Figure 2 shows the 24 h hydraulic patterns used during theaccumulation phases. These patterns, the range of system press-ures, flow rates and hydraulic retention times used in thisresearch were determined by reviewing and averaging theoutputs from UK pressure-calibrated hydraulic models, withdemand patterns extrapolated from flowmeters of several net-works, as also done by Husband et al. (2008). Average valuesof pressure, flow and hydraulic retention times used were basedaround 40 m, 0·3 l/s (0·06 m/s, Re= 4200) and 1 d, respect-ively. Flow patterns were offset within the day, such that night-time minimum conditions occurred in early afternoon toenable sampling or checks to be made during low-flow
(a)
(b)
(e)
(c) (d)
Tank
MV
FM3
FM3
CV3
3b 9 m
Loop 3
Loop 3
Loop 2
Loop 1 1a
1b
2a
2b
3aCV2
T
CV1
FM2
FM1
Insert
Outer coupon
Outer couponPWG couponInsert
20·0 mm4·5 mm
2·0 mm6·5 mm
5·5 mm
20·0 mm
3b
Loop 2
Loop1
4 m
3a
2b
2a
1b
1a
FM1
FM2
Figure 1. DWDS simulation pipe facility and Pennine Water Group (PWG) coupon. (a) Test facility: total volume (tank and loops), 4·5 m3;tank volume, 1·53 m3; each loop comprised nine and a half 21·4 m long coils of 79·3 mm internal diameter HDPE, with a total length of�200 m; MV=manual valves used to separate the three loops; 1a, 2a and 3a indicate the fifth coil of each loop into which PWGcoupons were inserted; 1b, 2b and 3b indicate the 50 mm internal diameter pipes containing flowmeters (FM) and control valves.(b) Detail of loop arrangement: T = turbidity meter (measured using a Chemtrac TM2200 turbidity instrument (Chemtrac Inc., USA));CV= control valve. (c) Coupons secured in the apertures. (d) HDPE PWG coupon and rubber gasket to ensure a watertight fit. (e) PWGcoupon components (insert for microscopy and outer coupon for molecular analyses) and dimensions (reproduced from Fish et al., 2015)
4
Water Management Hydraulic conditioning to managepotable water discolourationSharpe, Biggs and Boxall
Offprint provided courtesy of www.icevirtuallibrary.comAuthor copy for personal use, not for distribution

conditions and hence minimising any impacts. All experimentswere performed in winter. In order to mitigate for any temp-erature change effects (i.e. chemical or microbial processes andinteractions), the laboratory temperature was matched to theincoming winter water temperature (8°C). The test loop facilitywas cleaned before each set of experiments to achieve consist-ent starting conditions. This was achieved by disinfection witha 20 mg/l sodium hypochlorite solution (<16% free chlorine),recirculated within the facility for 24 h, at the maximumattainable flow rate (4·5 l/s). Afterwards, the test loops wereflushed recurrently with fresh water until the chlorine andturbidity levels stabilised to those of the inlet water.
3.2.2 AccumulationThe first set of experiments investigated the impact of threedifferent steady-state flow rates, or conditioning shear stresses,on material behaviour. Steady-state experiments were con-ducted to determine the controlled effect of 0·1, 0·2 and0·5 N/m2 conditioning shear stress on discolouration risk, thusimproving on bench-scale tests by providing controlled defini-tive knowledge and understanding of the amount of materialaccumulation and mobilisation. The chosen conditioning shearstresses relate to typical low, medium and high values experi-enced within UK DWDSs (Husband et al., 2008). Althoughresearch into steady-state shear stresses usefully demonstratesthe different impacts of net flow effects and conditioning shear
stress, it is not realistic of demand-induced diurnal flowpatterns experienced in operational distribution networks.Hence the second set of experiments explored the effects ofdiurnal flow patterns. Profiles were chosen based on typicalflow profiles from a UK network (Husband and Boxall, 2010).An average double-peak residential pattern, taken from flow ina 75 mm pipe, was used as the basic flow pattern to define twovaried flow patterns (Figure 2). The second set of experimentsalso repeated the medium flow rate of the steady-state trials asa control and to allow for direct comparison and repeatabilitychecks. Each of these (two varied flow patterns, and mediumsteady-state) had the same total flow in 24 h, removing netflow effects from comparison between them. The two varied,daily, flow patterns were designed to achieve different peakconditions such that the effect of these could be studied. Thepatterns were also designed to have the same night-timeminimum conditions. Thus, if different results were obtainedfor varied patterns, the peak effect is important. If similarresults occurred for the two varied flow patterns, and thesetended to be the results from the lowest steady-state condition-ing experiment, then the night-time minimum is important.
3.2.3 MobilisationFollowing the 28 d accumulation phase, a simulated flushingmobilisation phase was performed in each loop sequentially.The selected loop was flushed by increasing the shear stress in
0
14:0
015
:00
16:0
017
:00
18:0
019
:00
20:0
021
:00
22:0
023
:00
00:0
001
:00
02:0
003
:00
04:0
005
:00
06:0
007
:00
08:0
009
:00
10:0
011
:00
12:0
013
:00
0·1
0·2
0·3
0·4
0·5
0·6
0·7
0·8
0·9
Flow
: l/s
Time: h:min
HVFLVF0·2 l/s0·4 l/s0·8 l/s
Figure 2. Accumulation-phase daily experimental flow profile (HVF refers to high varied flow and LVF indicates low varied flow). Reynoldsnumber for these flow rates ranged from 3500 to 10 500 (Husband et al., 2008); flow was thus either just transitional or fully turbulent
5
Water Management Hydraulic conditioning to managepotable water discolourationSharpe, Biggs and Boxall
Offprint provided courtesy of www.icevirtuallibrary.comAuthor copy for personal use, not for distribution
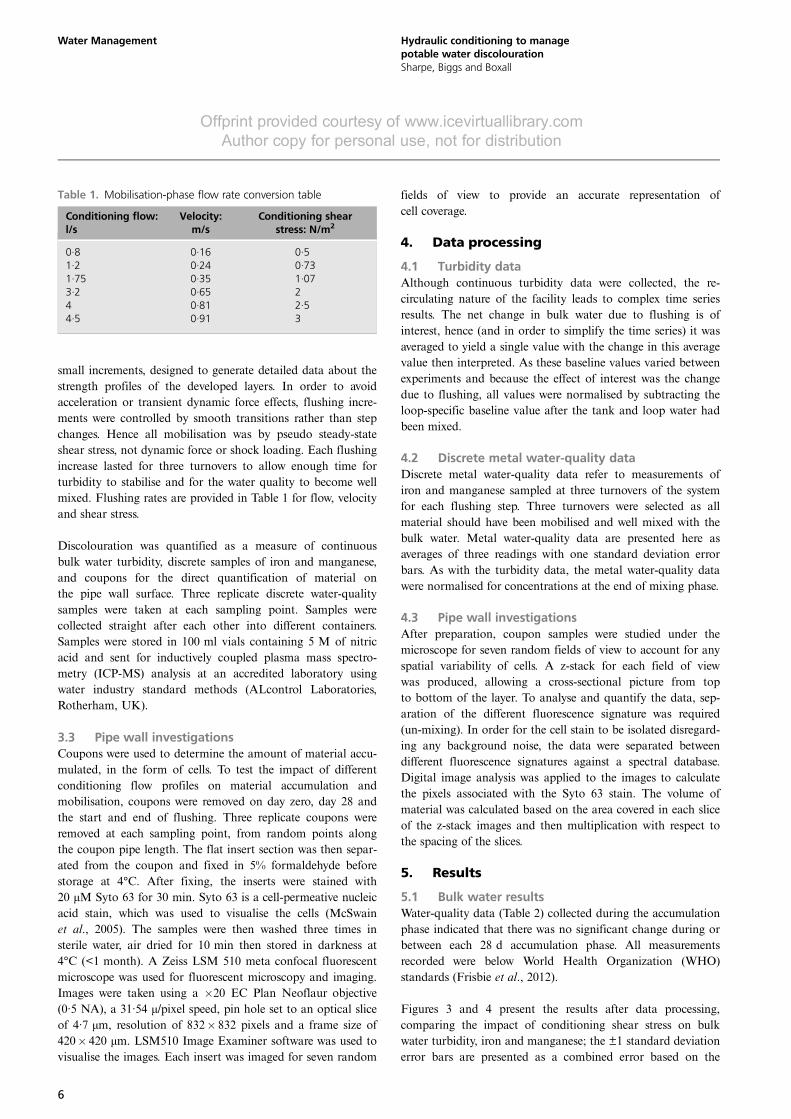
small increments, designed to generate detailed data about thestrength profiles of the developed layers. In order to avoidacceleration or transient dynamic force effects, flushing incre-ments were controlled by smooth transitions rather than stepchanges. Hence all mobilisation was by pseudo steady-stateshear stress, not dynamic force or shock loading. Each flushingincrease lasted for three turnovers to allow enough time forturbidity to stabilise and for the water quality to become wellmixed. Flushing rates are provided in Table 1 for flow, velocityand shear stress.
Discolouration was quantified as a measure of continuousbulk water turbidity, discrete samples of iron and manganese,and coupons for the direct quantification of material onthe pipe wall surface. Three replicate discrete water-qualitysamples were taken at each sampling point. Samples werecollected straight after each other into different containers.Samples were stored in 100 ml vials containing 5 M of nitricacid and sent for inductively coupled plasma mass spectro-metry (ICP-MS) analysis at an accredited laboratory usingwater industry standard methods (ALcontrol Laboratories,Rotherham, UK).
3.3 Pipe wall investigationsCoupons were used to determine the amount of material accu-mulated, in the form of cells. To test the impact of differentconditioning flow profiles on material accumulation andmobilisation, coupons were removed on day zero, day 28 andthe start and end of flushing. Three replicate coupons wereremoved at each sampling point, from random points alongthe coupon pipe length. The flat insert section was then separ-ated from the coupon and fixed in 5% formaldehyde beforestorage at 4°C. After fixing, the inserts were stained with20 μM Syto 63 for 30 min. Syto 63 is a cell-permeative nucleicacid stain, which was used to visualise the cells (McSwainet al., 2005). The samples were then washed three times insterile water, air dried for 10 min then stored in darkness at4°C (<1 month). A Zeiss LSM 510 meta confocal fluorescentmicroscope was used for fluorescent microscopy and imaging.Images were taken using a �20 EC Plan Neoflaur objective(0·5 NA), a 31·54 μ/pixel speed, pin hole set to an optical sliceof 4·7 μm, resolution of 832� 832 pixels and a frame size of420� 420 μm. LSM510 Image Examiner software was used tovisualise the images. Each insert was imaged for seven random
fields of view to provide an accurate representation ofcell coverage.
4. Data processing
4.1 Turbidity dataAlthough continuous turbidity data were collected, the re-circulating nature of the facility leads to complex time seriesresults. The net change in bulk water due to flushing is ofinterest, hence (and in order to simplify the time series) it wasaveraged to yield a single value with the change in this averagevalue then interpreted. As these baseline values varied betweenexperiments and because the effect of interest was the changedue to flushing, all values were normalised by subtracting theloop-specific baseline value after the tank and loop water hadbeen mixed.
4.2 Discrete metal water-quality dataDiscrete metal water-quality data refer to measurements ofiron and manganese sampled at three turnovers of the systemfor each flushing step. Three turnovers were selected as allmaterial should have been mobilised and well mixed with thebulk water. Metal water-quality data are presented here asaverages of three readings with one standard deviation errorbars. As with the turbidity data, the metal water-quality datawere normalised for concentrations at the end of mixing phase.
4.3 Pipe wall investigationsAfter preparation, coupon samples were studied under themicroscope for seven random fields of view to account for anyspatial variability of cells. A z-stack for each field of viewwas produced, allowing a cross-sectional picture from topto bottom of the layer. To analyse and quantify the data, sep-aration of the different fluorescence signature was required(un-mixing). In order for the cell stain to be isolated disregard-ing any background noise, the data were separated betweendifferent fluorescence signatures against a spectral database.Digital image analysis was applied to the images to calculatethe pixels associated with the Syto 63 stain. The volume ofmaterial was calculated based on the area covered in each sliceof the z-stack images and then multiplication with respect tothe spacing of the slices.
5. Results
5.1 Bulk water resultsWater-quality data (Table 2) collected during the accumulationphase indicated that there was no significant change during orbetween each 28 d accumulation phase. All measurementsrecorded were below World Health Organization (WHO)standards (Frisbie et al., 2012).
Figures 3 and 4 present the results after data processing,comparing the impact of conditioning shear stress on bulkwater turbidity, iron and manganese; the ±1 standard deviationerror bars are presented as a combined error based on the
Table 1. Mobilisation-phase flow rate conversion table
Conditioning flow:l/s
Velocity:m/s
Conditioning shearstress: N/m2
0·8 0·16 0·51·2 0·24 0·731·75 0·35 1·073·2 0·65 24 0·81 2·54·5 0·91 3
6
Water Management Hydraulic conditioning to managepotable water discolourationSharpe, Biggs and Boxall
Offprint provided courtesy of www.icevirtuallibrary.comAuthor copy for personal use, not for distribution

error from the initial value used to normalise the data and theactual recording.
The mobilisation data for steady-state shear stress trials at 8°C(Figure 3) depicted the general trend of less material mobilisedinto the bulk water in terms of turbidity, iron and manganesewith increasing steady-state shear stress. The exception to thiswas observed for the turbidity value at a shear stress 2·5 N/m2
for the highest steady-state shear stress (Figure 3(a)).
Despite the same 24 h total flow of each hydraulic regime,there was generally more material mobilised from the materialaccumulated under the steady-state conditioning shear stress of0·2 N/m2 compared with the varied conditioning shear stressexperiments (Figure 4). This was especially pronounced foriron (Figure 4(b)) and manganese (Figure 4(c)) and after2 N/m2 for turbidity (Figure 4(a)). Little difference in the ironand manganese results was observed between the low and highvaried hydraulic condition experiments.
Comparing the 0·2 N/m2 steady-state results from the two setsof experiments (Figures 3 and 4), there was slight variability inthe two repeats but, in general, the same trends and magni-tudes of response are evident across the turbidity, iron andmanganese parameters.
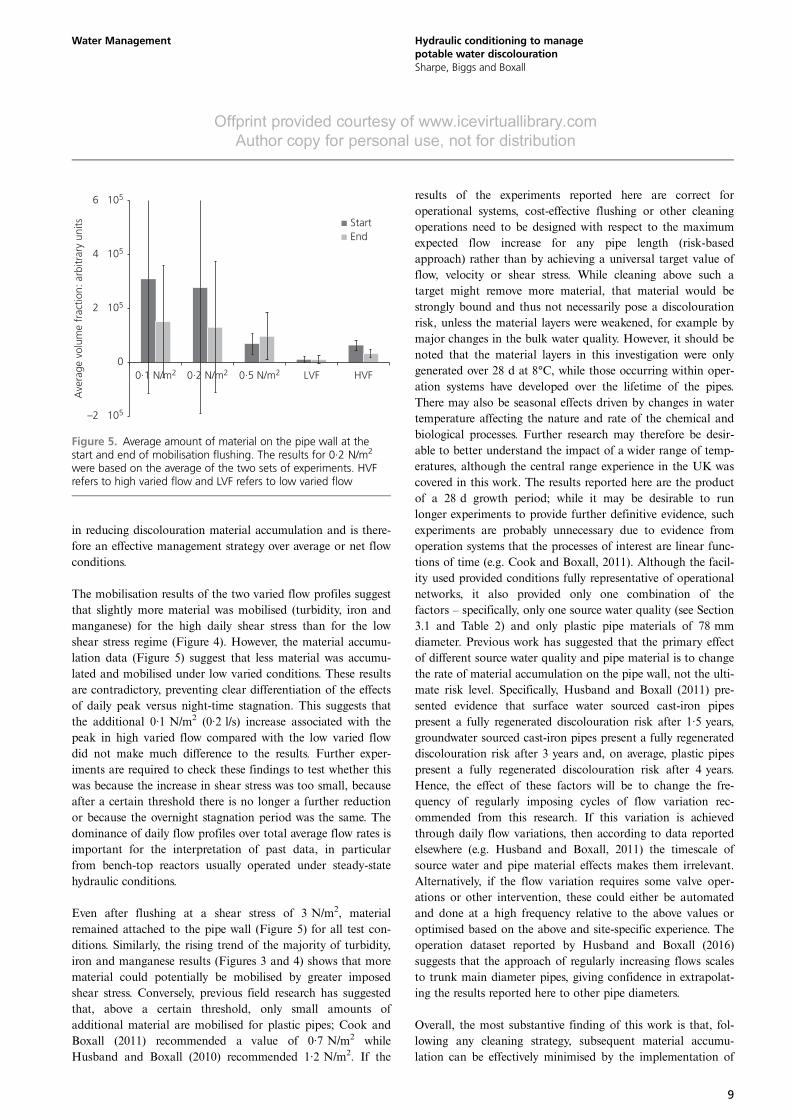
5.2 Pipe wall material resultsOnly just-measurable material was detected on the day zerocoupons, and no difference was found between samples on day28 and the start of flushing. Figure 5 shows the amounts ofmaterial on the coupons at the start and end of the flush pro-gramme for each of the conditioning daily shear stress values.The volume fraction is the amount of three-dimensional spaceoccupied by material for the entire image and is a usefulmeasurement of the overall amount of material per fieldof view.
The error bars on Figure 5 are considerable, with errorsincreasing as a function of average volume, suggesting that thevolume of material was highly spatially heterogeneous. Despitethis, general trends are visible. Initially considering the steady-state experiments, the results show the following trends: thelowest conditioning shear stress generated the highest levels of
material accumulation and subsequent mobilisation, and thehighest shear stress of 0·5 N/m2 produced the least build-upand the smallest error bars. However, the spatial heterogeneitywas such that the start and end flushing at 0·5 N/m2 suggestan increase in material. Comparing the two sets of experimentsreveals significant differences between the steady-state andvaried flow experiments, with more material being accumu-lated and mobilised under steady-state conditions, even whenthe high steady-state flow rate was slightly greater than thepeak in the high varied flow pattern (Figure 2). This corre-sponds with the bulk water data (Figures 3 and 4), whichshowed that more material was mobilised during steady-stateconditions. For the higher steady-state shear stress and thevaried shear stress experiments, the difference between the startand end data was small. More material was seen to accumulateand be mobilised in the high varied flow experiment comparedwith the low varied flow experiment.
6. DiscussionThe results of these highly controlled yet physically fully repre-sentative experiments support the Podds assumptions (Boxallet al., 2001) and previous less-controlled experimental results(Husband et al., 2008) that the accumulation and mobilisationof cohesive layers with variable strength profiles withinDWDSs are responsible for discolouration. This is evident inthe sequential release of material with each increase inimposed boundary shear stress (Figures 3 and 4), rather thanthe threshold release of material when particle self-weight isovercome.
The authors contend that the normal daily hydraulic con-ditions within a pipe have a direct influence on the amount ofmaterial that accumulates on pipe walls within DWDSs andultimately lead to discolouration risk. Under steady-state flowconditions it was observed that the amount of material accu-mulated on the pipe wall (cells) and mobilised (turbidity, ironand manganese) by subsequent flushing is directly related tothe steady-state shear stress, with decreasing amounts ofmaterial with increasing shear stress.
It was also found that variable shear stress profiles were moreeffective at reducing discolouration risk than steady-state shearstress. Variable (daily profile) flow conditions were observed to
Table 2. Water-quality data collected during the accumulation phases (averages based on three replicates per weekly sample (n=12))
Water quality parameter Steady-state tests (mean) Varied state test (mean)WHO standard(Frisbie et al., 2012)
Chlorine: mg/l 0·2 0·1 5Iron: mg/l 0·02 0·03 0·02Manganese: mg/l 0·002 0·005 0·005Turbidity: NTU 0·011 0·019 4 NTU at customers’ taps
1 NTU at water treatment worksConductivity: μS/cm 542 580 2500 μS/cm at 20°CpH 7·4 7·3 6·5–9·5
7
Water Management Hydraulic conditioning to managepotable water discolourationSharpe, Biggs and Boxall
Offprint provided courtesy of www.icevirtuallibrary.comAuthor copy for personal use, not for distribution

reduce the amounts of material accumulated on the pipe wall(Figure 5) and mobilised (Figures 3 and 4) compared withsteady-state conditions for the same total daily flow. Indeed,
the daily profile conditions were observed to supress materialaccumulation to levels below the highest steady-state profile,despite the peak in high varied daily flow being slightly lessthan the steady-state value, and the low varied shear stressbeing significantly less. Thus, despite experiencing a low night-time flow and the same average of 0·2 N/m2 as all the mediumsteady-state experiments, the peak has a substantial influence
0
5
10
15
20
0 0·5 1·0 1·5 2·0 2·5 3·0
Shear stress: N/m²
Nor
mal
ised
mea
n m
anga
nese
: µg/
l
–0·2
0
0·2
0·4
0·6
0 0·5 1·0 1·5 2·0 2·5 3·0
Nor
mal
ised
mea
n tu
rbid
ity: N
TU
Shear stress: N/m²
0·1 N/m² 0·2 N/m² 0·5 N/m²
–25
0
25
50
75
100
125
150
0 0·5 1·0 1·5 2·0 2·5 3·0
Nor
mal
ised
mea
n iro
n: µ
g/l
Shear stress: N/m²
(a)
(b)
(c)
Figure 3. Comparison of normalised mean (a) turbidity, (b) ironand (c) manganese concentrations during the flushing phase forloops conditioned by steady-state hydraulic conditions of 0·1, 0·2and 0·5 N/m2
–0·2
0
0·2
0·4
0·6
0 0·5 1·0 1·5 2·0 2·5 3·0
Nor
mal
ised
mea
n tu
rbid
ity: N
TU
Shear stress: N/m2
LVF 0·2 N/m2 HVF
–50
–25
0
25
50
75
100
125
150
175
0 0·5 1·0 1·5 2·0 2·5 3·0Nor
mal
ised
mea
n iro
n: µ
g/l
Shear stress: N/m2
–5
0
5
10
15
20
0 0·5 1·0 1·5 2·0 2·5 3·0
Nor
mal
ised
mea
n m
anga
nese
: µg/
l
Shear stress: N/m2
(a)
(b)
(c)
Figure 4. Comparison of normalised mean (a) turbidity, (b) ironand (c) manganese concentration during the flushing phase forloops conditioned by low varied, steady-state (0·2 N/m2) and highvaried hydraulic conditions
8
Water Management Hydraulic conditioning to managepotable water discolourationSharpe, Biggs and Boxall
Offprint provided courtesy of www.icevirtuallibrary.comAuthor copy for personal use, not for distribution
in reducing discolouration material accumulation and is there-fore an effective management strategy over average or net flowconditions.
The mobilisation results of the two varied flow profiles suggestthat slightly more material was mobilised (turbidity, iron andmanganese) for the high daily shear stress than for the lowshear stress regime (Figure 4). However, the material accumu-lation data (Figure 5) suggest that less material was accumu-lated and mobilised under low varied conditions. These resultsare contradictory, preventing clear differentiation of the effectsof daily peak versus night-time stagnation. This suggests thatthe additional 0·1 N/m2 (0·2 l/s) increase associated with thepeak in high varied flow compared with the low varied flowdid not make much difference to the results. Further exper-iments are required to check these findings to test whether thiswas because the increase in shear stress was too small, becauseafter a certain threshold there is no longer a further reductionor because the overnight stagnation period was the same. Thedominance of daily flow profiles over total average flow rates isimportant for the interpretation of past data, in particularfrom bench-top reactors usually operated under steady-statehydraulic conditions.
Even after flushing at a shear stress of 3 N/m2, materialremained attached to the pipe wall (Figure 5) for all test con-ditions. Similarly, the rising trend of the majority of turbidity,iron and manganese results (Figures 3 and 4) shows that morematerial could potentially be mobilised by greater imposedshear stress. Conversely, previous field research has suggestedthat, above a certain threshold, only small amounts ofadditional material are mobilised for plastic pipes; Cook andBoxall (2011) recommended a value of 0·7 N/m2 whileHusband and Boxall (2010) recommended 1·2 N/m2. If the
results of the experiments reported here are correct foroperational systems, cost-effective flushing or other cleaningoperations need to be designed with respect to the maximumexpected flow increase for any pipe length (risk-basedapproach) rather than by achieving a universal target value offlow, velocity or shear stress. While cleaning above such atarget might remove more material, that material would bestrongly bound and thus not necessarily pose a discolourationrisk, unless the material layers were weakened, for example bymajor changes in the bulk water quality. However, it should benoted that the material layers in this investigation were onlygenerated over 28 d at 8°C, while those occurring within oper-ation systems have developed over the lifetime of the pipes.There may also be seasonal effects driven by changes in watertemperature affecting the nature and rate of the chemical andbiological processes. Further research may therefore be desir-able to better understand the impact of a wider range of temp-eratures, although the central range experience in the UK wascovered in this work. The results reported here are the productof a 28 d growth period; while it may be desirable to runlonger experiments to provide further definitive evidence, suchexperiments are probably unnecessary due to evidence fromoperation systems that the processes of interest are linear func-tions of time (e.g. Cook and Boxall, 2011). Although the facil-ity used provided conditions fully representative of operationalnetworks, it also provided only one combination of thefactors – specifically, only one source water quality (see Section3.1 and Table 2) and only plastic pipe materials of 78 mmdiameter. Previous work has suggested that the primary effectof different source water quality and pipe material is to changethe rate of material accumulation on the pipe wall, not the ulti-mate risk level. Specifically, Husband and Boxall (2011) pre-sented evidence that surface water sourced cast-iron pipespresent a fully regenerated discolouration risk after 1·5 years,groundwater sourced cast-iron pipes present a fully regenerateddiscolouration risk after 3 years and, on average, plastic pipespresent a fully regenerated discolouration risk after 4 years.Hence, the effect of these factors will be to change the fre-quency of regularly imposing cycles of flow variation rec-ommended from this research. If this variation is achievedthrough daily flow variations, then according to data reportedelsewhere (e.g. Husband and Boxall, 2011) the timescale ofsource water and pipe material effects makes them irrelevant.Alternatively, if the flow variation requires some valve oper-ations or other intervention, these could either be automatedand done at a high frequency relative to the above values oroptimised based on the above and site-specific experience. Theoperation dataset reported by Husband and Boxall (2016)suggests that the approach of regularly increasing flows scalesto trunk main diameter pipes, giving confidence in extrapolat-ing the results reported here to other pipe diameters.
Overall, the most substantive finding of this work is that, fol-lowing any cleaning strategy, subsequent material accumu-lation can be effectively minimised by the implementation of
–2 × 10⁵
0
2 × 10⁵
4 × 10⁵
6 × 10⁵
0·1 N/m2 0·2 N/m2 0·5 N/m2 LVF HVF
Ave
rage
vol
ume
frac
tion:
arb
itrar
y un
its StartEnd
Figure 5. Average amount of material on the pipe wall at thestart and end of mobilisation flushing. The results for 0·2 N/m2
were based on the average of the two sets of experiments. HVFrefers to high varied flow and LVF refers to low varied flow
9
Water Management Hydraulic conditioning to managepotable water discolourationSharpe, Biggs and Boxall
Offprint provided courtesy of www.icevirtuallibrary.comAuthor copy for personal use, not for distribution

regular variations in the conditioning hydraulics, rather thanimplementing net flow increases, and thus the time to the nextcleaning intervention can be extended or even avoided.
7. ConclusionsThis paper has shown the importance of hydraulic conditionsin controlling the accumulation and mobilisation of discolour-ation material within DWDSs. The main findings of this studyare as follows.
There is an inverse relationship between steady-state hydraulicconditions during layer development and the amounts ofmaterial accumulated and mobilised. A daily cycle ofhydraulics was found to have a dominant effect on limiting theaccumulation of discolouration material and its subsequentrelease. The effect of a daily variation in flow (hence boundaryshear stress) was far greater than the effect of the average dailyflow rate. However, the results are inconclusive regarding thedominance of night-time stagnation compared with the magni-tude of the morning peak on material accumulation andrelease.
Flushing at a level up to 3 N/m2 was not sufficient to comple-tely remove all the material accumulated on the pipe wall. Theresearch evidences the importance of hydraulic conditions onin-pipe processes and the need to accurately recreate these forfindings to have practical value; specifically, future studiesshould include demand-driven flow patterns as a key variable.The results from this study can be used to usefully informthose responsible for the operation and management ofDWDSs to reduce discolouration risk. Firstly, control strat-egies that regularly impose flow variation cycles limit dis-colouration risk (in particular limiting accumulation) moreeffectively than increasing total average flow rates. Secondly,flushing only removes material up to the force imposed; ifincreases above the flush rate occur, further discolouration willresult (even in plastic pipes) and hence flushing or other clean-ing operations should be designed for the greatest flow rateexpected for the pipe length, rather than for the unrealisticexpectation of entirely clean pipes.
AcknowledgementsThis research was conducted within the Pipe Dreams project,supported by the UK Engineering and Physical SciencesResearch Council (Challenging Engineering: EP/G029946/1)and the Pennine Water Group EPSRC Platform Grant(EP/1029346/1).
REFERENCESAbe Y, Polyakov P, Skali-Lami S and Francius G (2011) Elasticity and
physico-chemical properties during drinking water biofilmformation. Biofouling 27(7): 739–750.
Abe Y, Skali-Lami S, Block JC and Francius G (2012) Cohesiveness andhydrodynamic properties of young drinking water biofilms. WaterResearch 46(4): 1155–1166.
Batte M, Koudjonou B, Laurent P et al. (2003) Biofilm responses toageing and to a high phosphate load in a bench-scale drinkingwater system. Water Research 37(6): 1351–1361.
Block JC (1992) Biofilms in drinking water distribution systems.In Biofilms – Science and Technology (Melo LF, Bott TR,Fletcher M and Capdeville B (eds)). Springer, Dordrecht,the Netherlands, NATO ASI Series (Series E: Applied Sciences)vol. 223, pp. 469–485.
Blokker EJM, Vreeburg JHG, Schaap PG and van Dijk JC (2010) The self-cleaning velocity in practice. In Proceedings of Water DistributionSystems Analysis Conference, Tucson, AZ, USA, pp. 187–199.
Boxall JB and Prince RA (2006) Modelling discolouration in aMelbourne (Australia) potable water distribution system. Journalof Water Supply: Research and Technology – AQUA 55(3): 207–219.
Boxall JB, Skipworth PJ and Saul AJ (2001) A novel approach tomodelling sediment movement in distribution mains based onparticle characteristics. Proceedings of Computing and Control inthe Water Industry Conference, Water Software Systems: Theoryand Applications, Leicester, UK.
Bristol Water (2008) Drinking Water Quality – The StandardsExplained. Bristol Water, Bristol, UK. See http://www.bristolwater.co.uk/pdf/environment/wqReport08.pdf (accessed 24/11/2015).
Cook D (2010) Why Discolouration is not a Colourful Sight. See http://www.waterworld.com/articles/wwi/print/volume-25/issue-5/editorial-focus/water-management/why-discolouration-is-not-a-colourful.html (accessed 2/10/2017).
Cook DM and Boxall JB (2011) Discoloration material accumulation inwater distribution systems. Journal of Pipeline Systems Engineeringand Practice 2(4): 113–122.
Deines P, Sekar R, Husband PS et al. (2010) A new coupon design forsimultaneous analysis of in situ microbial biofilm formation andcommunity structure in drinking water distribution systems.Applied Microbiology and Biotechnology 87(2): 749–756.
Donlan RM (2002) Biofilms: microbial life on surfaces. EmergingInfectious Diseases 8(9): 881–899.
Douterelo I, Sharpe R and Boxall J (2014) Bacterial communitydynamics during the early stages of biofilm formation in achlorinated experimental drinking water distribution system:implications for drinking water discolouration. Journal of AppliedMicrobiology 117(1): 286–301.
DWI (Drinking Water Inspectorate) (2000) Water, England and Wales:The Water Supply (Water Quality) Regulations 2000 No. 3184.DWI, London, UK. See http://www.legislation.gov.uk/uksi/2000/3184/contents/made (accessed 24/11/2015).
Fish KE, Collins R, Green NH et al. (2015) Characterisation of thephysical composition and microbial community structure ofbiofilms within a model full-scale drinking water distributionsystem. PLoS One 10(2): e0115824.
Flemming HC (2002) Biofouling in water systems – cases, causes,countermeasures. Applied Environmental Biotechnology 59(6):629–640.
Fox S, Shepherd W, Collins R and Boxall J (2015) Experimentalquantification of contaminant ingress into a buried leakingpipe during transient events. Journal of Hydraulic Engineering142(1): 04015036.
Frisbie SH, Mitchell EJ, Dustin H, Maynard DM and Sarkar B (2012)World Health Organization discontinues its drinking-waterguideline for manganese. Environmental Health Perspectives120(6): 775.
Husband S and Boxall JB (2010) Field studies of discoloration inwater distribution systems: model verification and practicalimplications. Journal of Environmental Engineering 136(1):86–94.
Husband PS and Boxall JB (2011) Asset deterioration and discolourationin water distribution systems. Water Research 45(1): 113–124.
10
Water Management Hydraulic conditioning to managepotable water discolourationSharpe, Biggs and Boxall
Offprint provided courtesy of www.icevirtuallibrary.comAuthor copy for personal use, not for distribution

Husband PS and Boxall JB (2016) Understanding and managingdiscolouration risk in trunk mains. Water Research 107: 127–140,https://doi.org/10.1016/j.watres.2016.10.049.
Husband PS, Boxall JB and Saul AJ (2008) Laboratory studiesinvestigating the processes leading to discolouration in waterdistribution networks. Water Research 42(16): 4309–4318.
Kharazmi A, Giwercman B and Høiby N (1999) Robbins device in biofilmresearch. Methods in Enzymology 3(10): 207–215.
Lehtola MJ, Miettinen IT and Martikainen PJ (2005) Microbiologicalquality control in distribution systems. Water Encyclopedia 2:243–247.
Luo X, Jellison KL, Huynh K and Widmer G (2015) Impact of bioreactorenvironment and recovery method on the profile of bacterialpopulations from water distribution systems. PLoS One 10(7):e0133427.
Martiny AC, Jørgensen TM, Albrechtsen H, Arvin E and Molin S (2003)Long-term succession of structure and diversity of a biofilmformed in a model drinking water distribution system. Applied andEnvironmental Microbiology 69(11): 6899–6907.
McSwain BS, Irvine RL, Hausner M and Wilderer PA (2005) Compositionand distribution of extracellular polymeric substances in aerobicflocs and granular sludge. Applied and Environmental Microbiology71(2): 1051–1057.
Murga R, Forster TS, Brown E et al. (2001) Role of biofilms in thesurvival of Legionella pneumophila in a model potable-watersystem. Microbiology 147(11): 3121–3126.
Seth A, Bachmann R, Boxall J, Saul A and Edyvean R (2004)Characterisation of materials causing discolourationin potable water systems. Water Science and Technology 49(2):27–32.
Schwartz T, Hoffmann S and Obst U (1998) Formation and bacterialcomposition of young natural biofilms obtained from publicbank-filtered drinking water systems. Water Research 32(9):2787–2797.
Smith SE, Ta T., Holt DM et al. (1999) A pipeline testing facility for theexamination of pipe wall deposits and red-water events in drinkingwater. Journal of the Chartered Institution of Water andEnvironmental Management 13(1): 7–15.
UKWIR (UK Water Industry Research) (2003) National Database of MainsFailures 2003. UKWIR, London, UK, Report No. Z3/3G/05/7.
Van Den Boomen M, Van Mazijk A and Beuken RHS (2004) Firstevaluation of new water design concepts for self-cleaningdistribution networks. Journal of Water Supply: Researchand Technology – AQUA 53(1): 43–50.
Vreeburg JHG and Boxall JB (2007) Discolouration in potable waterdistribution systems: a review. Water Research 41(3): 519–529.
How can you contribute?
To discuss this paper, please email up to 500 words to theeditor at [email protected]. Your contribution will beforwarded to the author(s) for a reply and, if consideredappropriate by the editorial board, it will be published asdiscussion in a future issue of the journal.
Proceedings journals rely entirely on contributions from thecivil engineering profession (and allied disciplines).Information about how to submit your paper onlineis available at www.icevirtuallibrary.com/page/authors,where you will also find detailed author guidelines.
11
Water Management Hydraulic conditioning to managepotable water discolourationSharpe, Biggs and Boxall
Offprint provided courtesy of www.icevirtuallibrary.comAuthor copy for personal use, not for distribution