hydraulic fracturing experiments to investigate
TRANSCRIPT
Scholars' Mine Scholars' Mine
Masters Theses Student Theses and Dissertations
Summer 2012
Hydraulic fracturing experiments to investigate circulation losses Hydraulic fracturing experiments to investigate circulation losses
Maximiliano Liberman
Follow this and additional works at: https://scholarsmine.mst.edu/masters_theses
Part of the Petroleum Engineering Commons
Department: Department:
Recommended Citation Recommended Citation Liberman, Maximiliano, "Hydraulic fracturing experiments to investigate circulation losses" (2012). Masters Theses. 6902. https://scholarsmine.mst.edu/masters_theses/6902
This thesis is brought to you by Scholars' Mine, a service of the Missouri S&T Library and Learning Resources. This work is protected by U. S. Copyright Law. Unauthorized use including reproduction for redistribution requires the permission of the copyright holder. For more information, please contact [email protected].

i

i
HYDRAULIC FRACTURING EXPERIMENTS TO INVESTIGATE CIRCULATION
LOSSES
by
MAXIMILIANO LIBERMAN
A THESIS
Presented to the Faculty of Graduate School of the
MISSOURI UNIVERSITY OF SCIENCE AND TECHNOLOGY
In Partial Fulfillment of the Requirements for the Degree
MASTER OF SCIENCE IN PETROLEUM ENGINEERING
2012
Approved by
Dr. Runar Nygaard, Advisor
Dr. Ralph Flori
Dr. Baojun Bai

ii
iii
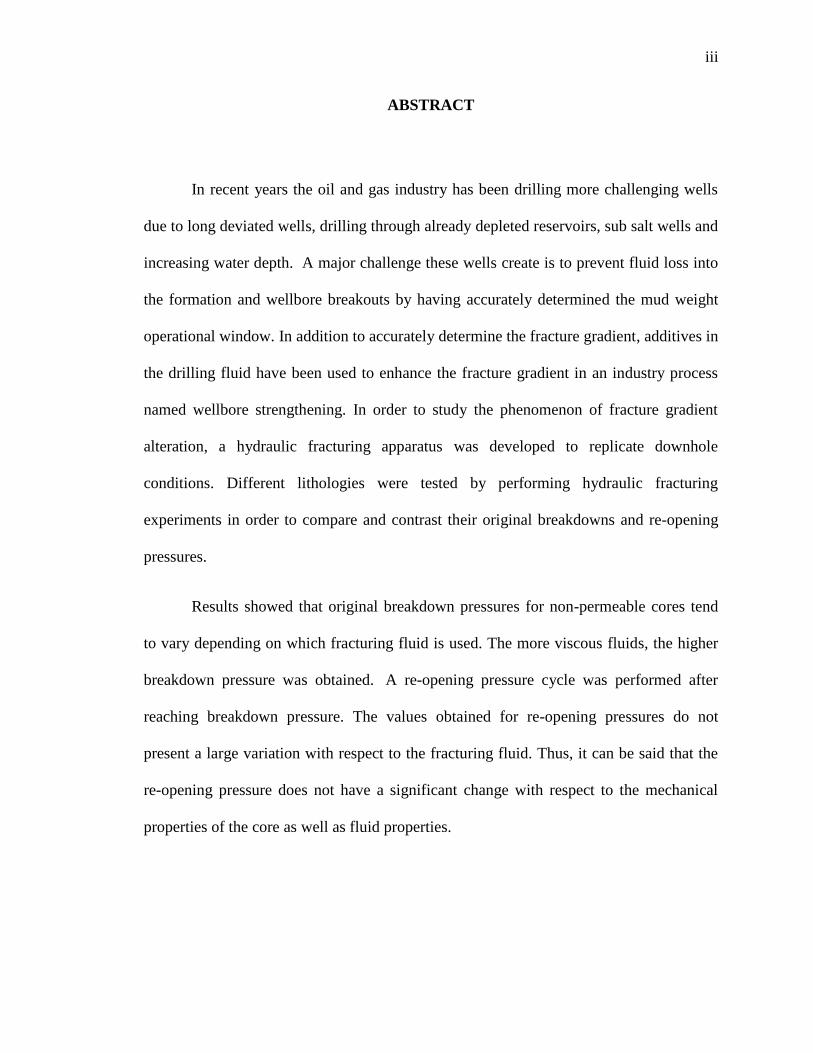
ABSTRACT
In recent years the oil and gas industry has been drilling more challenging wells
due to long deviated wells, drilling through already depleted reservoirs, sub salt wells and
increasing water depth. A major challenge these wells create is to prevent fluid loss into
the formation and wellbore breakouts by having accurately determined the mud weight
operational window. In addition to accurately determine the fracture gradient, additives in
the drilling fluid have been used to enhance the fracture gradient in an industry process
named wellbore strengthening. In order to study the phenomenon of fracture gradient
alteration, a hydraulic fracturing apparatus was developed to replicate downhole
conditions. Different lithologies were tested by performing hydraulic fracturing
experiments in order to compare and contrast their original breakdowns and re-opening
pressures.
Results showed that original breakdown pressures for non-permeable cores tend
to vary depending on which fracturing fluid is used. The more viscous fluids, the higher
breakdown pressure was obtained. A re-opening pressure cycle was performed after
reaching breakdown pressure. The values obtained for re-opening pressures do not
present a large variation with respect to the fracturing fluid. Thus, it can be said that the
re-opening pressure does not have a significant change with respect to the mechanical
properties of the core as well as fluid properties.
iv
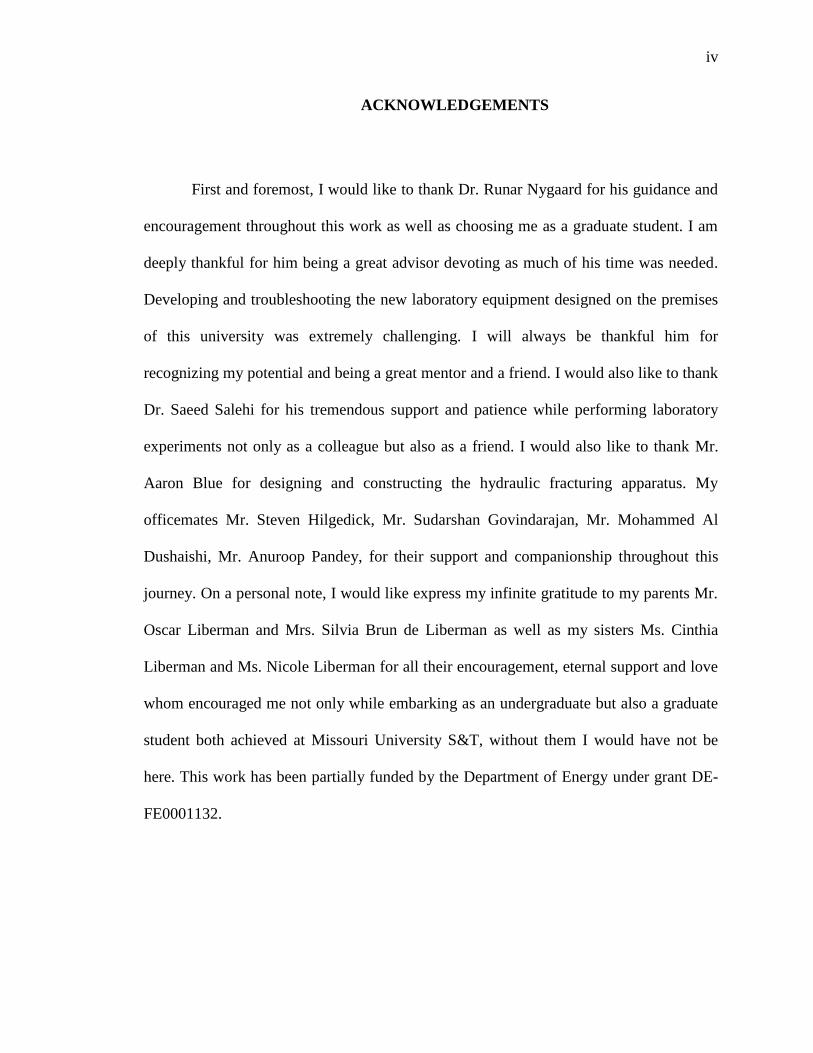
ACKNOWLEDGEMENTS
First and foremost, I would like to thank Dr. Runar Nygaard for his guidance and
encouragement throughout this work as well as choosing me as a graduate student. I am
deeply thankful for him being a great advisor devoting as much of his time was needed.
Developing and troubleshooting the new laboratory equipment designed on the premises
of this university was extremely challenging. I will always be thankful him for
recognizing my potential and being a great mentor and a friend. I would also like to thank
Dr. Saeed Salehi for his tremendous support and patience while performing laboratory
experiments not only as a colleague but also as a friend. I would also like to thank Mr.
Aaron Blue for designing and constructing the hydraulic fracturing apparatus. My
officemates Mr. Steven Hilgedick, Mr. Sudarshan Govindarajan, Mr. Mohammed Al
Dushaishi, Mr. Anuroop Pandey, for their support and companionship throughout this
journey. On a personal note, I would like express my infinite gratitude to my parents Mr.
Oscar Liberman and Mrs. Silvia Brun de Liberman as well as my sisters Ms. Cinthia
Liberman and Ms. Nicole Liberman for all their encouragement, eternal support and love
whom encouraged me not only while embarking as an undergraduate but also a graduate
student both achieved at Missouri University S&T, without them I would have not be
here. This work has been partially funded by the Department of Energy under grant DE-
FE0001132.

v
TABLE OF CONTENTS
Page
ABSTRACT ....................................................................................................................... iii
ACKNOWLEDGEMENTS ............................................................................................... iv
LIST OF ILLUSTRATIONS ........................................................................................... viii
LIST OF TABLES .............................................................................................................. x
NOMENCLATURE ......................................................................................................... xi
SECTION
1. INTRODUCTION .......................................................................................................... 1
1.1. FRACTURE GRADIENT IN DRILLING – FLUID LOSS .................................... 2
1.2. FIELD METHODS TO DETERMINE FRACTURE GRADIENT ........................ 4
1.3. WELLBORE STRENGTHENING .......................................................................... 6
1.4. RESEARCH OBJECTIVE ....................................................................................... 8
2. LITERATURE REVIEW OF WELLBORE FRACTURING ...................................... 10
2.1. THEORETICAL MODEL OF WELLBORE FRACTURING .............................. 10
2.1.1 Kirsch Solution. ................................................................................................ 10
2.1.2. Eaton’s Equation.............................................................................................. 17
2.1.3. Elasto-Plastic Model. ....................................................................................... 18
2.1.4. Fracture Resistance Model Based on Non-Invaded Zone. .............................. 20
2.2. HYDRAULIC FRACTURE EXPERIMENTS ...................................................... 21
2.2.1. DEA – 13 Fracturing Experiments. ................................................................. 21
2.2.2. GPRI Joint Industry Project Experiments (JIP) ............................................... 22

vi
2.2.3. Concrete Experiments ...................................................................................... 23
2.2.4. M-I Swaco Experiments. ................................................................................. 25
2.3. SUMMARY AND CRITICAL REVIEW OF THE LITERATURE ..................... 26
3. EXPERIMENTAL METHODOLOGY ........................................................................ 28
3.1. EXPERIMENTAL SET UP ................................................................................... 28
3.1.1. Pump System and Fluid Distribution............................................................... 30
3.1.2. Accumulator. ................................................................................................... 30
3.1.3. Hydraulic Piston. ............................................................................................. 31
3.1.4. In-line Pressure Regulator ............................................................................... 32
3.1.5. Rubber Sleeve .................................................................................................. 33
3.1.6. Stainless Steel Cylinder ................................................................................... 33
3.1.7. All Thread Rods............................................................................................... 33
3.1.8. Bottom Flange ................................................................................................. 33
3.1.9. Top Flange ....................................................................................................... 34
3.1.10. Hydraulic Fracturing Apparatus Frame. ........................................................ 35
3.1.11. Hydraulic Fracturing Apparatus .................................................................... 36
3.1.12. Data Acquisition. ........................................................................................... 36
3.2. CORE PREPARATION ......................................................................................... 37
3.3. EXPERIMENTAL PROCEDURE ........................................................................ 38
3.4. TESTING PROGRAM .......................................................................................... 40
4. RESULTS ..................................................................................................................... 42
4.1. TEST # 1 DOLOMITE FRACTURED WITH WATER ....................................... 42
vii
4.2. TEST # 2 DOLOMITE FRACTURED WITH 8% BENTONITE MUD .............. 44
4.3. TEST # 3 DOLOMITE FRACTURED WITH COLORED WATER ................... 45
4.4. TEST # 4 ROUBIDOUX SANDSTONE FRACTURED WITH 8% .................... 48
4.5. TEST # 5 CONCRETE CORE FRACTURED WITH 4%
BENTONITE MUD ............................................................................................... 50
4.6. TEST # 6 CONCRETE CORE FRACTURED WITH 6%
BENTONITE MUD ............................................................................................... 51
4.7. TEST # 7 CONCRETE CORE FRACTURED WITH 6%
BENTONITE – CMC MUD .................................................................................. 53
4.8. TEST # 8 CONCRETE CORE FRACTURED WITH 6%
BENTONITE – CMC ............................................................................................. 56
5. DISCUSSION ............................................................................................................... 59
5.1. INITIAL SET UP OF EXPERIMENTS ................................................................ 59
5.2. CONCRETE CORE EXPERIMENTS ................................................................... 62
5.3. KIRSCH SOLUTION VALIDATION .................................................................. 65
5.4. EVAULATION OF RESULTS WITH PREVIOUS CONDUCTED TESTS ....... 66
6. CONCLUSIONS ........................................................................................................... 68
7. RECOMMENDED FUTURE WORK ......................................................................... 70
7.1 EQUIPMENT ENHANCEMENT .......................................................................... 71
APPENDICES .................................................................................................................. 72
A. FRACTURE PICTURES AFTER CORE HAS BEEN TESTED ............................ 72
B. PRESSURE CELL ASSEMBLY AND EXPERIMENTAL SETUP
CHECK LIST............................................................................................................. 75
C. HYDRAULIC FRACTURING APPARATUS – PRESSURE RATING................. 80
BIBLIOGRAPHY ............................................................................................................. 83
VITA ................................................................................................................................. 86

viii
LIST OF ILLUSTRATIONS
Figure Page
Figure 1.1. Examples of Pore and Fracture Pressure Gradient Reduction.......................... 3
Figure 1.2. Leakoff Test from Southern North Sea ............................................................ 5
Figure 1.3. ELOT from Southern North Sea....................................................................... 5
Figure 2.1. An Arbitrary Oriented Wellbore Under In-situ Stress System ....................... 11
Figure 2.2. Schematic of Near Wellbore Stresses and Wellbore Failure Mechanisms .... 16
Figure 2.3. Schematic of Wellbore Wall Assuming Plastic Zone .................................... 18
Figure 2.4. Invaded and Non-Invaded Zones for a Fracture in Normal Fault
Environment .................................................................................................... 21
Figure 2.5. Berea Sandstone Core..................................................................................... 22
Figure 3.1. Hydraulic Fracturing System Schematic ........................................................ 29
Figure 3.2. Mud Accumulator System .............................................................................. 31
Figure 3.3. Overburden Piston .......................................................................................... 32
Figure 3.4. Bleed-Off Valve ............................................................................................. 32
Figure 3.5. Bottom Flange ................................................................................................ 34
Figure 3.6. Top Flange ...................................................................................................... 34
Figure 3.7. Hydraulic Fracturing Apparatus ..................................................................... 35
Figure 4.1. Dolomite Core Test 1 before testing .............................................................. 43
Figure 4.2. Original Breakdown Pressure Test 1 .............................................................. 44
Figure 4.3. Dolomite Core Test 2 ..................................................................................... 46
Figure 4.4. Original Breakdown and Re-Opening Pressure Test 2 ................................... 47
Figure 4.5. Dolomite Core Test 3 before testing .............................................................. 47
Figure 4.6. Original Breakdown Test 3 ............................................................................ 48

ix
Figure 4.7. Roubidoux Sandstone Core Test 4 ................................................................ 49
Figure 4.8. Roubidoux Sandstone Fracture Pressure Test 4 ............................................. 50
Figure 4.9. Concrete Core Test 5 ...................................................................................... 52
Figure 4.10. Original Breakdown and Re-opening Pressure Test 5 ................................. 53
Figure 4.11. Concrete Core Test 6 .................................................................................... 54
Figure 4.12. Original Breakdown and Re-opening Pressure Test 6 ................................. 55
Figure 4.13. Concrete Core Test 7 .................................................................................... 55
Figure 4.14. Original Breakdown and Re-opening Pressure Test 7 ................................. 56
Figure 4.15. Concrete Core Test 8 .................................................................................... 57
Figure 4.16. Original Breakdown and Re-opening Pressure Test 8 ................................. 58
Figure 5.1. A Comparison of Non-Permeable Cores (Dolomite) With and
Without Intact Boreholes ................................................................................ 61
Figure 5.2. A Comparison of Permeable vs. Non-Permeable Cores for 8%
Bentonite Mud ................................................................................................ 62
Figure 5.3. A Comparison Non-Permeable Cores (concrete) for 4 & 6 %
Bentonite Mud ................................................................................................ 64
Figure 5.4. A Comparison of Non-Permeable Cores (concrete) for 6%
Bentonite Mud with and Without Additives ................................................... 64
x
LIST OF TABLES
Table Page
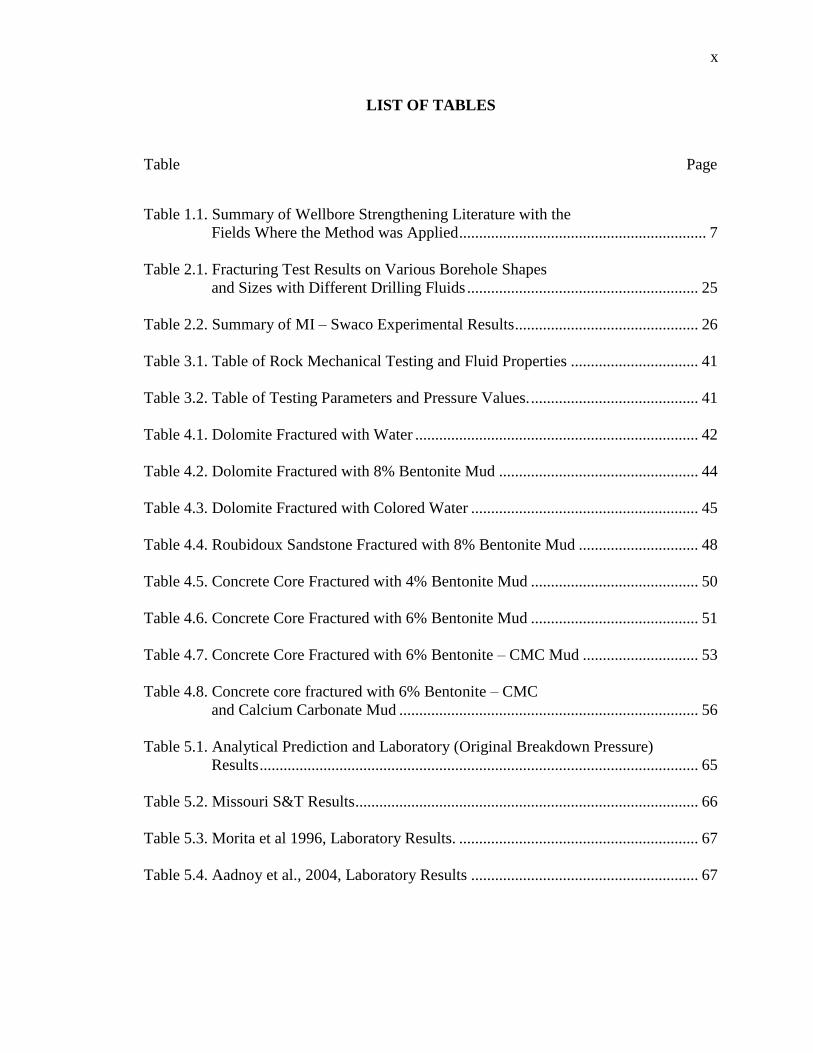
Table 1.1. Summary of Wellbore Strengthening Literature with the
Fields Where the Method was Applied .............................................................. 7
Table 2.1. Fracturing Test Results on Various Borehole Shapes
and Sizes with Different Drilling Fluids .......................................................... 25
Table 2.2. Summary of MI – Swaco Experimental Results .............................................. 26
Table 3.1. Table of Rock Mechanical Testing and Fluid Properties ................................ 41
Table 3.2. Table of Testing Parameters and Pressure Values. .......................................... 41
Table 4.1. Dolomite Fractured with Water ....................................................................... 42
Table 4.2. Dolomite Fractured with 8% Bentonite Mud .................................................. 44
Table 4.3. Dolomite Fractured with Colored Water ......................................................... 45
Table 4.4. Roubidoux Sandstone Fractured with 8% Bentonite Mud .............................. 48
Table 4.5. Concrete Core Fractured with 4% Bentonite Mud .......................................... 50
Table 4.6. Concrete Core Fractured with 6% Bentonite Mud .......................................... 51
Table 4.7. Concrete Core Fractured with 6% Bentonite – CMC Mud ............................. 53
Table 4.8. Concrete core fractured with 6% Bentonite – CMC
and Calcium Carbonate Mud ........................................................................... 56
Table 5.1. Analytical Prediction and Laboratory (Original Breakdown Pressure)
Results .............................................................................................................. 65
Table 5.2. Missouri S&T Results ...................................................................................... 66
Table 5.3. Morita et al 1996, Laboratory Results. ............................................................ 67
Table 5.4. Aadnoy et al., 2004, Laboratory Results ......................................................... 67
xi
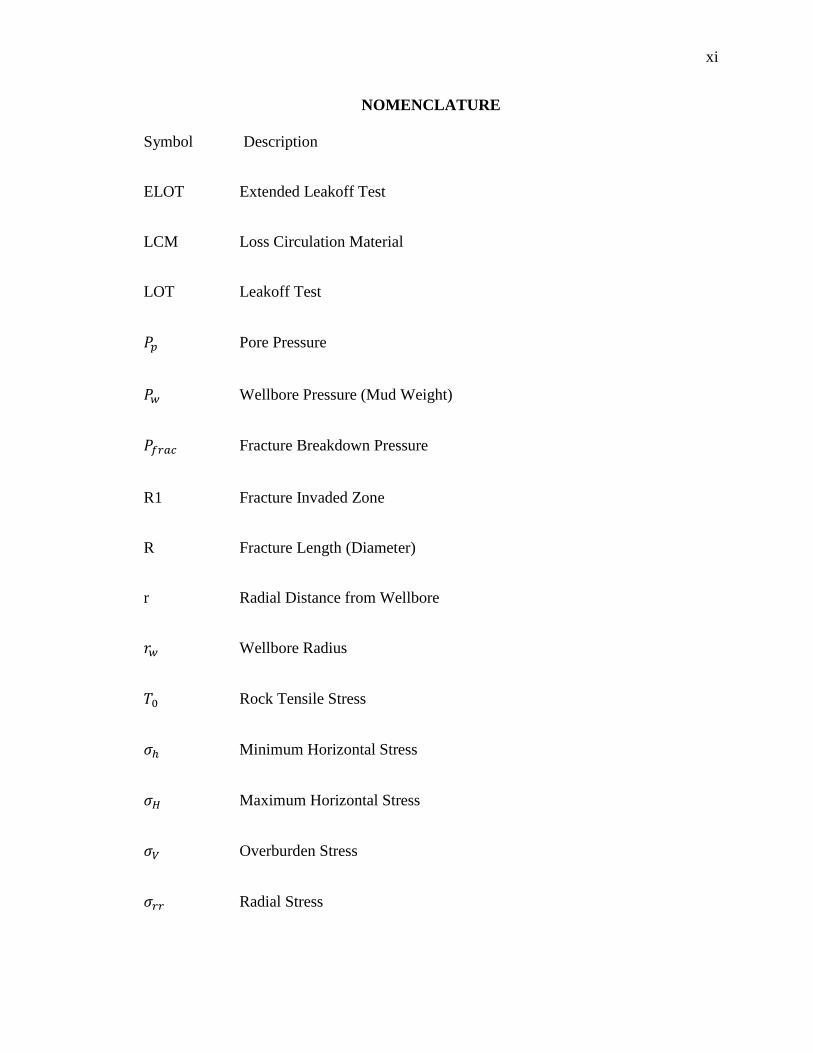
NOMENCLATURE
Symbol Description
ELOT Extended Leakoff Test
LCM Loss Circulation Material
LOT Leakoff Test
Pore Pressure
Wellbore Pressure (Mud Weight)
Fracture Breakdown Pressure
R1 Fracture Invaded Zone
R Fracture Length (Diameter)
r Radial Distance from Wellbore
Wellbore Radius
Rock Tensile Stress
Minimum Horizontal Stress
Maximum Horizontal Stress
Overburden Stress
Radial Stress

xii
Hoop Stress or Tangential Stress
Vertical Stress at Wellbore Wall in Cylindrical Coordinates
Normal Stress at Wellbore Wall in x Direction in Cartesian Coordinates
Normal Stress at Wellbore Wall in y Direction in Cartesian Coordinates
Normal Stress at Wellbore Wall in z Direction in Cartesian Coordinates
Shear Stress at Wellbore Wall in Cartesian Coordinates
Shear Stress at Wellbore Wall in Cylindrical Coordinates
Angle of borehole Circumference Measured from Max Horizontal Stress
Direction
Sealing Efficiency Factor
Poisson’s Ratio

1
1. INTRODUCTION
To meet the demand for continuous growth in oil and gas production more
challenging wells are drilled. Wells are drilled at deeper water depth, with longer
horizontal reach, and with multilateral wells drilled out from one mother bore.
Geomechanics plays a key role in drilling plans and the casing design of these complex
wells. Reducing drilling costs and improving drilling performance have become a priority
for the industry when planning these complex wells; however major obstacles are
contributing to increasing expenditures and complexity. The first category of obstacles,
which is not controllable, is governed by the complex geologic environment present at
the time of performing drilling operations, like large scale geology features such as faults
and salt diapirs near wellbore which could induce wellbore stability problems if not
planned for. The second major obstacle present in drilling operations pertains to wellbore
collapse or fluid kick due to low mud weight. The third category of obstacles is fluid
losses into the formation due to high mud weight with potential stuck pipe and loss of
well integrity as a result. These possible scenarios, where the mud weight has been
designed incorrectly, it could ultimately yield not only to get stuck with the drill stem and
lose portion of the equipment requiring a sidetrack but create very hazardous conditions
if the lost circulation turn into a kick or a blow out. Thus, having a better understanding
of the process of mud weight and mud weight operational window is the key factor to
achieve lower drilling operation costs as well as creating a higher HSE standard.

2
1.1. FRACTURE GRADIENT IN DRILLING – FLUID LOSS
There are several mechanisms that can delay or cause serious drilling issues but
lost circulation caused by tensile failure is the most common phenomenon present
(Aadnoy and Chenevert, 1987) especially in highly deviated wellbores, depleted
formations and also in deep offshore basins (Figure 1.1). These scenarios are prone to
exhibit reduction in the fracture gradient which narrows the operational mud weight
window between pore and fracture pressure, a pivotal feature of drilling design. When the
water depth increase in deep offshore basins the total overburden density naturally
decreases as the water depth increases, as water is making up for more of the overburden.
A reduction in overburden stress results directly in decreased formation fracture gradient
for a sedimentary basin with no tectonic stresses (Aadnoy and Chenevert, 1987).

3
Figure 1.1. Examples of Pore and Fracture Pressure Gradient Reduction
As shown on figure 1.1, fracture gradient decreases for a deviated wellbore. This
phenomenon has been explained by Aadnoy and Chenevert, 1987, stating that for
deviated well bores, the fracture gradient ( can be estimated by both the
vertical fracture gradient ( and the wellbore inclination ( . This particular
case assumes isotropic stresses as well as drilling along the minimum horizontal stress
direction. Another scenario shown on the same figure is the one of drilling through a
depleted formation. During production the reservoir pressure is depleted and the fracture
gradient is reduced as a consequence (Economides, 1993). The reduction of pore pressure
results in a directly reduction of formation total stresses as well. To avoid mud losses in
4
the reservoir the mud weight has to be lowered in the reservoir. But the shale section
which could be present above or below the depleted zone would not be depleted, thus its
pore pressure still remains in it and this formation will require higher mud weight which
resulting in high risk for lost circulation in the reservoir. In addition to the scenarios of
reduced fracture gradients mentioned above, existing fractures in the formation can also
reduce the fracture gradient.
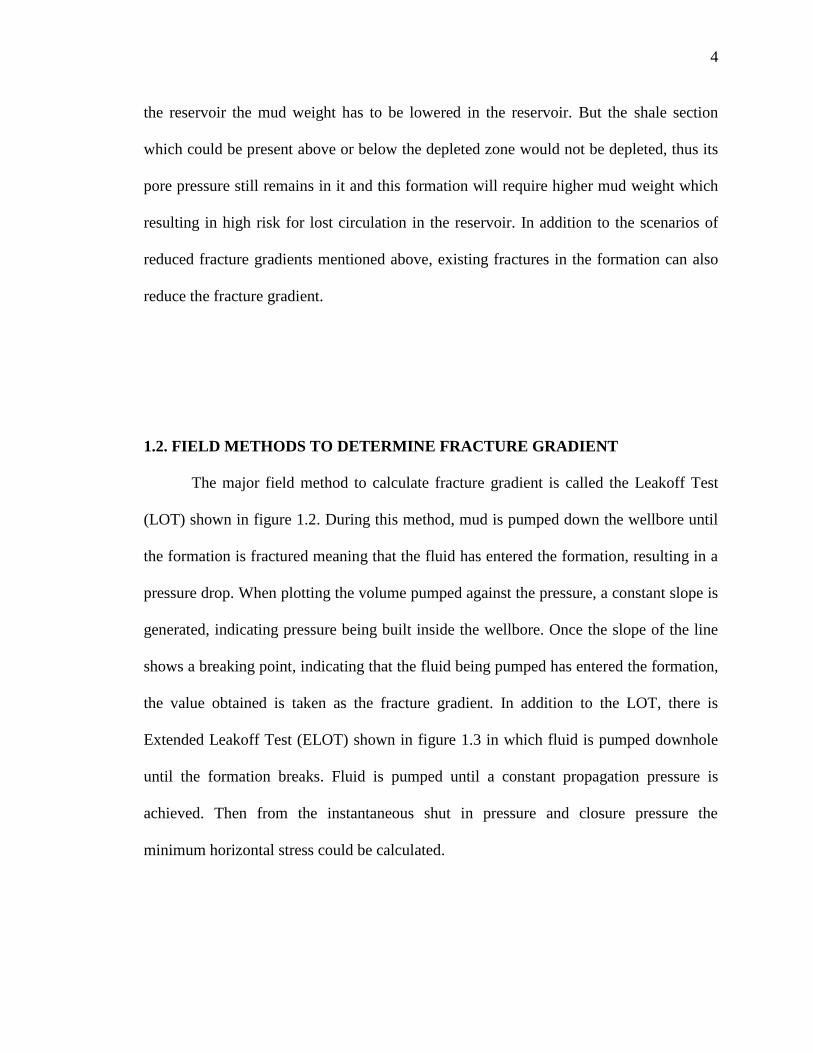
1.2. FIELD METHODS TO DETERMINE FRACTURE GRADIENT
The major field method to calculate fracture gradient is called the Leakoff Test
(LOT) shown in figure 1.2. During this method, mud is pumped down the wellbore until
the formation is fractured meaning that the fluid has entered the formation, resulting in a
pressure drop. When plotting the volume pumped against the pressure, a constant slope is
generated, indicating pressure being built inside the wellbore. Once the slope of the line
shows a breaking point, indicating that the fluid being pumped has entered the formation,
the value obtained is taken as the fracture gradient. In addition to the LOT, there is
Extended Leakoff Test (ELOT) shown in figure 1.3 in which fluid is pumped downhole
until the formation breaks. Fluid is pumped until a constant propagation pressure is
achieved. Then from the instantaneous shut in pressure and closure pressure the
minimum horizontal stress could be calculated.

5
Figure 1.2. Leakoff Test from Southern North Sea (Salehi., 2012)
Figure 1.3. ELOT from Southern North Sea (Okeland et al., 2002)

6
1.3. WELLBORE STRENGTHENING
Wellbore strengthening is loosely defined as the various methods applied during
drilling operations to enhance the fracture gradient when the integrity of the wellbore
wall has been compromised either with naturally occurring fractures or wells where the
formations have been depleted. These scenarios, as explained earlier, create a narrow
operational mud weight window which becomes a complex phenomenon to control. The
major drawback to such event is the cost related to fluid loss, kicks control, wellbore
collapse and sometimes, loss of the entire wellbore. Thus, in order to prevent such events,
different technologies and methodologies have been proposed to enhance the fracture
gradient (Table 1.1). The ultimate goal of wellbore strengthening is to seal off the natural
occurring fractures or any porosity from depleted formations in order to prevent fluid loss
or wellbore collapse. To prevent these undesired events, the use of different loss
circulation material (LCM) is encouraged, such as calcium carbonate, gels or other
additives (Morita et al, 1996). To address this problem, mixing these LCM’s together
with water based mud will yield improve the issue mentioned earlier.
There are several wellbore strengthening theories which describe the physical
mechanisms involved in the fracture gradient enhancement. Table 1.1 summarizes the
different methodologies for wellbore strengthening and the mechanism involved, material
type and strength to be used plus the necessity for tip isolation.
Several important questions about fracturing a wellbore are still not answered.
First, to what extend are we able to change the near wellbore stresses of the rock, or are
we just healing the fractures and not necessarily altering the rock stress? Second, how
important are mud properties and mud additive properties such as material size, type, and

7
strength? As discussed above, some results support that the technique is successful only
when specially selected size materials are used. Some others report successful field
applications regardless of material properties. For instance, different materials system,
forming gels by cross-linked polymers (Aston et al., 2007), calcium carbonates (Alberty
and Mclean, 2004; Fuh et al., 2007), DVCS sealant (Traugott et al., 2007; Wang et al.,
2008), DSF (Drill and Stress Fluid) water-based systems (Dupriest et al., 2008) to
materials with higher mechanical strength (Aadnoy et al., 2008) were reported for
wellbore strengthening applications. Although some authors (Aadnoy et al., 2008)
reported poor experimental results using calcium carbonate and polymer based mud
systems, successful field applications with significant increase of fracture gradient were
reported when these materials were used in the mud system (Fuh et al., 2007; Aston et al.,
2007).
Table 1.1. Summary of Wellbore Strengthening Literature with the Fields Where the
Method was Applied (modified from Salehi, 2012).
Author Materials Material
Size
Material
Strength
Tip
Isolation
Rock
Stress
Method Field
Applications
Fuh et al.,
1992 LPM Important
Selected
Strength Required
Not
Changing
Fracture
Pressure
Inhibitor
California
(Ventura)/
Oklahoma
(Newkirk)
Alberty
and
McLean,
2004
Calcium
Carbonate Important Important
Not
Required Changing
Stress Cage
(SC) Gulf of Mexico
Dupriest,
2008 DSF Unimportant Unimportant Required Changing
Fracture
Closure
Stress(FCS)
Malaysia
(Jerneh field)/
East Texas
(Trawick field)
Wang et
al., 2007a,
2007b
DVCS Important Important
Changing Stress Cage
(SC)
Gulf of Mexico/
South Texas

8
Table 1.1. Summary of Wellbore Strengthening Literature with the Fields where the
Method was applied (cont.).
Van Oort
et al., 2009 Important Unimportant Required
Not
Changing
Fracture
Propagation
Resistance
(FPR)
Gulf of Mexico
Aadnoy
and
Belayneh,
2008
High
Strength
Materials
Important Very
Important
Not
Changing
Fracture
Healing
North Sea
1.4. RESEARCH OBJECTIVE
There are several competing theories regarding how to increase the fracture
gradient and there are several analytic and numerical methods to calculate the fracture
gradient. However these methods do not include the change in fracture gradient based on
drilling fluid types. Using loss circulation materials (LCM) to prevent fluid losses and
strengthen the wellbore is the primary method employed by the vast majority of the
industry to prevent fluid loss as well as other wellbore related issues, while drilling.
Therefore, conducting hydraulic fracture experiments will yield a deeper understanding
of LCM’s as well as measuring the effect of varying drilling fluids and fluid additives on
fracture gradient.
The objective of this work is to develop and test a wellbore scale model under in-
situ condition to be used for comparison and validation of analytical and numerical
models which describe the phenomenon of fracture pressure and investigate the most
important variables that are present in wellbore strengthening techniques, known as the
breakdown and re-opening pressure. To achieve the objectives of this research, the

9
following three stages will be accomplished respectively; these objectives can be divided
into the following three topics;
Develop and test a scaled wellbore fracturing cell apparatus.
Validate results with analytical models
Investigate the effect Bentonite concentration and CaCO3 has on fracture
gradient.
By performing laboratory experiments, one can achieve representation of different
formations under a wide range of in-situ stresses. The implications of performing
laboratory experiments do not only aid in validating fracture models, but also to test
healing efficiencies of different loss circulation materials, and their ability to heal
fractures. The experiments could be performed over a wide range of geological
formations as well as drilling fluids.

10
2. LITERATURE REVIEW OF WELLBORE FRACTURING
A comprehensive study of the former and current analytical and numerical models
of fracture pressure and fracture propagation has been done in this chapter. In order to
conduct wellbore strengthening analysis through laboratory work, one must understand
the concept of stress around the wellbore and the different models which describe
fracture pressure. Fracture pressure ( ) is the variable that governs fluid loss
phenomenon. Understanding the behavior of such variable and the different
methodologies that helps predicting it leads to a better estimate of the operational mud
weight window and ultimately aids in the optimization of the number of casings needed
for a given well design.
2.1. THEORETICAL MODEL OF WELLBORE FRACTURING
In continuation, the Kirsch solution will be derived for a vertical wellbore along
the vertical principal stress presented in section 2.1.1.
2.1.1 Kirsch Solution. The first publication regarding stress along the wellbore
was titled “The stress distribution around a circular hole in an infinite plate in one-
dimensional tension”. This publication, (Kirsch, 1898), commonly known as the “Kirsch
solution”, described the stress around a vertical wellbore with uneven far field stresses.
The Kirsch solution has later been discussed and modified for general wellbore

11
orientation by Deiley and Owens (1969), Bradely, (1979), Aadnoy, (1988) and Aadnoy
et at., (1987), The corresponding stress transformations for a circular borehole is given in
Figure 2.1, The solution assumes linear-elastic conditions and plane strain normal to the
borehole axis is presented in the subsequent derivation of equations:
Figure 2.1. An Arbitrary Oriented Wellbore Under In-situ Stress System (Salehi, 2012)
For an arbitrary oriented wellbore (Figure 2.1) the principal cylindrical polar coordinates
can be described as;
(2.1)
(2.2)
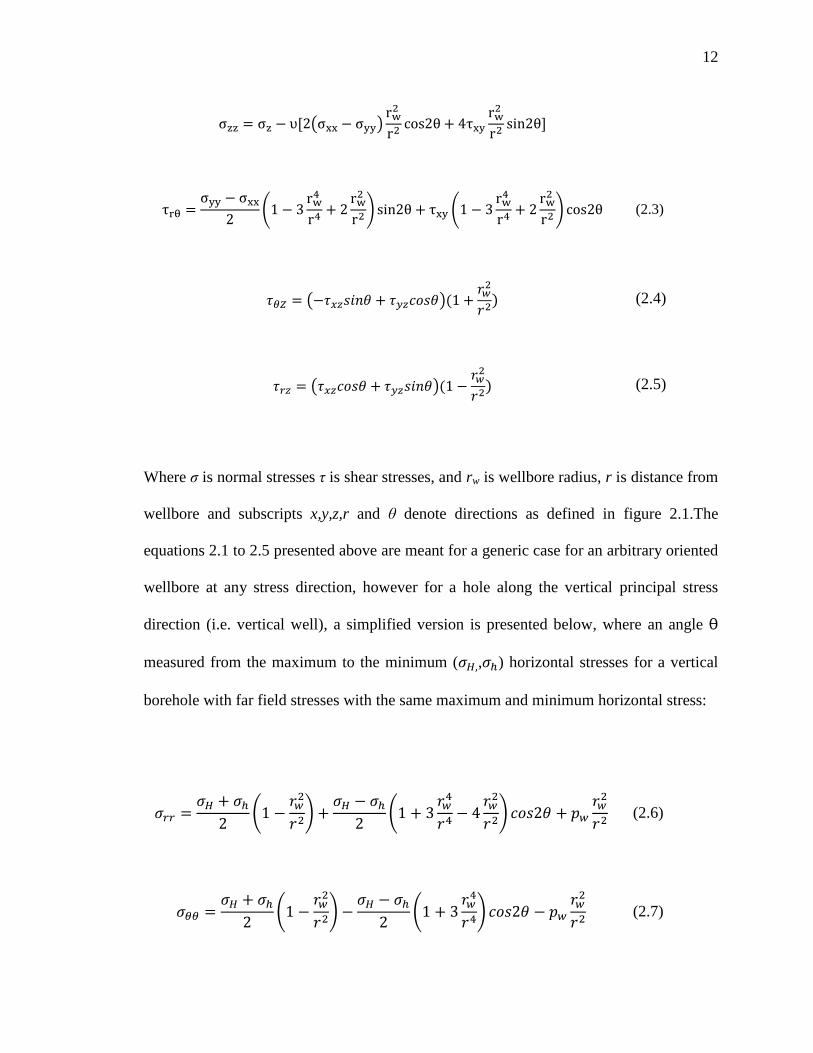
12
(2.3)
(2.4)
(2.5)
Where σ is normal stresses τ is shear stresses, and rw is wellbore radius, r is distance from
wellbore and subscripts x,y,z,r and θ denote directions as defined in figure 2.1.The
equations 2.1 to 2.5 presented above are meant for a generic case for an arbitrary oriented
wellbore at any stress direction, however for a hole along the vertical principal stress
direction (i.e. vertical well), a simplified version is presented below, where an angle θ
measured from the maximum to the minimum ( , ) horizontal stresses for a vertical
borehole with far field stresses with the same maximum and minimum horizontal stress:
(2.6)
(2.7)

13
(2.8)
(2.9)
(2.10)
At the wellbore wall rw is equal to r which reduces equation 2.6 to 2.10 down to:
(2.11)
(2.12)
(2.13)
(2.14)
(2.15)
Equations 2.11 through 2.15 indicate that the minimum and maximum hoop stresses at
the wellbore wall take place at the minimum and maximum horizontal stress orientation,
respectively:

14
(2.16)
(2.17)
These equations shown above pertain to an impermeable (non-penetrating) wellbore wall
meaning that a mud cake has been formed, thus preventing fluids from entering the
formation.
In the absence of mud cake or permeable (penetrating) wellbore wall, the following
equations apply:
(2.18)
(2.19)
(2.20)
In order to understand the implications of this phenomenon pertaining to a normal fault
environment, one must comprehend the mechanics of drilling fluids acting in the
wellbore. The mud weight, also known as the pressure exerted by the drilling fluid onto
the wellbore wall, plays a key role in preventing both the wellbore wall from collapsing,
as well as formation fluids entering the wellbore. Another issue that may take place is if

15
the equivalent circulating density (ECD) causes the mud weight to rise to a point which
can induce tensile failure.
When a normal fault environment is present, vertical fractures occur along the
maximum horizontal stress where the hoop stress around the wellbore is at its minimum.
Tensile failure will occur when the effective tensile stresses across a plane surpasses a
critical limit (Fjaer et al., 2008). One the critical limit has been reached; it will cause
tensile failure, by virtue of exceeding the maximum tensile strength of the rock. Tensile
strength is an intrinsic rock property, and it should not be extrapolated to other
formations without careful analysis. In continuation, a failure criteria is presented when
the tensile strength is exceeded in a principal stress plane as follows:
(2.21)
(2.22)
can be denoted as the effective principal stress in the failure plane and the formation
tensile strength be defined as . Again it should be noted that this is for a non-
penetrating fluids, which has been explained earlier. Tensile failure (also known as the
tensile failure criteria) will be reached when the effective tangential stress along the
wellbore wall exceeds the formation tensile strength as a direct result of an increase in
mud weight. Once the mud weight has reached and surpassed formation tensile strength,
the wellbore wall will undergo tensile failure causing fluid loss into the formation as
shown in figure 2.2. On the contrary, as it is known that the wellbore wall is in
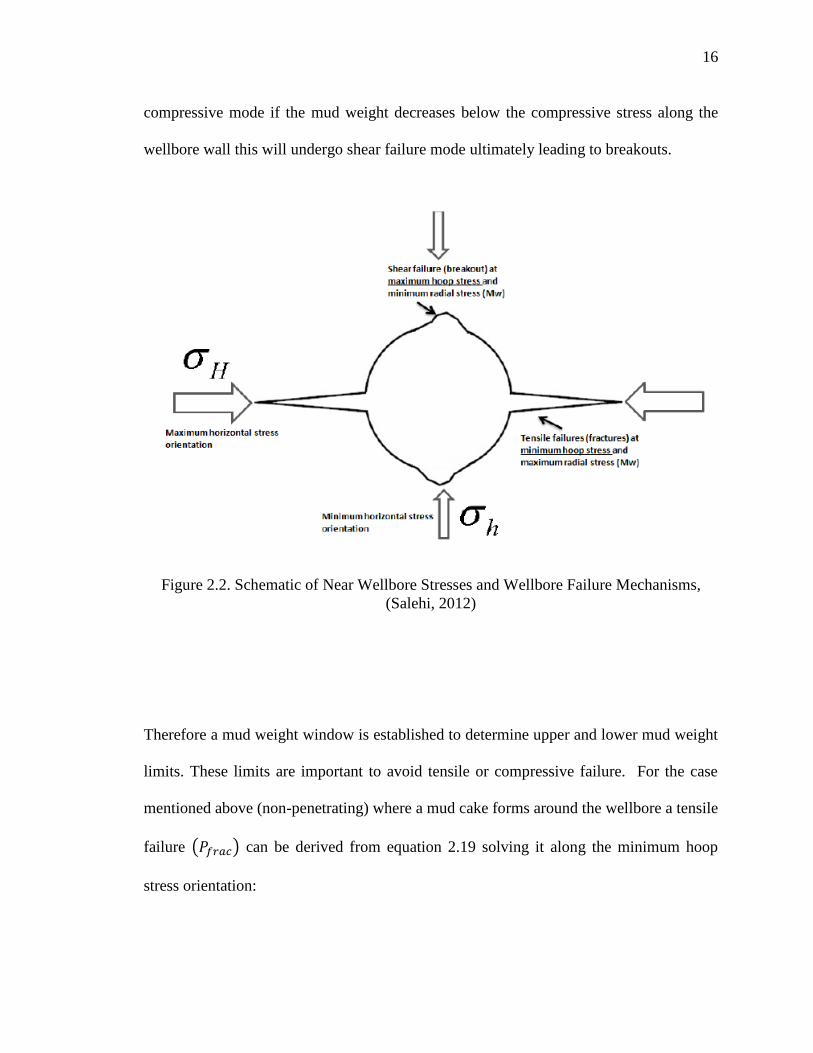
16
compressive mode if the mud weight decreases below the compressive stress along the
wellbore wall this will undergo shear failure mode ultimately leading to breakouts.
Figure 2.2. Schematic of Near Wellbore Stresses and Wellbore Failure Mechanisms,
(Salehi, 2012)
Therefore a mud weight window is established to determine upper and lower mud weight
limits. These limits are important to avoid tensile or compressive failure. For the case
mentioned above (non-penetrating) where a mud cake forms around the wellbore a tensile
failure can be derived from equation 2.19 solving it along the minimum hoop
stress orientation:

17
(2.23)
For a permeable formation with full communication between the wellbore and pore fluids
the fracture pressure is given as;
(2.24)
Where α is Biot coefficient, and ν is Poisson’s ratio.
2.1.2. Eaton’s Equation. In a situation where the formation occur as a 1-D
compaction set up, the following definition has been derived (Fjaer et al., 2008).
(2.25)
Equation 2.25 considers the formation to be compacted as a linear-elastic material.
Having in consideration fluids in the formation a pore pressure factor is added
(2.26)
Since the stresses around the wellbore wall are not only affected by pore pressure but
there might be some far field events such as tectonic forces equation 2.27 accounts for
such events.
18
(2.27)
Re arranging equation 2.27 and setting to 0 an analytical solution known as Eaton’s
equation is presented:
(2.28)
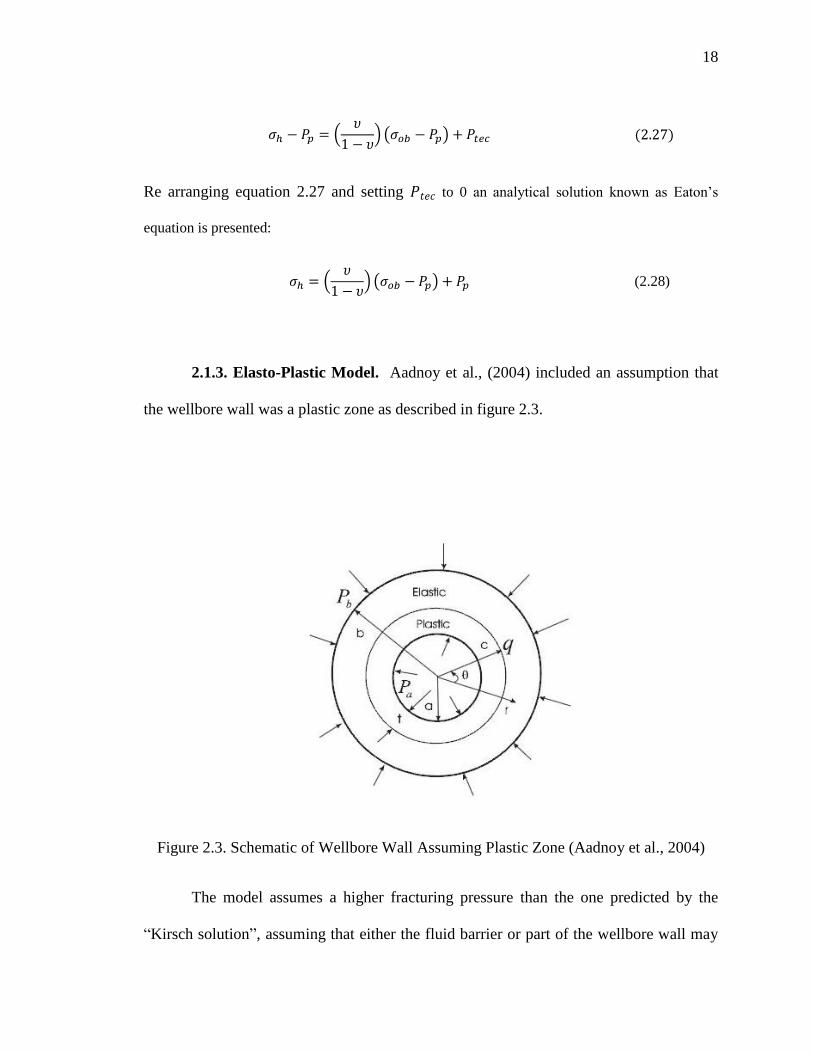
2.1.3. Elasto-Plastic Model. Aadnoy et al., (2004) included an assumption that
the wellbore wall was a plastic zone as described in figure 2.3.
Figure 2.3. Schematic of Wellbore Wall Assuming Plastic Zone (Aadnoy et al., 2004)
The model assumes a higher fracturing pressure than the one predicted by the
“Kirsch solution”, assuming that either the fluid barrier or part of the wellbore wall may
19
behave plastically (Aadnoy et al., 2004). The concept behind this idea is based on
wellbore pressure as the inner boundary condition for the plastic zone with a pressure
match at the plastic and elastic region interface whereas the in-situ stresses act as external
boundary condition at infinity. The tangential stress is the controlling factor for the
fracturing process, a solution for the tangential stress is presented in equation 2.23.
(2.29)
The plastic zone terms on this equation are being represented by the last two terms. Due
to the plastic zone present on this model, there might be an increase in pressure due to the
resistance to deform the rock. In order to define failure which is caused when effective
tangential load surpasses the tensile strength of the rock the following is presented:
(2.30)
Thus, the fracture pressure for the elasto-plastic model is presented on equation 2.31
(2.31)
Low permeable samples were tested with different drilling fluids. When samples were
tested using water as fracturing fluid experiments showed a good correlation for the
poroelastic model (Aadnoy, 2004).
(2.32)

20
However, when samples were tested with drilling fluids the elastoplastic model in
equation 2.25 must be used.
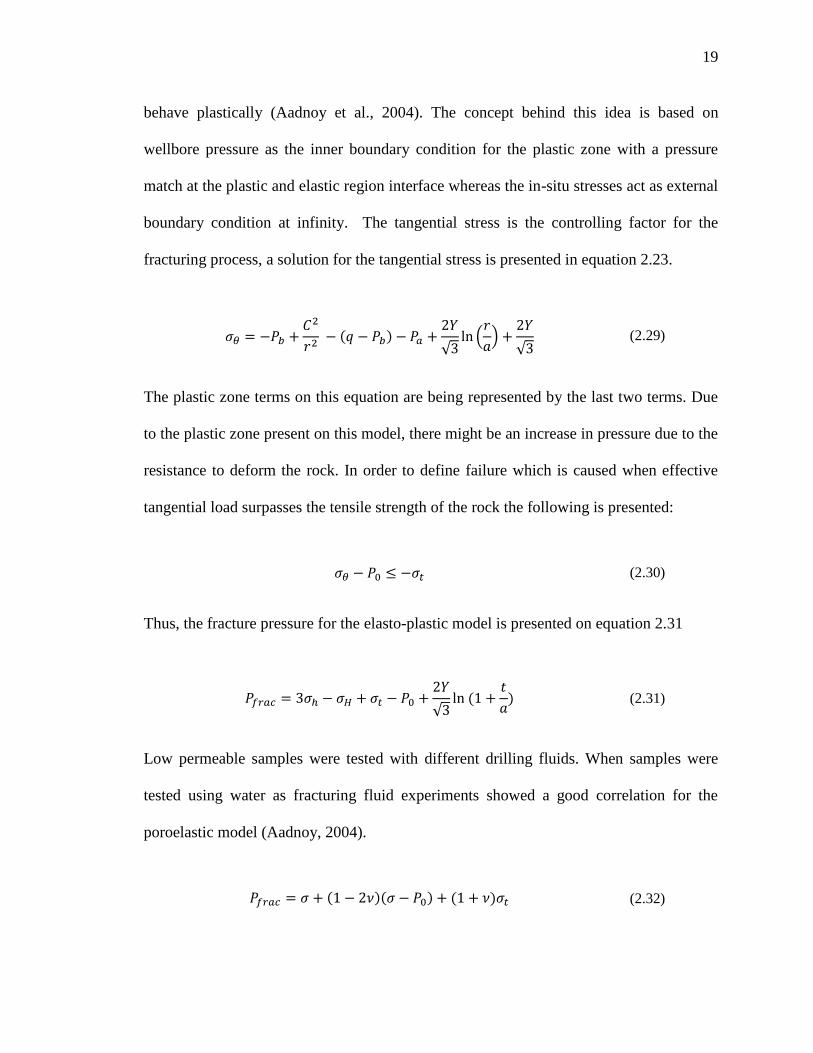
2.1.4. Fracture Resistance Model Based on Non-Invaded Zone. Salehi (2012)
modified Abe et al. (1976) analytical solution for sealed penny-shaped fracture in an
infinitely extended medium. The model has been developed assuming fracture tip is
subject to normal stress which separates the faces symmetrically. The derived fracture
pressure can be described in the following form,
(2.33)
The model assumes that the fracture is subjected to minimum horizontal far field stress
and an existence of a non-invaded zone at the fracture tip (Figure 2.4). This non-invaded
zone has been thoroughly documented in Morita et al. (1990) experiments. Based on the
length of the invaded and non-invaded zone an expression can be determined as follows:
(2.34)
λ is the sealing efficiency factor caused by the non-invaded zone which can take any
value from 0 to 1.5 If there is no non-invaded zone the is zero and equation 2.29
reduces to the Kirsch solution.
21
Figure 2.4. Invaded and Non-Invaded Zones for a Fracture in Normal Fault Environment
(Salehi, 2012)
2.2. HYDRAULIC FRACTURE EXPERIMENTS
2.2.1. DEA – 13 Fracturing Experiments. Drilling Engineering Association -13
joint industry project was part of the beginning stages of understanding fluid loss and
wellbore strengthening by performing rock fracturing experiments (Morita et al., 1990).
Predrilled Berea, Torrey Buff sandstone and Mancos shale samples were employed in
fracturing experiments with different oil based and water based muds with densities of
10-lbm/gal and 16-lbm/gal. These experiments revealed that reopening pressure depends
upon quantity of mud cake left behind on the wellbore wall (Morita et al., 1990, Onya
1994, Morita et al., 1996a, and Morita et al., 1996b). The cause for this higher reopening
fracture is found on the solids present in the drilling fluid which create a bridge in the

22
fracture opening. It can be stated that water based muds cause a higher reopening
pressure when compared to oil based muds as it has been presented in other experiments,
however, the original breakdown pressure for both kinds of muds remained similarly
close. An increase in fracture propagation from 3.0 to 6.0 ppg was achieved in permeable
formations, however it is not as effective in extremely low or non permeable formations
(Fuh et al., 1992). Although no detailed explanation of the DEA-13 experimental set up
and running procedure was given. A fractured sample from one of the DEA-13 tests is
presented in figure 2.5.
Figure 2.5. Berea Sandstone Core – DEA-13 (Wang, 2007b)
2.2.2. GPRI Joint Industry Project Experiments (JIP). The JIP project
as described by Van Oort et al., (2009), meant to replicate DEA-13 experiments on a
smaller scale to reduce cost and thus further understand the concept of fracture

23
propagation resistance. The project aimed to compare different drilling mud
performances such as SBM (synthetic-based-mud) and WBM (water-based-mud). The
tests showed that WBM have an overall fracture propagation pressure efficiency greater
than SBM. However, on very specific wellbore strengthening materials (WSM) such as
synthetic graphites of specific type and size, were also found to be effective in increasing
fracture propagation pressure. Not only the comparison between different mud
compositions was studied, but also the effect of hydraulically conductive fractures on
fracture re-opening pressures. Results obtained from these experiments revealed that
hydraulically conductive fracture yield a lower ideal fracture re-opening pressure to the
level of the minimum horizontal stress, which for these kinds of experiments is also the
confining pressure.
2.2.3. Concrete Experiments. Hydraulic fracturing experiments were performed
by Aadnoy et al. (2004) at Stavanger University using a 10,000 psi fracturing cell with
hollow concrete cores each being 10 cm in diameter by 20 cm in length with a borehole
diameter of 1 cm. During the first phase of the experiments confining pressure, borehole
pressure and axial load were applied simultaneously until desired confining pressure was
reached. Once confining pressure and axial load satisfy the set up requirements the
second phase involved increasing borehole pressure until breakdown of wellbore takes
place.
A repetitive sequence of fracturing experiments was conducted, including an
initial fracture propagation followed by two re-opening fracture experiments, the first one
after 10 minutes of initial fracture and the second one after 1 hour of initial fracture.
Several test were conducted including different borehole geometry, however analysis was

24
narrowed to three tests on circular geometry although the total number of tests performed
was eight. The reason why concrete cores were used is related to their ability to deliver a
close representation of low permeable formations such as shale and chalk with consistent
material properties. Furthermore, Aadnoy and Belayneh’s work, has shown that pure
water delivers a reliable correlation for the poroelastic fracturing model due to the lack of
loss circulation material which is in accordance with other studies (Aadnoy et al., 2004).
During testing, a concrete core was subject to confining pressure of 4 MPa and tensile
strength of 8 MPa. Results are presented in table 2.1 for circular borehole geometry
includes fracturing pressure and reopening pressures after 10 and 60 minutes after initial
fracture was observed.
Although the linear elastic theory (LET) has predicted 16 MPa and 8 MPa of
fracturing pressure for non-penetrating and penetrating respectively, measured results
ranged from 5.72 MPa up to 26.58 MPa, considerably higher than those predicted by the
LET, thus leading to new fracture model named the elasto-plastic model. Several issues
are present while testing. Some are related to the ability of delivering tests with a certain
degree of relationship amongst them which is something that has not been possible,
especially when trying to replicate core samples. Another drawback is that a lack of data
comparison between the Linear Elastic Theory and the Elasto-Plastic model presented.
Even though several fluid barrier particles were used such as SiC or CaCO3, a large range
of fractures pressures were presented preventing an accurate understanding of those
fractures to its corresponding fracture model.

25
Table 2.1. Fracturing Test Results on Various Borehole Shapes and Sizes with Different
Drilling Fluids (Aadnoy et al., 2004)
2.2.4. M-I Swaco Experiments. Kaageson-Loe et al. (2007) presented a series of
experiments performed by M-I Swaco to analyze and understand the phenomena of lost
circulation while drilling. One of the novelties presented by these set of experiments is a
high pressure testing device which allows studying an in-house manufactures porous
media, a good representation of permeable formations, with either water or oil based
muds. As an example, a formation matrix is simulated by two parallel plates of 5 x 0.5 in
in diameter. Porosity and permeability can be varied by handling the size distribution of
particles which are sintered onto the disk, which in the example presented 175 µm of
porosity with 100 darcies clearly showing a high permeable formation. The pressure cell
can withstand pressures of 6000 psi, an initial fracture aperture of 250, 500 and 1000 µm
are created in the sample, since the goal is to test the loss particle material with different
mud types. Results for this batch of experiments are presented on table 2.1. The table
Well
Geometry Size
(mm)
Fracturing
(∆P(MPa))
Reopening
10 min
(∆P(MPa))
Reopening
60 min
(∆P(MPa))
Fluid
type
Circle Ø10 26.58 18.4 18.03 fluid
Circle
Ø20 14.85 6.96 9.66 fluid
A
Circle Ø20 16.55 6.32 8.24 fluid
B
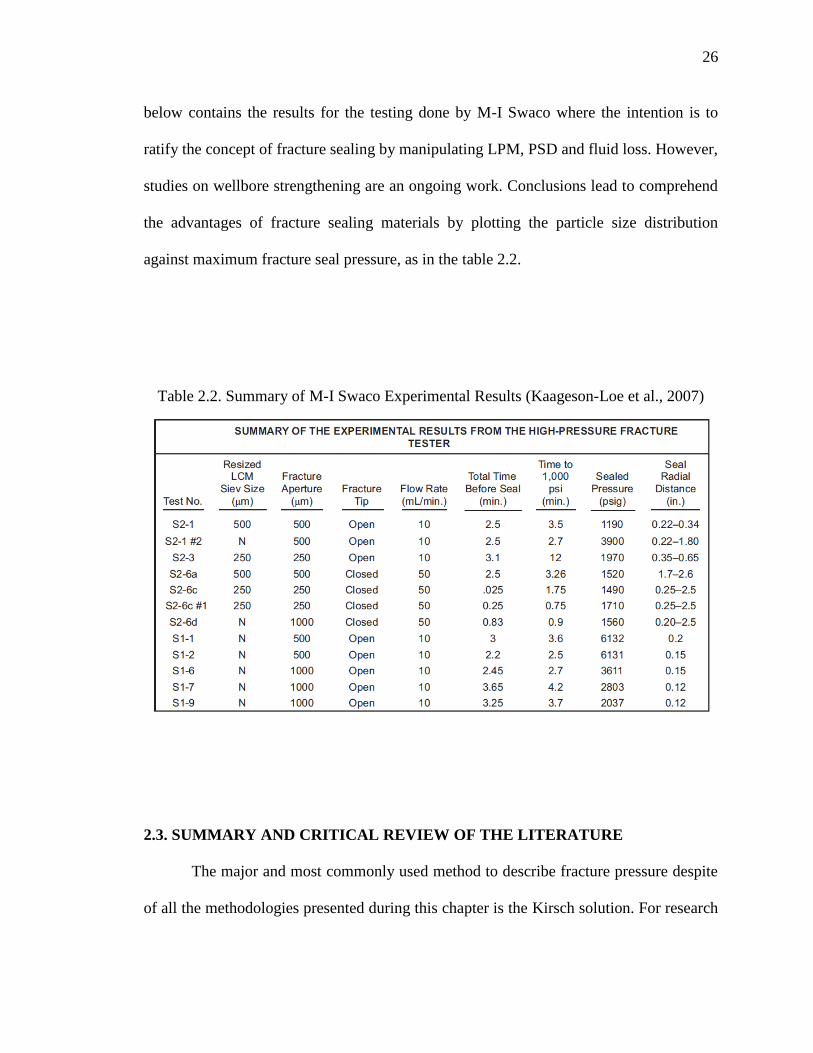
26
below contains the results for the testing done by M-I Swaco where the intention is to
ratify the concept of fracture sealing by manipulating LPM, PSD and fluid loss. However,
studies on wellbore strengthening are an ongoing work. Conclusions lead to comprehend
the advantages of fracture sealing materials by plotting the particle size distribution
against maximum fracture seal pressure, as in the table 2.2.
Table 2.2. Summary of M-I Swaco Experimental Results (Kaageson-Loe et al., 2007)
2.3. SUMMARY AND CRITICAL REVIEW OF THE LITERATURE
The major and most commonly used method to describe fracture pressure despite
of all the methodologies presented during this chapter is the Kirsch solution. For research

27
purposes and for the validation of laboratory experiments, this analytical model is the one
chosen to compare and contrast against the results obtained by the experiments.

28
3. EXPERIMENTAL METHODOLOGY
In this section the experimental set up, data acquisition system, core preparation
and procedure will be explained in detail. The overall goal of the experimental set up is to
further understand the concept of fluid loss and wellbore strengthening by means of
performing hydraulic fracture experiments under confining pressures thus simulating
downhole conditions. This chapter will emphasize the important role of each individual
component which together serves the purpose of contributing to the wellbore
strengthening phenomenon throughout laboratory results.
3.1. EXPERIMENTAL SET UP
Before performing any kind of experiments, it is important to have a
comprehensive knowledge on each component involved in the overall system, as the sum
of all parts give life to the whole assembly. Several detailed steps which may seem
redundant, have been explained in order to clarify their importance. Underestimating the
functionality of any isolated part of the experimental set up, may lead to inadequate
results or structural damage. In order to illustrate the system’s complexity a full detailed
schematic can be found on figure 3.1.
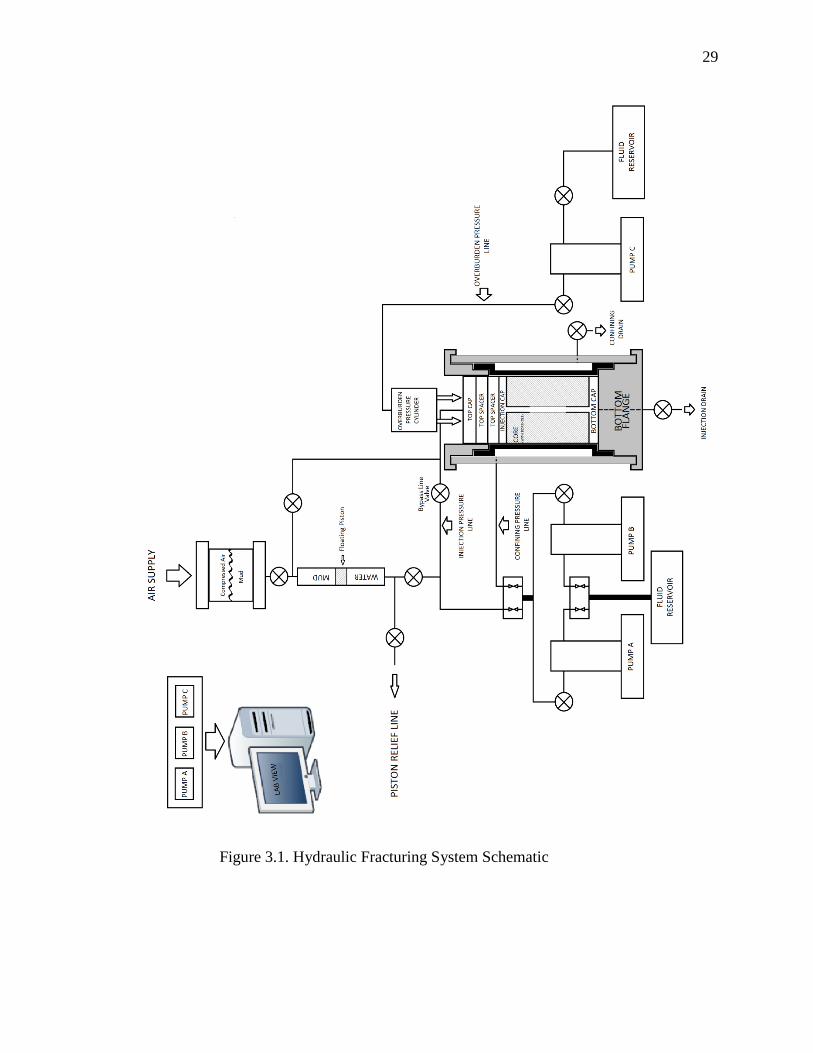
29
Figure 3.1. Hydraulic Fracturing System Schematic

30
3.1.1. Pump System and Fluid Distribution. High pressure (10,000 psi) low
volume (100 ml) Isco DX100 syringe type pumps are used to build up and apply pressure
inside the hydraulic fracturing apparatus, either for confining or fracturing purposes. The
fluid which these pumps operate with is obtained from a plastic or stainless steel
container used as a reservoir. Each pump has an inlet valve which allows fluid flow to
enter the pump piston for refilling or discharging all content as well. Both pumps share
the same inlet tubing into the reservoir, allowing refilling both pumps at the same time.
The tubing used that allows fluid distribution to and from the pumps as well as into the
apparatus is 1/8” and 1/4” OD stainless steel. Each pump has an outlet valve, preventing
the system from depressurizing while being refilled.
3.1.2. Accumulator. A stainless steel pipe with an internal piston has been
designed to accumulate and inject drilling fluids into the core sample. Syringe pumps
used for this experiment were not designed to handle drilling fluids, therefore, an
accumulator as shown in figure 3.2, is loaded with desired drilling mud and then by
means of injecting water beneath the piston, the mud is transferred and injected into the
core sample.

31
Figure 3.2. Mud Accumulator System
From figure 3.2 it can be seen that water is delivered from the pumps to the bottom of the
piston in the accumulator. Mud is transferred to the accumulator by filling a plastic
cylinder and then applying compressed air to force the mud into the accumulator. Then,
pressure is built underneath the piston which displaces the mud into the core sample.
3.1.3. Hydraulic Piston. The hydraulic “hand” pump is connected to a piston
located on the top of the apparatus frame (figure 3.3). The sole purpose of this piston is to
apply axial load onto the top cap, thus creating overburden stress within the core.

32
Figure 3.3. Overburden Piston
3.1.4. In-line Pressure Regulator. A pressure regulator as shown in figure 3.4 is
mounted in between the hand pump and the piston is used to bleed off hydraulic fluid in
case pressure inside the piston exceeds the desired pressure.
Figure 3.4. Bleed-Off Valve

33
3.1.5. Rubber Sleeve. A rubber sleeve is used to apply confining pressure inside
the hydraulic fracturing apparatus. Pressure is built up in the gap between the stainless
steel cylinder and the rubber sleeve, thus as pressure is increased the rubber sleeve
confines the core sample until desired pressure is reached.
3.1.6. Stainless Steel Cylinder. A stainless steel cylinder which is placed over
the rubber sleeve and rests on the bottom flange is used as a pressure vessel to contain the
highly pressurized fluid used to apply confining stresses onto the core sample. It also
serves as the seat and support for the top flange.
3.1.7. All Thread Rods. Six all thread rods mounted on the I – beam are used
to secure and clamp down the top flange onto the stainless steel cylinder, thus creating a
seal for the rubber sleeve, which prevents leaks from the confining chamber onto the
upper section of the core sample.
3.1.8. Bottom Flange. The bottom flange, which is bolted onto an I-beam, serves
as the base and foundation of hydraulic fracturing apparatus. The bottom flange has
several purposes:
Serve as a core holder
Provide support for the stainless steel cylinder
Provide support for the rubber sleeve
It is important to note that the rubber sleeve is glued with clear silicone onto the core
holder to avoid leaks. The bottom flange is shown in figure 3.5.

34
Figure 3.5. Bottom Flange
3.1.9. Top Flange. The top flange, shown in figure 3.6, is similar to the
bottom flange. It has an opening in the center so that core samples can be placed right
into the apparatus. It rests onto the stainless steel cylinder and the rubber sleeve. It
provides a seal between these two to avoid leakages, thus preventing confining pressure
losses.
Figure 3.6. Top Flange

35
3.1.10. Hydraulic Fracturing Apparatus Frame. The frame, shown in figure
3.7, serves as a support for the hydraulic fracturing apparatus. The bottom flange rests on
an I-beam which can travel in the vertical direction by two hydraulic operated winches.
The hand pump, which drives the piston mounted on the top of the frame, is located on
the left side of the frame. The frame has several holes allowing the I-beam to rests in
different heights.
Figure 3.7. Hydraulic Fracturing Apparatus

36
3.1.11. Hydraulic Fracturing Apparatus. All of the components mentioned above,
comprise an assembly whose purpose is to induce vertical or horizontal fractures to better
understand the phenomenon of hydraulic fracturing that takes place while drilling.
Original break down and re-opening pressures measured with this apparatus are
compared to the Kirsch solution explained above. A complete schematic can be found on
figure 3.1 also, a list of all the pressure ratings for the system can be found in Appendix
C.
3.1.12. Data Acquisition. In order to record the pressure at which the pump is
injecting the fracturing fluid into the core sample, the software provided by the pump
manufacturer was employed. This software has the ability to operate and record the pump
parameters remotely from a computer. By a special serial cable provided as well by the
pump manufacturer, the pump controller is connected to an rs-232 serial port on the
computer. The software stores the data generated from the pump, however, the data as it
appears on the original file, must be manipulated in a fashion that allows the user to see
the actual data. The factors that correspond to such interpretation can be found on the
Isco Pump Manual. Besides being able to record the injection pressure from a pump, a
pressure gauge has been installed on the injection line in order to compare values and
measure head losses in the system.
37
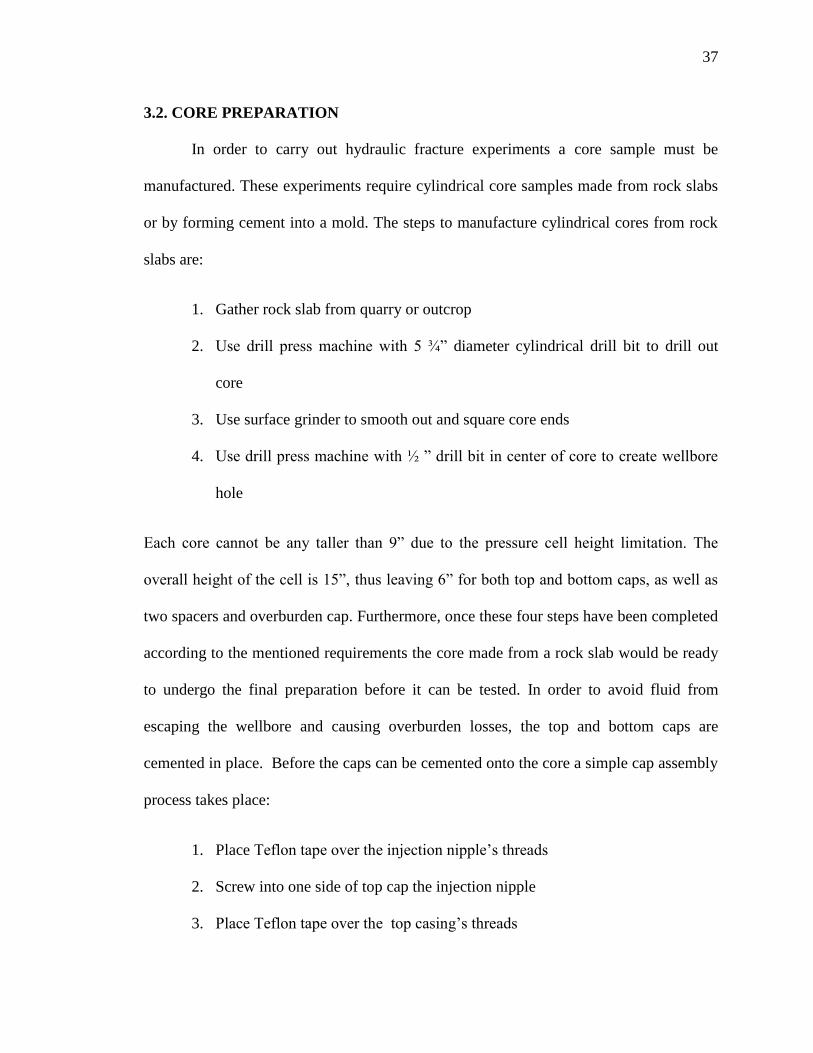
3.2. CORE PREPARATION
In order to carry out hydraulic fracture experiments a core sample must be
manufactured. These experiments require cylindrical core samples made from rock slabs
or by forming cement into a mold. The steps to manufacture cylindrical cores from rock
slabs are:
1. Gather rock slab from quarry or outcrop
2. Use drill press machine with 5 ¾” diameter cylindrical drill bit to drill out
core
3. Use surface grinder to smooth out and square core ends
4. Use drill press machine with ½ ” drill bit in center of core to create wellbore
hole
Each core cannot be any taller than 9” due to the pressure cell height limitation. The
overall height of the cell is 15”, thus leaving 6” for both top and bottom caps, as well as
two spacers and overburden cap. Furthermore, once these four steps have been completed
according to the mentioned requirements the core made from a rock slab would be ready
to undergo the final preparation before it can be tested. In order to avoid fluid from
escaping the wellbore and causing overburden losses, the top and bottom caps are
cemented in place. Before the caps can be cemented onto the core a simple cap assembly
process takes place:
1. Place Teflon tape over the injection nipple’s threads
2. Screw into one side of top cap the injection nipple
3. Place Teflon tape over the top casing’s threads

38
4. Screw into the other side of top cap the 1 ½” casing
5. Place Teflon tape over the bottom casing’s threads
6. Screw into the bottom cap the 1 ½” casing
After this short assembly, if the borehole does not align perfectly with the
top/bottom cap, a grinding stone designed for small applications such as the Dremel Tool,
could be used to enhance the borehole’s diameter. Then, epoxy is used to bond top and
bottom caps to the core. The epoxy used for this purpose is the Sikadur 31 Hi Mod Gel
1:1 ratio. Place top/bottom cap with casing in upright position over the C – Clamps. Use
masking tape to cover the casing hole; this will prevent excess epoxy from clogging it.
Use sand paper of 120/150 grit to make a rough surface on the cap as well as on the
casing, allowing a good bond between core and cap. Once both, the cap and casing have
been scratched with sand paper, spread epoxy onto the entire surface of cap as well as on
the side of the casing. Finally, place core onto the cap and clamp it down in steps, to
allow any necessary alignment. Clean excess epoxy and let cure for 24 hours. This
process which describes how to bond cap and core should be repeated for the remaining
cap. Cement one cap at a time.
3.3. EXPERIMENTAL PROCEDURE
In order to start performing hydraulic fracture experiments set the accumulator
valves to injection mode, empty the accumulator so that no other fluid other than the
39
intended fluid is found on the injection line. Place a core which has been prepared
according to instructions on section 3.2.3 into the hydraulic fracturing apparatus.
Overburden and confining pressure are applied to the core before starting to run
the experiment. Overburden stress is obtained by a piston pushing down on the top cap
and confining pressure is applied through a rubber sleeve in the apparatus by building
pressure inside of it. Fracturing fluids are prevented from escaping the bottom and top of
the wellbore by placing an o-ring at the seat of the core holder and by bonding bottom
and top caps to the core sample as well as each cap having their casings cemented to the
wellbore.
The accumulator mentioned above which is mounted on the wall is used to inject
drilling mud or other hydraulic fracturing fluid other than water; since water is injected
directly from the pumps to the core. Two gauges are located on the hydraulic fracturing
apparatus. One gauge is used to control and compare injection pressure as the experiment
is being run; the other gauge is used to monitor confining pressure. A computer is used
to record the data as the experiment is being run by using the Isco Pump software. At this
point the set up is ready for injection. Locate valves on the accumulator as well as on the
injection line and set to refill. Refill the accumulator with the desired mud. If water is
used to fracture the specimen, put all valves on water injection mode, or switch the valves
from refill to mud injection. Make sure the bottom exit valve is open to remove air from
wellbore. Once this task is done close bottom exit valve and stop pumping. Open Isco
Pump software to record data, head losses in the injection line is 100 psi, this should be
taken into account and subtracted accordingly from the data recorded. Assign a name to
the file; connect the pump to the software and start running the experiment. In between

40
cycles, from original break down and re-opening whether a single or multiple re-opening
cycles are run, the wellbore must be depressurized by opening the bottom exit valve and
closing it right away. A complete check list for the experimental procedure can be found
in Appendix B.
3.4. TESTING PROGRAM
In order to summarize the testing program followed throughout this work, a table
with all the input parameters can be found in below on table 3.1. This table lists rock
mechanical properties of the materials that were tested as well as core dimensions and the
material used for each core. It also depicts the fluid used to fracture the cores and its main
important properties such as fluid density, yield point and plastic viscosity. Lastly, the
stresses applied to the core for each experiment can also be found on the same table.

41
Table 3.1. Table of Rock Mechanical Testing and Fluid Properties
Table 3.2, presents a summary of the results obtained for each experiment as well as
injection flow rate and wellbore diameter.
Table 3.2. Table of Testing Parameters and Pressure Values
Test
#
Wellbore
Diameter
(in)
Flow rate
(ml/min)
1 0.5” 50
2 0.5” 50
3 0.5” 50
4 0.5” 50
5 0.5” 5
6 0.5” 5
7 0.5” 5
8 0.5” 5

42
4. RESULTS
This chapter presents the hydraulic fracturing experimental results with the intention
of analyzing and clarifying the hydraulic fracturing phenomenon. Having the ability to
replicate downhole stresses and hydraulically fracture specimens gives the advantage of
producing real data allowing to build correlations between the numerical model and
laboratory results. All tests are performed on samples with 5.75” in diameter with a
borehole of 0.5”. The length of the core depends on rock slab thickness but the core
length was at least 1:1 ratio between the core diameter and specimen height to avoid end
effects.
4.1. TEST # 1 DOLOMITE FRACTURED WITH WATER
Table 4.1. Dolomite Fractured with Water
Test # Material
(psi)
(psi)
(psi)
Fracture
Orientation
(psi)
q
(ml/min)
1 Dolomite 600 1150 X Horizontal 48 50 12.5
Test 1 was conducted on a dolomite core (Table 4.1). Injecting fluid used to
fracture the sample was tap water (Figure 4.1). Overburden pressure was applied at 50
psi and confining pressure was set to 600 psi. This set up lead to a horizontal fracture,
since these conditions with > > do not represent a normal Andersonian faulting

43
environment (Fjaer et al., 2008). The injection pressure vs. time curve is presented next to
the fractured sample (Figure 4.2). The breakdown pressure occurred at a lower value
(1150 psi) than expected due which may occurred due to natural pre existing fractures in
the sample which can be seen in the core before testing (Figure 4.1).
Figure 4.1. Dolomite Core Test 1 before testing

44
Figure 4.2. Original Breakdown Pressure Test 1
4.2. TEST # 2 DOLOMITE FRACTURED WITH 8% BENTONITE MUD
Table 4.2. Dolomite Fractured with 8% Bentonite Mud
Test # Material
(psi)
(psi)
(psi)
Fracture
Orientation
(psi)
q
(ml/min)
2 Dolomite 200 3700 2100 Vertical 400 50 0.5
This test was conducted with a dolomite core (Table 4.2). Injecting fluid used to
fracture the sample was 8% Bentonite mud (Figure 4.3). Overburden pressure was
0
200
400
600
800
1000
1200
1400
460 480 500 520 540
Inje
ctio
n P
ress
ure
[p
si]
Time [sec]

45
applied at 400 psi and confining pressure was set to 200 psi. This set up lead to a
horizontal fracture, since these conditions do not represent a normal fault environment.
The injection pressure vs. time curve is presented next to the fractured sample (Figure
4.4). The breakdown pressure occurred at 3700 psi, a much higher value compared to the
water injection test mentioned above. The reason for this, is when injecting mud, it
creates a mud cake which prevents the fluid from entering the formation (non-
penetrating) thus inducing a higher breakdown pressure. The re-opening cycle clearly
shows that the re-opening pressure is lower than the original breakdown recorded at
2100.
4.3. TEST # 3 DOLOMITE FRACTURED WITH COLORED WATER
Table 4.3. Dolomite Fractured with Colored Water
Test # Material
(psi)
(psi)
(psi)
Fracture
Orientation
(psi)
q
(ml/min)
3 Dolomite 600 2224 X Horizontal 48 50 12.5
The third test was conducted on a dolomite core (Table 4.3). Injecting fluid used
to fracture the sample was simply water (Figure 4.5). Overburden pressure was again
applied at 50 psi and confining pressure remained set at 600 psi. This set up, as explained
in Test -1 leads to a horizontal fracture. To be able to identify where the fracture
happened along the core a green dye was used in the water. As it can be seen in the

46
aforementioned figure the core split right horizontally along a single fracture plane. The
injection pressure vs. time curve is presented next to the fractured sample (Figure 4.6).
The breakdown pressure occurred at higher value than the first horizontal test which can
be attributed to the heterogeneous properties of the formation (2224 psi). Since the core
has been fractured completely to the edge of the core, a re-opening cycle was not possible
to perform since the injected water is pressure with a higher pressure towards the
confining sleeve.
Figure 4.3. Dolomite Core Test 2 before testing

47
Figure 4.4. Original Breakdown and Re-Opening Pressure Test 2
Figure 4.5. Dolomite Core Test 3 before testing (to the left) and after testing (to the right)
48
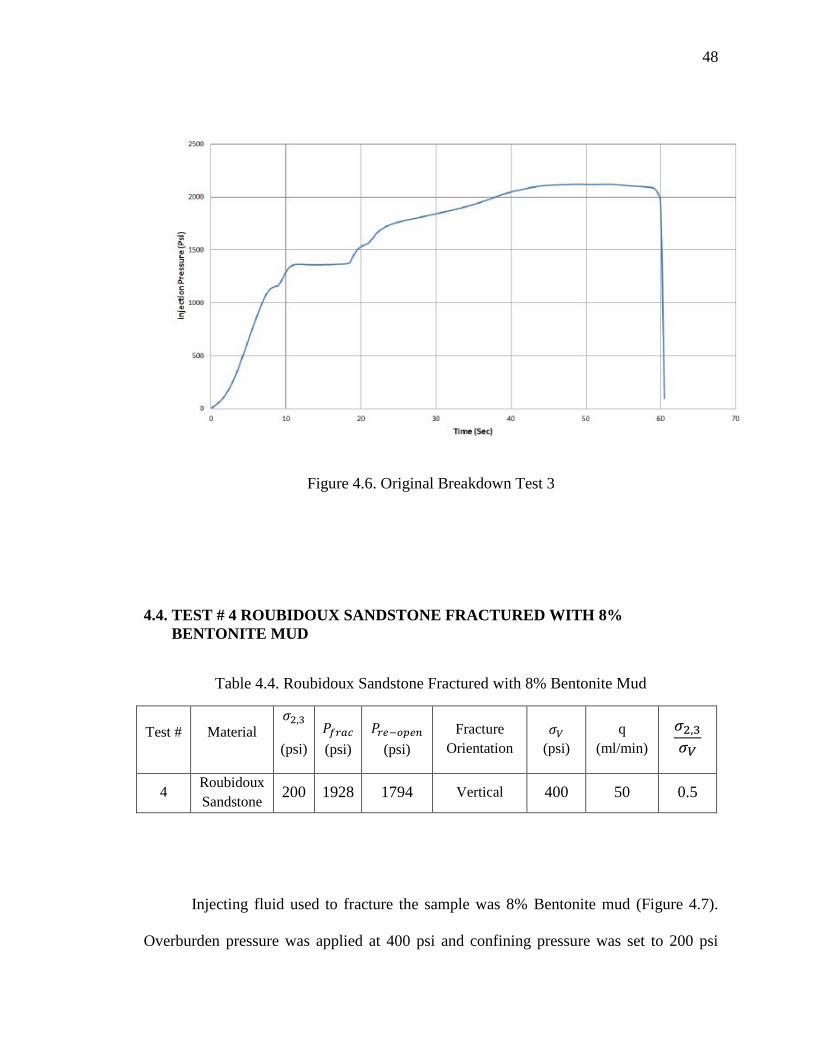
Figure 4.6. Original Breakdown Test 3
4.4. TEST # 4 ROUBIDOUX SANDSTONE FRACTURED WITH 8%
BENTONITE MUD
Table 4.4. Roubidoux Sandstone Fractured with 8% Bentonite Mud
Test # Material
(psi)
(psi)
(psi)
Fracture
Orientation
(psi)
q
(ml/min)
4 Roubidoux
Sandstone 200 1928 1794 Vertical 400 50 0.5
Injecting fluid used to fracture the sample was 8% Bentonite mud (Figure 4.7).
Overburden pressure was applied at 400 psi and confining pressure was set to 200 psi
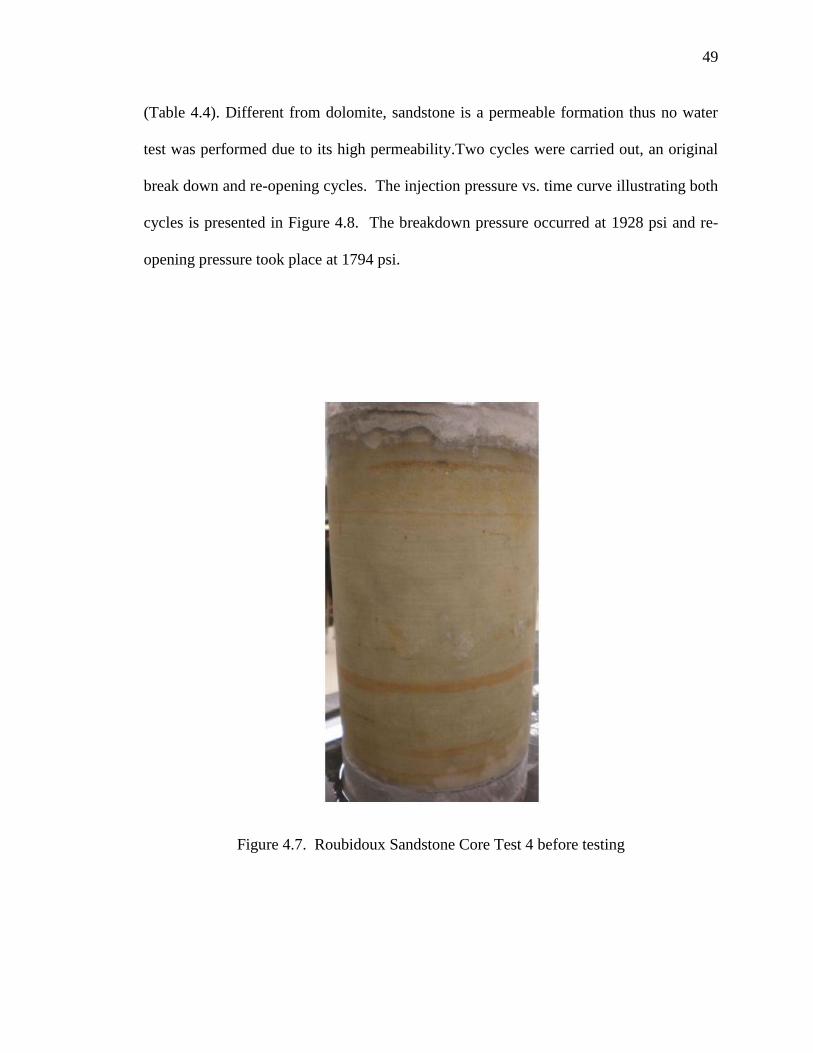
49
(Table 4.4). Different from dolomite, sandstone is a permeable formation thus no water
test was performed due to its high permeability.Two cycles were carried out, an original
break down and re-opening cycles. The injection pressure vs. time curve illustrating both
cycles is presented in Figure 4.8. The breakdown pressure occurred at 1928 psi and re-
opening pressure took place at 1794 psi.
Figure 4.7. Roubidoux Sandstone Core Test 4 before testing

50
Figure 4.8. Roubidoux Sandstone Fracture Pressure Test 4
4.5. TEST # 5 CONCRETE CORE FRACTURED WITH 4% BENTONITE MUD
Table 4.5. Concrete Core Fractured with 4% Bentonite Mud
Test # Material
(psi)
(psi)
(psi)
Fracture
Orientation
(psi)
q
(ml/min)
5 Concrete 200 1855 1422 Vertical 400 5 0.5
This test was conducted over a concrete core (table 4.5). Forming concrete cores
gives the advantage of simulating low permeable formations with a high degree of
homogeneity, therefore no pre existing fractures or fissures are present at the time of

51
performing the experiment. The concrete mix was calculated by filling up a 6” inside
diameter and 1 foot tall of PVC pipe with Quickcrete mortar mix. The amount of water
used to mix in the mortar mix was 58 fluid oz. The concrete is poured onto a steel column
coated with silicone used as a release agent. Before performing any kind of mechanical
procedures or operations, the concrete core has to cure for a 7 day period. An original
breakdown cycle was performed injecting 4% Bentonite (Figure 4.9). Overburden
pressure was applied at 400 psi and confining pressure was set to 200 psi. The injection
pressure vs. time curve illustrating both cycles is presented in figure 4.10. The
breakdown pressure occurred at 1855 psi and re-opening pressure took place at 1422 psi.
4.6. TEST # 6 CONCRETE CORE FRACTURED WITH 6% BENTONITE MUD
Table 4.6. Concrete Core Fractured with 6% Bentonite Mud
Test # Material
(psi)
(psi)
(psi)
Fracture
Orientation
(psi)
q
(ml/min)
6 Concrete 200 2188 1856 Vertical 400 5 0.5
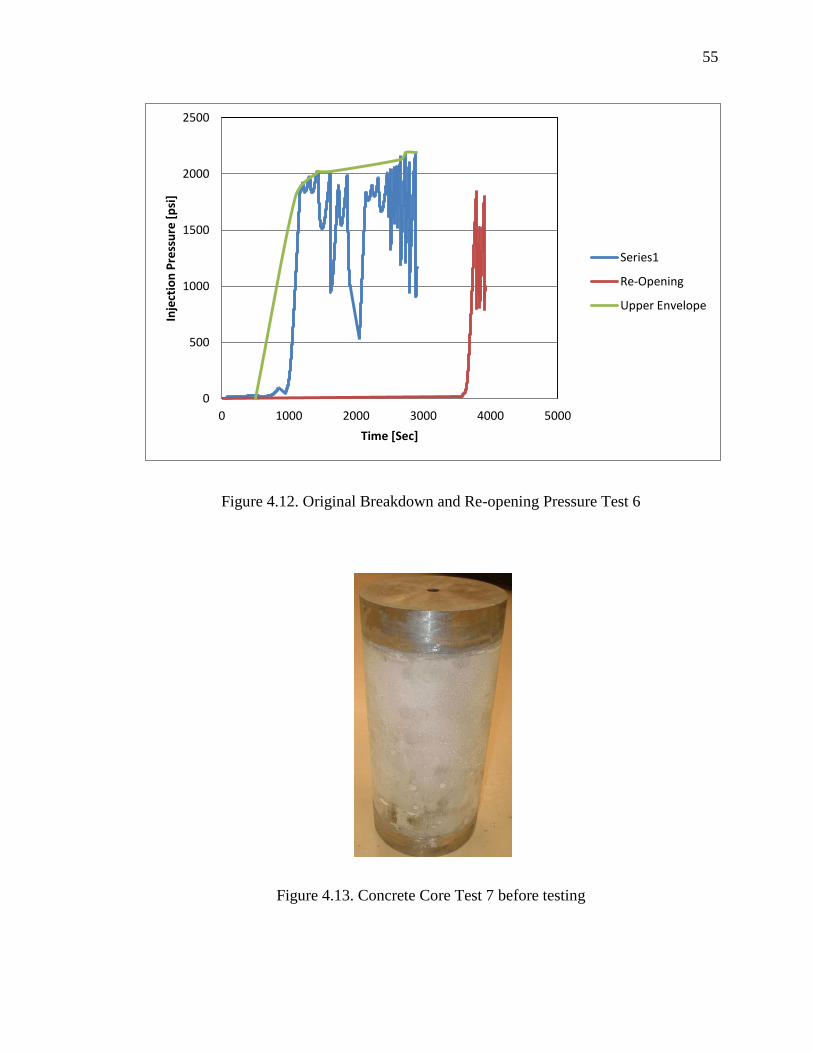
Test six was conducted over a concrete core (Table 4.6). The concrete mix used
for this experiment is the same as explained in the previous one. An original breakdown
cycle was performed injecting 6% Bentonite (Figure 4.11). Overburden pressure was
applied at 400 psi and confining pressure was set to 200 psi. The same cycle was applied
to ensure repeatability among the testing program. The injection pressure vs. time curve

52
illustrating both cycles is presented in figure 4.12. The breakdown pressure occurred at
2188 psi and re-opening pressure took place at 1856 psi.
Figure 4.9. Concrete Core Test 5 before testing

53
Figure 4.10. Original Breakdown and Re-opening Pressure Test 5
4.7. TEST # 7 CONCRETE CORE FRACTURED WITH 6% BENTONITE – CMC
MUD
Table 4.7. Concrete Core Fractured with 6% Bentonite – CMC Mud
Test # Material
(psi)
(psi)
(psi)
Fracture
Orientation
(psi)
q
(ml/min)
7 Concrete 200 2310 2115 Vertical 400 5 0.5
Test 7 was conducted over a concrete core (Table 4.7). The concrete mix used for
this experiment is the same as explained in the previous concrete experiments. The mud
0
200
400
600
800
1000
1200
1400
1600
1800
2000
1348 1848 2348 2848 3348 3848 4348
Inje
ctio
n P
ress
ure
[p
si]
Time [sec]
Original Breakdown Re-Opening

54
used for this experiment included Carboxy Methyl Cellulose (CMC), a viscosifier needed
to suspend the calcium carbonate particles in the fluid. An original breakdown cycle was
performed injecting 6% Bentonite-cmc (Figure 4.13). Overburden pressure was applied
at 400 psi and confining pressure was set to 200 psi. Ten minute interval between cycles
was applied to be consistent with previous experiments. The injection pressure vs. time
curve illustrating both cycles is presented in figure 4.14. The breakdown pressure
occurred at 2310 psi and re-opening pressure took place at 2115 psi.
Figure 4.11. Concrete Core Test 6 before testing
55
Figure 4.12. Original Breakdown and Re-opening Pressure Test 6
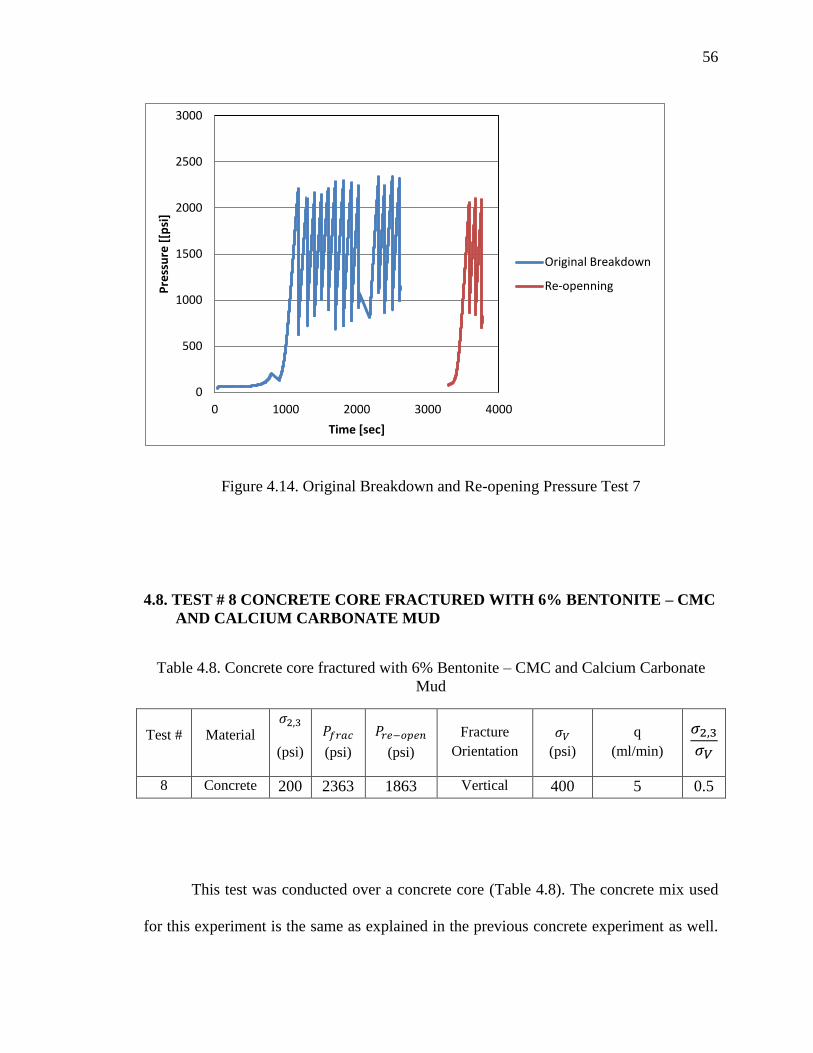
Figure 4.13. Concrete Core Test 7 before testing
0
500
1000
1500
2000
2500
0 1000 2000 3000 4000 5000
Inje
ctio
n P
ress
ure
[p
si]
Time [Sec]
Series1
Re-Opening
Upper Envelope
56
Figure 4.14. Original Breakdown and Re-opening Pressure Test 7
4.8. TEST # 8 CONCRETE CORE FRACTURED WITH 6% BENTONITE – CMC
AND CALCIUM CARBONATE MUD
Table 4.8. Concrete core fractured with 6% Bentonite – CMC and Calcium Carbonate
Mud
Test # Material
(psi)
(psi)
(psi)
Fracture
Orientation
(psi)
q
(ml/min)
8 Concrete 200 2363 1863 Vertical 400 5 0.5
This test was conducted over a concrete core (Table 4.8). The concrete mix used
for this experiment is the same as explained in the previous concrete experiment as well.
0
500
1000
1500
2000
2500
3000
0 1000 2000 3000 4000
Pre
ssu
re [
[psi
]
Time [sec]
Original Breakdown
Re-openning

57
The mud used for this experiment included Carboxy Methyl Cellulose (CMC), a
viscosifier needed to suspend the calcium carbonate particles in the fluid with a 5%
calcium carbonate by weight added to the mixture. An original breakdown cycle was
performed injecting 6% Bentonite-cmc-CaCO3(Figure 4.15). Overburden pressure was
applied at 400 psi and confining pressure was set to 200 psi. Ten minute interval between
cycles was applied to be consistent with previous experiments. The injection pressure vs.
time curve illustrating both cycles is presented in Figure 4.16. The breakdown pressure
occurred at 2363 psi and re-opening pressure took place at 1863 psi.
Figure 4.15. Concrete Core Test 8
58
Figure 4.16. Original Breakdown and Re-opening Pressure Test 8
0
500
1000
1500
2000
2500
0 1000 2000 3000 4000 5000 6000
Pre
ssu
re [
psi
]
Time [Sec]
Original Breakdown
Re-Opening

59
5. DISCUSSION
The major contribution of hydraulic fracturing experiments explained in chapter 4
is that the re–opening pressure does not reach a higher value than the original breakdown
pressure. Moreover, this is not the only observation made but also that the values
obtained were higher than those predicted by the Kirsch solution. In order to comprehend
the experiments performed in chapter 4, a detailed explanation of the results will be
presented in this chapter. In addition, a comparison of the results obtained in this work
will be compared and contrasted with those presented in the literature review.
5.1. INITIAL SET UP OF EXPERIMENTS
Once the hydraulic fracturing apparatus was fully functional and ready to be put
to test a first batch of experiments were conducted. During the first test, an unexpected
horizontal fracture occurred, due to the set up of stresses while running the experiment.
Confining pressure governs minimum and maximum horizontal stresses, which in this
case are the same, which in case of being larger than the vertical stress a horizontal
fracture will be obtained. For the first dolomite experiment, the vertical stress was set to
1000 psi however, due to a difference in area between the piston and the top cap, a much
lower pressure is seen in actuality by the core itself, of 48.2 psi. Confining pressure was
set to 600 psi, thus a horizontal fracture occurred. In order to produce vertical fractures,
the magnitude of the vertical stress has to be greater than the horizontal whether
maximum or minimum horizontal stress does not make a difference. At first, it may seem

60
that the natural occurring fractures or fissures in the dolomite may have induced a
horizontal fracture, prior to realize the area difference, which in actuality yields a lower
vertical stress on the core. A second dolomite test was performed using green food
coloring mixed in the fracturing fluid to track any possible fissures or natural occurring
fractures within the core; unfortunately, the test was not successful since a horizontal
fracture developed splitting the core into two pieces, however, the analytical model
predicts a lower fracture pressure compared to laboratory results. A comparison of a
naturally fractured vs. a core with an intact borehole for these two experiments can be
seen in (figure 5.1). Following the dolomite experiments, Roubidoux sandstone was
tested. Retaining the same parameters used for the previous experiment (Dolomite Test 1
and Test 2) using water as a fracturing fluid the confining pressure started to increase
with undesired effect before fracturing the sample. Sandstone being a permeable
formation will cause water to travels throughout it very easily due to its high permeability
ranging from 63 up to 113 md with as well as having a porosity of 14.7% on average.
After building pressure the water simply reaches the outer boundary of the core, therefore
no fracture could or will take place. Rearranging stress magnitudes and calculating the
area difference between the top steel cap and the overburden piston, a new pressure of
8300 psi on the piston gauge will translate into 400 psi onto the core, which by applying a
lower confining pressure of 200 psi, a vertical fracture was obtained, as expected based
on the normal fault environment explained earlier. The fracturing fluid was changed from
simply water to a water based mud (WBM) of 8% Bentonite by weight, allowing an
original breakdown cycle and a reopening cycle with 10 minutes in between cycles to
allow healing effects from the mud. However, as it has been shown, the re-opening
61
fracture pressure was never higher than the original breakdown, something which
contradicts other methods explained in this work. Similar results were obtained when a
third dolomite test was conducted, although a higher fracture pressure was achieved due
to higher rock properties (figure 5.2). Changing the injection flow rate from the first set
of experiments of 50 ml/m to 5 ml/m was considered to have a better control of the
fracture growth; nonetheless issues have risen by doing so. The pressure curves show a
ripple effect. While injecting, the fracture is initiated followed by a pressure drops. Since
a small volume of fluid is being injected, the fracture re-pressurizes to continue
propagating into the core in steps. The fracture pressure reaches a higher value with each
step, where the fluid has not only to propagate the fracture further (overcome fracture
gradient) but also has to overcome the mud that was deposited in the fracture as well.
Figure 5.1. A Comparison of Non-Permeable Cores (Dolomite) With and Without Intact
Boreholes
0
500
1000
1500
2000
2500
Fractured Non Fractured
Pre
ssu
re [
psi
]
Formation
Original Breakdown Pressure

62
Figure 5.2. A Comparison of Permeable vs. Non-Permeable Cores for 8%
Bentonite Mud
5.2. CONCRETE CORE EXPERIMENTS
As a direct implication of the uncertainty and uneven geomechanical properties of
the dolomite and sandstone used for first batch of testing, concrete was selected as a
material that replicates low permeable formations. Since concrete is mixed and poured in
house, a much more precise characterization can be made. Original breakdown pressure
and re-opening pressure are present within a range of 200 psi, this is achieved do to the
homogeneity of the core samples, as it can be seen from the test on 4.5 and 4.6. These
two tests (4.5 and 4.6) were performed using a 4 and 6 % Bentonite mud. The reason for
this testing was to identify changes in original breakdown pressure and re-opening
pressure by increasing the Bentonite concentration in the mud. Shown in figure 5.3, by
0
500
1000
1500
2000
2500
3000
3500
4000
Dolomite Sandstone
Pre
ssu
re [
psi
]
Formation
Original Breakdown Pressure
Re-Opening Pressure

63
increasing the Bentonite concentration a higher original breakdown and re-opening
pressure was achieved. A concrete fractured core is shown in Appendix A. In
continuation with the testing program the test described in 4.7 and 4.8 were conducted,
instead of using the “clean” 6% Bentonite test, meaning just Bentonite and water, 5% by
weight calcium carbonate (CaCO3) from Mi-Swaco was used (Safe Carb 500). When
mixing the Bentonite mud, an unexpected phenomenon took place. The calcium
carbonate precipitated to the bottom of the mixing cup due to lack of viscosity in the
mud. In order to have the calcium carbonate in suspension a viscosifier called CMC
(Carboxy Methyl Cellulose) was added following the Baroid Fluids Handbook criteria of
4% CMC by weight on a 500 ml sample. Thus, the calcium carbonate was held in
suspension and the results showed a higher breakdown pressure as shown in figure 5.4;
however a similar re-opening pressure compared to previous experiments was obtained.
Another point to note is that laboratory results were relatively constant for the concrete
cores. The last two experiments (Table 4.7 and 4.8) were conducted with cores with over
28 days of cure time, a time frame needed to achieve full cure strength on concrete, thus
the higher breakdown pressure, although re-opening pressure did not follow the same
trend. Thus, a higher breakdown pressure can be solely attributed to the concrete cure
time. However, it is important to denote that the mechanical properties of the concrete did
not vary between the different cure times. To illustrate how the different experiment
results regarding original breakdown and re – opening pressures compare to each other
(figure 5.3 and figure 5.4), the following graphs are presented.
64
Figure 5.3. A Comparison Non-Permeable Cores (concrete) for 4 & 6 % Bentonite Mud
Figure 5.4. A Comparison of Non-Permeable Cores (concrete) for 6% Bentonite Mud
with and Without Additives
0
500
1000
1500
2000
2500
4% Bentonite Mud 6% Bentonite Mud
Pre
ssu
re [
psi
]
Mud Type
Original Breakdown Pressure
Re-Opening Pressure
0
500
1000
1500
2000
2500
6% Bentonite 6% Bentonite with CMC
6% Bentonite with CMC +
CaCO3
Pre
ssu
re [
psi
]
Formation
Original Breakdown Pressure
Re-Opening Pressure

65
5.3. KIRSCH SOLUTION VALIDATION
As shown on equation 23, the Kirsch solution (analytical) would predict a fracture
pressure of 1762.3 psi (table 5.1) for 600 psi of confining pressure, assuming 0 pore
pressure and 0 tectonic stresses. However, due to the ratio of open wellbore height with
wellbore diameter with a low rate of injection (5 ml/m) the fracture pressure increases.
This phenomenon has taken place as well while performing experiments with a lower
confining pressure (200 psi) where the analytical model has predicted a 501.5 psi of
fracture pressure. The concrete experiment where calcium carbonate has been added did
not yield a closer result between the analytical model (Kirsch solution) with the
experimental data.
Table 5.1. Analytical Prediction and Laboratory (Original Breakdown Pressure) Results
Injecting Fluid
(psi)
Analytical
(psi)
Laboratory Results
(psi)
Water 600 1762.3 1150
8% Bentonite 200 962.3 3700
Water 600 1762.3 2224
8% Bentonite 200 547.12 1928
4% Bentonite 200 501.5 1855
6% Bentonite 200 501.5 2188
6% Bentonite
(CMC) 200 576.4 2310
6% Bentonite
(CMC + CaCO3) 200 576.4 2363
66
5.4. EVAULATION OF RESULTS WITH PREVIOUS CONDUCTED TESTS
Morita et al.,(1996) has performed similar types of experiments as described in
chapter 2. The values obtained by Morita et al.,(1996) shown on table 5.2, indicate that
laboratory results are much higher than the one predicted analytically. It is still uncertain
why such discrepancy takes place between the two. Moreover, by performing hydraulic
fracturing at Missouri S & T the same phenomenon takes place. Thus, having anisotropic
or isotropic horizontal stresses cannot be taken into account as the only contributing
factor to a higher breakdown pressure. Following table 5.2 and 5.3 indicates a
comparison of breakdown pressure between DEA – 13 and Missouri S&T results. In
addition to Morita’s work, Aadnoy et al.,(2004) experimental results were higher than
those predicted by the LET model (table 5.4), which is in agreement with the work
presented
Table 5.2. Missouri S&T Results
Injecting Fluid
(psi)
Analytical
(psi)
Laboratory Results
(psi)
Water 600 1762.3 1150
8% Bentonite 200 962.3 3700
Water 600 1762.3 2224
8% Bentonite 200 547.12 1928
4% Bentonite 200 501.5 1855
6% Bentonite 200 501.5 2188
6% Bentonite
(CMC) 200 576.4 2310
6% Bentonite
(CMC + CaCO3) 200 576.4 2363

67
Table 5.3. Morita et al 1996, Laboratory Results.
Injecting Fluid
Analytical
(psi)
Laboratory Results
(psi)
Muds (Ave) 2200 1800 3350 11500
Muds (Ave) 2500 300 1450 4300
Water 1100 900 1229 4000
Table 5.4. Aadnoy et al., 2004, Laboratory Results
Injecting Fluid
Well
bore
(mm)
(psi)
Analytical
(psi)
Laboratory Results
(psi)
Fluid 10 580 2320 3855
Fluid A 20 580 2320 2153
Fluid B 20 580 2320 2400
68
6. CONCLUSIONS
Throughout this thesis, hydraulic fracturing test were performed using a pressure
cell apparatus developed and tested in the premises of Missouri University of Science and
Technology. First and foremost, upon completing a series of tests that aid in the process
of troubleshooting the pressure cell apparatus one became not only acquainted with the
device and the testing set up but also permitted to train other individuals as well.
During this process several tests were run using dolomite, sandstone as well as
concrete cores. As it has been proven throughout laboratory experiments, the
heterogeneity of the rock samples gathers from local quarries yield to lower fracture
pressures on dolomite (when being naturally fractured) and sandstone when compared to
Concrete. Only one dolomite core on Test 2, showed a higher original breakdown
pressure. Dolomite and Sandstone having higher mechanical properties than concrete
thus they should yield higher breakdown pressures.
However, when a re-opening cycle was achieved, the pressures obtained were
very close in value, despite of lithology or fracturing fluid. A reason for this could be
directly attributed to the stresses enforced by the fracturing apparatus onto the core, since
that is the only mechanism that would have a direct implication in fracture closure.
When increasing the Bentonite concentration from 4 to 6 % a tendency in increase
of the original breakdown pressure was identified together with an increase in the re-
opening pressure as well.

69
Although CaCO3 was used in 6% Bentonite water-based-mud it did not show an
original breakdown or re-opening pressure significantly higher than a 6% Bentonite
water-based-mud with no additives in it. This could be related to a variety of reasons,
especially with the cure time of concrete, since test was performed on a fully cured (28
days cure time) core rather than on a 7 day cured time as in the case of the first concrete
experiment.

70
7. RECOMMENDED FUTURE WORK
It is not possible within the research scope to test every single formation and
fracturing fluid available, rather to set basis for future testing programs with a fully
functional and trouble free system as well as presenting the very first set of experiments
with the hydraulic fracturing apparatus as well. It is worth mentioning, that the apparatus
has been fully designed and tested in addition to the work presented. However, due to
time restrictions the following tests were not completed and it is set as a recommendation
for future testing to perform experiments on Berea sandstone cores which holds higher
degree of homogeneity not only in the grain matrix of the formation, but also in its
mechanical properties.
Another effect that should be investigated in order to identify the discrepancy
between Kirsch solution and laboratory results is the scaling factor. To mitigate this
uncertainty, it is desired to run experiments with different wellbore diameters ranging
from 0.5 up to 2 inches. Thus important contribution could be made not only clarifying
Kirsch solution against results obtained earlier in chapter 4 but also to analyze the
contribution of wellbore enhancement to LCM healing efficiency. The only LCM tested
was calcium carbonate which was held in suspension in the mud by the aid of Carboxy
Methyl Cellulose (CMC). It is recommended to try different viscosifiers and LCM in
order to illustrate their implication on affecting the breakdown as well as the re-opening
pressure. Moreover, it is important to remark that when varying parameters like those
mentioned through this work, it should be done one at a time to evaluate each and every
one once at a time. At first experiments were performed by injecting at a rate of 50 ml/m

71
which later was changed to 5 ml/m. It would be interesting to plan a testing program
slowly increasing the flow rate to evaluate the role of such variable on breakdown and re-
opening pressure.
7.1 EQUIPMENT ENHANCEMENT
The overburden piston’s contact area with the top cap is such that when applying
8300 psi on the piston’s gauge it translates into 400 psi onto the core itself. It is advisable
in the near future to modify the piston to one of a larger contact area to reduce the
differential area. Other feature improvements would be to add a pressure transducer on
the confining pressure line to plot the confining pressure against the fracturing pressure to
easily identify when the fracture has reach the outer boundary of the core. Nonetheless,
the current set up replicates conditions of up to 450 ft of depth. It is important to make
note that the current structural frame will not hold a pressure of 10,000 psi on the core
and it should be modified and designed accordingly together with the overburden piston.

72
APPENDIX A
FRACTURE PICTURES AFTER CORE HAS BEEN TESTED

73
Concrete Core Fractured After Test Is Performed
Vertical Fracture on Concrete Core

74
Concrete Core Fracture Profile After Test Is Performed

75
APPENDIX B
PRESSURE CELL ASSEMBLY AND EXPERIMENTAL SETUP CHECK LIST

76
1. Raise Pressure Cell
2. Remove Cutter Pins located on the back side of the Clevis Pins
3. Remove Clevis Pins
4. Lower Pressure Cell
5. Place teflon tape onto the injection nipple threads
6. Place teflon tape onto the injection pipe threads
7. Screw injection pipe onto the injection nipple
8. Place o-ring on the bottom of the core holder (inside Pressure Cell)
9. Place the sample carefully inside the Pressure Cell
10. Screw the injection line onto the sample
11. Place Top Spacer 1 onto the sample
12. Place o-ring onto the Top Spacer 1
13. Place Top Spacer 2 onto the Top Spacer 1
14. Place o-ring onto the Top Spacer 2
15. Place Top cap onto the Top spacer 2
16. Raise the Pressure Cell to desired height
17. Place Clevis Pins
18. Drop Pressure Cell onto the Celvis Pins until the hoist cables are no longer in
tension

77
19. Place Cutter Pins located on the back side of the Clevis Pins
20. Screw injection line from the Pressure Cell onto the injection line on the Wall
21. Screw confining line on the wall onto the Pressure Cell confining nipple
22. Screw air flush line from the Pressure Cell onto the air flush line on the Wall
23. Close confining exit valve
24. Open confining intake valve
25. Close air supply valve located on the vacuum pump
26. Close the valve on the overburden pump
27. Apply overburden until desired pressure
28. Fill up confining until desired pressure
29. Empty mud accumulator
30. Refill mud accumulator with desired mud
31. Remove air from the accumulator
32. Open Isco pump software
33. Assign a name to project click on check mark else your file will be saved under
DATA.csv
34. Connect the pump to the computer
35. Check that pumps are filled before starting to inject into the accumulator
36. Open mud exit valve on the bottom of the Pressure Cell
37. Inject mud until little to no air comes out of the mud exit valve line

78
38. Close mud exit valve
39. Start recording data
40. Start first injection cycle until there is a change in the Confining gauge
41. Stop pumping after the first breakdown has been achieved
42. Start timing for how long you are going to wait until your next cycle
43. Open the mud exit valve
44. Close the mud exit valve
45. Check if the pumps must be refilled
46. Start pumping the second cycle until there is a change in the Confining gauge
47. Once all cycles are finished stop recording
48. Put the pumps on Local control
49. Remove Overburden Pressure
50. Open Confining exit valve
51. Close vacuum valve on the vacuum pump
52. Open air intake valve on the vacuum pump
53. Connect air flush hose onto the vacuum pump hose
54. Open the system air flush valve located on the T connection on the vacuum pump
55. Once air comes out of the Confining exit line close all valves at the vacuum pump
56. Remove the air supply hose
57. Close the Confining exit valve
79
58. Unscrew injection line from the Pressure Cell onto the injection line on the Wall
59. Unscrew confining line on the wall onto the Pressure Cell confining nipple
60. Unscrew air flush line from the Pressure Cell onto the air flush line on the Wall
61. Raise the Pressure Cell
62. Remove Cutter Pins
63. Remove Clevis Pins
64. Lower the Pressure Cell until desired height
65. Remove Top Cap
66. Remove Top Spacer 2
67. Remove Top Spacer 1
68. Unscrew the injection line onto the sample
69. Pull sample out of cell from injection pipe
70. Carefully remove the sample
71. Remove o-ring from bottom of the core holder
72. Clean all residue of mud inside the core chamber
73. Raise the Pressure Cell
74. Place Clevis Pins
75. Drop Pressure Cell onto the Clevis Pins until the hoist cables are no longer in
tension
76. Place Cutter Pins

80
APPENDIX C
HYDRAULIC FRACTURING APPARATUS – PRESSURE RATING

81
Cell Requirements
Pressure
(psi)
Tubings
1/8"
8500
1/4"
7500
Fittings
1/4"
8000
1/8"
10000
Ball Valves
1/8"
6000
1/4"
10000
Accumulator 5000
Burst Pressure of Stainless Cylinder
Working Pressure=1900 and Burst Pressure=2900 (with SF=1.5 and Yield Strength=20,000
psi)
Maximum Confining Pressure
Same as SS Cylinder burst pressure
All threaded rods (in tension)
Tensile Strength 5,213 psi, Yield Strength 2,325 psi, Shear Strength 3,875 psi.
Max Torque=14.5 ft*lbs (using Yield Strength)
Max Torque=32.5 ft*lbs (using Tensile Strength)
Pressure rating for the needle valves
15,000 psi
I-Beam
The I-Beam is designed with safely hold of at least 10 tons
Maximum Cell frame Capacity
The frame is rated for 10 tons

82
Satinless Steel Caps
Hardness: 135-215 Brinell
Yield Strength: 30,000 to 60,000 psi
Annealed
Stainless Steel Casings
3000 psi
Stainless Steel Injection Pipe
3000 psi
Stainless Steel Injection Nipple
3000 psi

83
BIBLIOGRAPHY
Aadnoy, B. S., and Chenevert, M. E. 1987. Stability of Highly Inclined Boreholes. SPE
Drilling Engineering, pp. 364- 418.
Aadnoy, B.S., 1988. Modelling of the stability of highly inclined boreholes in anisotropic
rock formations. SPE Drilling Eng., 259–268.
Aadnoy, B. S., Rogaland, U., and Chenevert, M. E. 1987. Stability of highly inclined
boreholes. SPE/IADC 16052, SPE/IADC Drilling Conf., New Orleans, LA, Mar. 15–18.
Aadnoy, B. S., and Belayneh, M. 2004. Elasto-plastic fracturing model for wellbore
stability using non-penetrating fluids. Journal of Petroleum Science and Engineering, 45,
179-192.
Abe, H., Mura, T., and Keer, L.M. 1976. Growth Rate of a Penny-Shaped Crack in
Hydraulic Fracture of Rocks. J. Geophys. Res., 81, No. 29, 5335-5340.
Alberty, M. W., and McLean, M. R. 2004. A Physical Model for Stress Cages. SPE
90493, SPE Annual Technical Conference, Houston.
Aston, M. S., Alberty, M. W., Duncum, S., Bruton, J. R., Friedheim, J. E., and Sanders,
M.W., 2007. A New Treatment for Wellbore Strengthening in Shale. SPE 110713, SPE
Annual Technical Conference, Anaheim, California.
Baroid Fluids Handbook, http://www.google.com/url?sa=t&rct=j&
q=&esrc=s&source=web&cd=1&ved=0CFcQFjAA&url=http%3A%2F%2Fdc162.
4shared.com%2Fdownload%2Fx0GARm2i%2FBaroid_Fluids_Handbook.pdf&ei=
IXz8T8b9FoOa2gXR_ITDBg&usg=AFQjCNERbYtwfauQrty7qSfo7b1rO6DO7A
(Retrieved July, 2012).
Bradley, W. B., 1979. Failure of inclined borehole. J. Energy Resour. Technol., Trans.
ASME 101, 233–239.
Deily, F. H., and Owens, T. C., 1969. Stress around a wellbore. SPE 2557, 44th SPE
Ann. Fall Meeting of AIME held in Denver, CO, Sep. 28–Oct. 1.
Dupriest, F. E., Smith, M. V., Zeilinger, C. S., and Shoykhet, I. N., 2008. Method to
Eliminate Lost Returns and Build Integrity Continuously with High-Filtration-Rate Fluid.
SPE/IADC 112656. Orlando.
Economides, M. J., Hill, A. D., Ehlig – Economides, C., 1993. Petroleum Production
Systems. Prentice Hall PTR.

84
Fjaer, E., Holt, R. M., Horsrud, A .M., Raeen, A. M., and Risnes, R., 2008. Petroleum
Related Rock Mechanics. Second edition, Elsevier publishing.
Fuh, G., Morita, N., Boyd, P.A., McGoffin, S.J., 1992. A New Approach to Preventing
Lost Circulation While Drilling. SPE 24599, 67th
SPE Ann. Technical Conference and
Exhibition SPE held in Washingon, DC, Oct 4-7, 1992.
Fuh, G. F., Beardmore, D., and Morita, N., 2007. Further Development, Field Testing,
and Application of the Wellbore Strengthening Technique for Drilling Operations.
SPE/IADC 105809, SPE/IADC Drilling Conference, Amsterdam.
Kaageson-Loe, N., Sanders, M.W., Growcock, F., Taugbol, K., Horsud, P., Singelstad,
A.V., and Omland, T. H. 2008. IADC/SPE 112595, presented at 2008 IADC/SPE Drilling
Conference in Florida, 2008.
Kirsch. 1898. Die Theorie der Elastizitat und die Bedurfnisse der Festigkeitslehre.
Zeitschrift des Vereines deutscher Ingenieure 42, 797-807.
Morita, N., Black A.D., Fuh G.-F. 1990. Theory of Lost Circulation Pressure. SPE 20409,
65th
SPE Ann. Technical Conference and Exhibition SPE held in New Orleans, LA, Sep
23-26, 1990.
Morita, N., Black A.D., Fuh G.-F. 1996.Borehole breakdown pressure with drilling fluids
- I. Empirical results. International Journal of Rock Mechanics and Mining Sciences and
Geomechanics, 33 (1), pp. 39-51.
Morita, N., Black A.D., Fuh G.-F. 1996.Borehole breakdown pressure with drilling fluids
- II. Empirical results. International Journal of Rock Mechanics and Mining Sciences and
Geomechanics, 33 (1), pp. 53-69.
Okeland, D., Gabrielsen, G. K., Gjerde, J., Sinke, K. and Williams E. L. 2002. The
Importance of Extended Leak-Off Test Data for Combatting Lost Circulation. SPE/ISRM
Rock Mechanics Conference, Irving, Texas, 20-23 October 2002.
Onyia, E.C., 1994. Experimental Data Analysis of Lost Circulation Problems During
Drilling With Oil-Based Mud, SPE 22581-PA, SPE Drilling & Completion, March 1994.
Salehi, S. 2012. Numerical Simulations of Fracture Propagation and Sealing: Implications
for Wellbore Strengthening. PhD Dissertation. (Shall I include current job?)
Traugott, D., Sweatman, R., and Vincent, R., 2007. Increasing the Wellbore Pressure
Containment in Gulf of Mexico HP/HT Wells. SPE Drilling and Completion, 16-25.
Van Oort, E., Friedheim, J., Pierce, T., and Lee, J., 2009. Avoiding Losses in Depleted
and Weak Zones by Constantly Strengthening Wellbores. SPE 125093, SPE Annual
Technical Conference and Exhibition held in New Orleans, Louisiana.

85
Wang, H. 2007b. Near Wellbore Stress Analysis for Wellbore Strengthening. PhD
dissertation, Department of Chemical and Petroleum Engineering, University of
Wyoming.

86
VITA
Maximiliano Liberman was born in 1984. He received his Bachelor’s degree from
Missouri University of Science and Technology (2008). He worked for 8 months at
Tenaris USA in Conroe, TX as a Quality Engineer Analyst. In January 2010, he started
his Master’s degree in Petroleum Engineering at Missouri University of Science and
Technology which was awarded in August of 2012.

87