hydro technology · hydro technology johannes aalbu vice president head of technology development...
TRANSCRIPT

Hydro Technology
Johannes Aalbu
Vice President
Head of Technology development
2015-01-16
(1)

(2)
Our long-term strategy for higher value creation

The three pillars of Hydro’s technology strategy
Hydro overall technology strategy
Operational excellence and
utilization of technology 1
Electrolysis technology –
the heart of an Al company 2
Product solutions supporting
future growth in Al demand and
sustainability 3

Transforming the way we use energy
Lighter vehicles Zero energy
buildings
Packaging that
reduces waste Recycling
and reuse
Increase solar
energy efficiency
Reduce fossil
fuel consumption
and GHG
emissions by
making cars
lighter
Reduce energy
consumption
and GHG
emissions from
buildings
Reduce fossil
fuel emissions
by contributing to
making solar
energy solutions
lighter, simpler
and cheaper
Energy efficient,
low-emission
electrolysis
Reduce energy
consumption,
improve cell
efficiency, CO2
capture ready
cells
Reduce GHG
emissions from
food production
by conserving
and protecting
food better
Reduce waste
and energy
consumption in a
world of limited
resources by
recycling
aluminium
endlessly
Primary production Aluminium in use Recycling
(4)

Raw materials to produce 1 kg aluminium
2 kg 0.5 kg
Aluminium oxide Carbon
50 g 50 g
Aluminium fluoride Cryolite
+ =
13 - 15 kWh 1 kg
Electrical energy Aluminum
Figures are approximate – depending on technology
4 - 5 kg
Bauxite
+ +
+
CO2
1,5-2 kg
Al2O3, Electrolyte + x C 2 Al + mCO2 + nCO

Aluminium Reduction cell
(6)
Alumina
Carbon anode
Carbon cathode
Electrolyte
Liquid
aluminium

Technology development for Hydro smelters
Søderberg Sunndal 4
HAL4e
120 kA 250 - 316 kA
400- 450 kA
Traditionally strong focus on amperage increase
Qatalum
295 - 314 kA

(8)
Sunndal
390/515 kt Al pr. year

Qatalum site preparation 10 million tonnes of landfill

The world’s largest aluminium plant built in one stage

(11)
R&D Organization

Primary Metal Technology hubs
Årdal
Bonn
Porsgrunn
Doha
R&D Locations in decentralized structure
Holland, MI
Mid- and Downstream R&D units
Oslo
Toulouse
Karmøy
Sunndal Raufoss
Eupen Tønder
HAL4e Reference Center,
Årdal in Norway
Neuss
Ulm
Hydro Research and Development Center,
Bonn in Germany
Hydro's die innovation center,
Eupen in Belgium
Technal Brand Development Centre,
Toulouse in France
RTD Reference Center,
Sunndalsøra in Norway

Strategic University/R&D- partners
Worcester Polytecnique Institute
Universities of Toyama and Tokyo
Qatar University
Indian Institute of Science, Bangalore MIT, Boston
NTNU
SINTEF RWTH (Aachen)
Brazil
Shanghai Jiatong University
University of Illinois (ACRC)
University of Auckland

Academic network is part of R&D value creation
and innovation
Operations/ market
R&D
Universities/ institutes
• Active role in professorships
• Funding PhD and master thesis
• Summer jobs
• Ownership in joint research
programs
• Knowledge sharing
• Access to plants

(15)
Greener
Energy & Climate

We have established industry’s most ambitious climate strategy
(16)
Reduce emissions,
increase efficiency
Maximize user-
phase benefits
Increase recycling,
back to the loop
Energy and
primary
production
Aluminium in
use
‘End-of-
life’
Supported by the three pillars of Hydro’s technology strategy

Emissions to air from electrolysis
GTC Pot Room
90% 10%
-HF/SO2 -Dust
-CO2 -CFx
-HF/SO2 -Dust
- CO2 -CFx

Hydro meets climate challenge
0
1
2
3
4
5
6
7
1990 1995 2000 2005 2010
Kg CO2e / Kg aluminium
Average specific emissions from Hydro’s Norwegian smelters
Major reductions in CO2e- and energy consumptions
11
12
13
14
15
16
1993 1998 2003 2010 Qatalum HAL4e
KWh / Kg Aluminium
Average specific energy consumption from 100%-owned Norwegian smelters
Lower emission from Hydro plants
-70%
Lower energy consumption in Hydro plants

Norwegian smelters 1993-2013
Fluoride emission to air
(19)
0.0
0.1
0.2
0.3
0.4
0.5
0.6
0.7
0.8
1992 1996 2000 2004 2008 2012
kg
/to
n A
l
Year
Fluoride emission
HAL4e

-10
-5
0
5
10
15
20
25
0 1 2 3 4 5 6 7 8 9 10 11
100% primary metal 100% recycled metal
Lifecycle perspective: Replacing steel with
aluminium in vehicles helps cut CO2 emissions
(20)
Kg CO2 saved/kg aluminium replacing steel in cars*
* Incl. Full value chain CO2 emissions in production of (primary and recycled) steel and aluminium Assuming 1 kg of aluminium replacing 2 kg of steel in car applications
Source: IFEU
No. years in use

China
17 CO2e
Australia
16 CO2e
Brazil
4,5 CO2e
USA
12,8 CO2e
Canada
5,8 CO2e
Iceland
1,9 CO2e
Norway
2,2 CO2e
EU-27
10 CO2e
Middle- East
11 CO2e
Russia
15 CO2e
Source: Institut für angewendte Ökologie (Öko-institut e.V.) , report to the EU commission, 12. May 2011. Figures from 2008. Brazil: national energy-mix.
(21)
Production in Norway reduces global emissions Emission of climate gas per tonne aluminium

Energy Consumption Development
kW
h/k
g A
l
Karmøy
1967
17,5
Hydro
1993
15.0 14.8
Hydro
1998
Hydro
2003
14.4
Global
avg.*
2012
14.1 13.9
Hydro
avg.
2012
13.5
HAL300
2013
12.5
HAL4e
2012
11.8-11.5 10 kW
HAL4e
Ultra
Hydro
Vision
Historical Data
Medium Term Ambition
Long Term Vision
Short Term Ambition
HAL4e
2014
12.3
10
* Global average ex. China
Hydro Smelter Technology – Energy efficiency

Systematic effort in order to reduce energy
consumption

(24)
Targeting high productivity & low energy consumption
11 Current density
13
12
Energy consumption (kWh/kg)
HAL4e
High productivity
Low energy
HAL300

(25)
Better
Cell Technology
HAL4e

Aluminium cell

(27)
HAL4e in operation since May 2008 – now at 450 kA

Technology need to be implemented
Bridging R&D and full production
(28)

(29)
Towards 11 kWh/kg...
− Millivolt chasing & bottleneck removal
− Operate at shorter interpolar distance
− Improved process control & stability
− Improved feeding technology
− Heat balance challenges
− New materials
− Heat recovery
Improve process stability
Millivolt chasing
Heat management
Heat management
Heat management
Millivolt chasing
Millivolt chasing
Heat management
Millivolt chasing
... and 10
kWh/kg
Spin-off technology elements and increased competence into Hydro plants

Magnetic Field Calculations

Hydro Double pot-room Technology
HAL250 potroom
Single row potroom
Competitors Technology
Hydro’s Technology
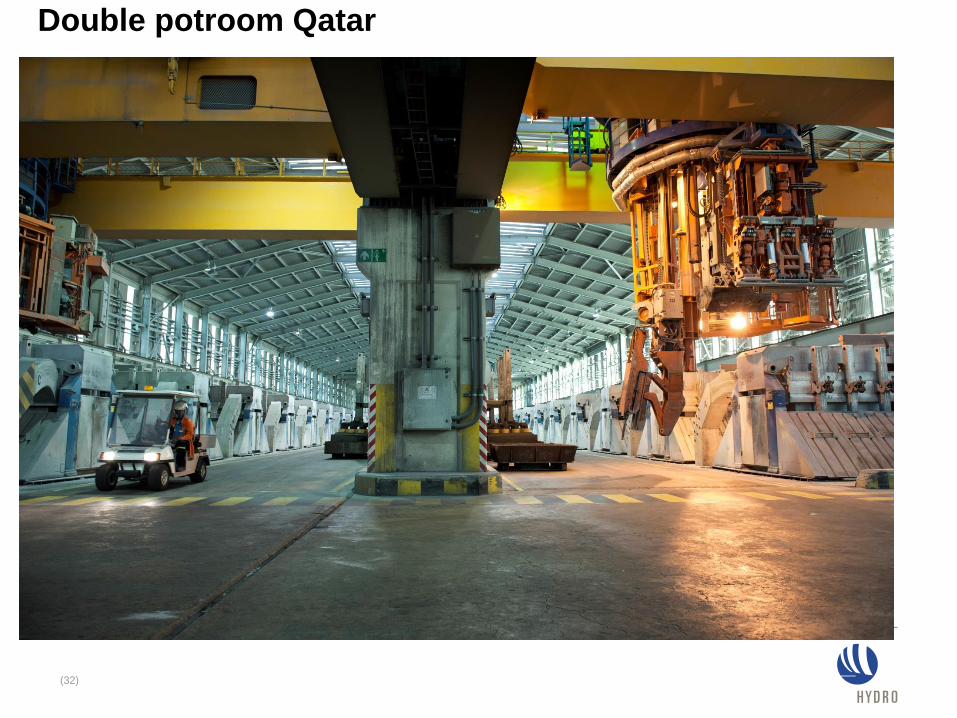
Double potroom Qatar
(32)

HAL4e Pilot Plant Project - Location on old Søderberg site at Karmøy
(33)
Pilot Plant 74.000 tpy
Confidential, 2013-10-30
Existing 190.000 tpy

(34)
Bigger
Growth and
Improvements

Precision culture
Investing in developing our precision culture
World-class production requires stability
(35)
Stability
Fire fighting
Technology step
Process Control
Levers for success – capitalizing on technology and competence
80 85 90 95 100 105
Pe
rfo
rma
nce
Tech 1
Tech2
Model based
Prod limit
80 85 90 95 100 105
Pe
rfo
rma
nce
Tech 1
Tech2
Model based
Prod limit

(36)
We have a history of continuous growth and improvements:
Metal volume from existing potlines has increased with more than 100.000 tons over some years

(37)
90
95
100
105
110
115
120
125
130
2006 2008 2010 2012 E2014
~100 000 mt1
Technology and competence
driven volume growth
Larger anodes
New cathode technology
Improved process control
system
Modeling tools
AMPS
Production development in Norwegian fully-owned smelters, indexed from 2005
~100 000 mt1
Fully-owned smelters – increasing output from
existing lines, gaining productivity
1) Not including Hydro Husnes
.

(38)
Better
Bigger
Greener
The Pilot plant

HAL4e Pilot Plant – 60 cells, 74 ktpy
48 cells: HAL4e 12 cells: HAL4eUltra
450 kA @ 12.3 kWh/kg 415 kA @ 11.8-11.5 kWh/kg

HAL4e Pilot Plant Project - Location on old Søderberg site at Karmøy
(40)
Pilot Plant 74.000 tpy
Existing 190.000 tpy
