hydro - the aluminium and power investment opportunity · pro forma figures for acquisition of...
TRANSCRIPT

2007-05-07
Hydro - The aluminium and power investment opportunity
Executive Vice President and CFO, John Ottestad
Merrill Lynch Global Metals & Mining ConferenceDublin, 9 May 2007
Date: 2007-05-07 • Page: 2 •
Agenda
Focused aluminium company - Core business areas- Market position- Strategy for growth
’New’ Hydro as an investment opportunity

Date: 2007-05-07 • Page: 3 •
Significant value creation through restructuring
61
40
52
87
169
NOK billion
2007**
* 4 January 1999 close, nominal value** 30 April 2007 close. Aluminium and Oil & Energy based on transaction equation adjusted for dividend payments
348
HYDRO
Oil & Gas
Aluminium& Power
1999*
Dividends& Buybacks
Conglomerate
Fertilizer

Date: 2007-05-07 • Page: 4 •
Share price development (NYSE)
Source: Yahoo Finance, NYSE, USD
462 %
49 %
69 %
79 %
89 %
91 %
116 %
119 %
142 %
143 %
189 %
221 %
0 % 100 % 200 % 300 % 400 % 500 %
BP
Shell
RepsolYPF
Alcoa
Chevron
Alcan
ExxonMobil
ENI
BG Group
Total
ConocoPhillips
Hydro1 January 1999 to 1 May 2007

Date: 2007-05-07 • Page: 5 •
’New’ Hydro share price appreciation 51% following the instant 19% increase at demerger announcement
9 %
14 %
20 %
51 %
Source: Yahoo Finance, NYSE, USD
Relative development NYSE 18 December 2006 – 1 May 2007
”New” Hydro
Alcan
Alcoa
Oslo Stock Exchange
Benchmark Index
Date: 2007-05-07 • Page: 6 •
Automotive
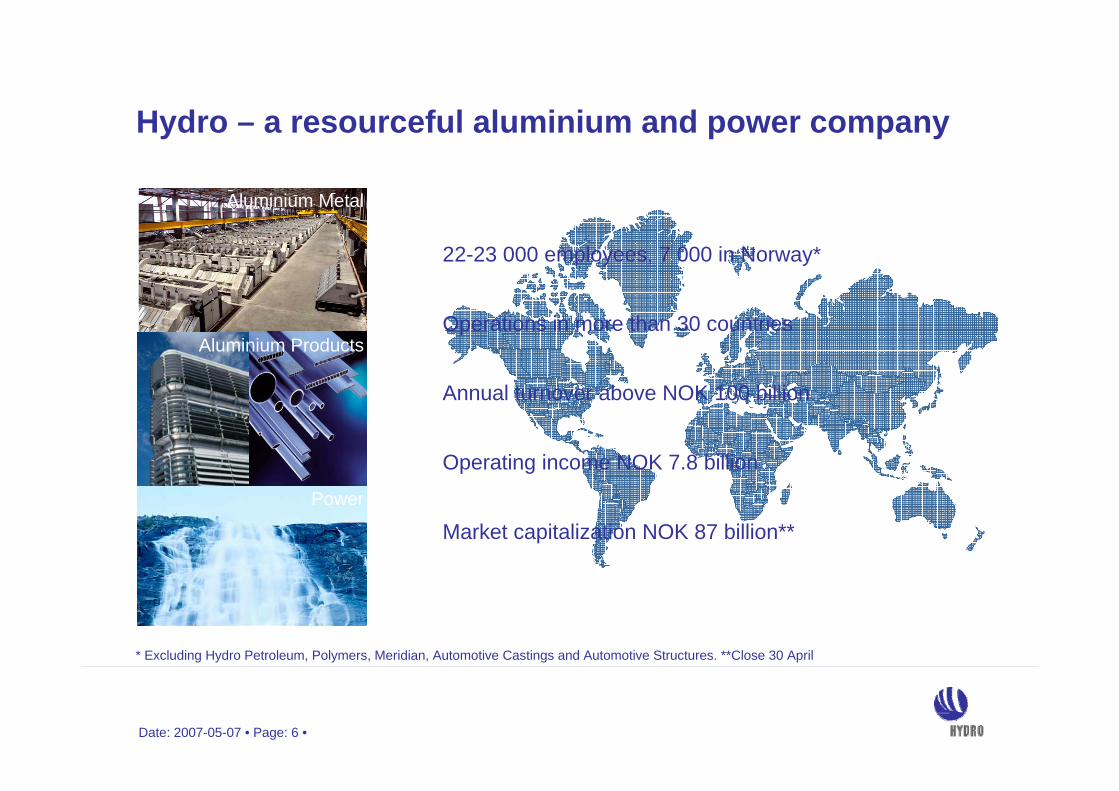
Hydro – a resourceful aluminium and power company
22-23 000 employees, 7 000 in Norway*
Operations in more than 30 countries
Annual turnover above NOK 100 billion
Operating income NOK 7.8 billion
Market capitalization NOK 87 billion**
Aluminium Metal
Aluminium Products
Power
* Excluding Hydro Petroleum, Polymers, Meridian, Automotive Castings and Automotive Structures. **Close 30 April

Date: 2007-05-07 • Page: 7 •
Strong aluminium industry position
2 50
0
915 1 04
0
3 15
1
930
260
230
616
985
163
3 55
2
3 40
6
1 79
9
3 90
0
1 93
0
1 35
9
845
550
429
Alcoa¹ Alcan Hydro United Rusal
Chalco BHP Billiton
Rio Tinto
CVRD Novelis/Hindalco
Aleris Sapa/Alcoa
JV
Pro
duct
ion
in 1
000
tonn
es in
200
6
Primary Rolled Extrusions Other
Integrated Emerging Market Mining & Metal Manufacturing
23
1. Alcoa pro forma for SAPA JV on extrusion.2. Pro forma figures for acquisition of Corus Aluminium’s rolled and extrusions businesses3. Pro forma figures for acquisition of Novelis rolled businesses. Hindalco figures fiscal year ended 31. March 2006 4. Pro forma figures for merger of Rusal, Sual and Glencore
Date: 2007-05-07 • Page: 8 •
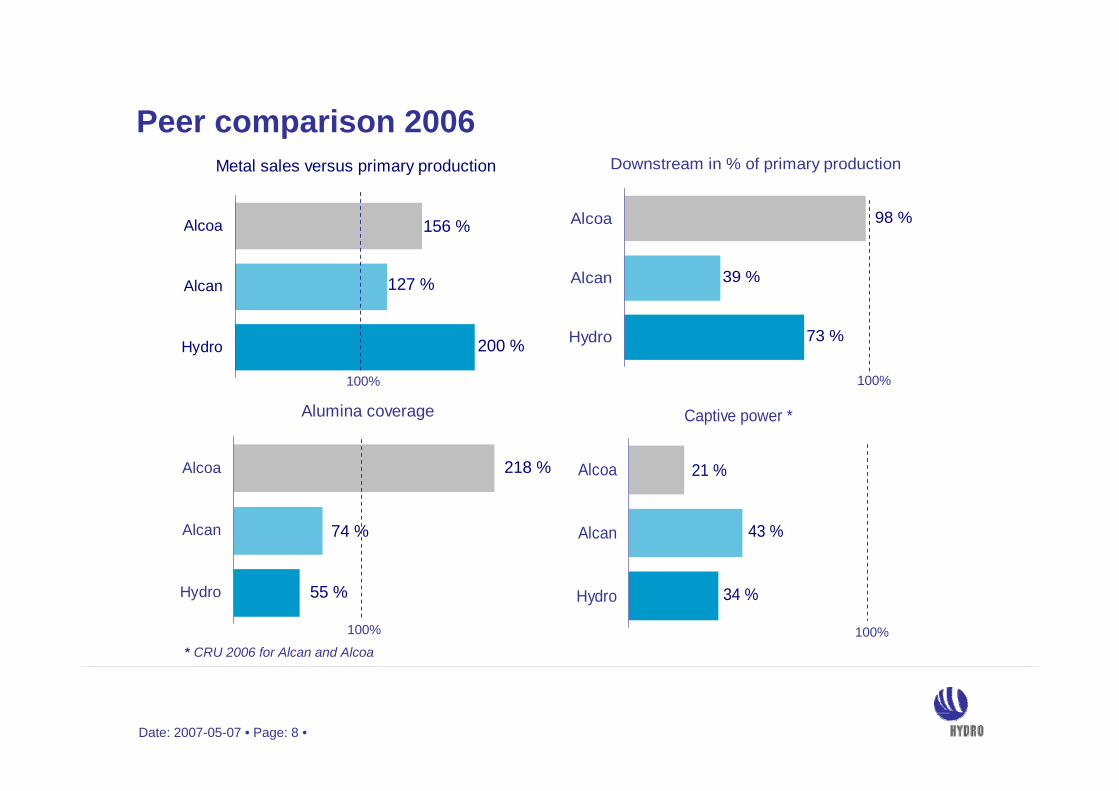
Peer comparison 2006
Alumina coverage
218 %
74 %
55 %Hydro
Alcan
Alcoa
Captive power *
34 %
43 %
21 %
Hydro
Alcan
Alcoa
Metal sales versus primary production
156 %
127 %
200 %Hydro
Alcan
Alcoa
Downstream in % of primary production
73 %
39 %
98 %
Hydro
Alcan
Alcoa
* CRU 2006 for Alcan and Alcoa100%
100%
100%
100%
Date: 2007-05-07 • Page: 9 •
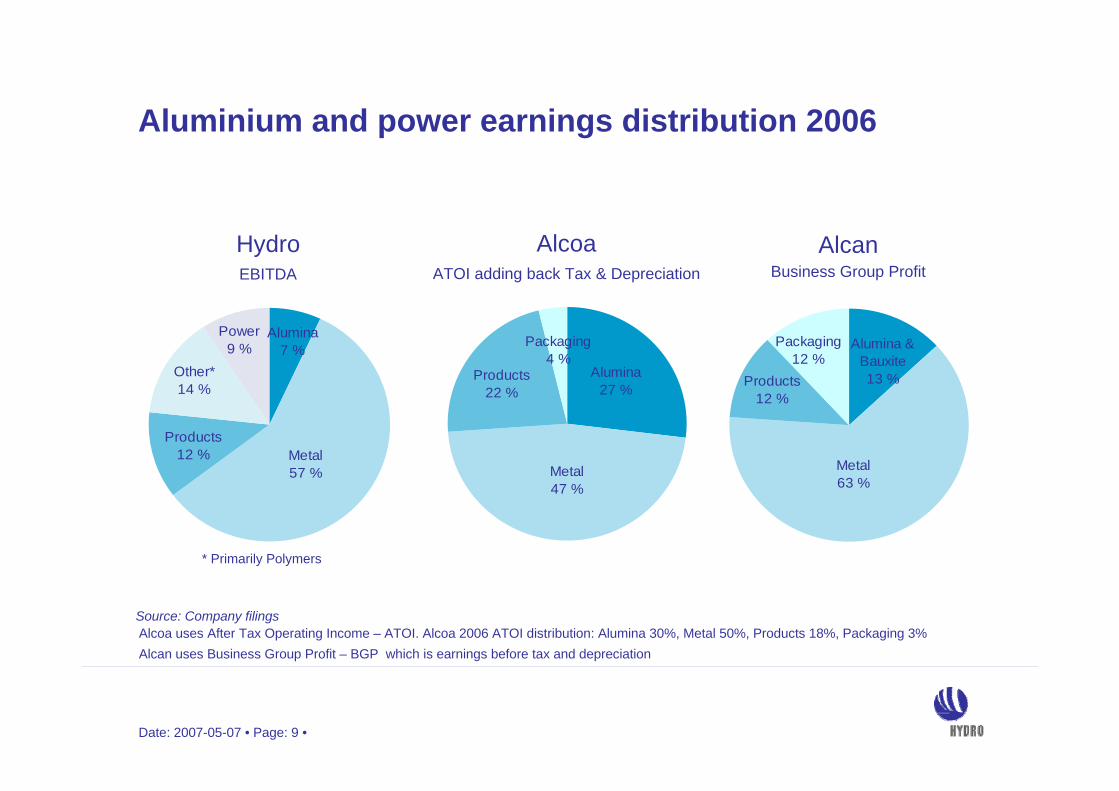
Aluminium and power earnings distribution 2006
Power9 %
Products12 %
Other*14 %
Alumina 7 %
Metal 57 %
HydroEBITDA
AlcoaATOI adding back Tax & Depreciation
AlcanBusiness Group Profit
Source: Company filings
Packaging4 %
Alumina27 %
Products22 %
Metal47 %
Packaging12 %
Alumina & Bauxite13 %Products
12 %
Metal63 %
Alcoa uses After Tax Operating Income – ATOI. Alcoa 2006 ATOI distribution: Alumina 30%, Metal 50%, Products 18%, Packaging 3%Alcan uses Business Group Profit – BGP which is earnings before tax and depreciation
* Primarily Polymers

Date: 2007-05-07 • Page: 10 •
Aluminium MetalAluminium Metal

Date: 2007-05-07 • Page: 11 •
0
250
500
750
1 000
1 250
1 500
1 750
2 000
2 250
2 500
0 % 25 % 50 % 75 % 100 %
Cumulative production
Industry costs rising – Hydro’s position improved
Significant shift in industry cost curve*
* Source: CRU (Corporate operating cost definition) Assumptions: LME 3m 2 635 USD/ton, Alumina spot USD 472/ton, USD 6.57
2003
2006
2003 industry ave. 1 120
2006 industry ave. 1 640
Cost (USD/ton) Alumina- Two thirds of cost increase- Coming down from peak
Energy- Oil and gas prices - Coal prices- CO2 emission trading- Supply/demand for electricity
Other raw materials
Freight
2003 Hydro average 1 1202006 Hydro average 1 547
Hydro 1 547
Hydro 1 120
Date: 2007-05-07 • Page: 12 •
585 000 tons annually – expansion potential to 1.2 million tons annually
First quartile operating cost – captive gas power
50/50 joint venture between Hydro and Qatar Petroleum
Proprietary smelting technology
Final cost estimate and build decision summer 2007
Qatalum project – profitable mega-smelter in key region
Date: 2007-05-07 • Page: 13 •
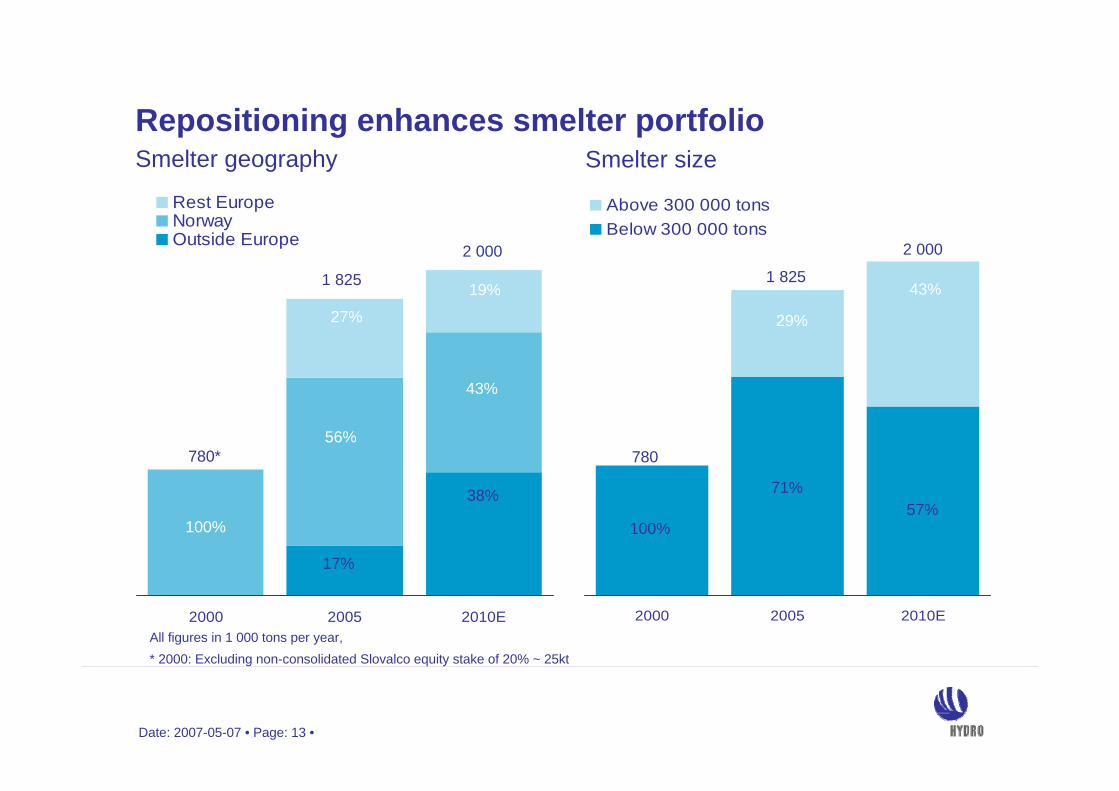
2000 2005 2010E
Rest EuropeNorwayOutside Europe
Repositioning enhances smelter portfolio
2000 2005 2010E
Above 300 000 tonsBelow 300 000 tons
780*
1 825
2 000
780
1 825
2 000
100%
56%
43%
38%
17%
100%
71%57%
29%
43%
Smelter geography Smelter size
All figures in 1 000 tons per year, * 2000: Excluding non-consolidated Slovalco equity stake of 20% ~ 25kt
19%
27%

Date: 2007-05-07 • Page: 14 •
Alunorte alumina refinery – key asset in repositioning
Targeting 6.5 million ton production by 2009
Hydro stake 34 percent of world’s largest refinery
First-quartile investment costs and highly competitive conversion costs
Platform for pursuing new opportunities in Brazil and other bauxite rich areas
Date: 2007-05-07 • Page: 15 •
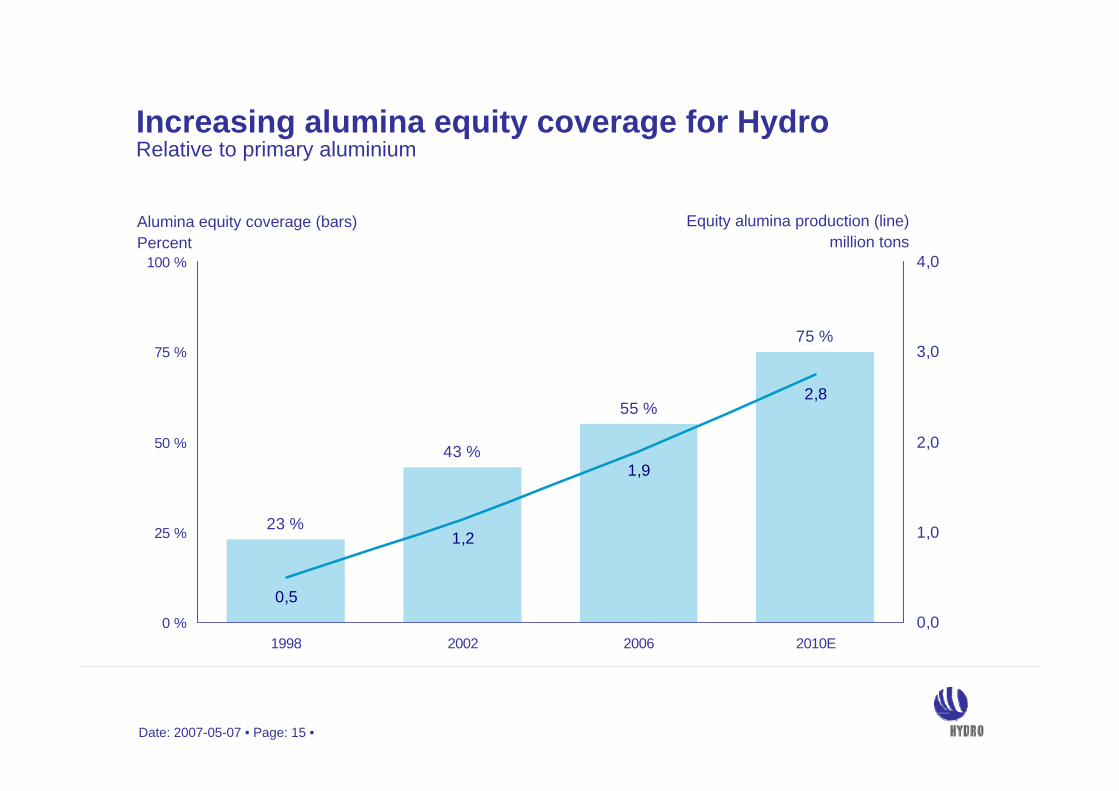
Increasing alumina equity coverage for HydroRelative to primary aluminium
23 %
43 %
55 %
75 %
0,5
1,2
1,9
2,8
0 %
25 %
50 %
75 %
100 %
1998 2002 2006 2010E0,0
1,0
2,0
3,0
4,0
Equity alumina production (line)million tons
Alumina equity coverage (bars) Percent
Date: 2007-05-07 • Page: 16 •
Aluminium ProductsAluminium Products
Date: 2007-05-07 • Page: 17 •
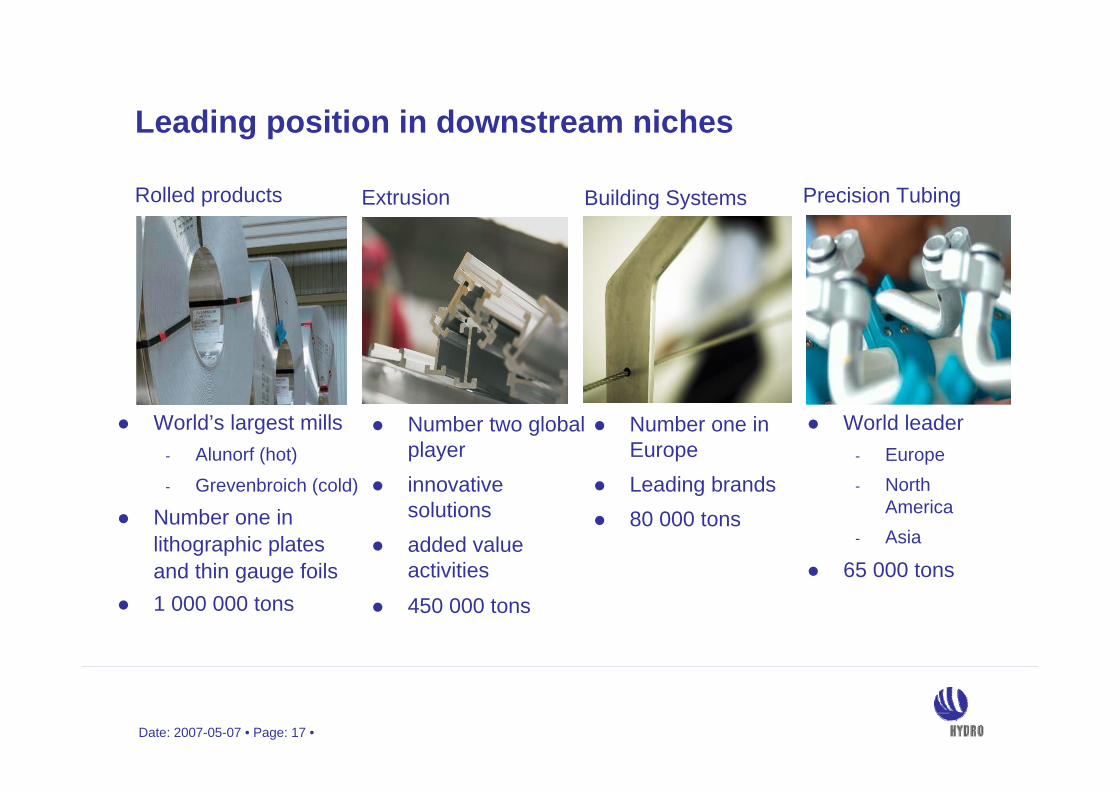
Leading position in downstream niches
Number one in EuropeLeading brands80 000 tons
Building SystemsExtrusion Precision Tubing
Number two global playerinnovative solutionsadded value activities
450 000 tons
World leader- Europe- North
America- Asia
65 000 tons
Rolled products
World’s largest mills- Alunorf (hot)- Grevenbroich (cold)
Number one in lithographic plates and thin gauge foils1 000 000 tons

Date: 2007-05-07 • Page: 18 •
Strengthened profitability
1) Including Extrusion Europe, Extrusion Overseas, Building Systems and Precision Tubing, 2) Including Automotive Structures only
Roa
CE
Extrusion 1) Rolled Products Automotive 2)
9.5%
Remaining assets
4%
NOK 5.9 billion NOK 8.9 billion
Capital employed: NOK 15.7 billion
NOK 0.9 billion
Planned divestments
Date: 2007-05-07 • Page: 19 •
PowerPower

Date: 2007-05-07 • Page: 20 •
Power production has built Hydro’s industry
Power production has built Hydro’s industry
Energy competence is an integral part of aluminium growth ambitions
Well-developed production assets provide stable cash-flow
Power competence to support growth strategy
Captive hydropower – a solid basis for aluminium smelting

Date: 2007-05-07 • Page: 21 •
Hydroelectric power production and concessions
Norway’s second largest hydroelectric power producer
- 1 860 MW installed capacity- 9 TWh normal production/year
Acquired power under long-term contracts in Norway until2020 ~ 7 TWh
Low production costs and investments
Production volume and year for potential reversionto the state
2.7
3.6
2.7
Telemark
Sogn
RøldalSuldal
TWh
2022
2044-2057
No reversion

Date: 2007-05-07 • Page: 22 •
FinancialsFinancials

Date: 2007-05-07 • Page: 23 •
Competitive return on capital
Source: Bloomberg return on capital methodology. 12 month rolling Q1 2003-Q4 2006. Hydro figures are approximations to Bloomberg methodology.* Alcoa and Alcan
0 %
2 %
4 %
6 %
8 %
10 %
12 %
14 %
16 %
2003 2004 2005 2006
Peer range * Aluminium
RoaCE

Date: 2007-05-07 • Page: 24 •
Strong results for ‘new’ Hydro businesses in 2006
0.51.2(0.4)2.09.8Other Activities(0.9)--(31.7)Corporate and Eliminations
(4.0)
(0.1)(1.7)(1.7)
Depreciation
14.2
1.31.79.1
Adjusted EBITDA
3.87.8102.6Total
0.041.26.3Power
2.06.468.4Aluminium MetalAluminium Products
NOK billion
1.3(0.1)49.8
InvestmentsOperating income
Operating revenues
Based on carve-out combined financial statements for Hydro after Demerger

Date: 2007-05-07 • Page: 25 •
‘New’ Hydro trades in line with aluminium peers
0,9
1,0
1,1
1,2
1,3
1,4
3-Jan-07 18-Jan-07 2-Feb-07 17-Feb-07 4-Mar-07 19-Mar-07 3-Apr-07 18-Apr-07
'New' Hydro* Alcoa Alcan
Relative development NYSE 1 January 2007 – 1 May 2007
26%19%35 %
* ‘New’ Hydro share price calculated as Hydro share price less Statoil share price less expected dividend multiplied by 0.8622
Date: 2007-05-07 • Page: 26 •
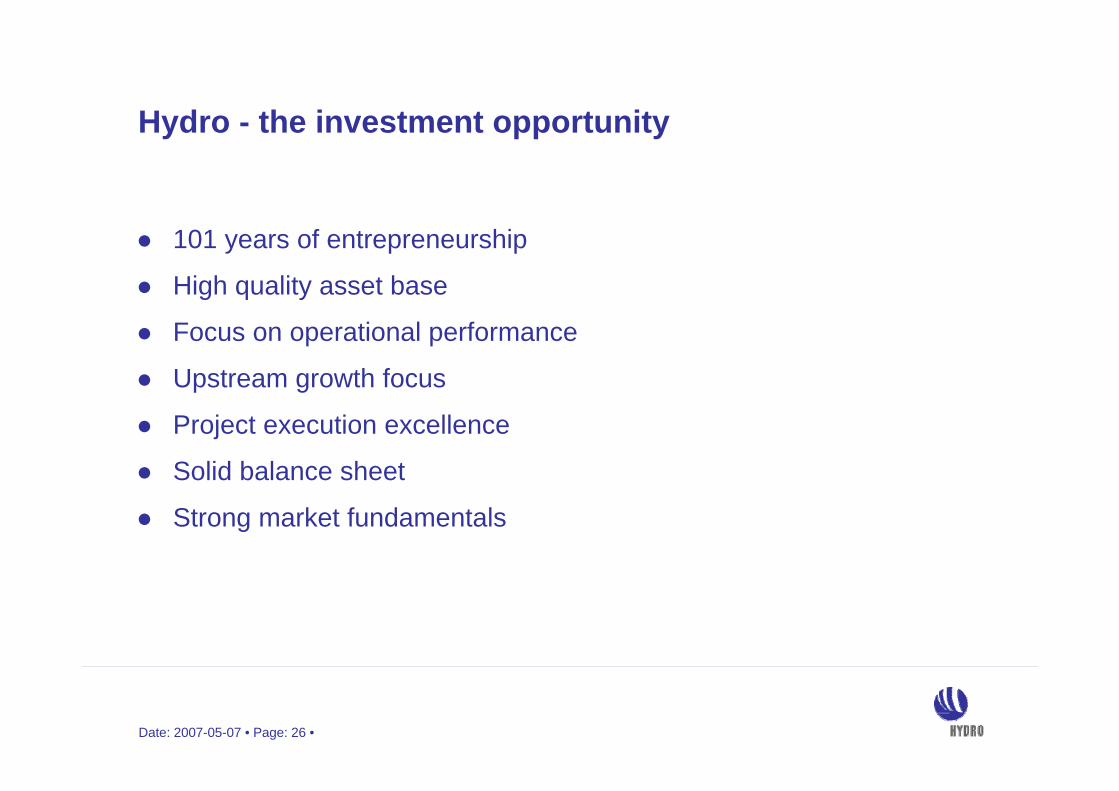
Hydro - the investment opportunity
101 years of entrepreneurship
High quality asset base
Focus on operational performance
Upstream growth focus
Project execution excellence
Solid balance sheet
Strong market fundamentals

Date: 2007-05-07 • Page: 27 •
Additional Financial InformationAdditional Financial Information

Date: 2007-05-07 • Page: 28 •
Segment information
4 423
2 694(370)1 123
(88)1 064
2005
7 808
6 362(83)
1 1851 229(885)
2006
2 018
7851 072
741274
(854)
2004
Total
Aluminium MetalAluminium ProductsPowerOther activitiesCorporate and eliminations
NOK million
12 293
4 8212 6701 2831 7471 772
2005
14 203
9 1341 7151 3371 995
23
2006
10 442
5 2973 058
8751 281
(69)
2004
Total
Aluminium MetalAluminium ProductsPowerOther activitiesCorporate and eliminations
NOK millionAdjusted EBITDA 1)
Operating income
1) EBITDA includes financial income, but is not adjusted for special items

Date: 2007-05-07 • Page: 29 •
Aluminium Metal financials
1 6291 8122 352Realized aluminium price LME (USD/ton)
4 2441 7921 979Investments 1)
1 720 0001 826 0001 799 000Primary aluminium production (tons)
3 7981 6871 728Depreciation
7852 6946 362Operating income
281272837Non-consolidated investees
5 2974 8219 134Adjusted EBITDA
51 95754 57968 405Operating revenues
11 813
2005
15 371
2006
11 403
2004
Realized aluminium price LME (NOK/ton)
NOK million
1) Includes non-cash element of NOK 186 million in 2005 and NOK 1 275 million in 2004 related to change in accounting principles (FIN47 and FIN46R)

Date: 2007-05-07 • Page: 30 •
Aluminium Products financials 1)
1 9511 9701 250Investments 2)
945 000950 0001 000 000Rolled Products sales volumes, tons
1 8482 9131 666Depreciation
1 072(370)(83)Operating income
6847(179)Non-consolidated investees
3 0582 6701 715Adjusted EBITDA
43 53342 47749 844Operating revenues
600 000
2005
640 000
2006
635 000
2004
Extrusion sales volumes, tons
NOK million
1) Excluding Automotive Castings which is reported as discontinued operations2) Includes non-cash element of NOK 9 million in 2005 related to change in accounting principles (FIN47)
Date: 2007-05-07 • Page: 31 •
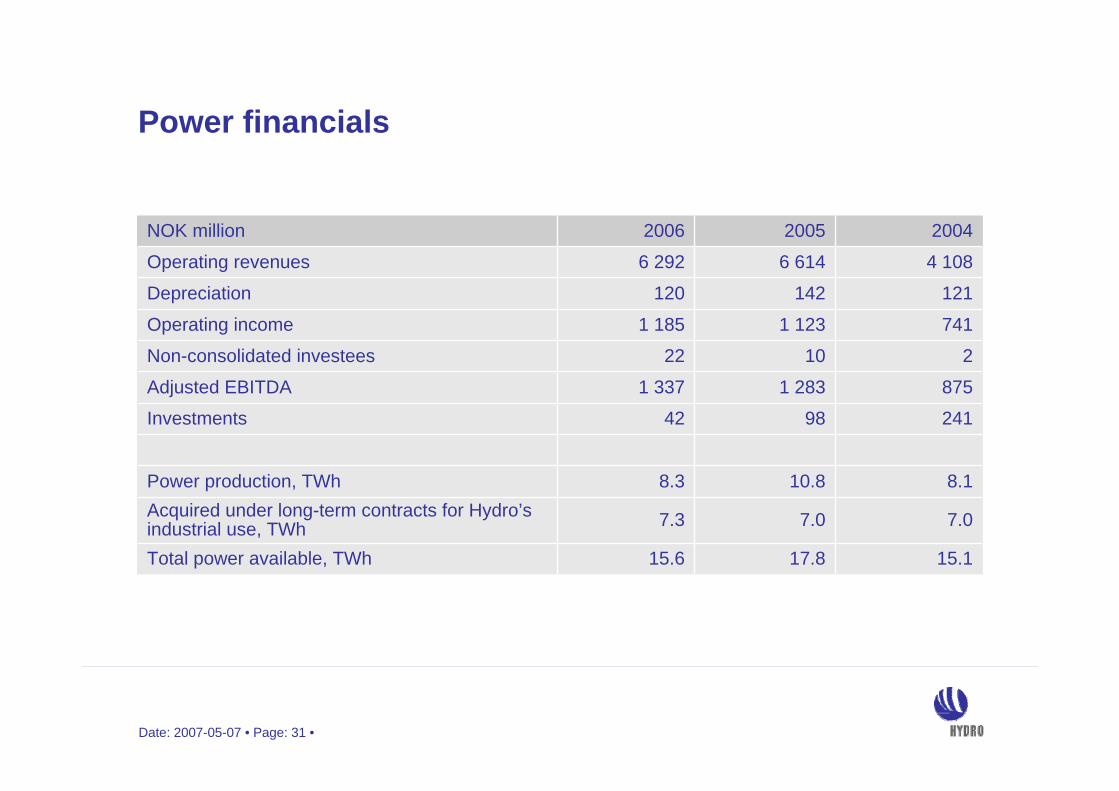
Power financials
2419842Investments
7.07.07.3Acquired under long-term contracts for Hydro’s industrial use, TWh
8.110.88.3Power production, TWh
121142120Depreciation
7411 1231 185Operating income
21022Non-consolidated investees
8751 2831 337Adjusted EBITDA
4 1086 6146 292Operating revenues
17.8
2005
15.6
2006
15.1
2004
Total power available, TWh
NOK million

Date: 2007-05-07 • Page: 32 •
Combined income statements – Hydro after demerger
(78)-Cumulative effect of change in accounting principles4 9536 493Net income
3 9751 259
82 444
3 674289
90 863
Depreciation, depletion and amortizationImpairment lossesOther operating costs
3.90
5 031174
4 857
6 372(1 397)
(118)
491533924
4 423
92 1002005
167Income from discontinued operations
5.20
6 493
6 327
8 714(2 186)
(202)
761146
-
7 808
102 6322006
Earnings per share – NOK
Income before cumulative effect of change in accounting principles
Income from continuing operations
Income from before tax and minority interestIncome tax expense Minority interest
Non-consolidated investeesFinancial income (expense), netOther income, net
Operating income
Operating revenuesNOK million
For calculation of EPS, 2006: 1 240 804 344 shares, 2005: 1 254 036 520 sharesPreviously reported earnings per share and total number of outstanding shares have been adjusted to reflect the 5-for-1 stock split effective 10 May _2006.

Date: 2007-05-07 • Page: 33 •
Combined balance sheets – Hydro after demerger
72211 4373 100
-981
43 729
36712 6541 080
273707
49 190
Long-term interest-bearing debtOther long-term liabilitiesDeferred tax liabilitiesLong-term liabilities in disposal groupMinority interestShareholders' equity
8 60134 62311 272
-
8 78031 1588 1542 569
Non-consolidated investeesProperty, plant and equipmentOther non-current assetsNon-current assets held for sale
108 012
2 084424
19 22721 269
738
108 012
6 60915 020
20020 18114 2201 122
31 December 2006
101 426
2 672190
20 29318 302
-
101 426
10 2663 859
77919 07312 952
-
31 December 2005
Total liabilities and shareholders' equity
Short-term interest-bearing debtCurrent portion of long-term debtCurrent liabilities Hydro PetroleumOther current liabilitiesCurrent liabilities in disposal group
Total assets
Cash and cash equivalentsShort-term investmentsReceivable Hydro PetroleumReceivables and other current assetsInventoriesCurrent assets held for sale
NOK million
Date: 2007-05-07 • Page: 34 •
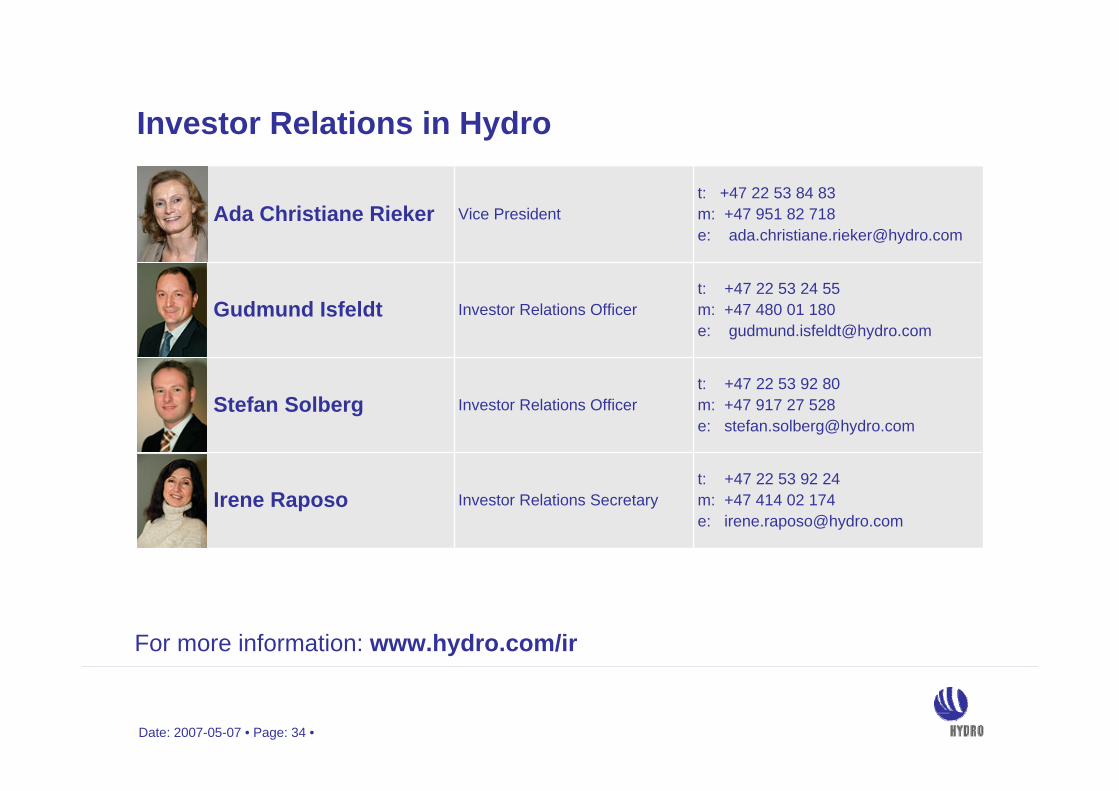
Investor Relations in Hydro
For more information: www.hydro.com/ir
Investor Relations Secretary
Investor Relations Officer
Investor Relations Officer
Vice President
t: +47 22 53 92 24m: +47 414 02 174e: [email protected]
t: +47 22 53 92 80m: +47 917 27 528e: [email protected]
t: +47 22 53 24 55m: +47 480 01 180e: [email protected]
t: +47 22 53 84 83 m: +47 951 82 718e: [email protected]
Stefan Solberg
Ada Christiane Rieker
Gudmund Isfeldt
Irene Raposo

Date: 2007-05-07 • Page: 35 •
Certain statements contained in this announcement constitute “forward-looking information” within the meaning of Section 27A of the US Securities Act of 1933, as amended, and Section 21E of the US Securities Exchange Act of 1934, as amended. In order to utilize the “safe harbors” within these provisions, Hydro is providing the following cautionary statement.
Certain statements included within this announcement contain (and oral communications made by or on behalf of Hydro may contain) forward-looking information, including, without limitation, those relating to (a) forecasts, projections and estimates, (b) statements of management’s plans, objectives and strategies for Hydro, such as planned expansions, investments, drilling activity or other projects, (c) targeted production volumes and costs, capacities or rates, start-up costs, cost reductions and profit objectives, (d) various expectations about future developments in Hydro’s markets, particularly prices, supply and demand and competition, (e) results of operations, (f) margins, (g) growth rates, (h) risk management, as well as (i) statements preceded by “expected”, “scheduled”, “targeted”, “planned”, “proposed”, “intended” or similar statements.
Although Hydro believes that the expectations reflected in such forward-looking statements are reasonable, these forward-looking statements are based on a number of assumptions and forecasts that, by their nature, involve risk and uncertainty. Various factors could cause Hydro’s actual results to differ materially from those projected in a forward-looking statement or affect the extent to which a particular projection is realized. Factors that could cause these differencesinclude, but are not limited to, world economic growth and other economic indicators, including rates of inflation and industrial production, trends in Hydro’s key markets, and global oil and gas and aluminium supply and demand conditions. For a detailed description of factors that could cause Hydro’s results to differ materially from those expressed or implied by such statements, please refer to the risk factors specified under “Risk review – Risk Factors” on page 134 of Hydro’s Annual Report 2006 and subsequent filings on Form 6-K with the US Securities and Exchange Commission.
No assurance can be given that such expectations will prove to have been correct. Hydro disclaims any obligation to update or revise any forward-looking statements, whether as a result of new information, future events or otherwise.
Cautionary note in relation to certain forward-looking statements
With respect to each non-GAAP financial measure Hydro uses in connection with its financial reporting and other public communications, Hydro provides a presentation of what Hydro believes to be the most directly comparable GAAP financial measure and a reconciliation between the non-GAAP and GAAP measures. This information can be found in Hydro's earnings press releases, quarterly reports and other written communications, all of which have been posted to Hydro's website (www.hydro.com).
Use of non-GAAP financial measures