hydrocarbon plume characterisation & remediation in a
TRANSCRIPT

Hydrocarbon Plume Characterisation & Remediation in a Densely Abstracted Chalk AquiferAdrian Bhreathnach MBA MSc PgDip BSc PIEMA
Director m: 07743 319710

Telling a Story
• Background
• Objectives
• The Challenges
• Implementation & Progress
• Lessons Learned

BACKGROUND
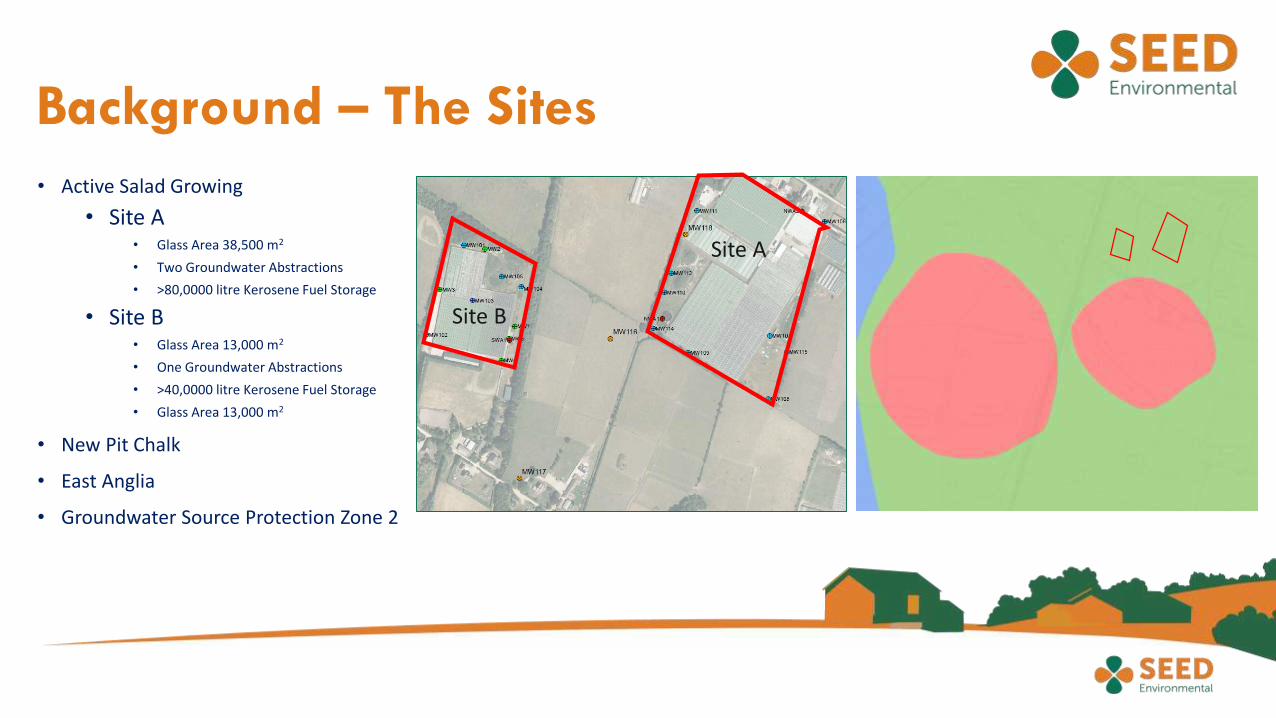
Background – The Sites
• Active Salad Growing
• Site A• Glass Area 38,500 m2
• Two Groundwater Abstractions
• >80,0000 litre Kerosene Fuel Storage
• Site B• Glass Area 13,000 m2
• One Groundwater Abstractions
• >40,0000 litre Kerosene Fuel Storage
• Glass Area 13,000 m2
• New Pit Chalk
• East Anglia
• Groundwater Source Protection Zone 2
Site A
Site B

Background – The Release
• Site B – Pump in Abstraction Well located at 25m bgl - Kerosene
• Subsequently – Kerosene identified in Site A Abstraction Well (220m upgradient)
• Loss of kerosene heating oil – 4No OST’s - >500 litres / hr usage @ <5oC
• Source of kerosene identified as underground fuel oil delivery line over approximately 6 years

Site A
Site B
Background - The Source
Chilcott. HPA, 2006.

Background -The Receptors

OBJECTIVES
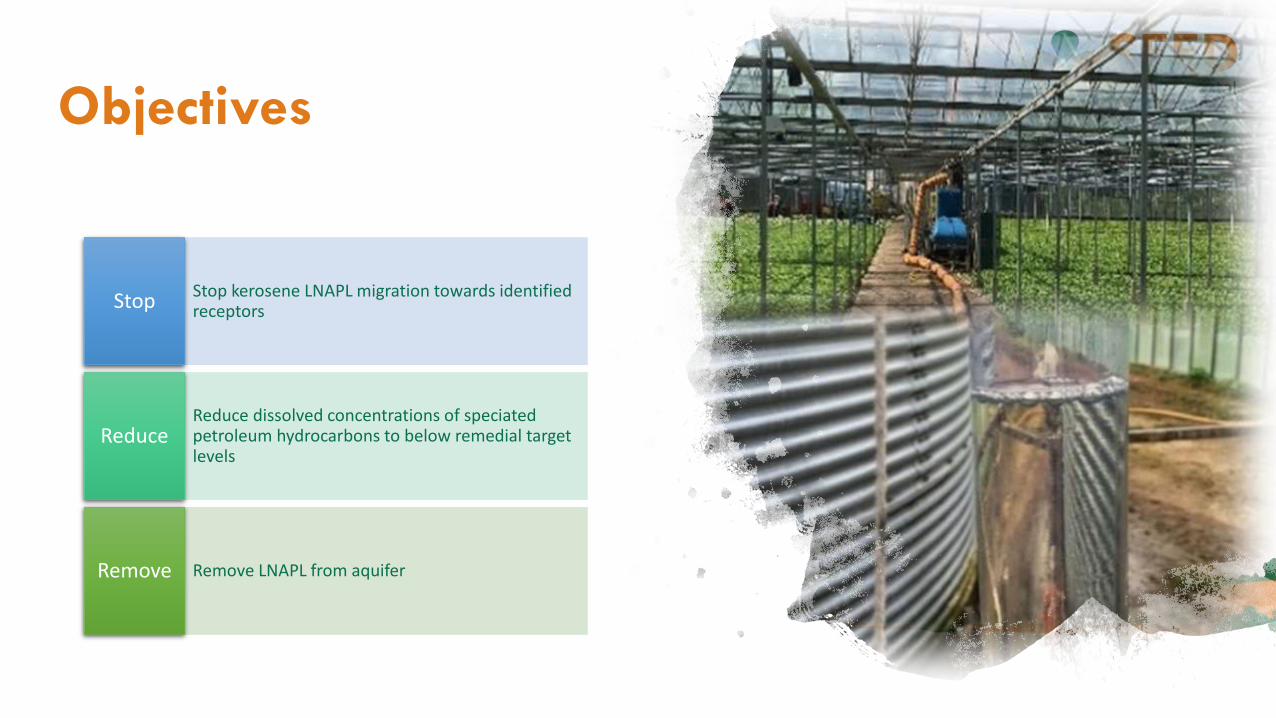
Stop kerosene LNAPL migration towards identified receptorsStop
Reduce dissolved concentrations of speciated petroleum hydrocarbons to below remedial target levels
Reduce
Remove LNAPL from aquiferRemove
Objectives
THE CHALLENGES

Overcoming Obstacles & Design (1)The Sites • Business Continuity
• Glass Houses
• Groundwater >20m bgl
The Regulations • Environmental Permit Regulations & Position Statement 3A
• Water Resources Act 1991
• Zero Capacity
The Discharge• No Foul Sewer within 1km
• No Surface Water
• Contaminated Chalk Aquifer

Overcoming Obstacles & Design (2)Data Inconsistencies• Consultant Well Sampling – Inconsistent Results & Trends
• Historical water table levels
Contaminant Transport Routes• Fracture Flow
• Migration Flux Rate (750,000 litres / day)
• Migration Depths (~22m & ~24m bgl)
IMPLEMENTATION &PROGRESS

Stage 1
•Plume Management (Groundwater)
•Low-Flow Fracture Plume Containment
Stage 2
•Source Management (Soils)
•Excavation & Soil Vapour Extraction
Stage 3
•Active Removal – Free Oil & Dissolved Phase
•Targeted Flow Abstraction & Optimisation
Stage 4
•Enhanced Biodegradation (O2 Injection)
•Natural Attenuation
Remediation Stages480,000 litres / day 854,000 litres / day
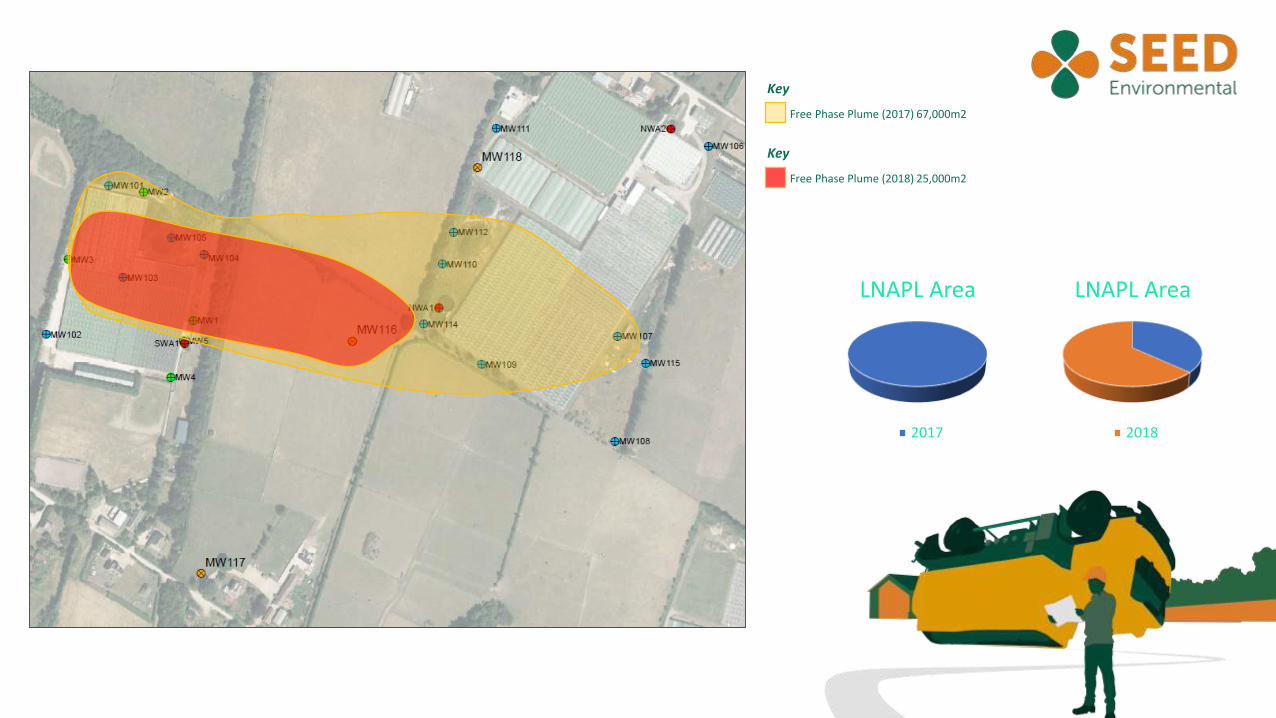
Key
Free Phase Plume (2017) 67,000m2
Key
Free Phase Plume (2018) 25,000m2
LNAPL Area
2017
LNAPL Area
2018

Key
>100 µg/l
>1,000 µg/l
>10,000 µg/l
>100,000 µg/l
Dissolved Phase Contamination Plume (2017)

Dissolved Phase Contamination Plume (2018)
Key
>100 µg/l
>1,000 µg/l
>10,000 µg/l
>100,000 µg/l
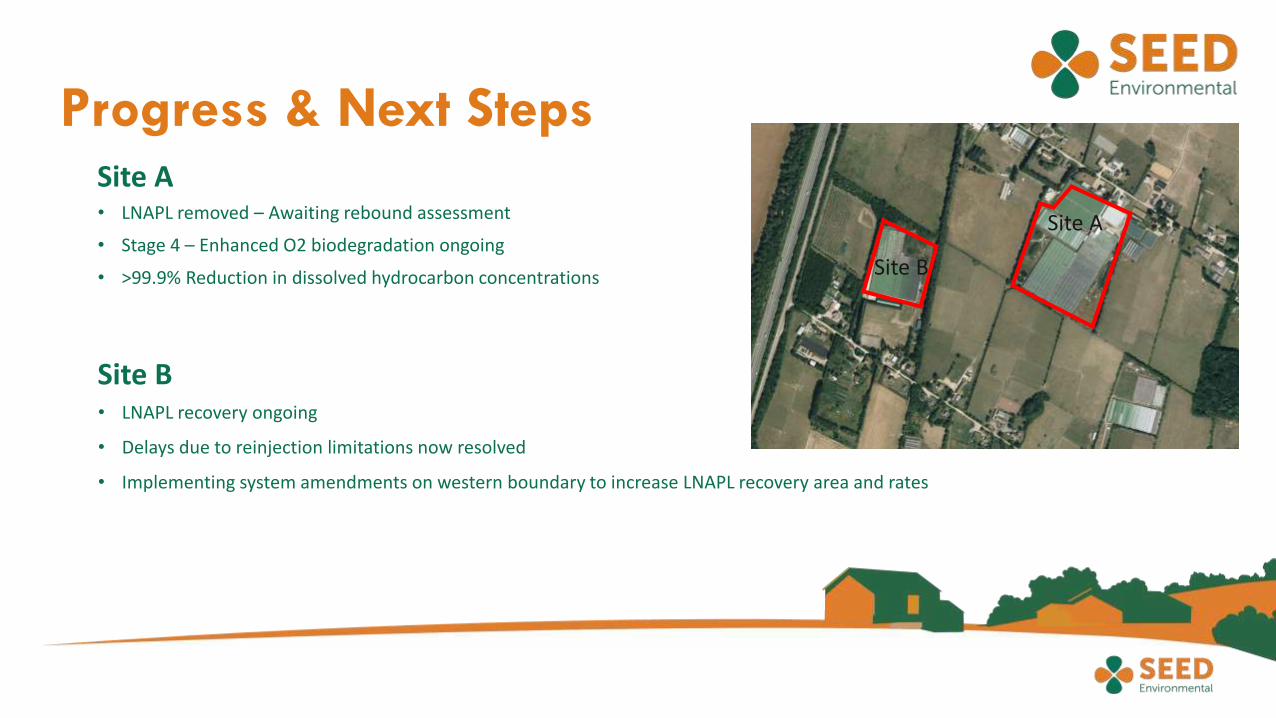
Progress & Next StepsSite A• LNAPL removed – Awaiting rebound assessment
• Stage 4 – Enhanced O2 biodegradation ongoing
• >99.9% Reduction in dissolved hydrocarbon concentrations
Site B• LNAPL recovery ongoing
• Delays due to reinjection limitations now resolved
• Implementing system amendments on western boundary to increase LNAPL recovery area and rates
Site A
Site B

Lessons Learned

Take Forward Messages
• Timely regulator engagement and enforcement flexibility is critical to effective pollution control.
• Critical project data informing decision making needs to be consistent, reliable and that any ‘irregularities’ need to be understood prior to remediation design.
• Innovative site characterization techniques can also be deployed during remediation to provide effective low-flow and targeted groundwater treatment solutions in Chalk aquifers.
• A great example of the time and financial benefits of prioritising conceptual understanding, effective characterization and remediation design.