hydrocarbon polymeric binder for …...&» re-order no. c hydrocarbon polymeric binder for...
TRANSCRIPT

&» RE-ORDER NO.
CHYDROCARBON POLYMERIC BINDER
FOR ADVANCED SOLID PROPELLANT
PERIOD COVERED: February 1, 1971to
April 30, 1971
This work was performed for the Jet Propulsion Laboratory, California Instituteof Technology, as sponsored by the National Aeronautics and Space Administrationunder Contract NAS 7-100.
Report Edited By:
Contributors:
James E. Potts
A. C. Ashcraft, Jr.J . .E . PottsE. W. Wise
UCC
Publication Date: May 15, 1971
Jet Propulsion Laboratory Contract No. 951210
Technically Managed-By: H. E. Marsh, Jr. - JPL
UNION CARBIDE CORPORATIONCHEMICALS AND PLASTICS
Polymer Research and DevelopmentBound Brook, New Jersey
K
f
v:
https://ntrs.nasa.gov/search.jsp?R=19720025117 2020-04-25T21:10:11+00:00Z

TECHNICAL CONTENT STATEMENT
This report contains information prepared by Union Carbide Corporation,Chemicals and Plastics Operations Division, under J .P .L. subcontract. Itscontent is not necessarily endorsed by the Jet Propulsion Laboratory, CaliforniaInstitute of Technology or the National Aeronautics and Space Administration.
D

TABLE OF CONTENTS
PageNo.
I. OBJECTIVE... 1
II. ABSTRACT .. 1
III. SCOPE OF PROJECT 2
IV. INTRODUCTION 2
V. TECHNICAL DISCUSSION
A. Molecular Weight Distributions of Hydroxy-Telechelic Polyisoprenes by Gel PermeationChromatography 2
B. Preparation of Ester-Telechelic Polyisoprene inthe 5-Gallon Stirred Autoclave Reactor 16
1. Polyisoprene Run No. 9769-CAK-2 16
2. Examination of Possible Factors in the LowFunctionality Attained in Run No. 9769-CAK-2 20
3. Implementation of Process Improvements 31
4. Polymerization Run No. 9706-ACA-105 37
VI. PLANS FOR FUTURE WORK 39

I. OBJECTIVE
Union Carbide Corporation, Chemicals and Plastics Operations Divisionhas agreed to assist the Jet Propulsion Laboratory, California Institute of Technology,on a level of effort basis, in the development of a new or improved polymeric binderfor advanced solid propellant grains. The general objectives are described inQuarterly Report No. 1.
II. ABSTRACT
Gel Permeation Chromatography (G.P.C.) was used to determine themolecular weight distributions in hydroxy-telechelic polyisoprene samples A,B, C and D. The molecular weight distributions were monomodal and narrowwith the polydispersity index, Aw/A~n, increasing with molecular weight from1.5 at a Mn of 1200 up to about 2.0 at a molecular weight of 2900. A very goodcorrelation was obtained between the values ot~An determined by GPC and Mnvalues determined by vapor pressure osmometry.
Various experimental factors were examined to determine the source ofdifficulty in an isoprene polymerization in the 5-gallon reactor which gave anon-uniform product of low functionality. It was concluded that processimprovements relating to initiator and monomer purity were desirable, but thatthe main difficulty was in the initiator feed system. A new pumping system wasinstalled and an analog simulation of the reactor, feed system and initiatordecomposition kinetics was devised which permits the selection of initialinitiator concentrations and feed rates to use to give a nearly uniform initiatorconcentration throughout a polymerization run. An isoprene polymerization wasrun in which the process improvements were implemented. This run resulted inthe preparation of an ester telechelic polyisoprene of 2290 Mn having an averagefunctionality of 1.98 + .02.

III. SCOPE
The scope of our program remains as previously outlined.
IV. INTRODUCTION
In our previous reports we outlined the preparation and discussedthe characterization of four samples of hydroxy-telechelic polyisoprene -samples A, B, C and D. In this report we show the results obtained when-these products were analyzed by Gel Permeation Chromatography to determinetheir molecular weight distribution. In addition to the utility of this analyticaltool to characterize the molecular weight distribution in binder prepolymers,evidence is presented which indicates that, once calibrated for a given polymer,GPC may give a more consistently reliable determination of Mn than vaporpressure osmometry.
Additional isoprene polymerizations in the 5-gallon stirred autoclavereactor are also described in the report.
V. TECHNICAL DISCUSSION
A. Molecular Weight Distributions of Hydroxy-TelechelicPolyisoprene by Gel Permeation Chromatography
In a previous quarterly report'*' we described the use of Gel PermeationChromatography (GPC) to determine the molecular weight distribution of 29-EMS-72,a hydroxy-telechelic hydrogenated polyisoprene previously submitted to JPL forevaluation. In the section to follow, we report the use of the same technique toanalyze four previously reported hydroxy-telechelic polyisoprenes^'^).
1. A. C. Ashcraft, J. E. Potts, E. M. Sullivan, E. W. Wise, "SaturatedHydrocarbon Polymeric Binder for Advanced Solid Propellant", QuarterlyReport, August 1, 1970, to October 31, 1970.
2. ibid, November 1, 1970 to January 31, 1971.

Using the same GPC system discussed in our previous reports,chromatograms were run on samples A, B, C and D. After correction forbaseline drift and normalizing to the same height at the peak maximum,the results shown in Figures 1 , 3 , 5 and 7 were obtained. Thesechromatograms were then transformed to integral molecular weight distributioncurves using the calibration curve and mathematical methods previouslyreported, with the results shown in Figures 2 , 4 , 6 and 8.
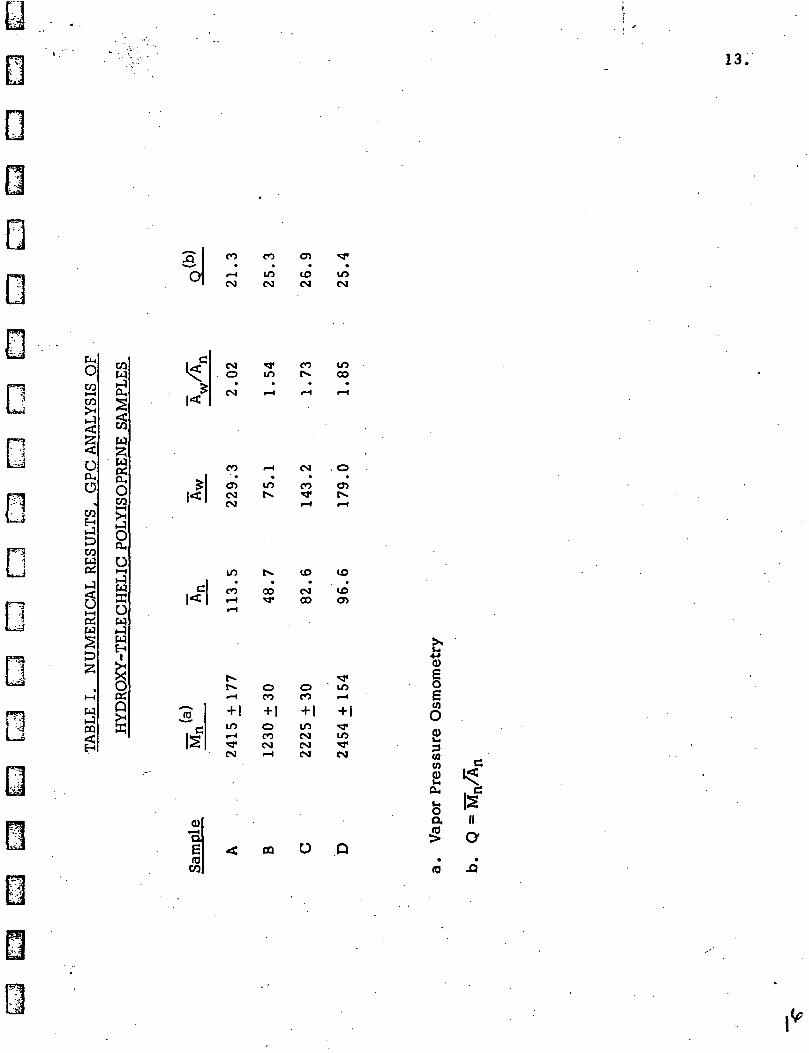
Table I summarizes the numerical results obtained. Note thatSample A, the only product made in a batch type reactor, has a broadermolecular weight distribution than the others, all prepared in a continuousreactor. This is best seen in the A~w/5n ratio.
In Figure 9, Mn is shown plotted against An for each of the foursamples.
Note that with the exception of sample A, the points lie close toa straight line corresponding the the equation.
Mn = Q x An , where Q = 25.7
This is to be expected, since the number average molecular weight shouldcorrelate linearly with the number average chain length. To the extentthat"An actually represents* the number average chain length, we may useGPC determined An values to calculate Mn/ once the constant Q has beendetermined.
*The accuracy of A~n as a measure of the number average chain length isprimarily limited by two considerations^
a. Constancy of the differential refractometer detector responseas the molecular weight of the eluate varies.
b. Applicability of the calibration curve of extended chainlength versus retention volume determined using polystyrenestandard samples of known molecular weight and narrowmolecular weight distribution.
(£>

4.
o
<
UJozoo
UJ
UJ
28 30 32 34
RETENTION VOLUME, COUNTS
36
FIG. 1. BASELINE-CORRECTED GEL PERMEATIONCHROMATOGRAM OF SAMPLE A

1.0
a:u
oa.
.9 -
.8
.7 -
.6
.5 -
.4
o
o
ccli O
3 -
113.5
229.32.020
5.
,1 -
10 50 100 500 1000
FIG. 2- INTEGRAL CHAIN LENGTH DISTRIBUTION,SAMPLE A

6.
oh-<
UJozoo
UJ>i-
UJIT
28 30 32 34 36
RETENTION VOLUME, COUNTS
FIG. 3. BASELINE-CORRECTED GEL PERMEATIONCHROMATOGRAM OF SAMPLE B

7.
1.0
UJ
oQ.
O<o:
.2
.1 -
HNS
EW=RATIO
48.7
75.11.543
i i I i i i i10 50 100 500 1000FIG.4-INTEGRAL CHAIN LENGTH DISTRIBUTION

. 8.
D zo
ITH-ZUJO
o
UJ
UJa:
28 30 32 34
RETENTION VOLUME,COUNTS
36
FIG. 5'.BASELINE-CORRECTED GEL PERMEATIONCHROMATOGRAM OF SAMPLE C

(TLU
OQ.
_J<
9.
o .3 —
gh-oa:u_
50 100 500 1000
FIG.6-INTEGRAL CHAIN LENGTH DISTRIBUTION, SAMPLE GI

10.
zo
o:i-UJooo
UJ
_JUJcr
28 30 32 34
RETENTION VOLUME, COUNTS
36
FIG.7. BASELINE-CORRECTED GEL PERMEATIONCHROMATOGRAM OF SAMPLE D

1.0
crUJ
oQ_
IU_O
^ .3 —oHO
oru_
.9 —
.8
.7 —
.6
.5
.4
.2
11.
.1 —
10 ,0 0o 500 1000
FIG.8-INTEGRAL CHAIN LENGTH DISTRIBUTION,SAMPLE D

12.
0r i
I
aa
OoOCJ
OOO
AVG. 25.7
I 1 I 1 1 110 20 30 40 50 60 70 80 90 100 110 120 130
FIG.9 - RELATIONSHIP BETWEEN Mn a An IN
HYDROXY-TELECHELIC POLYISOPRENES
13,
CO•
i—iCM
CO
inCM
O>
toCM
inCM
^ CMo
D KI-H
COSH3<
0 2«
oa,
n °Fi! COU } EH
HJ
£>
D eoTilKOShJ
n s: A t—i
3 <*L^ w
StD
I | 2i*
1— I
I*IF* W1 '4 I-J1 :-3 CQ
L— e <TS
fCOwi-)OH
§~1
clWt— S
' Scu^i^
0£9G3no\^CL,
Oi— i•*I-HWffi
OwH-)
S
s8ǤS
gi<
CM. O
•CM
CO
^i«i
~ •
enCM
' CM
in
KCI *CO1— 1l-H
ff*^.r^t^r- 1
*ro
1
+1ini— i
|<5 ^«' CM
'"•.'
^
R| <Utr "s|
rin
•i— 4
f-l
•int^
tv•
00J1
oco+1ocoCM•—I
COt^
•
t— 1
CM•
CO*3*i— «
to•
CMCO
OCO
+ 1
inCMCMCM
•
in00
•i— |
. O•
ent^i— i
(O•
l£>O)
^*^1
ini— i
+ 1^"in
CM
>,uXJ
0)E0ScoO
2301CQ20,
safff£
c
ISCIIa
E(0CO
CQ
(0

14.
These results suggest that the VPO determined value of 2415 + 177 for the Mnof Sample A is in error and that the 1vln may actually be closer to 2900. If thisis the case, Sample A is higher in functionality than we had previously believed(OH equiv. wt. = 1410 by infrared spectroscopic analysis). Because of thispossibility we rechecked the molecular weight determination by VPO. When thiswas done the result shown in Figure 9-A was obtained. With jn instrumentalcalibration factor of 12,800 (determined using pentaerythrytol tetrastearate asreference), the intercept of 4.4 + . 12 from the V/C vs. C plot gives a value of2910 + 80 for.the'molecular weight of Sample A. This is shown as the halfshaded point in Figure 9 and confirms the linear correlation between Mn and An.As further evidence accumulates to support this correlation, Gel PermeationChromatography may provide a more dependable source of ~M"n data which is notsubject to the occasional erratic behavior of the vapor pressure osmometer.
\i

aE
%
c
co•«w
•*-orc
Oa
*>
o>6)it

16.
3. Preparation Ester-Telechelic Polyisoprene in the5-Gallon Stirred Autoclave Reactor
In our previous quarterly report we outlined plans to prepare aone-gallon sample of-hydroxy-telechelic polyisoprene. This would provide-JPL with sufficient material to evaluate the binder prepolymer '.n propellantformulations on a somewhat larger scale. Our five-gallon batch reactor(previously used to prepare the precursor to "Sample A") can be operatedwith a ten liter charge of isoprene. At the conversions normally obtainedbetween four and six pounds of ester-telechelic polyisoprene can beprepared in a single run. We considered that two such runs would providean ample supply of starting material for the preparation of the one-gallonsample of hydroxy-telechelic binder prepolymer described above.
1. Polyisoprene Run No. 9769-CAK-2
The parameters for run 9769-CAK-2 are summarized in Table II.The isoprene was charged to the five-gallon reactor under a nitrogenatmosphere, the port sealed, and-the reactor heated with stirring up to100°C. This required twenty minutes. At this point a pump was startedto feed a 10% solution of diethylazobisisobutyrate in benzene into thereactor at a rate of 8.8 ml./min. Over the 4 3/4 hour run, 2500 ml.(containing 250 gms. DEAB) of the solution was fed in. At the end ofthis time the heat controller was shut off and cooling water used torapidly lower the temperature of the reactor to 35°C, at which point thecontents was discharged into a receiver through the bottom port.
The benzene solvent and unpolymerized isoprene were removed byvacuum evaporation to give 2848 grams colorless hazy liquid polymer havinga Brookfield viscosity of 64 poise at 25°C.
Examination of the infrared spectrum of the product disclosed someabnormalities in the 10-13/4 region which contains the C-H "wagging"vibrations associated with double bonds. In a "normal" polyisoprene preparedby free radical polymerization under our conditions the ratio of the vinyl(910 cm"1) to vinylidene (890 cm"1) to trisubstituted double bond (840 cm"1)absorbances are in the ratio of .704 : .930 = 1.00*. However, the spectrum
*Note the extinction coefficient for the trisubstituted C=C absorption ismuch lower than that for the vinyl and vinylidene. The product actuallycontains about 90% cjs and trans 1-4 polymerized isoprene.

17.
Thermocouple
MechanicalStirrer
Coolingy Water
lectricalBand
/HeatingElements
Fig.10.5-Ga I Ion Stirred Autoclave Reactor

TABLE II. POLYISOPRENE RUN NO. 9769-2
18.
Charged to Reactor Initially
Isoprene 6860 grams
Fed During Run
DEABBenzene
250 grams1980 grams
Reaction Conditions
TemperaturePressureTime
99-101°C83-110 psi4 hours 45 minutes
Productivity
YieldConversionConversion Rate
2848 grams41.2%8.67% per hour

19.
of the product from run 9769-CAK-2 exhibited these absorbances in the ratioof 1.03 = 1.69 : 1.00, showing a significant enhancement of the 1-2 and3-4 content as measured by the vinylidene and vinyl absorbances*.
The number average molecular weight of the product from run9769-CAK-2 was determined fay vapor pressure osmometry in toluene at37°C and found to be 2700 + 100. Infrared spectroscopy using ethylpivalate as a reference standard gave a value of 2150 for the ester equivalentweight. This implies an average functionality of 1.26 ester groups permolecule.
To verify this unexpected result, a small quantity of the product wassubjected to lithium aluminum hydride reduction. A solution of 36.5 g. 9769-CAK-2 in 100 ml. abs. ether was added dropwise with stirring to a suspensionof 2.1 grams lithium aluminum hydride in 150 ml. abs. ether. After refluxingthe mixture for one hour, the excess hydride was decomposed by addingsuccessively 2.1 ml. water, 2.1 ml. 15% NaOH solution and 6.3 ml. water.The clear supernatant ether layer was then decanted, filtered and evaporatedto give 28.7 grams colorless oil, showing no ester absorbance in the infrared.
Determination of the hydroxyl equivalent weight by infraredspectroscopy (25% ethyl acetate in CC14 used as solvent, reopentyl alcoholused as reference compound) gave the value 2180 g. per equivalent ofhydroxyl, quite close to the value 2150 obtained on the ester terminatedprecursor.
Thin layer chromatography of the hydride reduced product usingCH2C12 as the developing solvent gave a chromatogram showing an elongatedstreak stretching from the origin of the plate clear up to the solvent front.Under these conditions a difunctional polyisoprene of 2700 molecular weightshould show little or no material past Rf = 0. 6 on the TLC plate.
*This effect is similar to the result noted in a previous experiment, run8908-CAK-133, in which no DEAB initiator was used at all. The productfrom this run, the so-called "Thermal-Polyisoprene", was obtained invery low yield (~7%) and was found to be a low molecular weight ('-•'700)non-functional polymer. The infrared spectrum showed vinyl to vinylideneto trisubstituted C=C absorbances in the ratio of 1.31 : 2.35 : 1.00.

20.
D
Two dimensional thin layer chromatography using 2 1/2% ethanol/heptane in the first development, and using acetone in the second developmentat right angles to the first* guve the interesting result that the polymer containedno monofunctional fraction, 'ihe main components were difunctional and non-functional. In addition, the difunctional component showed chromatographicbehavior indicative of a very broad molecular weight distribution.
2. Examination of Possible Factors in the LowFunctionality Attained in Run 9769-CAK-2
Since none of our previous isoprene polymerizations had yieldedproducts having functionalities appreciably below two, the low esterfunctionality (1.26 + .04) measured for the product of run 9769-CAK-2 wasinterpreted to indicate that something out of the ordinary occurred duringthe polymerization, either in the way the polymerization was run or in thepurity of one of the starting materials. Accordingly we examined eachpossibility in detail.
a. Monomer Purity
The isoprene used in polymerization run 9769-CAK-2 was MathesonColeman and Bell, Practical Grade, which had been distilled at atmosphericpressure under nitrogen through a 40" long, 1 1/4" diameter, 32 plateOldershaw distillation column operated at 100% takeoff. A typical distillationcurve is shown in Figure 11.
*A detailed description of the method will be given in a future report.

21,
150
Oo
<D
03J_OQ.
<D
T303
100
50
tffir
:i;-Li
_i..i
rubiiiU.U..1-UJ
mi£l±±i±t
±d±h-4-
r44--fri—frgcl-ioh
• > • + •
_].!-. '-
4-1.
I • i I . I_L_L.Li_LLLi-
i i 1
J1U..L
-I- ±
TFR-l-ffi_T iTriri
-4-
:..;_:—1_1—I i j |Tl
.\-i-l
.±±tused-i-f-H-^—J-
-hi-
IEEE
Ml'I I t
—i—_U
.TIT"LTLUJ' tJ.
j I _L
H-- - KF.-J-J-4-
-i-M+Hf
.4-
O:
1 2 3Distillate Volume, liters
Fig. 11. Isoprene Distillation Curve

22.
Gas chromatographic analysis of the fraction disttUing over the range33-35°C gave the result shown in Figure 13*, compared with a similar chromat-ogram of the starting material in Figure 12. The major impurity in the practicalgrade isoprene was found to be a higher boiling substance, probably dimeric innature. Its retention time of 14.2 minutes corresponds to one of the majorcomponents in commercial "dip&ntene" and is probably dl_-limonene or a closelyrelated structure. The distillation reduced this component from 5.98% to 0.05%.Two other components of unknown nature were found at 4.7 min. (0.05%) and6.8 min. (0.25%). The largest impurity in the distilled isoprene was also inthe starting material. It had a retention time of 1.1 min. and comprised 0.49%of the starting material and 0.55% of the distilled product. Isoprene comprised93.23% of the practical grade isoprene and 99.08% of the distilled material usedin the polymerization.
When the distillation was run using a reflux ratio of 9:1 (10% takeoff,90% return to column) it was found that the components of longer retention timethan isoprene (C, D, E, F, G, H and I of Figures 12 and 13) could all beeliminated entirely, however, the short retention time component (A) was-tooclose to isoprene in boiling point to be completely separated by distillation.The isoprene obtained in this way was 99.7% purity containing 0.3% of theunknown component "A".
*A Perkin-Elmer Model 9.90 with hydrogen flame ionization detector coupledto an Infotronics logarithmic attenuator and electronic integrator was usedfor the analyses. A 2000 cm x 1/8" column of 10% Carbowax 20M on 40/60Chromosorb T operating at a flow rate of 25 cc/min. gave the requiredchromatographic separation. The following program was used. Inject0.2/4.1 of sample, operate isothermally for 4 min. at 60°C, program to175°C at 8°/min., remain at 175°C for duration of chromatogram.

23.
§01OCO
CL
CD
«5U2H—
O•
UJd
c\jdiL
CJCD
10
O
o*COCMCO
ao
\
H /

y24.
<DC0)L.QO
ujo.CO
CJ)
il
u &>o
10 c1
25.
When the mass spectrograph was used in conjunction with the gaschromatograph, component A was identified as pentene-2 by its molecularion at m/e = 70 and by its characteristic fragmentation pattern.
In summary, the isoprene used in run 9769-CAK-2 was 99.08% pureand contained 0.05% dimes 0.55% pentene-2 and 0.30% of xwo unknown components,A more careful distillation in which a higher reflux ratio was used gave99.7% pure isoprene containing 0.3% pentene-2 as the sole impurity which shouldhave no effect upon the polymerization.
b. Initiator Purity
The DEAB used in polymerization 9769-CAK-2 had been prepared March 10,1969, by treatment of azobisisobutyronitrile with ethanolic HC1 and hydrolysis ofthe resulting iminoether hydrochloride to yield the ester. For details of the prep-aration see p. 41-42 in our triennial report. Between the preparation in March of1969 and its use in run 9769-CAK-2 in February of 1971, the DEAB had been storedin a polyethylene carboy, tightly stoppered and placed in a cold room at 0°C.
A sample of the remaining DEAB was taken and analyzed to determinewhether deterioration had occurred during the 1 year 11 month storage at 0°C.Melting point analysis showed that the sample was impure- melting commencedat -21°C and was complete at -11°C. A freshly prepared sample of DEAB meltsat -10 to -5°C. Comparison of the infrared spectra showed only minor differences/however, chiefly in weak shoulders on major peaks in the spectrum of the DEABused in run 9247-CAK-2. These weak absorbances were at 1620-1660 cm"1 and940-980 cm"1.
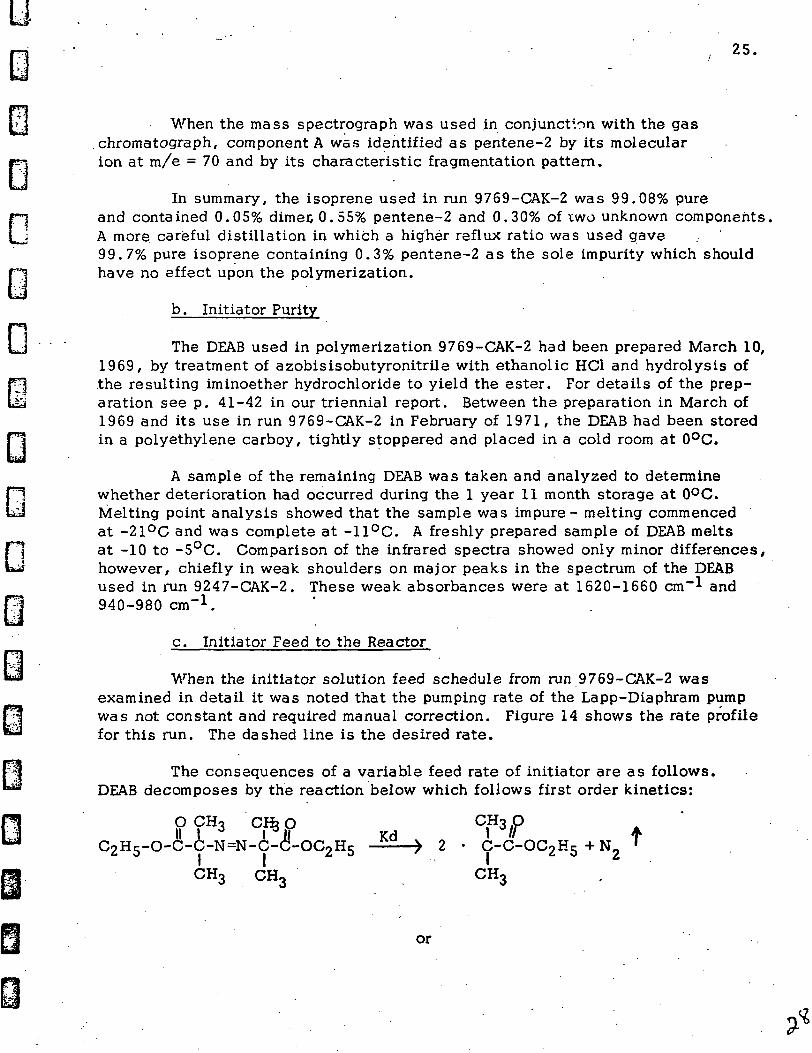
c. Initiator Feed to the Reactor
When the initiator solution feed schedule from run 9769-CAK-2 wasexamined in detail it was noted that the pumping rate of the Lapp-Diaphram pumpwas not constant and required manual correction. Figure 14 shows the rate profilefor this run. The dashed line is the desired rate.
The consequences of a variable feed rate of initiator are as follows.DEAB decomposes by the reaction below which follows first order kinetics:
O CH3 CHjO C|H3/PC2H5-0-C-C-N=N-C-(!!-OC2H5 Kd > 2 • C-C-OC2H5 + NZ '
CH3 CH3 CH3
or

26.
»2f
where: ddt
_ _ £H ryj Kj is the first order rate constant in units of min. -1
At the same time that the initiator is being destroyed by decomposition toinitiator radicals, it is being replenished by the initiator feed into the reactor.This effect upon the initiator concentration is given by:
d Cfl -dt
= K,
where: Kf is the feed rate in molesliter-min.
The resultant of these two processes establishes a steady stateinitiator concentration which is the solution to the differential equation:
dCfldt eg
For the situation in which termination is by recombination of radicals alone,Flory* has derived the relationship between the number average degree ofpolymerization, 3Tn, and the relative concentrations of initiator and monomer
xn =Kr M = C M
TO1/2
where: Kp is the rate of propagation, Kj is the rate of dissociation ofinitiator and Kj- is the rate of recombination of radicals.
We thus see that in order to produce a uniform product with as narrowa molecular weight distribution as possible, the ratio between the monomerconcentration and the square root of the initiator concentration must be maintainedconstant. .
*Paul J. Flory, Principles of Polymer Chemistry, p. 133.

27.
What is the effect of. an irregular initiator feed rate profile, suchas shown in Figure 14, upon the initiator concentration? To answer thisquestion, an analog computer simulation program* was used to provide amodel of the polymerization reactor, initiator feed system, and initiatordecomposition kinetics. This model will be discussed in detail in a futurereport. The model allows for an initial progranrined heating of the reactorwith calculation of the rate of decomposition of the initiator at differenttemperatures using the Ahrrenius equation. In addition, a variable feedrate can be programmed. To simplify the present task, no further chemistrypast the point of initiator decomposition was simulated in this model.
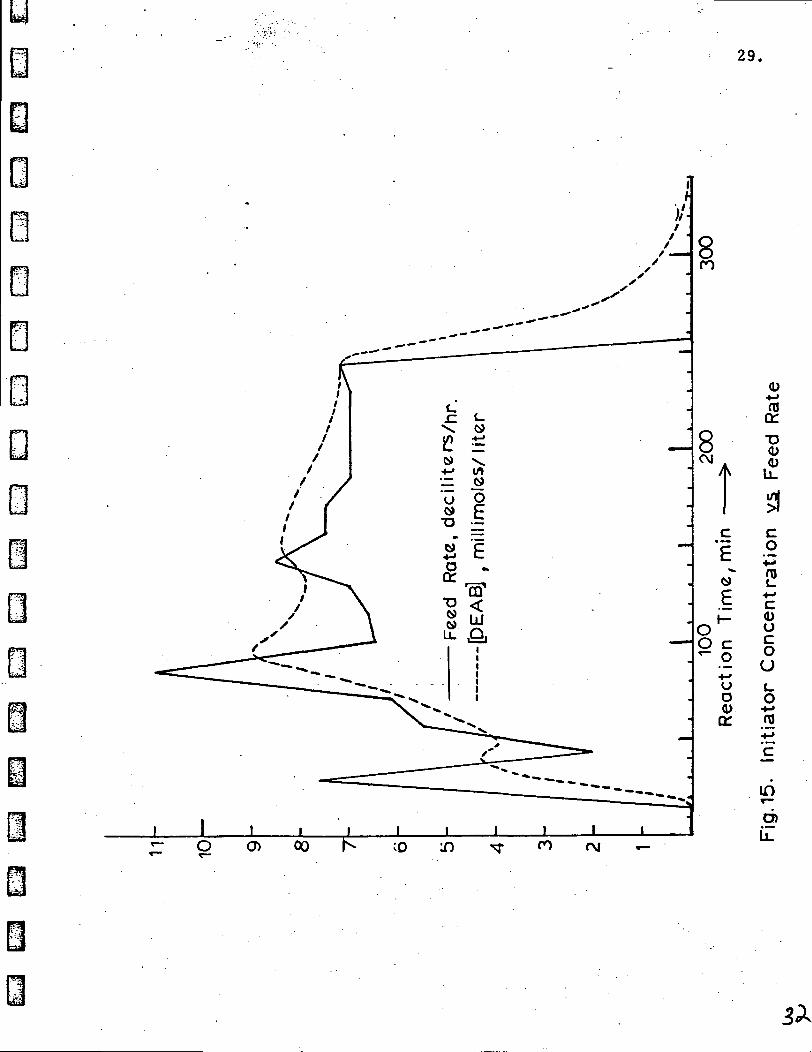
The results of an analog simulation of a hypothetical polymerizationrun are shown in Figure 15. The solid curve ginres the feed rate assumed forthe run in units of 100 ml. per hour. This feed schedule was chosen so.as toexceed the variations normally encountered ii ouir actual polymerizations. Inthis simulated run, initiator feed commenced at t = 15 min., rapidly rose toabout 750 ml./hr., decreased to 200 ml./hr., increased to a peak of 1100 ml./hr. and finally stabilized near 700 ml./hr. untfl the pumping was decreased tozero at the end of the run. The DEAB concentration followed the feed rate, however,it tended to lag behind and showed smoother variations than the feed rate. Thequantity D, defined as the reciprocal of the sqruare root of the DEAB concentration,shows an even smaller variation with initiator feed rate. This is shown in Figure16. Since the quantity D is directly proportional to the degree of polymerization,it is the value of D which is relevant to the molecular weight of the polyisopreneproduced at a given point during the run. Thus from t = 80 min. to t = 250 min. theaverage molecular weight should vary in proportion to the extremes in the valueof D, namely 11 to 13 (+ 8% from the mean), rather than in proportion to theextremes in feed rate which varied from 650 to> 1100 ml./hr. (+ 26% from the mean).
Figure 16 does, however, illustrate tfhe large effect of the low DEABconcentration which was present at the startup of the hypothetical run as wellas the effect of stopping feeding the initiator at the end of the run. In ouractual polymerization run #9769-GAK-2, the former situation applies since noDEAB was present in the reactor at the beginning of the run. However, thelatter situation does not apply since the reactor was cooled and the run terminatedat the same time that the feed pump was shut. caff.
As a result of these studies of the monomer purity, initiator purity andinitiator feed rate schedule encountered in rura 9769-CAK-2 it was concludedthat room for improvement existed in each of trhe areas examined, but that the
*IBM Continuous System Modeling Program, I130-CX-13X.

28.
t1. 10cE\
Ev 5njorf-t$s.
-
-
_— .*•—
-
"T— .
i I9AM 10
1 — i
^
'
1 , 1 , 1 , 111 12 1PM 2
T i m <» h r<i — i ^
Fig. 14. Initiator Feed Rate Profile, Run 9769-CAK-2
29.
)/
*~ O*^ t—
8ro
8CM
(D
T3<D(D
Lu
c'£
O c
UO(Uo:
o> 00
CO
c<uUcoU(_o
•»-»OJ
ing>L
JA

30.
Ooro
84C\J
c
6•*
(D
Scr eg
O)u_
O On
oCM

31.
most probable cause of the low functionality was related to the non-uniformitiesof pumping the initiator into the reactor.
It was decided that the following improvements would be put intoeffect in subsequent isopren.3 polymerizations:
a. Modify the initiator feed system to allow a more uniform feed rate.
b. Optimize the feed rate and initial DEAB concentration to avoid thelow DEAB level noted in the beginning of the run in Figure 15.
c. Use freshly prepared DEAB.
d. Use a higher reflux ratio in the isoprene distillation tominimize dimer content.
3. Implementation of Process Improvements
a. Change Initiator Feed Pump
The balky pump responsible for the erratic initiator feed rate profileshown in Figure 14 was replaced with a chemical proportioning pump of theconstant rate positive piston displacement type*. In this pump a cylindercontaining the entire charge of initiator is traversed by a piston driven by an8-pitch screw powered by a constant rate mechanical drive. The single strokedischarges the 800 ml. contents of the cylinder at a rate which can be set overthe range from 0.1 to 12.2 ml. per minute. This allows run times from a littleover an hour at the fastest rates to several days at the slower rates.
Since the maximum feed volume is limited in the new pump, wedecided to change the DEAB concentration in the feed solution from 10%to 50%.
b. Feed Rate Optimization Using Analog Simulation
The IBM continuous systems modelling program (CSMP) referred to.in section 2-C was used to simulate an analog computer model of the initiatorfeed system and DEAB decomposition kinetics. This simulation enabled us todetermine optimum initial DEAB concentrations as well as feed rate schedulesto give a uniform DEAB concentration for the duration of a batch polymerizationin the 5-gallon autoclave.
*B-I-F Industries Model 1180-20.

32.
To facilitate the actual use of the results in polymerization runs,a constant rate of feed was selected, commencing when the reactor temperature(determined by a realistic initial neating profile) reached a preselected point.It was found that starting the DEAB feed at a temperature below 80°C resultedin an initial peak in DEAB concentration. This resulted from -he low decompositionrute of DEAB at temperatures below 80°C. Conversely, waiting until the reactiontemperature had reached the operating temperature of 100°C resulted in an initiatorstarved condition early in the run. This was caused by the decomposition of theinitially charged DEAB before feed was started. A good compromise was achievedwhen the feed was started at 90°C. Figure 17 illustrates this effect for pumpinga 10% solution of DEAB into a 10 liter initial volume at a rate of 500 ml./hr. Inthese simulated runs the initial DEAB concentration (jDEAB3o was set at 0.005 M.Note that after 80 minutes pumping all three runs converged to the same initiatorlevel.
To determine the optimum feed rate and initial concentration to achievea given initiator concentration profile, a series of simulated runs were made onthe computer using feed rates of 100, 200, 300, 400, 800 and 1200 ml./hr. of50% DEAB solution. In all runs pumping was started when the reactor temperaturereached 90°C. The initial DEAB concentration for each run was determined bytrial and error for the 200 mli/hr. run and merely scaled up or down to provide anappropriate starting point for the other runs. The result of these simulated runsis given in Figure 18 and the data summarized in Table III. In Figure 19 is shownthe virtually linear relationship between |jDEAB3m, the initiator concentration atthe mid point of a run (after 400 ml. had been fed in), and the initiator feed rate.
These results allow selection of feed schedules appropriate for theproduction of uniform polymer of any desired molecular weight, once the constantof proportionality between pDEAB^"1/2 and Mn is determined.

33,
.006
.005
LJQ.
.004
[DEAB] = .oo5MoiarJo
feed rate = 500 myh , 1CP/«
V0 = 10 liters
T ^^90°C
100°C
100 200Reaction Time min. >
Fig.17. Effect of Tf Upon Initiator Level.

If)
34,
1m
<U+-»01o:
cn
or
ooo
OOOOOOOOOO
CMO
[9V3Q]
o
co*-»unjoo:
c03
<U•M03
4.
I-t-><1>ma«ncg+jCB
a>tt:
odr-
d
il

35.
CM
I W
Q.a*w
OSOHS
Hi— i2>— <OS<wHgQwwPH
S5W
wCQa,i— iWCO
»OHH
H
3g
•HHI— 1HH
W1-1CQ
H
u3aE
^*Wa
•4
O OO CO OQ * J* i"- *CO O^ CO CO ^3* CO
csj oo r*. co ^ coi-H
•-I M< CO O CO OOco N oo m o coo •-! •— i CM LO r^o o o o o o'
o
r^j
»Q
V^^ O*3 OO f ^^ OQO »-H rH C**J ^* ^
O O O O O O• • • • • •
•
•x
^^
»0)•!->
sTl
<1)Cw
C3
C3cd
TD0)• *
ro
1CO
o o o o o oo o o o o o«-H C>J CO' ^* 00 OJ
t— 1
r—l C"J CO f 1/5 CO

U-36.
00O
<OO s
I
[ev3q]
o:
T)(U<D
U.
C C4> OQ. ^<D 3
* 32 LJ
fi> .o
c °0o in_
2 o
•^ o£ 5"
•O)
37,
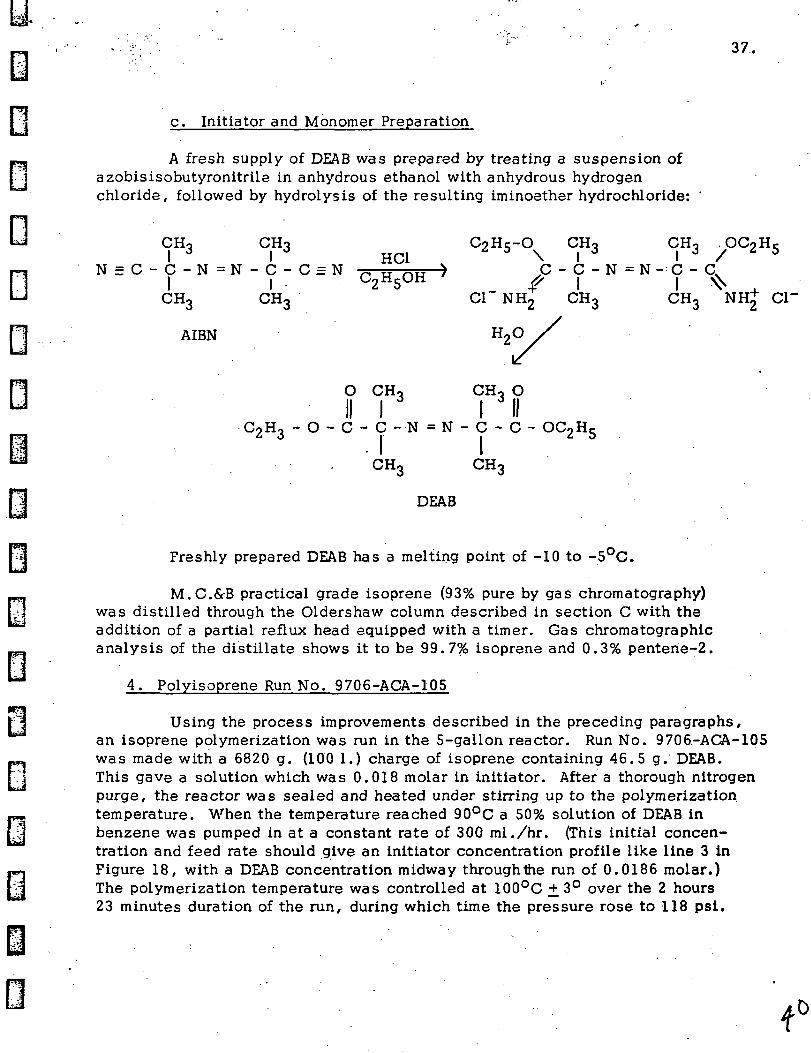
c. Initiator and Monomer Preparation
A fresh supply of DEAB was prepared by treating a suspension ofazobisisobutyronitrile in anhydrous ethanol with anhydrous hydrogenchloride, followed by hydrolysis of the resulting iminoether hydrochloride: '
CHo CH3 C2Hr-O CHo CHo OCoHrI 3 I 3 HC1 \ I 3 I 3 / 5
N = C - C - N = N - C - C = N ^ „ .-„ > C - C - N = N - C - C| | C2H5OH
CH3 CH3 Cl~ NH2 CH3 CH3 NH Cl'
AIBN
O CH,"
C2H3 - O - C - C - N = N - C - C - OC2H5
3
DEAB
Freshly prepared DEAB has a melting point of -10 to -5°C.
M.C.&-B practical grade isoprene (93% pure by gas chromatography)was distilled through the Oldershaw column described in section C with theaddition of a partial reflux head equipped with a timer. Gas chromatographicanalysis of the distillate shows it to be 99.7% isoprene and 0.3% penterie-2.
4. Polyisoprene Run No. 9706-ACA-105
Using the process improvements described in the preceding paragraphs,an isoprene polymerization was run in the 5-gallon reactor. Run No. 9706.-ACA-105was made with a 6820 g. (100 1.) charge of isoprene containing 46.5 g. DEAB.This gave a solution which was 0.018 molar in initiator. After a thorough nitrogenpurge, the reactor was sealed and heated under stirring up to the polymerizationtemperature. When the temperature reached 90°C a 50% solution of DEAB inbenzene was pumped in at a constant rate of 300 ml./hr. (This initial concen-tration and feed rate should give an initiator concentration profile like line 3 inFigure 18, with a DEAB concentration midway throughtiie run of 0.0186 molar.)The polymerization temperature was controlled at 100°C + 3° over the 2 hours23 minutes duration of the run, during which time the pressure rose to 118 psi.

38,
When a total of 714 ml. of DEAB solution had been fed in, pumping was stopped,the internal cooling coils turned on, and the run terminated. The data aresummarized in Table IV.
The unreacted isoprene was removed by vacuum evaporation on a rotaryevaporator, and the residue dovolatilized by passing through a falling filmmolecular still at 170°C/0.2 mm Hg pressure. A yield of 2495 grams (37%conversion) clear colorless liquid polymer was obtained, the functionality ofwhich was 1.98 + .02 by Vapor Pressure Osmometry (Mn = 2290 ±20) andinfra/ed spectroscopic analysis for ester end groups (Eq. Wt. = 1154).
A polyisoprene of 2290 Mn having end groups derived from DEAB hasa number average degree of polymerization, Xn, of 30.3. This fact permits usto make use of the equation in section 2C:
xn = c
For [T]m= 0.0186, Xn = 30.3 .% C QM| = 30.3 7 .0186 = 4.13
Having evaluated this product, we can select a concentration of DEAB requiredto give any desired molecular weight product.
Since Xn = Mn - 230
we have -
68
4.13(Mn - 230)/68•J
Thus to prepare a 3000 molecular weight ester telechelic polyisoprene, theinitiator concentration required is:
2= 0.0103
4.13(3000-230)768
> w •
•]And, according to Figure 18, a feed rate of about 170 ml./hr. would be requiredusing a 50% DEAB solution.

39
TABLE IV. 5-GAJ -LON BATCH ISOPRENE POLYMERIZATION
RUN NO. 9706-105
Barged Initially
Isoprene, gms.DEAB, gms.CDEAB] , molar
682046.50.0180
Fed During Run
Ml. 50% DEAB/BenzeneFeed Rate, ml./hr.[DEABJm/ molar9
7143000.0186
Reaction Conditions
Temperature13
Pressure, psiTotal Time
100 + 3°C70-1182 hrs. 23 minutes
Productivity
YieldConversionConversion Rate
2,49537%15%/hr.
Product Description
AppearanceMn (V.P.O. in toluene, 37°C)Ester Equivalent Weight (infrared)Ester Functionality
Clear, colorless liquid2 2 9 0 + 2 011541.98 + .02
a. From Figure 18.b. After reaching control temperature.

40,
VI. PLANS FOR FUTURE WORK
n
In the quarter to come we plan to use hydride reduction to convertthe ester telechelic product C706-ACA-105 into a hydroxyl tclechelic pre-polymer.
Additional polymerizations will be run using the improved operatingprocedures developed last quarter.
The analog computer simulation of the initiator feed system a n d -decomposition kinetics will be presented in our next report, as well as adiscussion of two dimensional thin layer chromatography as applied to theanalysis of functionality distribution.