hydro.com also included imp airmen t charge s of no k 33 millio n relate d to the agree ... in sap a...
TRANSCRIPT

First quarter report
2014Q

About our reporting As of January 1, 2014 Hydro has implemented the new accounting standards IFRS 10, IFRS 11, IFRS 12 and the amended IAS 27 and IAS 31 with retrospective application resulting in changes to the prior periods in this report. See note 1 to the condensed consolidated financial statements for more information. Contents Financial review 3
Overview 3
Market developments and outlook 5
Additional factors impacting Hydro 7
Underlying EBIT 7
Finance 11
Tax 11
Items excluded from underlying EBIT and net income 12
Interim financial statements 14
Condensed consolidated statements of income (unaudited) 14
Condensed consolidated statements of comprehensive income (unaudited) 15
Condensed consolidated balance sheets (unaudited) 16
Condensed consolidated statements of cash flows (unaudited) 17
Condensed consolidated statements of changes in equity (unaudited) 18
Notes to the condensed consolidated financial statements 19
Additional information 23
Financial calendar 23
page FIRST QUARTERAbout our reporting2

Overview
pageFIRST QUARTEROverview 3
Summary underlying financial and operating results and liquidity Key financial information
NOK million, except per share data
First
quarter
2014
Fourth
quarter
2013
%change
prior
quarter
First
quarter
2013
%change
prior year
quarter
Year
2013
Revenue 18 282 16 570 10 % 16 109 13 % 64 877
Earnings before financial items and tax (EBIT) 822 (14) >100 % 704 17 % 1 663
Items excluded from underlying EBIT (50) 485 >(100) % 372 >(100) % 1 063
Underlying EBIT 772 471 64 % 1 076 (28) % 2 725
Underlying EBIT :
Bauxite & Alumina (288) (379) 24 % (63) >(100) % (1 057)
Primary Metal 312 484 (36) % 364 (14) % 1 422
Metal Markets 141 190 (26) % 146 (3) % 594
Rolled Products 181 100 81 % 152 19 % 615
Energy 435 383 14 % 517 (16) % 1 653
Other and eliminations 1)
(8) (306) 97 % (38) 78 % (502)
Underlying EBIT 772 471 64 % 1 076 (28) % 2 725
Underlying EBITDA 1 861 1 619 15 % 2 212 (16) % 7 306
Underlying income (loss) from discontinued operations 1)
- - - 49 (100) % 220
Net income (loss) 462 (758) >100 % 263 76 % (839)
Underlying net income (loss) 388 140 >100 % 649 (40) % 1 610
Earnings per share 0.19 (0.39) >100 % 0.14 37 % (0.45)
Underlying earnings per share 0.16 0.02 >100 % 0.30 (46) % 0.65
Financial data:
Investments 2)
546 1 057 (48) % 1 077 (49) % 3 761
Adjusted net interest-bearing debt (11 230) (10 128) (11) % (9 858) (14) % (10 128)
Key Operational information
Alumina production (kmt) 1 428 1 452 (2) % 1 361 5 % 5 377
Primary aluminium production (kmt) 484 492 (2) % 478 1 % 1 944
Realized aluminium price LME (USD/mt) 1 749 1 802 (3) % 2 043 (14) % 1 902
Realized aluminium price LME (NOK/mt) 3)
10 702 10 916 (2) % 11 533 (7) % 11 160
Realized NOK/USD exchange rate 3)
6.12 6.06 1 % 5.64 8 % 5.87
Metal products sales, total Hydro (kmt) 4)
871 777 12 % 806 8 % 3 164
Rolled Products sales volumes to external market (kmt) 243 226 8 % 236 3 % 941
Power production (GWh) 2 964 2 411 23 % 2 904 2 % 10 243
1) Other and eliminations includes Hydro's 50 percent share of underlying net income from Sapa beginning September 2013. Underlying income (loss) from discontinued operations includes results from Hydro's Extruded Products business for all prior periods.
2) Investments include non-cash elements relating to capitalized lease obligations and the Vigeland acquisition.
3) Including the effect of strategic hedges (hedge accounting applied).
4) Sales from casthouses (incl. Neuss), remelters, third party sources and liquid metal.

Hydro's underlying earnings before financial items and tax increased to NOK 772 million in the first quarter, up from NOK 471 million in the fourth quarter of 2013. Higher product premiums, seasonally higher sales volumes and higher electricity production had a positive effect on underlying results for the quarter. Underlying EBIT for Bauxite and Alumina improved compared to fourth quarter of 2013 which included the settlement of claims relating to ICMS taxes. Alumina production for Alunorte was stable, however, fuel costs increased mainly due to the introduction of ICMS taxation on fuel oil beginning February 1, 2014. Underlying EBIT for Primary Metal was down in the quarter, primarily due to the insurance settlement received in the fourth quarter. Higher product premiums and increased sales volumes were partly offset by higher costs for alumina and power and lower realized LME prices. Excluding negative currency and ingot inventory effects, underlying EBIT for Metal Markets improved mainly due to higher results from sourcing and trading activities. Rolled Products underlying EBIT increased in the first quarter due to seasonally higher sales volumes and lower maintenance costs partly offset by lower margins. Underlying EBIT for Energy increased mainly due to higher production. Underlying EBIT for Sapa improved compared to the fourth quarter, influenced by seasonally stronger sales volumes. Operating cash flow was negative NOK 0.7 billion for the first quarter impacted by a seasonal increase in working capital and a tax payment related to a disputed tax claim in Norway. Net cash used for investment activities amounted to NOK 0.6 billion. Hydro's net debt position amounted to around NOK 0.6 billion at the end of the first quarter.
page FIRST QUARTEROverview4
Reported EBIT and net incomeReported earnings before financial items and tax amounted to NOK 822 million in the first quarter. In addition to the factors discussed above, reported EBIT included net unrealized derivative gains amounting to NOK 170 million in total. Reported earnings also included impairment charges of NOK 33 million related to the agreed divestment of Hydro's casthouse in Hannover and charges of NOK 86 million (Hydro's share) in Sapa primarily related to rationalization activities. In the previous quarter reported earnings before financial items and tax amounted to negative NOK 14 million including net unrealized derivative losses and negative metal effects amounting to NOK 151 million in total. Reported earnings also included a loss of NOK 69 million from divestment of the rolling mill in Malaysia, charges of NOK 392 million relating to Hydro's head office lease arrangement, penalties of NOK 109 million relating to the settlement of ICMS tax claims in Brazil and charges of NOK 172 million (Hydro's share) in Sapa primarily related to rationalization activities. In addition, reported earnings included pension curtailment gains of NOK 390 million relating to the transition to defined contribution plans in Norway. Income from continuing operations amounted to NOK 462 million in the first quarter including a net foreign exchange gain of NOK 193 million. In the previous quarter, loss from continuing operations amounted to NOK 758 million including a net foreign exchange loss of NOK 688 million.

Market developments and outlook
Market statistics 1)
First
quarter
2014
Fourth
quarter
2013
%change
prior
quarter
First
quarter
2013
%change
prior year
quarter
Year
2013
NOK/USD Average exchange rate 6.10 6.05 1 % 5.62 8 % 5.88
NOK/USD Balance sheet date exchange rate 5.99 6.08 (2) % 5.83 3 % 6.08
NOK/BRL Average exchange rate 2.58 2.67 (3) % 2.82 (9) % 2.73
NOK/BRL Balance sheet date exchange rate 2.64 2.58 2 % 2.89 (9) % 2.58
NOK/EUR Average exchange rate 8.35 8.23 1 % 7.43 12 % 7.81
NOK/EUR Balance sheet date exchange rate 8.26 8.38 (2) % 7.47 10 % 8.38
Bauxite and alumina:
Average alumina price - Platts PAX FOB Australia (USD/t) 328 323 2 % 340 (4) % 326
Global production of alumina (kmt) 25 903 26 607 (3) % 23 991 8 % 101 470
Global production of alumina (ex. China) (kmt) 13 710 14 154 (3) % 13 155 4 % 54 270
Primary aluminium:
LME three month average (USD/mt) 1 752 1 815 (3) % 2 042 (14) % 1 887
LME three month average (NOK/mt) 10 671 10 981 (3) % 11 484 (7) % 11 070
Global production of primary aluminium (kmt) 12 935 12 920 - 12 264 5 % 50 206
Global consumption of primary aluminum (kmt) 12 213 12 828 (5) % 11 561 6 % 49 925
Global production of primary aluminium (ex. China) (kmt) 6 318 6 355 (1) % 6 411 (1) % 25 711
Global consumption of primary aluminum (ex. China) (kmt) 6 503 6 398 2 % 6 351 2 % 26 005
Reported primary aluminium inventories (kmt) 8 798 8 189 7 % 8 609 2 % 8 189
Rolled products and extruded products:
Consumption rolled products - Europe (kmt) 1 108 1 011 10 % 1 075 3 % 4 286
Consumption rolled products - USA & Canada (kmt) 1 051 1 011 4 % 1 038 1 % 4 203
Consumption extruded products - Europe (kmt) 695 667 4 % 680 2 % 2 742
Consumption extruded products - USA & Canada (kmt) 479 442 8 % 456 5 % 1 876
Energy:
Average southern Norway spot price (NO2) (NOK/MWh) 249 287 (13) % 311 (20) % 290
Average nordic system spot price (NOK/MWh) 252 296 (15) % 313 (19) % 297
1) Industry statistics have been derived from analyst reports, trade associations and other public sources unless otherwise indicated. Amounts presented in prior reports may have been restated based on updated information. Currency rates have been derived from Norges Bank.
pageFIRST QUARTERMarket developments and outlook 5
Bauxite and aluminaChinese alumina imports amounted to 1.5 million mt for the first quarter of 2014, up 43 percent from the same period in 2013. Bauxite imports into China declined significantly from the beginning of the quarter following restrictions on the export of bauxite by Indonesia that took effect on January 12, 2014. For the first quarter in total, bauxite imports into China amounted to 13 million mt, a decline of 7 percent compared to the corresponding period of 2013. Platts alumina spot prices averaged USD 328 per mt for the quarter, an increase of USD 5 per mt compared to the previous quarter. Average prices represented 18.7 percent of LME in the quarter compared with 17.8 percent in the previous quarter.
Primary aluminiumLME prices ranged between USD 1,700 to USD 1,800 per mt throughout the first quarter of 2014. Prices in Europe, including duty paid standard ingot premium, were at a level of USD 2,000 to USD 2,100 per mt for the quarter. North American and European standard ingot premiums increased in the first quarter, averaging USD 420 and USD 340 per mt, respectively. In the fourth quarter premiums averaged USD 230 and USD 250 per mt, respectively. Premiums also increased in Japan. Developments in the first quarter were influenced by higher demand in the physical markets combined with announced closures and curtailments and continued financing of metal in warehouses. Global demand for primary aluminium (excluding China) increased by 2 percent, compared with both the fourth quarter and the same quarter of 2013. Annualized consumption increased to 26.4 million mt in the first quarter. Corresponding production also increased, amounting to 25.6 million mt. New closures and curtailments were announced during the quarter partly offsetting planned start-ups resulting in the expectation of demand exceeding production in 2014.

In China, aluminium consumption increased compared to the fourth quarter, amounting to 23.1 million mt on an annualized basis. Corresponding production increased to 26.8 million mt. New capacity continues to be ramped up in the Northwest regions, but this has been somewhat offset by further curtailments in the Eastern provinces. SHFE prices have fallen during the quarter. European demand for extrusion ingot, foundry alloys and sheet ingot improved slightly during the first quarter compared to the same period of 2013.
page FIRST QUARTERMarket developments and outlook6
Rolled productsEuropean demand for flat rolled products increased by 10 percent in the first quarter mainly due to seasonality. Compared to the first quarter of the previous year, demand also showed positive developments, in particular for the automotive and general engineering segments. Compared to the fourth quarter of 2013, demand for automotive products increased due to higher production of premium cars and seasonality. Demand in the building and construction market segment was supported by mild winter weather conditions and continued market recovery. The beverage can market demand was stable. In addition to seasonal increases, demand for foil and general engineering products was supported by a slightly better packaging market and improved industrial activity. European demand for flat rolled products is expected to be higher in the second quarter of 2014 due to seasonality and improved underlying demand across most segments.
Extruded productsDemand for extruded products in North America improved compared to fourth quarter 2013, driven by seasonality. Compared to the same quarter of the previous year, demand grew 5 percent, mainly supported by growth in the automotive and building market segments. Extruded demand in South America showed signs of weakening. In Europe, extruded products demand increased by 4 percent from the fourth quarter of last year, mainly due to seasonality. Demand improved 2 percent compared to the first quarter of 2013, supported by higher automotive demand, somewhat offset by weaker transport, renewable energy and building market segments, in particular in Southern Europe. Global demand for precision tubing continued to be driven by increased demand from the automotive market sector.
EnergyAverage spot prices declined substantially compared to the previous quarter due to mild and wet weather conditions. The Nordic hydrological balance ended around 5 TWh above normal in the first quarter. Water reservoirs in Norway were around 39 percent of full capacity at the end of the quarter which is at normal levels. Snow reservoirs ended around 4 TWh above normal.

Additional factors impacting HydroPrimary Metal has sold forward around 50 percent of its expected primary aluminium production for the second quarter of 2014 at a price level of around USD 1,725 per mt.1) This excludes volumes from Qatalum. Hydro's alumina refinery Alunorte in Brazil has been subject to ICMS taxation on fuel oil since February 1, 2014 resulting in additional costs of roughly NOK 150 million per quarter. The Alunorte alumina refinery and Albras aluminium smelter have entered into USD currency forward contracts in Brazil for second half 2013 and all of 2014. The remaining program value at the end of March 2014 amounted to roughly USD 660 million. The achieved average exchange rate for remaining period is 2.41. 1) Prices are fixed mainly one month prior to production. As a result, and due to the hedging of product inventories, Hydro's realized aluminium prices lag LME spot prices by around 1.5 to 2 months.
pageFIRST QUARTERAdditional factors impacting Hydro 7
Underlying EBIT
Bauxite & Alumina
Operational and financial information 1)
First
quarter
2014
Fourth
quarter
2013
%change
prior
quarter
First
quarter
2013
%change
prior year
quarter
Year
2013
Underlying EBIT (NOK million) (288) (379) 24 % (63) >(100) % (1 057)
Underlying EBITDA (NOK million) 122 45 >100 % 366 (67) % 662
Alumina production (kmt) 1 428 1 452 (2) % 1 361 5 % 5 377
Sourced alumina (kmt) 550 395 39 % 476 16 % 2 009
Total alumina sales (kmt) 1 906 1 959 (3) % 1 874 2 % 7 408
Realized alumina price (USD/mt) 2)
269 263 2 % 296 (9) % 275
Bauxite production (kmt) 3)
2 242 2 080 8 % 2 210 1 % 7 567
Sourced bauxite (kmt) 4)
1 874 2 474 (24) % 1 265 48 % 8 523
1) Apparent alumina cash cost removed. Replaced by "Implied alumina cost" in Hydro's quarterly investor presentation.
2) Weighted average of own production and third party contracts. The majority of the alumina is sold linked to LME prices with a one month delay.
3) Paragominas on wet basis.
4) 40 percent MRN off take from Vale and 5 percent Hydro share on wet basis.
Underlying EBIT for Bauxite and Alumina improved compared to fourth quarter of 2013 which included the settlement of claims relating to ICMS taxes amounting to roughly NOK 170 million. Realized alumina prices increased in the quarter reflecting increased volumes sold at higher Platts index prices. Alumina production for Alunorte was stable while bauxite production at Paragominas increased. Fuel costs increased mainly due to the introduction of ICMS taxation on fuel oil beginning February 1, 2014. Recovering from setbacks in 2013, Hydro's From B to A improvement program proceeded according to plan. Underlying EBIT declined compared to the first quarter of the previous year mainly due to lower LME linked alumina prices.

Primary Metal
Operational and financial information 1)
First
quarter
2014
Fourth
quarter
2013
%change
prior
quarter
First
quarter
2013
%change
prior year
quarter
Year
2013
Underlying EBIT (NOK million) 312 484 (36) % 364 (14) % 1 422
Underlying EBITDA (NOK million) 753 940 (20) % 838 (10) % 3 293
Realized aluminium price LME (USD/mt) 2)
1 749 1 802 (3) % 2 043 (14) % 1 902
Realized aluminium price LME (NOK/mt) 2)
10 702 10 916 (2) % 11 533 (7) % 11 160
Realized premium above LME (USD/mt) 3)
422 371 14 % 345 22 % 362
Realized premium above LME (NOK/mt) 3)
2 583 2 246 15 % 1 945 33 % 2 124
Realized NOK/USD exchange rate 6.12 6.06 1 % 5.64 8 % 5.87
Primary aluminium production (kmt) 484 492 (2) % 478 1 % 1 944
Casthouse production (kmt) 4)
525 522 1 % 495 6 % 2 046
Total sales (kmt) 5)
593 515 15 % 541 10 % 2 127
1) Operating and financial information includes Hydro's proportionate share of underlying income (loss), production and sales volumes in equity accounted investments. Realized prices, premiums and exchange rates exclude equity accounted investments, and include the effects of strategic currency hedges (hedge accounting applied).
2) Including effect of strategic LME hedges (hedge accounting applied). Realized aluminium prices lag the LME price developments by approximately 1.5 - 2 months.
3) Average realized premium above LME for casthouse sales from Primary Metal. Historical premiums for 2013 revised due to change of definition.
4) Production volumes for 2013 revised due to change of definition
5) Total sales replaces previous casthouse sales due to change of definition
Operational and financial information Qatalum (50%)
First
quarter
2014
Fourth
quarter
2013
%change
prior
quarter
First
quarter
2013
%change
prior year
quarter
Year
2013
Revenue (NOK million) 1 087 1 072 1 % 1 125 (3) % 4 351
Underlying EBIT (NOK million) 115 237 (51) % 106 8 % 510
Underlying EBITDA (NOK million) 342 504 (32) % 349 (2) % 1 523
Underlying Net income (loss) (NOK million) 75 203 (63) % 65 15 % 343
Primary aluminium production (kmt) 76 77 (1) % 74 3 % 303
Casthouse sales (kmt) 83 80 4 % 82 1 % 321
Higher product premiums and increased sales volumes had a positive impact on underlying EBIT for Primary Metal in the quarter, partly offset by higher costs for alumina and power together with lower realized LME prices. Underlying EBIT in the fourth quarter of 2013 included insurance proceeds of NOK 150 million (Hydro share) relating to the fire in a cooling tower at Qatalum in 2012. Hydro's USD 180 per mt joint venture improvement program proceeded according to plan. Hydro's share of underlying results from Qatalum declined compared to the fourth quarter mainly due to the insurance proceeds discussed above. Realized aluminium prices declined somewhat but were offset by higher product premiums. Sales volumes were stable. Underlying EBIT declined compared to the first quarter of 2013. Lower realized LME prices had a substantial negative effect on underlying results for the quarter. However, this was partly offset by higher product premiums, a stronger US dollar and higher sales volumes.
page FIRST QUARTERUnderlying EBIT8

Metal Markets
Operational and financial information
First
quarter
2014
Fourth
quarter
2013
%change
prior
quarter
First
quarter
2013
%change
prior year
quarter
Year
2013
Underlying EBIT (NOK million) 141 190 (26) % 146 (3) % 594
Currency effects 1)
(12) 48 >(100) % 12 >(100) % 136
Ingot inventory valuation effects 2)
(7) (2) >(100) % 23 >(100) % 21
Underlying EBIT excl. currency and ingot inventory effects 161 144 11 % 110 46 % 437
Underlying EBITDA (NOK million) 157 214 (27) % 163 (4) % 691
Remelt production (kmt) 139 123 13 % 135 3 % 517
Metal products sales excluding ingot trading (kmt) 3)
720 648 11 % 697 3 % 2 691
Hereof external sales (kmt) 4)
699 626 12 % 583 20 % 2 364
1) Includes the effects of changes in currency rates on sales and purchase contracts denominated in foreign currencies (mainly US dollar and Euro for our European operations) and the effects of changes in currency rates on the fair valuation of dollar denominated derivative contracts (including LME futures) and inventories mainly translated into Norwegian kroner. Hydro manages its external currency exposure on a consolidated basis in order to take advantage of offsetting positions.
2) Comprised of hedging gains and losses relating to standard ingot inventories in our metal sourcing and trading operations. Increasing LME prices result in unrealized hedging losses, while the offsetting gains on physical inventories are not recognized until realized. In periods of declining prices, unrealized hedging gains are offset by write-downs of physical inventories.
3) Includes external and internal sales from primary casthouse operations, remelters and third party metal sources. Sales volumes for 2013 revised due to change of definition.
4) Sales volumes for 2013 revised due to change of definition.
Underlying EBIT for Metal Markets decreased compared to the fourth quarter impacted by negative currency effects compared to positive effects in the previous quarter. Excluding currency and ingot inventory effects, underlying EBIT improved mainly due to higher results from sourcing and trading activities. Compared to the first quarter of 2013, underlying EBIT was relatively stable with negative currency and ingot inventory effects mostly offset by higher sourcing and trading results.
pageFIRST QUARTERUnderlying EBIT 9
Rolled Products
Operational and financial information
First
quarter
2014
Fourth
quarter
2013
%change
prior
quarter
First
quarter
2013
%change
prior year
quarter
Year
2013
Underlying EBIT (NOK million) 181 100 81 % 152 19 % 615
Underlying EBITDA (NOK million) 351 284 24 % 311 13 % 1 293
Sales volumes to external market (kmt) 243 226 8 % 236 3 % 941
Sales volumes to external markets (kmt) - Customer business units
Packaging and building 1)
91 90 1 % 99 (8) % 398
Lithography, automotive & heat exchanger 80 73 10 % 75 6 % 292
General engineering 72 63 14 % 63 15 % 251
Rolled Products 243 226 8 % 236 3 % 941
1) Includes beverage can, foil packaging and lacquered building products.
Underlying EBIT for Rolled Products increased compared to the fourth quarter. The improvement reflected higher sales volumes and lower maintenance costs partly offset by lower margins. Shipments increased for all product segments, mainly due to seasonality and positive developments for the automotive and general engineering business sectors. Compared to the first quarter 2013, underlying EBIT improved mainly due to higher sales volumes.

Energy
Operational and financial information
First
quarter
2014
Fourth
quarter
2013
%change
prior
quarter
First
quarter
2013
%change
prior year
quarter
Year
2013
Underlying EBIT (NOK million) 435 383 14 % 517 (16) % 1 653
Underlying EBITDA (NOK million) 474 420 13 % 557 (15) % 1 803
Direct production costs (NOK million) 1)
162 121 33 % 130 24 % 485
Power production (GWh) 2 964 2 411 23 % 2 904 2 % 10 243
External power sourcing (GWh) 2 314 2 474 (6) % 2 182 6 % 9 412
Internal contract sales (GWh) 3 333 3 448 (3) % 3 178 5 % 13 304
External contract sales (GWh) 363 348 4 % 389 (7) % 1 241
Net spot sales (GWh) 1 581 1 089 45 % 1 518 4 % 5 110
1) Includes maintenance and operational costs, transmission costs, property taxes and concession fees for Hydro as operator.
Underlying EBIT for Energy increased compared to the fourth quarter 2013 mainly due to higher production. Positive developments were partly offset by lower prices and higher transmission costs partly due to an increase of fixed grid tariffs. Compared to the first quarter of the previous year, underlying EBIT declined mainly due to lower prices and higher transmission costs partly due to an increase of fixed grid tariffs.
page FIRST QUARTERUnderlying EBIT10
Other and eliminations
Financial information
NOK million
First
quarter
2014
Fourth
quarter
2013
%change
prior
quarter
First
quarter
2013
%change
prior year
quarter
Year
2013
Sapa (50%) 35 (140) >100 % - - (130)
Other (127) (134) 5 % (125) (2) % (459)
Eliminations 84 (31) >100 % 87 (3) % 88
Underlying EBIT Other and eliminations (8) (306) 97 % (38) 78 % (502)
Eliminations comprises mainly unrealized gains and losses on inventories purchased from group companies which fluctuates with product flows, volumes and margin developments throughout Hydro's value chain.

Operational and financial information Sapa (50%)
First
quarter
2014
Fourth
quarter
2013
Revenue (NOK million) 5 673 5 066
Underlying EBIT (NOK million) 78 (170)
Underlying EBITDA (NOK million) 220 (22)
Underlying Net income (loss) (NOK million) 35 (140)
Sales volumes (kmt) 180 157
Underlying EBIT for Sapa improved compared to the fourth quarter, influenced by seasonally stronger sales volumes. Underlying results in the previous quarter were impacted by impairments of inventories and accounts receivable. Sapa's restructuring agenda is progressing according to plan and reported EBIT is affected by related restructuring charges.
pageFIRST QUARTERUnderlying EBIT 11
Finance Financial income (expense) First Fouth % change First % change
quarter quarter prior quarter prior year Year
NOK million 2014 2013 quarter 2013 quarter 2013
Interest income 60 65 (6)% 62 (2)% 232
Dividends received and net gain (loss) on securities 2 58 (96)% 39 (94)% 170
Financial income 63 122 (49)% 101 (38)% 402
Interest expense (97) (118) 17 % (94) (4)% (421)
Capitalized interest 1 1 68 % - >100% 2
Net foreign exchange gain (loss) 193 (688) >100% (114) >100% (2 246)
Net interest on pension liability (47) (53) 10 % (37) (28)% (180)
Other (21) (37) 43 % (33) 36 % (134)
Financial expense 29 (895) >100% (278) >100% (2 978)
Financial income (expense), net 92 (772) >100% (177) >100% (2 576)
The net foreign exchange gain for the first quarter primarily related to external US dollar debt and inter-company balances denominated in Euro and reflects a stronger Brazilian Real and Norwegian Krone. The net gain also includes an accumulated translation loss of about NOK 270 million recognized in relation to a liquidation of a subsidiary.
TaxIncome tax expense amounted to NOK 452 million for the first quarter of 2014 or about 49 percent of income before tax. The tax percent reflects the relatively high share of income subject to power surtax.

Items excluded from underlying EBIT and net incomeTo provide a better understanding of Hydro's underlying performance, the items in the table below have been excluded from EBIT and net income. Items excluded from underlying EBIT are comprised mainly of unrealized gains and losses on certain derivatives, impairment and rationalization charges, effects of disposals of businesses and operating assets, as well as other items that are of a special nature or are not expected to be incurred on an ongoing basis. Items excluded from underlying net income
1)
NOK million
First
quarter
2014
Fourth
quarter
2013
First
quarter
2013
Year
2013
Unrealized derivative effects on LME related contracts 2)
5 78 30 202
Unrealized derivative effects on power and raw material contracts 3)
(175) (14) 269 107
Metal effect, Rolled Products 4)
- 87 (5) 289
Significant rationalization charges and closure costs 5)
- 324 78 479
Impairment charges (PP&E and equity accounted investments) 6)
33 80 - 80
(Gains)/losses on divestments 7)
- 69 - -
Other effects 8)
- (311) - (311)
Items excluded in equity accounted investment (Sapa) 86 172 - 217
Items excluded from underlying EBIT (50) 485 372 1 063
Net foreign exchange (gain)/loss 9)
(193) 688 114 2 246
Calculated income tax effect 10)
170 (276) (141) (889)
Items excluded from continuing operations (74) 898 345 2 420
Items excluded from discontinued operations - - 40 30
Items excluded from underlying net income (74) 898 385 2 450
1) Negative figures indicate a gain and positive figures indicate a loss.
2) Unrealized gains and losses on contracts used for operational hedging purposes where hedge accounting is not applied, as well as for LME derivatives in equity accounted investments and elimination of changes in fair value of certain internal physical aluminium contracts.
3) Unrealized gains and losses on embedded derivatives in raw material and power contracts for own use and financial power contracts used for hedging purposes, as well as financial power contracts in equity accounted investments and elimination of changes in fair value of embedded derivatives within certain internal power contracts.
4) Timing differences resulting from inventory adjustments due to changing aluminium prices during the production, sales and logistics process, as well as inventory write-downs for Rolled Products.
5) Costs that are typically non-recurring for significant individual plants or operations, for example termination benefits, plant removal costs and clean-up activities in excess of legal liabilities, etc.
6) Write-downs of assets or groups of assets to estimated recoverable amounts in the event of an identified loss in value.
7) Net gain or loss on divested businesses and individual major assets.
8) Other effects include recognition of pension plan amendments and related curtailments and settlements, insurance proceeds, legal settlements, etc.
9) Realized and unrealized gains and losses on foreign currency denominated accounts receivable and payable, funding and deposits, and forward currency contracts purchasing and selling currencies that hedge net future cash flows from operations, sales contracts and working capital.
10) In order to present underlying net income on a basis comparable with our underlying operating performance, we have calculated an income tax effect of items excluded from underlying income before tax.
page FIRST QUARTERItems excluded from underlying EBIT and net income12

Items excluded from underlying EBIT - Operating segmentsThe following includes a summary table of items excluded from underlying EBIT for each of the operating segments and for Other and eliminations. Items excluded from underlying EBIT
1)
NOK million
First
quarter
2014
Fourth
quarter
2013
First
quarter
2013
Year
2013
Unrealized derivative effects on LME related contracts (4) 3 13 12
Legal settlements - 109 - 109
Bauxite & Alumina (4) 112 13 121
Unrealized derivative effects on LME related contracts (12) 23 72 81
Unrealized effects on physical power contracts 4 - - -
Unrealized derivative effects on power contracts 40 57 251 285
Unrealized derivative effects on power contracts (Søral) (33) 45 16 189
Unrealized derivative effects on raw material contracts 10 12 6 36
Insurance compensation (Qatalum) - (30) - (30)
Rationalization charges and closure costs - - - 7
Primary Metal 8 107 346 568
Unrealized derivative effects on LME related contracts 35 (5) (82) (12)
Pension - (7) - (7)
(Gains)/losses on divestments - - - (53)
Impairment charges 33 - - -
Metal Markets 69 (12) (82) (73)
Unrealized derivative effects on LME related contracts (16) 59 45 134
Metal effect - 87 (5) 289
Rationalization charges and closure costs - 12 - 85
(Gains)/losses on divestments - 69 - 69
Pension - (45) - (45)
Rolled Products (16) 182 41 532
Unrealized derivative effects on power contracts 3 (8) 4 (4)
Energy 3 (8) 4 (4)
Unrealized derivative effects on power contracts (198) (119) (9) (399)
Unrealized derivative effects on LME related contracts 1 (2) (19) (13)
Impairment charges - 80 - 80
Pension - (338) - (338)
(Gains)/losses on divestments - - - (16)
Rationalization charges and closure costs - 312 78 386
Items excluded in equity accounted investment (Sapa) 86 172 - 217
Other and eliminations 2)
(111) 104 51 (81)
Items excluded from underlying EBIT (50) 485 372 1 063
1) Negative figures indicate a gain and positive figures indicate a loss.
2) Unrealized derivative effects on power contracts and LME related contracts result from elimination of changes in the valuation of embedded derivatives within certain internal power contracts and elimination of changes in the valuation of certain internal aluminium contracts.
pageFIRST QUARTERItems excluded from underlying EBIT and net income 13

Interim financial statements
page FIRST QUARTERInterim financial statements14
Condensed consolidated statements of income (unaudited)
First quarter Year
NOK million, except per share data 2014 2013 2013
Revenue 18 282 16 109 64 877
Share of the profit (loss) in equity accounted investments 40 34 (240)
Other income, net 132 237 801
Total revenue and income 18 454 16 380 65 438
Raw material and energy expense 12 287 10 647 43 175
Employee benefit expense 2 033 1 986 7 360
Depreciation, amortization and impairment 1 117 1 131 4 644
Other expenses 2 194 1 912 8 596
Total expenses 17 632 15 676 63 775
Earnings before financial items and tax (EBIT) 822 704 1 663
Financial income 63 101 402
Financial expense 29 (278) (2 978)
Financial income (expense), net 92 (177) (2 576)
Income (loss) from continuing operations before tax 914 528 (913)
Income taxes (452) (274) (115)
Income (loss) from continuing operations 462 254 (1 029)
Income (loss) from discontinued operations - 9 189
Net income (loss) 462 263 (839)
Net income (loss) attributable to minority interests 69 (24) 81
Net income (loss) attributable to Hydro shareholders 393 287 (920)
Basic and diluted earnings per share from continuing operations (in NOK) 1) 2)
0.19 0.14 (0.54)
Basic and diluted earnings per share from discontinued operations (in NOK) 1)
- - 0.09
Basic and diluted earnings per share attributable to Hydro shareholders (in NOK) 1)
0.19 0.14 (0.45)
Weighted average number of outstanding shares (million) 2 039 2 038 2 038
1) Basic earnings per share are computed using the weighted average number of ordinary shares outstanding. There were no significant diluting elements.
2) Calculated using Income (loss) from continuing operations less Net income (loss) attributable to minority interests. There are no material minority interests in Income from discontinued operations.
The accompanying notes are an integral part of the condensed consolidated financial statements (unaudited).
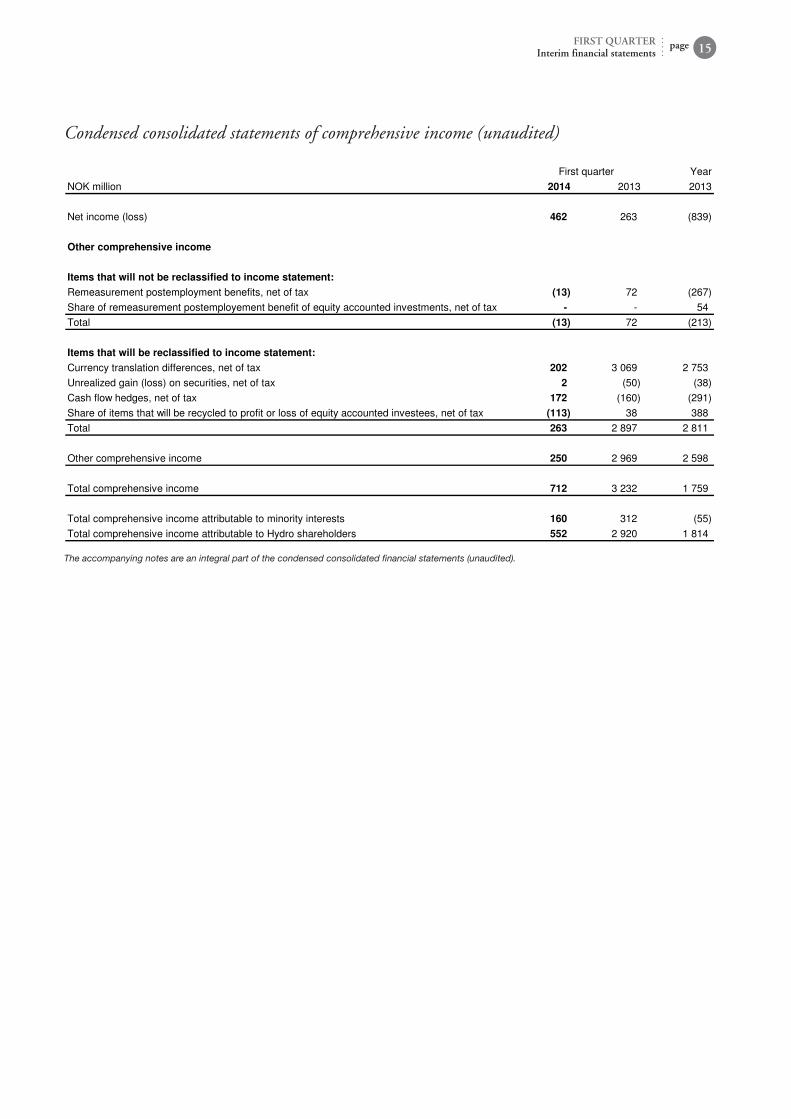
Condensed consolidated statements of comprehensive income (unaudited)
First quarter Year
NOK million 2014 2013 2013
Net income (loss) 462 263 (839)
Other comprehensive income
Items that will not be reclassified to income statement:
Remeasurement postemployment benefits, net of tax (13) 72 (267)
Share of remeasurement postemployement benefit of equity accounted investments, net of tax - - 54
Total (13) 72 (213)
Items that will be reclassified to income statement:
Currency translation differences, net of tax 202 3 069 2 753
Unrealized gain (loss) on securities, net of tax 2 (50) (38)
Cash flow hedges, net of tax 172 (160) (291)
Share of items that will be recycled to profit or loss of equity accounted investees, net of tax (113) 38 388
Total 263 2 897 2 811
Other comprehensive income 250 2 969 2 598
Total comprehensive income 712 3 232 1 759
Total comprehensive income attributable to minority interests 160 312 (55)
Total comprehensive income attributable to Hydro shareholders 552 2 920 1 814
The accompanying notes are an integral part of the condensed consolidated financial statements (unaudited).
pageFIRST QUARTERInterim financial statements 15

Condensed consolidated balance sheets (unaudited)
March 31 December 31
NOK million, except number of shares 2014 2013 2013
Assets
Cash and cash equivalents 6 476 6 411 8 412
Short-term investments 3 081 3 572 2 480
Accounts receivables 11 116 10 070 9 539
Inventories 9 599 10 266 10 070
Other current assets 325 429 181
Total current assets 30 597 30 748 30 681
Assets held for sale - 10 355 -
Property, plant and equipment 52 559 56 547 52 855
Intangible assets 5 598 5 994 5 562
Investments accounted for using the equity method 16 775 9 647 17 148
Prepaid pension 3 801 3 320 3 595
Other non-current assets 6 394 6 752 6 483
Total non-current assets 85 127 82 261 85 642
Total assets 115 724 123 364 116 324
Liabilities and equity
Bank loans and other interest-bearing short-term debt 6 255 5 345 6 220
Trade and other payables 9 073 9 294 9 197
Other current liabilities 3 002 3 254 3 433
Total current liabilities 18 330 17 894 18 850
Liabilities included in disposal groups - 3 532 -
Long-term debt 3 941 4 245 3 986
Provisions 2 714 2 548 2 684
Pension obligation 9 798 8 760 9 858
Deferred tax liabilities 2 833 4 326 2 853
Other non-current liabilities 2 133 3 304 2 828
Total non-current liabilities 21 418 23 183 22 209
Total liabilities 39 748 44 609 41 060
Equity attributable to Hydro shareholders 70 533 72 584 69 981
Minority interest 5 443 6 172 5 283
Total equity 75 976 78 755 75 264
Total liabilities and equity 115 724 123 364 116 324
Total number of outstanding shares (million) 2 039 2 038 2 039
The accompanying notes are an integral part of the condensed consolidated financial statements (unaudited).
page FIRST QUARTERInterim financial statements16

Condensed consolidated statements of cash flows (unaudited)
First quarter Year
NOK million 2014 2013 2013
Operating activities
Net income (loss) 462 263 (839)
Loss (income) from discontinued operations - (9) (189)
Depreciation, amortization and impairment 1 117 1 131 4 644
Other adjustments (2 330) (1 155) 1 586
Net cash provided by (used in) continuing operating activities (751) 230 5 202
Investing activities
Purchases of property, plant and equipment (585) (615) (2 867)
Purchases of other long-term investments (14) (8) (185)
Purchases of short-term investments (500) - (1 250)
Proceeds from sales of property, plant and equipment 1 42 64
Proceeds from sales of other long-term investments (19) 62 280
Proceeds from sales of short-term investments - 1 000 3 050
Net cash provided by (used in) continuing investing activities (1 117) 481 (908)
Financing activities
Loan proceeds 1 652 352 6 744
Principal repayments (1 486) (1 148) (7 255)
Net decrease in other short-term debt (11) (82) (241)
Proceeds from shares issued 5 31 56
Dividends paid (82) - (1 975)
Net cash provided by (used in) continuing financing activities 78 (847) (2 671)
Foreign currency effects on cash and bank overdraft (3) 102 183
Net cash used in discontinued operations (139) (600) (431)
Net increase (decrease) in cash, cash equivalents and bank overdraft (1 932) (634) 1 375
Cash, cash equivalents and bank overdraft at beginning of period 8 408 7 033 7 033
Cash, cash equivalents and bank overdraft at end of period 6 476 6 399 8 408
The accompanying notes are an integral part of the condensed consolidated financial statements (unaudited).
pageFIRST QUARTERInterim financial statements 17

Condensed consolidated statements of changes in equity (unaudited)
Equity
Additional Other attributable
Share paid-in Treasury Retained components to Hydro Minority Total
NOK million capital capital shares earnings of equity shareholders interests equity
January 1, 2013 2 272 29 056 (1 047) 49 018 (9 635) 69 663 5 835 75 498
Changes in equity for 2013
Capital contribution in subsidiaries 25 25
Total comprehensive income for the period 287 2 633 2 921 312 3 232
March 31, 2013 2 272 29 056 (1 047) 49 305 (7 002) 72 584 6 172 78 755
January 1, 2014 2 272 29 049 (1 006) 46 617 (6 950) 69 981 5 283 75 264
Changes in equity for 2014
Items not reclassified to income
statement in subsidiaries sold/liquidated 1 (1) - -
Total comprehensive income for the period 393 159 552 160 712
March 31, 2014 2 272 29 049 (1 006) 47 011 6 792 70 533 5 443 75 976
The accompanying notes are an integral part of the condensed consolidated financial statements (unaudited).
page FIRST QUARTERInterim financial statements18

Notes to the condensed consolidated financial statements
pageFIRST QUARTERNotes to the condensed consolidated financial statements 19
Note 1: Accounting policiesAll reported figures in the financial statements are based on International Financial Reporting Standards (IFRS). Hydro's accounting principles are presented in note 1 Significant accounting policies and reporting entity and note 2 Changes in accounting principles and new pronouncements in Hydro's Financial Statements - 2013. Hydro implemented IFRS 10, IFRS 11, IFRS 12 and the amended IAS 27 and IAS 31 as of January 1, 2014. The changes are made with retrospective application. The implementation of IFRS 11 Joint Arrangements resulted in changed accounting method for two jointly controlled entities, Aluminium Norf GmbH and Skafså ANS, which are deemed as joint operations under IFRS 11. In accordance with IFRS 11 Hydro reports its share of assets, liabilities, income and expenses in these entities, which were previously accounted for under the equity method. The main changes to previously reported numbers are shown in the table below. In addition there are minor changes to some other line items.
NOK millionEffect ofIFRS 11 Adjusted
Effect ofIFRS 11 Adjusted
Share of the profit (loss) in equity accounted investments 15 34 71 (240)
Depreciation, amortization and impairment 61 1 131 253 4 644
Earnings before financial items and tax (EBIT) (1) 704 (12) 1 663
Net income 263 (839)
Other comprehensive income 2 969 2 598
First quarter 2013 Year 2013
NOK millionEffect ofIFRS 11 Adjusted
Effect ofIFRS 11 Adjusted
Effect ofIFRS 11 Adjusted
Property, plant and equipment 1 996 54 204 1 978 56 547 2 184 52 855
Investments accounted for using the equity method (1 023) 9 211 (1 016) 9 647 (1 062) 17 148
Total assets 985 118 342 952 123 364 1 088 116 324
Total liabilities 985 42 844 952 44 609 1 088 41 059
Equity 75 498 78 755 75 264
Total liabilities and equity 985 118 342 952 123 364 1 088 116 324
January 1, 2013 March 31, 2013 December 31, 2013
The interim accounts are presented in accordance with IAS 34 Interim Financial Reporting. The condensed consolidated interim financial information should be read in conjunction with Hydro's Financial Statements - 2013 that are a part of Hydro's Annual Report - 2013. As a result of rounding adjustments, the figures in one or more columns may not add up to the total of that column.

Note 2: Operating segment informationHydro identifies its reportable segments and discloses segment information under IFRS 8 Operating Segments. This standard requires Hydro to identify its segments according to the organization and reporting structure used by management. See Hydro's Financial statements - 2013 note 7 Operating and geographic segment information for a description of Hydro's management model and segments, including a description of Hydro's segment measures and accounting principles used for segment reporting. The following tables include information about Hydro's operating segments, including a reconciliation of EBITDA to EBIT for Hydro's operating segments.
First quarter Year
NOK million 2014 2013 2013
Total revenue
Bauxite & Alumina 3 511 3 304 13 350
Primary Metal 6 618 5 945 23 279
Metal Markets 10 292 9 853 37 791
Rolled Products 5 238 5 015 20 092
Energy 1 539 1 762 6 279
Other and eliminations (8 917) (9 770) (35 914)
Total 18 282 16 109 64 877
External revenue
Bauxite & Alumina 2 208 1 982 8 124
Primary Metal 1 227 813 3 866
Metal Markets 8 719 7 429 29 646
Rolled Products 5 290 5 032 20 286
Energy 807 826 2 830
Other and eliminations 31 28 124
Total 18 282 16 109 64 877
Internal revenue
Bauxite & Alumina 1 304 1 322 5 226
Primary Metal 5 391 5 132 19 413
Metal Markets 1 573 2 424 8 144
Rolled Products (52) (17) (194)
Energy 732 936 3 449
Other and eliminations (8 948) (9 797) (36 038)
Total - - -
Share of the profit (loss) in equity accounted investments
Bauxite & Alumina - - -
Primary Metal 92 35 108
Metal Markets - - -
Rolled Products - - -
Energy - - -
Other and eliminations (51) - (348)
Total 40 34 (240)
page FIRST QUARTERNotes to the condensed consolidated financial statements20

First quarter Year
NOK million 2014 2013 2013
Depreciation, amortization and impairment
Bauxite & Alumina 410 429 1 718
Primary Metal 437 470 1 855
Metal Markets 49 18 98
Rolled Products 170 160 677
Energy 39 40 150
Other and eliminations 13 15 146
Total 1 117 1 131 4 644
Earnings before financial items and tax (EBIT) 1)
Bauxite & Alumina (284) (76) (1 178)
Primary Metal 303 19 855
Metal Markets 73 228 666
Rolled Products 197 110 83
Energy 431 513 1 657
Other and eliminations 102 (89) (420)
Total 822 704 1 663
EBITDA
Bauxite & Alumina 125 353 540
Primary Metal 745 492 2 726
Metal Markets 122 245 764
Rolled Products 367 270 761
Energy 471 553 1 807
Other and eliminations 115 (74) (274)
Total 1 944 1 839 6 323
Investments 2)
Bauxite & Alumina 60 692 1 198
Primary Metal 306 199 1 093
Metal Markets 7 15 74
Rolled Products 89 63 617
Energy 74 66 689
Other and eliminations 10 42 90
Total 546 1 077 3 761
1) Total segment EBIT is the same as Hydro group's total EBIT. Financial income and expense are not allocated to the segments. There are no reconciling items between segment EBIT to Hydro EBIT. Therefore, a separate reconciliation table is not presented.
2) Additions to property, plant and equipment (capital expenditures) plus long-term securities, intangible assets, long-term advances and investments in equity accounted investments. Excludes investments in discontinued operations.
NOK million EBIT
Depr.,
amor. and
impairment 1)
EBITDA
EBIT - EBITDA First quarter 2014
Bauxite & Alumina (284) 410 125
Primary Metal 303 441 745
Metal Markets 73 49 122
Rolled Products 197 170 367
Energy 431 39 471
Other and eliminations 102 13 115
Total 822 1 122 1 944
1) Depreciation, amortization and impairment write-down of tangible and intangible assets, and amortization of excess values in equity accounted investments and impairment loss of such investments.
pageFIRST QUARTERNotes to the condensed consolidated financial statements 21

Note 3: Contingencies
page FIRST QUARTERNotes to the condensed consolidated financial statements22
Hydro is involved in or threatened with various legal and tax matters arising in the ordinary course of business. Hydro is of the opinion that resulting liabilities, if any, will not have a material adverse effect on its consolidated results of operations, liquidity or financial position.
Note 4: Discontinued operationsDiscontinued operations and assets held for sale reported in 2013 relates to Hydro's Extruded Products activities contributed to the 50 percent owned joint venture Sapa, established on September 1, 2013. Summary of financial data for discontinued operations
Year
NOK million 2014 2013 2013
Revenue and other income - 4 169 11 531
Share of the profit (loss) in equity accounted investments - 5 10
Depreciation, amortization and impairment - - -
Other expenses - 4 142 11 347
Earnings before financial items and tax - 32 194
Financial income (expense), net - (19) (52)
Income (loss) before tax - 13 142
Income tax expense - (4) (28)
Gain on disposal - - 75
Income (loss) from discontinued operations - 9 189
Net cash provided by (used in) operating activities - (482) (238)
Net cash used in investing activities (139) (98) (285)
Net cash provided by (used in) financing activities - - (12)
Foreign currency effects on cash - 7 11
Net (increase) decrease in cash classified as assets held for sale - (27) 93
Net cash used in discontinued operations (139) (600) (431)
First quarter
Asset groups held for sale
December 31
NOK million 2014 2013 2013
Current assets - 5 405 -
Non-current assets - 4 950 -
Total assets - 10 355 -
Current liabilities - 1 212 -
Non-current liabilities - 2 320 -
Assets held for sale, net - 6 823 -
March 31

Additional information
pageFIRST QUARTERAdditional information 23
Financial calendar
May 7 Annual General Meeting
July 22 Second quarter results
October 22 Third quarter results
Hydro reserves the right to revise these dates.
Cautionary note Certain statements included within this announcement contain forward-looking information, including, without limitation, those relating to (a) forecasts, projections and estimates, (b) statements of management's plans, objectives and strategies for Hydro, such as planned expansions, investments or other projects, (c) targeted production volumes and costs, capacities or rates, start-up costs, cost reductions and profit objectives, (d) various expectations about future developments in Hydro's markets, particularly prices, supply and demand and competition, (e) results of operations, (f) margins, (g) growth rates, (h) risk management, as well as (i) statements preceded by "expected", "scheduled", "targeted", "planned", "proposed", "intended" or similar statements.
Although we believe that the expectations reflected in such forward-looking statements are reasonable, these forward-looking statements are based on a number of assumptions and forecasts that, by their nature, involve risk and uncertainty. Various factors could cause our actual results to differ materially from those projected in a forward-looking statement or affect the extent to which a particular projection is realized. Factors that could cause these differences include, but are not limited to: our continued ability to reposition and restructure our upstream and downstream aluminium business; changes in availability and cost of energy and raw materials; global supply and demand for aluminium and aluminium products; world economic growth, including rates of inflation and industrial production; changes in the relative value of currencies and the value of commodity contracts; trends in Hydro's key markets and competition; and legislative, regulatory and political factors.
No assurance can be given that such expectations will prove to have been correct. Hydro disclaims any obligation to update or revise any forward-looking statements, whether as a result of new information, future events or otherwise.

Norsk Hydro ASANO-0240 Oslo Norway
Tel.: +47 22 53 81 00www.hydro.com
Design and production: Hydro/Artbox 04/2014 Print: Printbox © Hydro 2014
Hydro is a global aluminium company with production, sales and trading activities throughout the value chain, from bauxite, alumina and energy generation to the production of primary aluminium and rolled products as well as recycling. Based in Norway, the company has 13,000 employees involved in activities in more than 50 countries on all continents. Rooted in more than a century of experience in renewable energy production, technology development and progressive partnerships, Hydro is committed to strengthening the viability of the customers and communities we serve.