hydrodynamic characterization of an electrochemical cell...
TRANSCRIPT

INTERNATIONAL JOURNAL OF CHEMICAL
REACTOR ENGINEERING
Volume 8 2010 Article A95
Hydrodynamic Characterization of anElectrochemical Cell with Rotating Disc
Electrode: A Three-Dimensional BiphasicModel
Cesar A. Real-Ramirez∗ Raul Miranda-Tello†
Luis F. Hoyos-Reyes‡ Jesus I. Gonzalez-Trejo∗∗
∗Universidad Autonoma Metropolitana, Azcapotzalco, [email protected]†Universidad Autonoma Metropolitana, Azcapotzalco, [email protected]‡Universidad Autonoma Metropolitana, Azcapotzalco, [email protected]∗∗Universidad Autonoma Metropolitana, Azcapotzalco, [email protected]
ISSN 1542-6580Copyright c©2010 The Berkeley Electronic Press. All rights reserved.
Hydrodynamic Characterization of anElectrochemical Cell with Rotating Disc Electrode: A
Three-Dimensional Biphasic Model∗
Cesar A. Real-Ramirez, Raul Miranda-Tello, Luis F. Hoyos-Reyes, and Jesus I.Gonzalez-Trejo
AbstractElectrochemical cells with a rotating disc electrode are the preferred devices to
characterize electrochemical reactions because simple analytical expressions canbe used to interpret the information obtained from physical experiments. Theseequations assume that the velocity field in the vicinity of the electrode active faceis in accordance with the ideal behavior described by von Karman. Experimen-tal liquid velocity measurements inside the cell reported in recent works suggestthat the actual liquid flow pattern is not fully in accordance with the assumedideal behavior. In this work, the Computational Fluid Dynamics technique wasemployed to characterize numerically the flow pattern inside the electrochemicalcell. By using a three-dimensional model, symmetric conditions were not im-posed. A biphasic system was employed to evaluate the influence of liquid freesurface over the flow pattern. Unsteady state numerical simulations were per-formed using the commercial software Fluent. Multiple electrode rotation speedsand several cell sizes were employed. Contrary to the assumed behavior, it wasobtained that the flow pattern inside the electrochemical cell is not symmetric dueto the synergetic effect of the cell walls, the submerged electrode side wall andthe liquid free surface. This work states that the differences between actual andthe ideal flow patterns can be minimized with plain electrode and cell geometricalmodifications.
KEYWORDS: Computational Fluid Dynamics, biphasic model, electrochemicalcell, rotating disc electrode
∗J. Gonzalez-Trejo thanks to Consejo Nacional de Ciencia y Tecnologıa (CONACYT) for thefinancial support under grants No. 90595. C.A. Real-Ramirez thanks to Consejo Nacional deCiencia y Tecnologıa (CONACYT-SNI) for the financial support under grants No. 45424. Numer-ical simulations were done in the Laboratorio de Computo Cientifico, Departamento de Sistemas,at Universidad Autonoma Metropolitana Azcapotzalco.

1 INTRODUCTION The study of electrochemical cells with a rotating disc electrode is a significant topic in electrochemistry and fluid mechanics because numerous electrochemical processes such as electro deposition and heterogeneous reactions have been studied and characterized through these devices (Bard and Faulkner 2001). Several authors have recognized the importance of the fluid flow inside the cell (Dong, Santhanagopalan et al. 2008), but at the present this system has not been fully characterized.
Owned to its advantages, electrochemical cells with a rotating disc electrode are being employed to face non-traditional problems. For instance, measurements of the zeta potential of planar solid surfaces by means of a constant speed rotating disc are presented in (Sides and Hoggard 2004). In accordance with this work, the von Kármán theory (von Kármán 1921) agrees well with experimental results near the rotating axis, but deteriorates at the edge of the disc.
On the other hand, to facilitate the study of gas evolution in electrochemical reactions, an inverted rotating disc electrode reactor was validated in (Parys, Tourwé et al. 2008). Compared with the rotating disc electrode reactor, the working electrode is changed in position from the top to the bottom of the electrochemical cell. In accordance with these authors, the same analytical equations of mass and charge transfer can be used in both, the rotating disc electrode reactor and the inverted rotating disc electrode reactor.
The early theoretical works dedicated to the hydrodynamic study of this system were presented by von Kármán (von Kármán 1921) and Cochran (Cochran 1934). They considered the steady motion of an incompressible viscous fluid due to an infinite rotating plane lamina and obtained analytical expressions for the liquid velocity field. These expressions were employed to obtain an analytical expression for the mass transfer around the electrode, by correlating the boundary layers heights with the electrode rotating speed, the diffusion coefficient and the fluid viscosity (Levich 1962). After that, many electrochemical studies have made improvements on these expressions (Newman 1966).
On the other hand, to enhance the accuracy of the measurements carried out on these cells, it has been proposed that instead of use the von Kármán (von Kármán 1921) and Cochran (Cochran 1934) analytical expressions to calculate the displacement layer, the results obtained with the Computational Fluid Dynamics (CFD) technique must be employed.
For instance, two-dimensional axisymmetric numerical simulations were carried out in (Mandin, Pauporte et al. 2004) and compared with the fluid flow pattern calculated with the von Kármán (von Kármán 1921) and Cochran (Cochran 1934) analytical expressions. It was found that the velocity profiles
1Real-Ramirez et al.: Hydrodynamic Characterization of an Electrochemical Cell
Published by The Berkeley Electronic Press, 2010

calculated with these expressions are in accordance with numerical simulations only in a narrow region close to the electrode active face.
There are significant differences in the extent of the electrochemical cell volume of the mathematical models reported in literature. The entire cell volume was simulated in (Mandin, Pauporte et al. 2004) whereas in (Dong, Santhanagopalan et al. 2007), only a small amount of liquid below a rotating disc ring electrode was considered. In (Mandin, Pauporte et al. 2004) and (Dong, Santhanagopalan et al. 2007), only the electrode active face is in contact with the fluid. Nevertheless, a common practice of submerge working electrode into the cell liquid was not considered in those works. The significance of the submerged electrode side wall was showed by means of two-dimensional numerical simulations of an electrochemical cell with a rotating cylinder electrode in (Mandin, Fabian et al. 2006). Dong et al. (Dong, Santhanagopalan et al. 2008) carried out two-dimensional axisymmetric numerical simulations of a cell with a rotating disc electrode where the electrode is submerged into the electrolyte and the entire cell was modeled. Moreover, to include the existence of an air-liquid interface in actual electrochemical cells, a slip wall was employed as boundary condition for the cell upper wall to represent numerically this interface. These authors states fitness between their results and that obtained with the theoretical model proposed by von Kármán (von Kármán 1921) and Cochran (Cochran 1934).
Almost all the numerical simulations of the hydrodynamic behavior of the electrolyte inside the cell have used two-dimensional models also axisymmetric condition was imposed. Nevertheless, there has been controversy about the fundamental nature of the flow, axisymmetric or three-dimensional in the swirling flow between a rotating lid and a stationary cylinder, a system intimately related with an electrochemical cell with a rotating disc electrode.
It was reported in (Sorensen, Naumov et al. 2006) that the system flow is governed by two parameters, the Reynolds number and the ratio of container height to disc radius. In that work, it was observed that the flow is axisymmetric and steady for small Reynolds numbers. However, when the Reynolds number was increased, the flow becomes unsteady and three-dimensional.
Recently, it was shown that confined containers with a swirling wall can exhibit axisymmetric behavior only when their flow environment is completely disturbance free (Ventikos 2002). In that system, the most important disturbances are associated with the container upper cover.
2 International Journal of Chemical Reactor Engineering Vol. 8 [2010], Article A95
http://www.bepress.com/ijcre/vol8/A95
Due to the size and inner geometry of most of the electrochemical cells, scarce measurements of the liquid velocities inside the cell are reported. However, measurements of liquid velocities inside a cell with a rotating disc electrode through the Doppler Laser Anemometry (DLA) technique were performed in (Mandin, Pauporte et al. 2004). In that work, reproducible high amplitude oscillations that increased substantially with the electrode rotation speed were observed. These authors also compared their experimental measurements with the results of a two-dimensional axisymmetric mathematical model, but liquid velocities oscillations were not reproduced.
The aim of this work is to use the CFD technique to determine the fluid flow pattern inside the entire volume of an electrochemical cell with a rotating disc electrode where most of the restrictions imposed in previous works are removed. A three- dimensional mathematical model is used in order to overcome the axisymmetric restriction imposed to the cell fluid flow pattern. The working electrode is partially submerged into the cell liquid. Therefore, the motion of the liquid into the cell is caused by the electrode bottom face and the electrode submerged sidewall. In addition, the electrochemical cell is a biphasic system. In the upper cell zone there is a gas and the rest of the cell is filled with a liquid. Therefore, the effect of the liquid free surface on the cell fluid flow pattern can be correctly evaluated. By changing the electrochemical cell height, the effect of the distance between the electrode active face and the cell bottom on the cell inner hydrodynamic behavior is evaluated. Finally, a comparison between the fluid flow pattern obtained in this work and that calculated with the model of von Kármán (von Kármán 1921) and Cochran (Cochran 1934) is carried out. The comparison is focused on the electrode active face vicinity, given that electrochemical reactions takes place on this zone. In this work the reference electrode and the counter-electrode are not present into the cell. A feasible cell configuration with these properties will be constructed with two concentric cylinders, electrically and hydraulically connected through small holes in the inner cylinder, near the cell bottom. The upper and undersides are shared by both cylinders. The reference electrode is located inside the annular space and the counter-electrode is at the bottom of the inner cylinder, along their perimeter. The electrochemical characterization of this cell will be presented in a future work.
3Real-Ramirez et al.: Hydrodynamic Characterization of an Electrochemical Cell
Published by The Berkeley Electronic Press, 2010
This paper is organized as follows. In the next section, a detailed description of the employed numerical models is presented. In first place, the system originally established by von Kármán (von Kármán 1921), which will be named as the “ideal” model is presented. Besides, its hypothesis and inherent restrictions are discussed. In addition, some analytical approximate solutions to this model like that obtained by Cochran (Cochran 1934) are presented. Thereafter, the characteristics of the three-dimensional biphasic model proposed in this work are detailed. In the Results and Discussion section, the procedure employed to solve the three-dimensional biphasic model is presented. Then, the fluid flow pattern inside the cell obtained with this model is shown and compared with that obtained with the ideal model. Finally, the repercussions of the results obtained with the three-dimensional biphasic model on the design of hydrodynamical optimized new cells are analyzed in Concluding Remarks section.
2 MATHEMATICAL MODELS
2.1 IDEAL MODEL
2.1.1 System characteristics The ideal model consider the steady-state motion of an incompressible Newtonian viscous fluid due to an infinite rotating plane disc whose thickness is equal to zero (von Kármán 1921). The fluid density and viscosity remain constant. Additionally, the fluid is infinite in extent and is located above the disc. Given that the rotating disc acts as a centrifugal fan, the fluid moves radially outwards near the disc. Therefore, to preserve continuity, an axial motion towards the lamina is generated (Cochran 1934).
2.1.2 Governing equations With the system characteristics described above and assuming that the flow is laminar, the continuity and the Navier-Stokes equations in cylindrical coordinates can be expressed as follows:
0u wu r rr z∂ ∂
+ + =∂ ∂
(1)
4 International Journal of Chemical Reactor Engineering Vol. 8 [2010], Article A95
http://www.bepress.com/ijcre/vol8/A95

2 2 2
2 2
2 2
2 2
2 2
2 2
1
1 1
u v u p u u uu wr r z r r r r z
v uv v v v vu wr r z r r r z
w w p w w wu wr z z r r r z
νρ
ν
νρ
∂ ∂ ∂ ∂ ∂ ∂ − + = − + + + ∂ ∂ ∂ ∂ ∂ ∂ ∂ ∂ ∂ ∂ ∂ − + = + + ∂ ∂ ∂ ∂ ∂
∂ ∂ ∂ ∂ ∂ ∂+ = − + + + ∂ ∂ ∂ ∂ ∂ ∂
(2)
Where u , v and w are the radial, the angular and the axial velocity components respectively. In (1) and (2), r and z are the radial and axial coordinates, p is the pressure, ρ is the density of the fluid and ν is the kinematic viscosity of the fluid.
The boundary conditions for (1) and (2) are as follows. At the disc surface ( )0z = , a non-slip condition is assumed, that is, 0u = , 0w = and v rω= ,
where ω is the electrode rotation speed. Far from the disc ( )z →∞ , it is assumed that there is no flow in the radial and the angular directions, which can be expressed as 0u = and 0v = . In addition, the axial velocity reaches its limiting velocity 0U , that is, 0w U= .
von Kármán (von Kármán 1921), introduced the following dimensionless independent (Equation 3) and dependent variables (Equation 4):
νωξ z= (3)
( ) uFr
ξω
= , ( ) vGr
ξω
= , ( ) wH ξν ω
= and ( ) pP ξρν ω
= (4)
After applying the variable change, Equations (1) and (2) can be rewritten as a set of four ordinary differential equations: 2 ' 0F H+ = (5)
2 2" ' 0F HF F G− − + = (6)
" ' 2 0G HG FG− − = (7)
'' ' ' 0H HH P− − = (8)
5Real-Ramirez et al.: Hydrodynamic Characterization of an Electrochemical Cell
Published by The Berkeley Electronic Press, 2010
The boundary conditions for the system are: 0H F P= = = , 1G = at 0ξ = , (9)
and 0F G= = at ξ = ∞ (10)
It is necessary to mention that the similarity transformation that results from the von Kármán postulates remains applicable even when the fluid at infinity is rotating about the axis of the disc (Lai, Rajagopal et al. 1985). Recently, it has been mathematically proved that non-axisymmetric flow regimes above a rotating infinity disc in a rotating infinity fluid can be obtained although the axisymmetric boundary conditions are still satisfied at the disc surface and at infinity (Hewitt and Duck 2000).
2.1.3 Approximate solutions Several authors have developed axisymmetric approximate solutions to the equations system (5)-(7) subject to boundary conditions given by Equations (9) and (10). The most famous approximate solution was obtained by Cochran (Cochran 1934), which is composed by two sets of functions. The first set is valid only near the disc ( )0ξ → :
2 312 3
bF aξ ξ ξ= − − + (11)
3113
G b aξ ξ= + + + (12)
2 3 413 6
bH aξ ξ ξ= − + + + (13)
The second set is valid far from the disc ( )ξ →∞ :
( ) ( )2 2 2 2
2 32 42 4
A B A A BF Ae e eαξ αξ αξ
α α− − −
+ += − + + (14)
6 International Journal of Chemical Reactor Engineering Vol. 8 [2010], Article A95
http://www.bepress.com/ijcre/vol8/A95
( )2 2
3412
B A BG Be eαξ αξ
α− −
+= − + (15)
( ) ( )2 2 2 2
2 33 5
22 6
A B A A BAH e e eαξ αξ αξαα α α
− − −+ +
= − + − + + (16)
Where in both sets, a , b , A , B and α are constants. Recently, Ariel (Ariel 1996) presented an alternative solution in which is
possible to obtain better results than that obtained with other approximate methods:
( ) ( )2 2 21 4 1 12 ln8 3 2
eF e e e eβ ξ
β ξ β ξ β ξ β ξβ − − − − −= − + −
(17)
( )21 43
G e eβ ξ β ξ− −= − (18)
( ) ( )2 21 4 1 14 ln 2 38 3 2
eH e e e eβ ξ
β ξ β ξ β ξ β ξβ − − − − −= − − − +
(19)
Where ξ is defined as in Equation (3) and 0.9130294741β = . Another advantage of the solution proposed by Ariel over that obtained by Cochran is that Equations (17)-(19) can be evaluated for any value of ξ such that 0 ξ≤ < ∞ . Volgin and Davydov (Volgin and Davydov 2007) shown that the error associated to the available approximate equations to calculate the velocity field range from 1 to 0.01%. In addition, they found that to provide an accuracy of about 0.1%, the length of computational region should be approximately twice the diffusion layer thickness. To reach higher accuracy, the extension of the computational region must be increased.
2.2 THREE-DIMENSIONAL BIPHASIC MODEL
2.2.1 System characteristics For the three-dimensional biphasic model, an electrochemical cell model whose dimensions and operating conditions are similar to the cells used in current electrochemical studies is employed. This means that von Kármán’s model
7Real-Ramirez et al.: Hydrodynamic Characterization of an Electrochemical Cell
Published by The Berkeley Electronic Press, 2010

constrains related with an infinite radius disc and an infinite in extent fluid are removed. In addition, it must be considered a common practice to submerge the working electrode into the cell liquid to ensure the contact between fluid and electrode active surface. Therefore, the motion of the liquid into the cell is caused not only by the electrode bottom face, but the electrode submerged sidewall also contributes to the liquid movement. As in the ideal case, the electrode is positioned in the middle of the cell transversal section.
There are significant differences of the model studied in this paper with respect to that previously reported in literature:
i) Traditionally, only a plane or an electrochemical cell section is used, but a full three-dimensional numerical model is proposed in this work.
ii) The three-dimensional model allows for non-symmetry by not assuming symmetry in any of the three dimensions as in other works (Mandin, Pauporte et al. 2004; Mandin, Fabian et al. 2006; Mandin, Fabian et al. 2006).
iii) A biphasic system is considered, a liquid on the cell bottom and a gas over the liquid. The interface has a significant influence on the resulting cell flow pattern. In the present work, a cylindrical electrochemical cell with internal
diameter of 27.00 10 m−× is studied. A typical commercial electrode with external diameter of 21.50 10 m−× is used. This means that the ratio between the cell and electrode diameters is 4.5 approximately.
It has pointed out that depending on the cell dimensions and other operating conditions such as the electrode immersion depth and rotating speed, the fluid flow pattern near the electrode active surface is modified by the synergetic effect of the electrode sidewall, the liquid free surface and the cell walls (Dong, Santhanagopalan et al. 2008). In all the cases studied in this work, the electrode immersion depth is 21.50 10 m−× , therefore, the ratio between the electrode external diameter and its immersion depth is one.
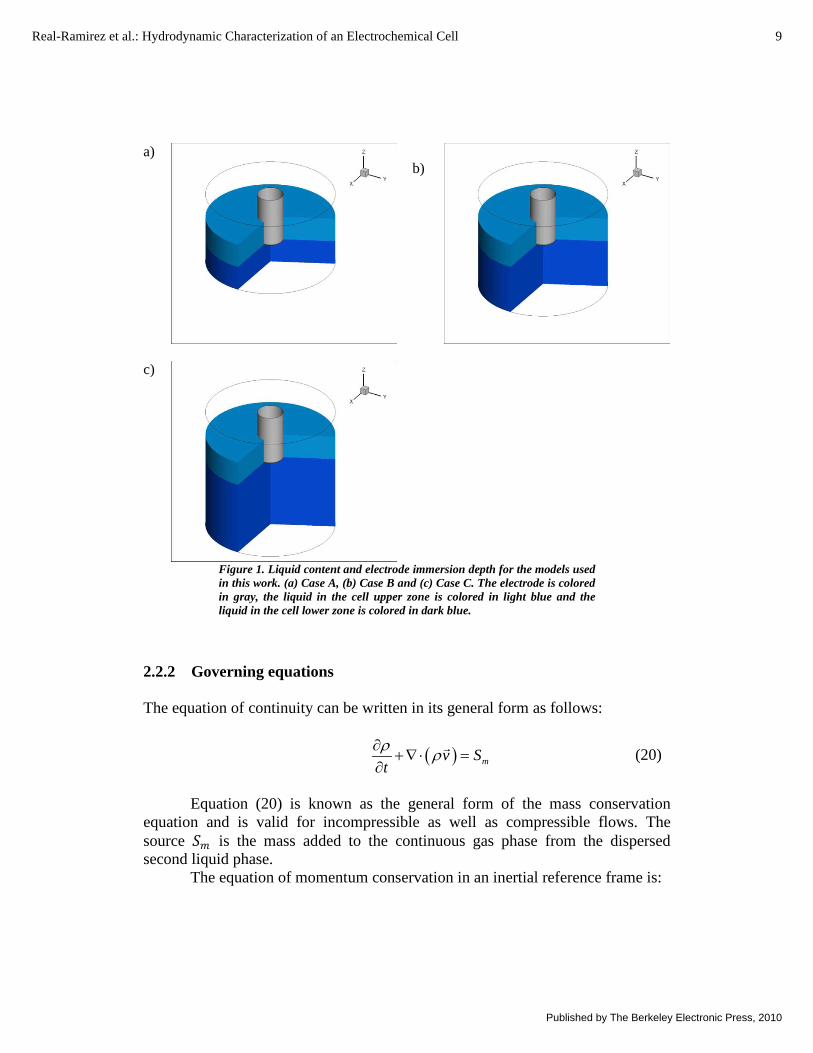
Three cell geometries named as Case A, Case B and Case C with different distances between the electrode active face and the cell bottom are studied. These distances are normalized using the electrode external diameter, and corresponds to one, two and three times the external electrode diameters for Case A, B and C respectively. Figure 1 shows the height of the liquid phase and the electrode immersion depth. An electrochemical cell with a normalized distance between the electrode active face and the cell bottom similar to Case B was studied in (Mandin, Pauporte et al. 2004; Mandin, Fabian et al. 2006; Mandin, Fabian et al. 2006) and (Mangiavacchi, Pontes et al. 2007).
8 International Journal of Chemical Reactor Engineering Vol. 8 [2010], Article A95
http://www.bepress.com/ijcre/vol8/A95
a)
b)
c)
Figure 1. Liquid content and electrode immersion depth for the models used in this work. (a) Case A, (b) Case B and (c) Case C. The electrode is colored in gray, the liquid in the cell upper zone is colored in light blue and the liquid in the cell lower zone is colored in dark blue.
2.2.2 Governing equations The equation of continuity can be written in its general form as follows:
( ) mv Stρ ρ∂+∇⋅ =
∂ (20)
Equation (20) is known as the general form of the mass conservation equation and is valid for incompressible as well as compressible flows. The source 𝑆𝑆𝑚𝑚 is the mass added to the continuous gas phase from the dispersed second liquid phase.
The equation of momentum conservation in an inertial reference frame is:
9Real-Ramirez et al.: Hydrodynamic Characterization of an Electrochemical Cell
Published by The Berkeley Electronic Press, 2010
( ) ( ) ( )v vv p g Ftρ ρ τ ρ∂
+∇ ⋅ = −∇ +∇⋅ + +∂
(21)
Where p is the static pressure, τ is the stress tensor, gρ is the
gravitational body force and F
is the external body force. The stress tensor τ is given by:
( ) 23
Tv v v Iτ µ = ∇ +∇ − ∇⋅ (22)
Where µ is the molecular viscosity and I is the unit tensor. The second term on the right hand side is known as the effect of volume dilation.
The finite volume method is employed to solve the numerical model and the Volume of Fluid (VOF) model was used to solve the equations associated with the multiphase condition. For multiphase systems with n -phases, it is necessary to solve transport equations for each phase. For an arbitrary k scalar in phase l , denoted by k
lφ , Fluent (Fluent Inc. 2006) solves the transport equation inside the volume occupied by phase l :
( )Γk
k k k kl l ll l l l l l l lu S
tα ρ φ α ρ φ α φ∂
+∇⋅ − =∂
, for 1, ,k n= (23)
Where lα , lρ and lu are the volume fraction, the physical density, and the velocity of phase l , respectively. k
lΓ and klS are the diffusion coefficient and
source term, respectively. The mass flux for phase l is defined as:
l l l lS
F du Sα ρ= ⋅∫
(24)
In the VOF model, the tracking of the interface between the phases is
accomplished by the solution of a continuity equation for the volume fraction of one (or more) of the phases. For the q th phase, this equation has the following form:
10 International Journal of Chemical Reactor Engineering Vol. 8 [2010], Article A95
http://www.bepress.com/ijcre/vol8/A95
( ) ( ) ( )1
1q
n
q pq qq q pqq p
q v mSt
mαα ρ α ρρ =
∂+∇ ⋅ = + − ∂
∑
(25)
Where pqm is the mass transfer from phase p to phase q and qpm is the
mass transfer from phase q to phase p . Usually, the source term on the right-hand side of equation (25),
qSα , is taken as zero.
The volume fraction equation is not solved for the primary phase. The primary-phase volume fraction is computed based on the following constraint:
1
1n
α=
=∑ (26)
The volume fraction equation is solved through implicit time discretization and first order upwind interpolation schemes are used to obtain the face fluxes for all cells, including those near the interface:
( )1 1
1 1 1,
1q
n n n n nq q q q n n n
q f q f pp
pq qf
V U S m m Vt α
α ρ α ρρ α
+ ++ + +
=
− + = + − ∆ ∑ ∑
(27)
Since that equation (27) requires the volume fraction values at the current time step, a standard scalar transport equation is solved iteratively for each one of the secondary phases volume fractions at each time step.
2.2.3 Boundary conditions The fluid and structure interaction has a significant effect on the numerical simulations. In this work, the non-slip condition was used at the cell and electrode bottom and side walls. The wall adhesion was also considered and a constant value of 60° was employed as is recommended in literature (Fluent Inc. 2006).
To deal with the biphasic nature of the system, the effect of the liquid-gas surface tension was included and a boundary condition of open channel flow was also applied as is recommended in literature (Fluent Inc. 2006). The parameters associated with this condition were studied and calculated to ensure computational stability. In addition, the gravitational force was considered.
Finally, the cell upper wall was defined as a pressure outlet. The operating pressure was defined as 51.01 10 Pa× .
11Real-Ramirez et al.: Hydrodynamic Characterization of an Electrochemical Cell
Published by The Berkeley Electronic Press, 2010
3 RESULTS AND DISCUSSION
3.1 IMPLEMENTATION ISSUES
3.1.1 Physical properties and operating conditions For numerical simulations, it was considered that liquid and gas phases on the electrochemical cell are composed by water and air respectively. At 25°C, density of water and air are 29.98 10× and 0 31.20 10 kg m−× respectively. Dynamic viscosities are 31.00 10−× and 51.82 10 Pa s−× for water and air respectively. The value of the water-air surface tension employed in this work was defined with a constant value of 2 17.28 10 N m− −× .
Some authors have argued that the hydrodynamic behavior on the electrode active face vicinity is altered due to changes in liquid viscosity (Mangiavacchi, Pontes et al. 2007) and density (Mandin, Fabian et al. 2006) as a consequence of the electrochemical reaction. However, given that the electrochemical reaction is not considered yet in this work, viscosity and density remains constant in both phases.
For each Case shown in Figure 1, eight values for the electrode rotation speed (ω ), were simulated at 25, 50, 75, 100, 125, 150, 175 and 200 1rad s− . These rotation speeds (ranging from 239 to 1910 rpm ) are employed in actual electrochemical studies.
3.1.2 Numerical aspects All numerical simulations were performed using the commercial software Fluent, version 6.3.26 (Fluent Inc. 2006). Three computational meshes were built for Cases A, B and C, constituted by 2,113,049, 2,286,777 and 2,516,669 cells respectively, or 361,391, 391,937 and 430,837 nodes. It was employed a hybrid mesh with a size function for the electrode vicinity with an initial size of
62.00 10 m−× and limited to 42.00 10 m−× . This approach ensures a stable computing with under-relaxing coefficients defined between 0.7 and 0.99.
The flow characteristics in the vicinity of rotating discs and cylinders using two different grid topologies, an axisymmetric and a cartesian grid were calculated in (Adair and Tucker 1997). The solutions obtained with both grids were in accordance with experimental data. It was concluded that the flow pattern is independent on the grid structure.
12 International Journal of Chemical Reactor Engineering Vol. 8 [2010], Article A95
http://www.bepress.com/ijcre/vol8/A95
In the present work, convergence was reached when all the residuals of numerical variables of the turbulent flow was smaller than 31.00 10−× . After numerous simulations, it was found that a time step of 31.00 10 s−× guarantees numerical convergence and preserves solution stability.
The origin of the coordinate system was located at the center of the electrode active face. The liquid below the electrode active face has negative z values.
3.2 THREE-DIMENSIONAL BIPHASIC MODEL To analyze the results obtained with the three-dimensional biphasic model, the liquid inside the cell will be divided in two zones. The first is named as lower zone, which is composed by the liquid whose z values are negative, that is, the liquid below the plane defined by the electrode active face. The liquid above this plane constitutes the upper zone. The height of the liquid lower zone is the distance between cell bottom wall and electrode active face. The interface between gas and liquid inside the cell constitutes the liquid free-surface. The amount of liquid in cell upper zone is the same for Cases A, B and C. On the contrary, the total amount of liquid in the lower zone for Cases B and C compared with Case A are two and three times respectively.
Despite unsteady state simulations were conducted in all cases, a quasi-steady state was reached for the three lower electrode rotation speeds (25, 50 and 75 rad s-1). A very complex behavior was obtained for the higher electrode rotation speeds (150, 175 and 200 rad s-1). Nevertheless, for the middle electrode rotation speeds, a quasi-periodic behavior was observed.
Recently, the study of the classic problem of the laminar flow of an incompressible rotating fluid above a rotating infinite disc, it was found that there exist non-axisymmetric travelling-wave states that satisfy axisymmetric boundary conditions at infinity and at the disc (Hewitt and Duck 2000). Moreover, through Laser Doppler Anemometry (LDA) measurements, a region with oscillations of rather high amplitude was experimentally observed inside the electrochemical cell (Mandin, Pauporte et al. 2004).
Table I shows the integral of the kinetic energy over the liquid content on both liquid zones for each case. The kinetic energy is directly proportional to the square of the product of the mean flow velocity times and the turbulence intensity. For each electrode rotation speed, the maximum values are presented in bold and the minimum are in italics.
13Real-Ramirez et al.: Hydrodynamic Characterization of an Electrochemical Cell
Published by The Berkeley Electronic Press, 2010
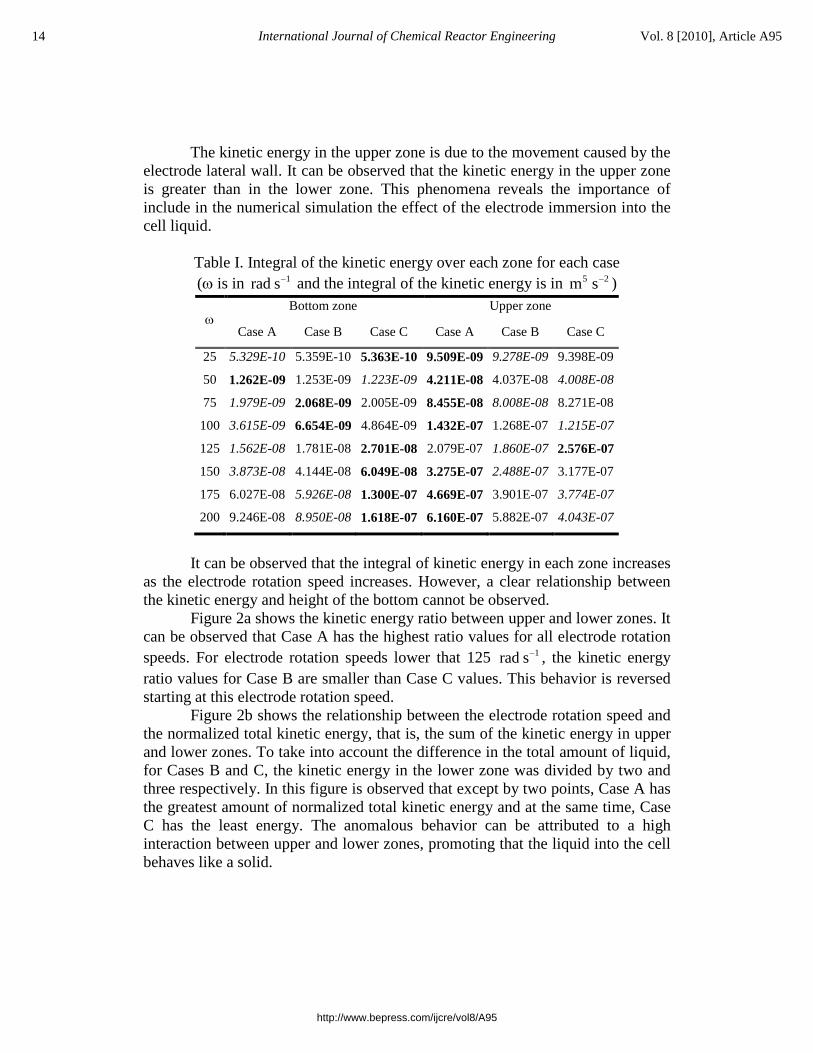
The kinetic energy in the upper zone is due to the movement caused by the electrode lateral wall. It can be observed that the kinetic energy in the upper zone is greater than in the lower zone. This phenomena reveals the importance of include in the numerical simulation the effect of the electrode immersion into the cell liquid.
Table I. Integral of the kinetic energy over each zone for each case (ω is in 1rad s− and the integral of the kinetic energy is in 5 2m s− )
ω Bottom zone Upper zone
Case A Case B Case C Case A Case B Case C
25 5.329E-10 5.359E-10 5.363E-10 9.509E-09 9.278E-09 9.398E-09
50 1.262E-09 1.253E-09 1.223E-09 4.211E-08 4.037E-08 4.008E-08
75 1.979E-09 2.068E-09 2.005E-09 8.455E-08 8.008E-08 8.271E-08
100 3.615E-09 6.654E-09 4.864E-09 1.432E-07 1.268E-07 1.215E-07
125 1.562E-08 1.781E-08 2.701E-08 2.079E-07 1.860E-07 2.576E-07
150 3.873E-08 4.144E-08 6.049E-08 3.275E-07 2.488E-07 3.177E-07
175 6.027E-08 5.926E-08 1.300E-07 4.669E-07 3.901E-07 3.774E-07
200 9.246E-08 8.950E-08 1.618E-07 6.160E-07 5.882E-07 4.043E-07
It can be observed that the integral of kinetic energy in each zone increases
as the electrode rotation speed increases. However, a clear relationship between the kinetic energy and height of the bottom cannot be observed.
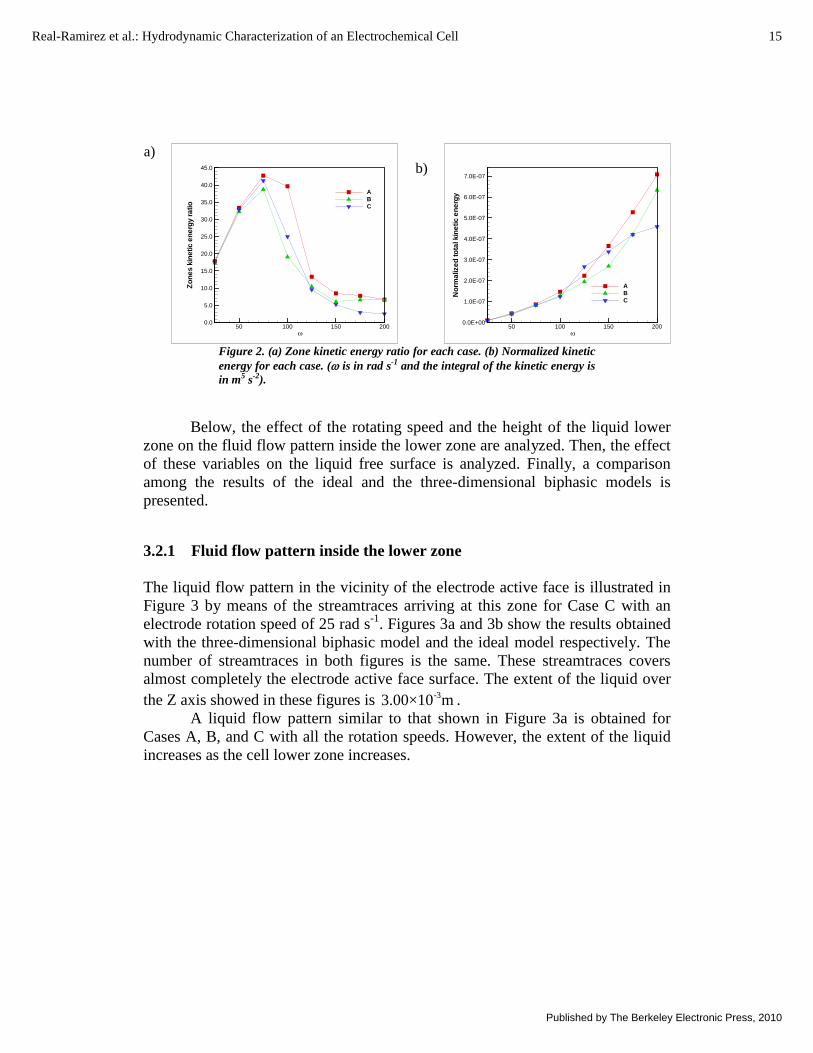
Figure 2a shows the kinetic energy ratio between upper and lower zones. It can be observed that Case A has the highest ratio values for all electrode rotation speeds. For electrode rotation speeds lower that 125 1rad s− , the kinetic energy ratio values for Case B are smaller than Case C values. This behavior is reversed starting at this electrode rotation speed.
Figure 2b shows the relationship between the electrode rotation speed and the normalized total kinetic energy, that is, the sum of the kinetic energy in upper and lower zones. To take into account the difference in the total amount of liquid, for Cases B and C, the kinetic energy in the lower zone was divided by two and three respectively. In this figure is observed that except by two points, Case A has the greatest amount of normalized total kinetic energy and at the same time, Case C has the least energy. The anomalous behavior can be attributed to a high interaction between upper and lower zones, promoting that the liquid into the cell behaves like a solid.
14 International Journal of Chemical Reactor Engineering Vol. 8 [2010], Article A95
http://www.bepress.com/ijcre/vol8/A95
a)
b)
Figure 2. (a) Zone kinetic energy ratio for each case. (b) Normalized kinetic energy for each case. (ω is in rad s-1 and the integral of the kinetic energy is in m5 s-2).
Below, the effect of the rotating speed and the height of the liquid lower
zone on the fluid flow pattern inside the lower zone are analyzed. Then, the effect of these variables on the liquid free surface is analyzed. Finally, a comparison among the results of the ideal and the three-dimensional biphasic models is presented.
3.2.1 Fluid flow pattern inside the lower zone The liquid flow pattern in the vicinity of the electrode active face is illustrated in Figure 3 by means of the streamtraces arriving at this zone for Case C with an electrode rotation speed of 25 rad s-1. Figures 3a and 3b show the results obtained with the three-dimensional biphasic model and the ideal model respectively. The number of streamtraces in both figures is the same. These streamtraces covers almost completely the electrode active face surface. The extent of the liquid over the Z axis showed in these figures is -33.00×10 m .
A liquid flow pattern similar to that shown in Figure 3a is obtained for Cases A, B, and C with all the rotation speeds. However, the extent of the liquid increases as the cell lower zone increases.
ω
Zone
ski
netic
ener
gyra
tio
50 100 150 2000.0
5.0
10.0
15.0
20.0
25.0
30.0
35.0
40.0
45.0
ABC
ω
Nor
mal
ized
tota
lkin
etic
ener
gy
50 100 150 2000.0E+00
1.0E-07
2.0E-07
3.0E-07
4.0E-07
5.0E-07
6.0E-07
7.0E-07
ABC
15Real-Ramirez et al.: Hydrodynamic Characterization of an Electrochemical Cell
Published by The Berkeley Electronic Press, 2010
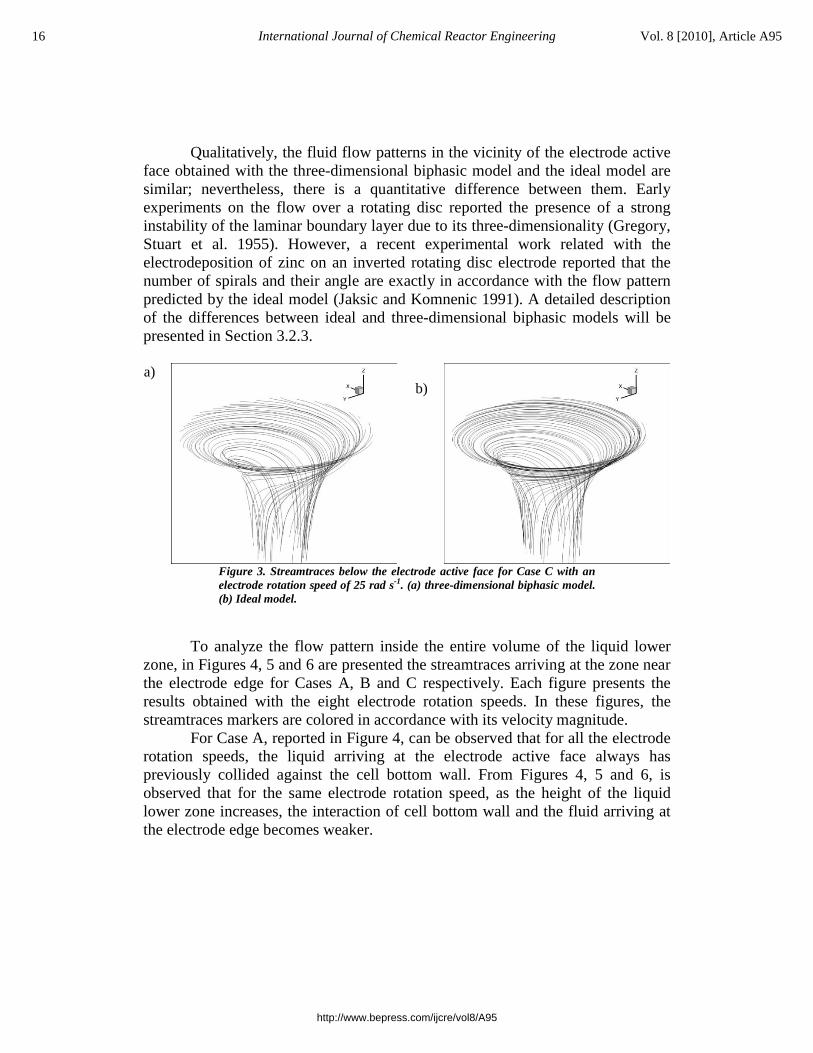
Qualitatively, the fluid flow patterns in the vicinity of the electrode active face obtained with the three-dimensional biphasic model and the ideal model are similar; nevertheless, there is a quantitative difference between them. Early experiments on the flow over a rotating disc reported the presence of a strong instability of the laminar boundary layer due to its three-dimensionality (Gregory, Stuart et al. 1955). However, a recent experimental work related with the electrodeposition of zinc on an inverted rotating disc electrode reported that the number of spirals and their angle are exactly in accordance with the flow pattern predicted by the ideal model (Jaksic and Komnenic 1991). A detailed description of the differences between ideal and three-dimensional biphasic models will be presented in Section 3.2.3. a)
b)
Figure 3. Streamtraces below the electrode active face for Case C with an electrode rotation speed of 25 rad s-1. (a) three-dimensional biphasic model. (b) Ideal model.
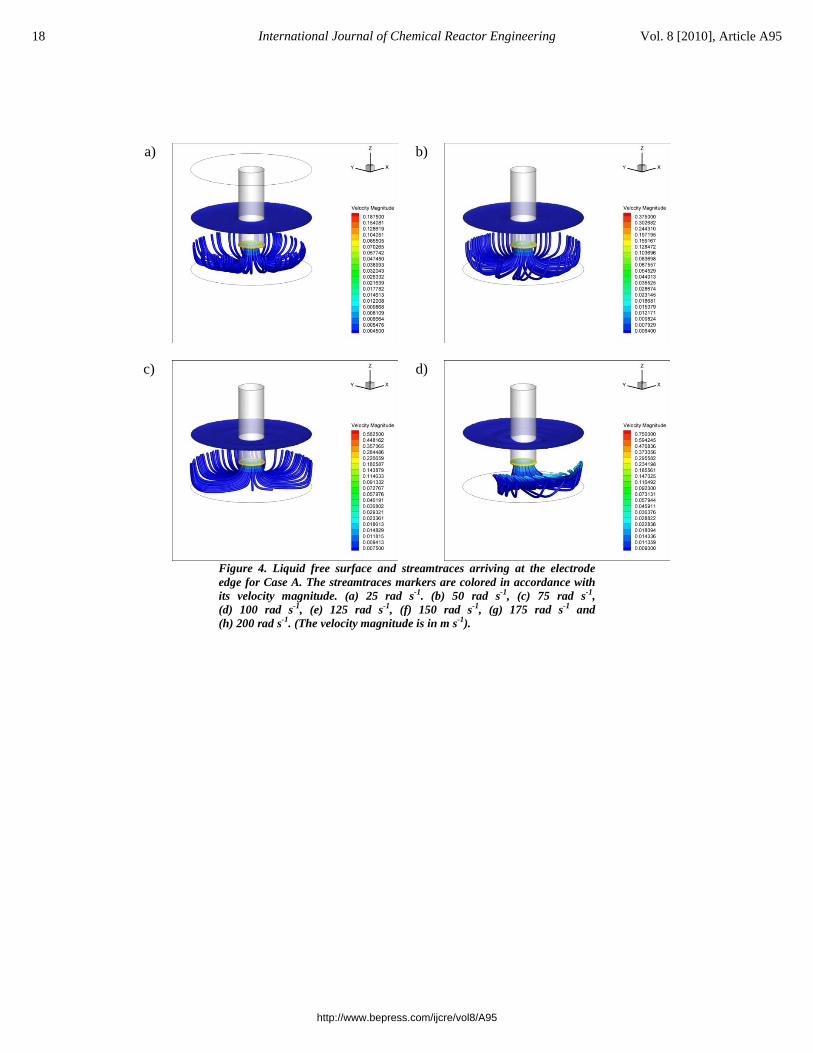
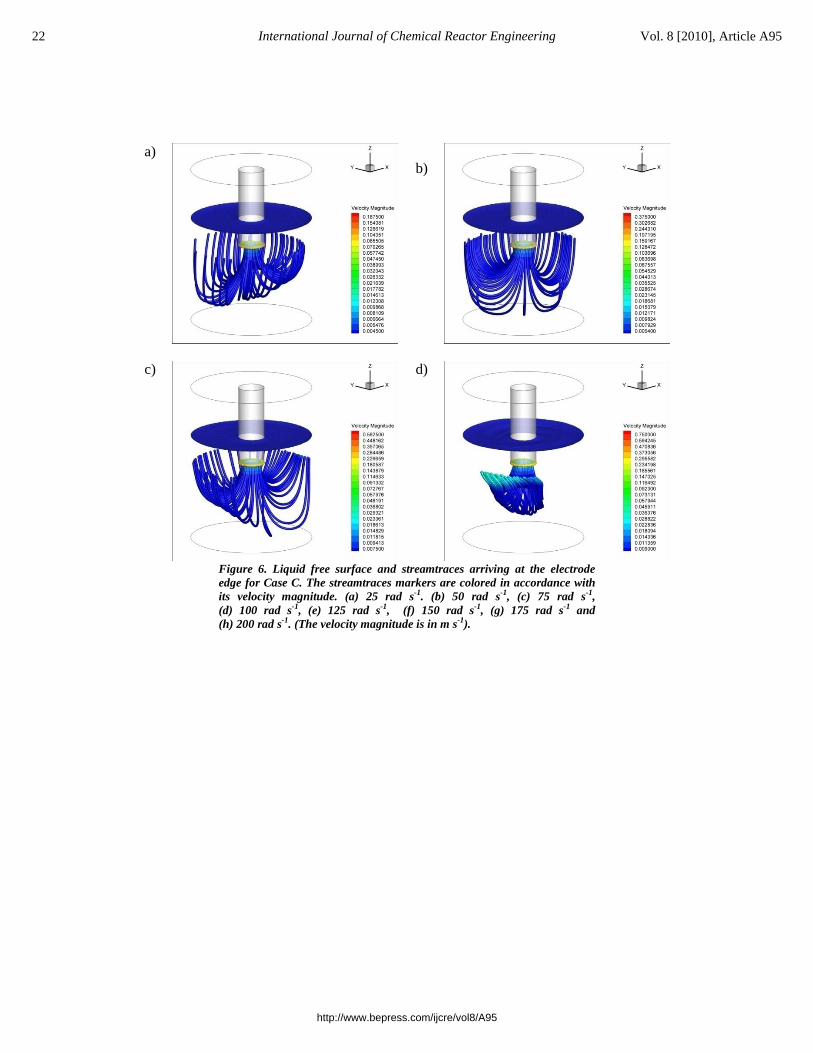
To analyze the flow pattern inside the entire volume of the liquid lower
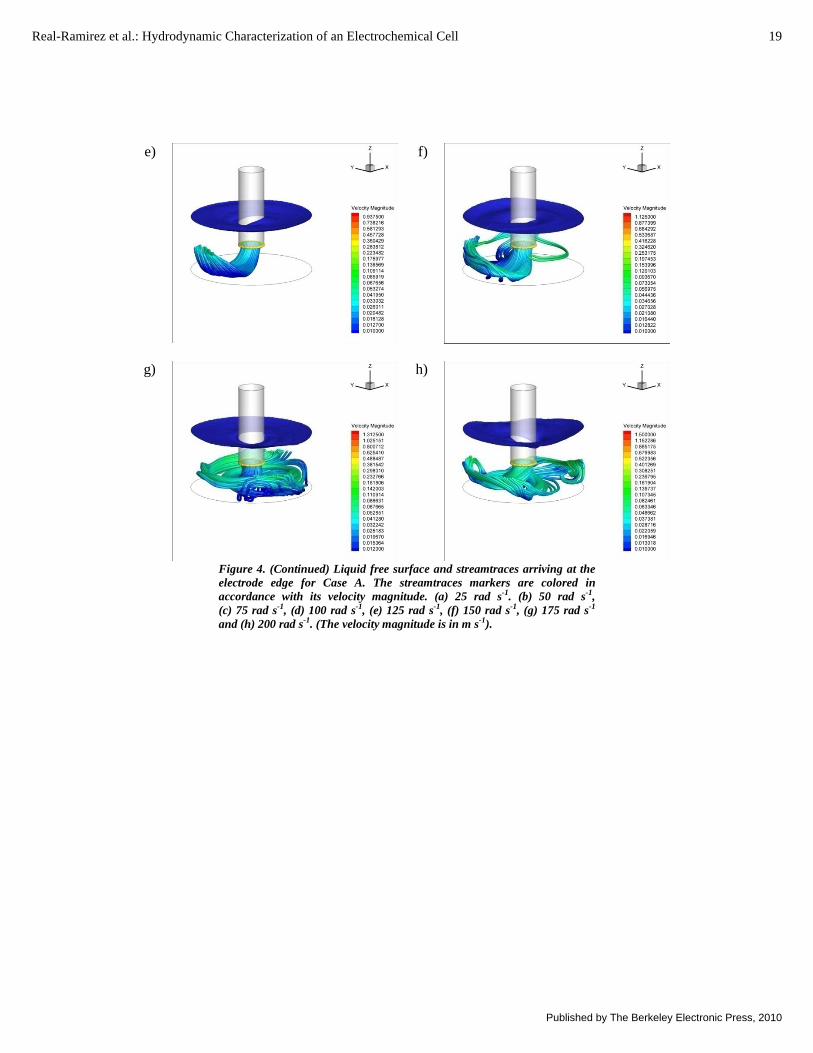
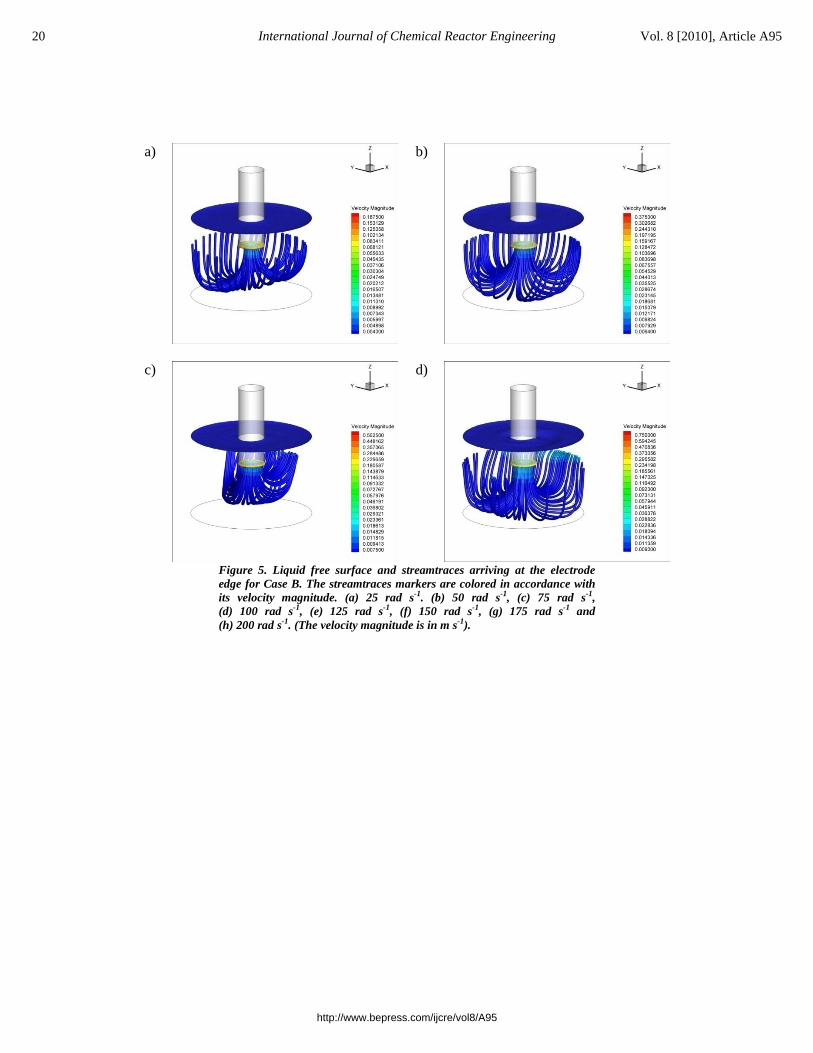
zone, in Figures 4, 5 and 6 are presented the streamtraces arriving at the zone near the electrode edge for Cases A, B and C respectively. Each figure presents the results obtained with the eight electrode rotation speeds. In these figures, the streamtraces markers are colored in accordance with its velocity magnitude.
For Case A, reported in Figure 4, can be observed that for all the electrode rotation speeds, the liquid arriving at the electrode active face always has previously collided against the cell bottom wall. From Figures 4, 5 and 6, is observed that for the same electrode rotation speed, as the height of the liquid lower zone increases, the interaction of cell bottom wall and the fluid arriving at the electrode edge becomes weaker.
16 International Journal of Chemical Reactor Engineering Vol. 8 [2010], Article A95
http://www.bepress.com/ijcre/vol8/A95

For the smaller electrode rotation speeds (25, 50 and 75 rad s-1), the behavior depicted by the streamtraces shows that for all cases, there are slight deviations from an axisymmetric flow pattern. However, these deviations increase as the electrode rotation speed increase, until the behavior of the liquid inside the cell lower zone is clearly asymmetric.
Apparently, the asymmetric behavior obtained in the three-dimensional biphasic model is unexpected, nevertheless, a region with oscillations of rather high amplitude below the electrode were observed by means of experimental measurements of the liquid velocity inside the electrochemical cell (Mandin, Pauporte et al. 2004). In accordance with these authors, the oscillations occur at the same z coordinate for different rotation speeds. These authors also carried out numerical simulations using a two-dimensional axisymmetric model, however, the observed oscillations in the liquid velocity were not reproduced.
In Figure 4 is observed that for the two smaller electrode rotation speeds (25 and 50 rad s-1), the liquid flow pattern inside the cell lower zone resembles the toroidal behavior obtained in (Real, González et al. 2008), where three-dimensional numerical simulations were carried out. A degenerated toroidal behavior is also observed for Cases B and C for the smaller electrode rotation speeds (25, 50 and 75 rad s-1), as can be seen in Figures 5 and 6. A very complex flow pattern inside the liquid lower zone is obtained for highest electrode rotation speeds (150, 175 and 200 rad s-1). Nevertheless, it can be observed that in all cases and for all rotation speeds, there is a direct relationship between the flow inside the lower zone and the shape of the liquid free surface.
A very similar behavior to the previously described has been observed in the swirling flow between a rotating lid and a stationary cylinder. It has been reported that the flow is governed by two parameters, the ratio of container height to disc radius and the Reynolds number (Sorensen, Naumov et al. 2006). In that work, it was observed that the flow is axisymmetric and steady for small Reynolds numbers. However, when the Reynolds number is increased and depending on the aspect ratio, the flow becomes unsteady and three-dimensional.
It has been reported that vortex flows generated by a rotating bottom in a closed cylindrical container undergo sudden structural changes near their rotation axis, called vortex breakdown (Spohn, Mory et al. 1998). Recently, it was shown that confined containers with a swirling wall can exhibit axisymmetric behavior only when their flow environment is completely disturbance-free (Ventikos 2002). In this system, the most important disturbances are associated with the container upper cover. Through fully three-dimensional numerical simulations, the effect of fixed cover inclination and rotating cover axis rotation displacement on the flow inside a container with a rotating bottom was studied and it was proved that these two imperfections can interact to enhance or suppress their effect (Brøns, Shen et al. 2007).
17Real-Ramirez et al.: Hydrodynamic Characterization of an Electrochemical Cell
Published by The Berkeley Electronic Press, 2010
a)
b)
c)
d)
Figure 4. Liquid free surface and streamtraces arriving at the electrode edge for Case A. The streamtraces markers are colored in accordance with its velocity magnitude. (a) 25 rad s-1. (b) 50 rad s-1, (c) 75 rad s-1, (d) 100 rad s-1, (e) 125 rad s-1, (f) 150 rad s-1, (g) 175 rad s-1 and (h) 200 rad s-1. (The velocity magnitude is in m s-1).
18 International Journal of Chemical Reactor Engineering Vol. 8 [2010], Article A95
http://www.bepress.com/ijcre/vol8/A95
e)
f)
g)
h)
Figure 4. (Continued) Liquid free surface and streamtraces arriving at the electrode edge for Case A. The streamtraces markers are colored in accordance with its velocity magnitude. (a) 25 rad s-1. (b) 50 rad s-1, (c) 75 rad s-1, (d) 100 rad s-1, (e) 125 rad s-1, (f) 150 rad s-1, (g) 175 rad s-1 and (h) 200 rad s-1. (The velocity magnitude is in m s-1).
19Real-Ramirez et al.: Hydrodynamic Characterization of an Electrochemical Cell
Published by The Berkeley Electronic Press, 2010
a)
b)
c)
d)
Figure 5. Liquid free surface and streamtraces arriving at the electrode edge for Case B. The streamtraces markers are colored in accordance with its velocity magnitude. (a) 25 rad s-1. (b) 50 rad s-1, (c) 75 rad s-1, (d) 100 rad s-1, (e) 125 rad s-1, (f) 150 rad s-1, (g) 175 rad s-1 and (h) 200 rad s-1. (The velocity magnitude is in m s-1).
20 International Journal of Chemical Reactor Engineering Vol. 8 [2010], Article A95
http://www.bepress.com/ijcre/vol8/A95

e)
f)
g)
h)
Figure 5. (Continued) Liquid free surface and streamtraces arriving at the electrode edge for Case B. The streamtraces markers are colored in accordance with its velocity magnitude. (a) 25 rad s-1. (b) 50 rad s-1, (c) 75 rad s-1, (d) 100 rad s-1, (e) 125 rad s-1, (f) 150 rad s-1, (g) 175 rad s-1 and (h) 200 rad s-1. (The velocity magnitude is in m s-1).
21Real-Ramirez et al.: Hydrodynamic Characterization of an Electrochemical Cell
Published by The Berkeley Electronic Press, 2010
a)
b)
c)
d)
Figure 6. Liquid free surface and streamtraces arriving at the electrode edge for Case C. The streamtraces markers are colored in accordance with its velocity magnitude. (a) 25 rad s-1. (b) 50 rad s-1, (c) 75 rad s-1, (d) 100 rad s-1, (e) 125 rad s-1, (f) 150 rad s-1, (g) 175 rad s-1 and (h) 200 rad s-1. (The velocity magnitude is in m s-1).
22 International Journal of Chemical Reactor Engineering Vol. 8 [2010], Article A95
http://www.bepress.com/ijcre/vol8/A95
e)
f)
g)
h)
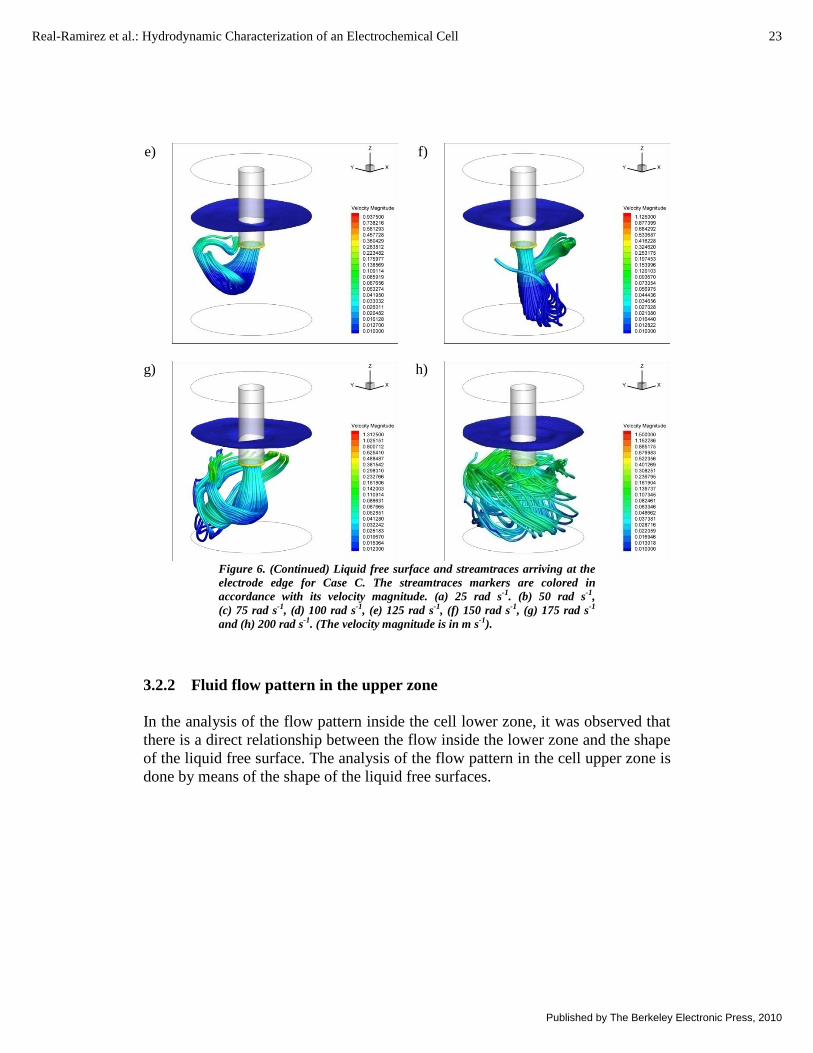
Figure 6. (Continued) Liquid free surface and streamtraces arriving at the electrode edge for Case C. The streamtraces markers are colored in accordance with its velocity magnitude. (a) 25 rad s-1. (b) 50 rad s-1, (c) 75 rad s-1, (d) 100 rad s-1, (e) 125 rad s-1, (f) 150 rad s-1, (g) 175 rad s-1 and (h) 200 rad s-1. (The velocity magnitude is in m s-1).
3.2.2 Fluid flow pattern in the upper zone In the analysis of the flow pattern inside the cell lower zone, it was observed that there is a direct relationship between the flow inside the lower zone and the shape of the liquid free surface. The analysis of the flow pattern in the cell upper zone is done by means of the shape of the liquid free surfaces.
23Real-Ramirez et al.: Hydrodynamic Characterization of an Electrochemical Cell
Published by The Berkeley Electronic Press, 2010
The importance of the free surface on the flow pattern inside a stationary cylinder with a rotating bottom has been recognized by several authors (Brøns, Shen et al. 2007). By comparing the flow inside two different container geometries, one with a rigid cover and the other with a free surface, significant differences in the resulting behavior were observed experimentally (Spohn, Mory et al. 1998). This result was reproduced numerically through three-dimensional numerical simulations (Serre and Bontoux 2007).
The importance of including the liquid free surface in the mathematical modeling of electrochemical cells with a rotating disc electrode was recognized in (Dong, Santhanagopalan et al. 2008). However, in that work the free surface was simulated as a rigid flat wall.
a)
b)
c)
d)
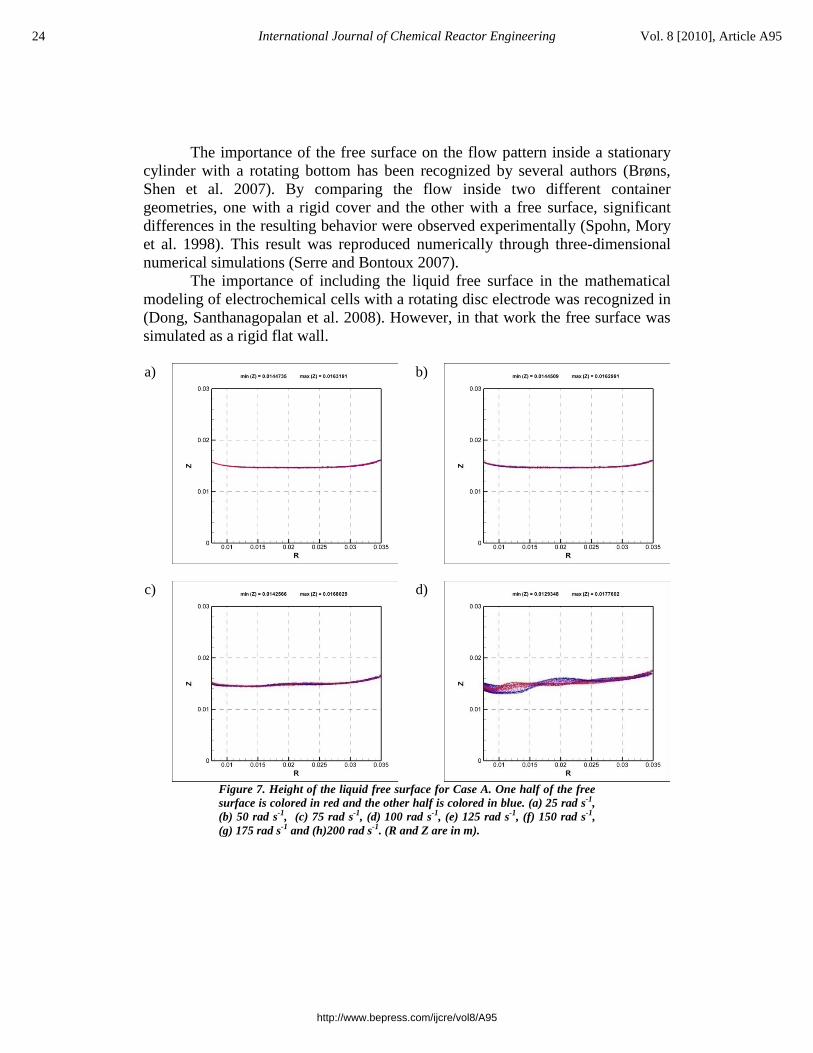
Figure 7. Height of the liquid free surface for Case A. One half of the free surface is colored in red and the other half is colored in blue. (a) 25 rad s-1, (b) 50 rad s-1, (c) 75 rad s-1, (d) 100 rad s-1, (e) 125 rad s-1, (f) 150 rad s-1, (g) 175 rad s-1 and (h)200 rad s-1. (R and Z are in m).
24 International Journal of Chemical Reactor Engineering Vol. 8 [2010], Article A95
http://www.bepress.com/ijcre/vol8/A95
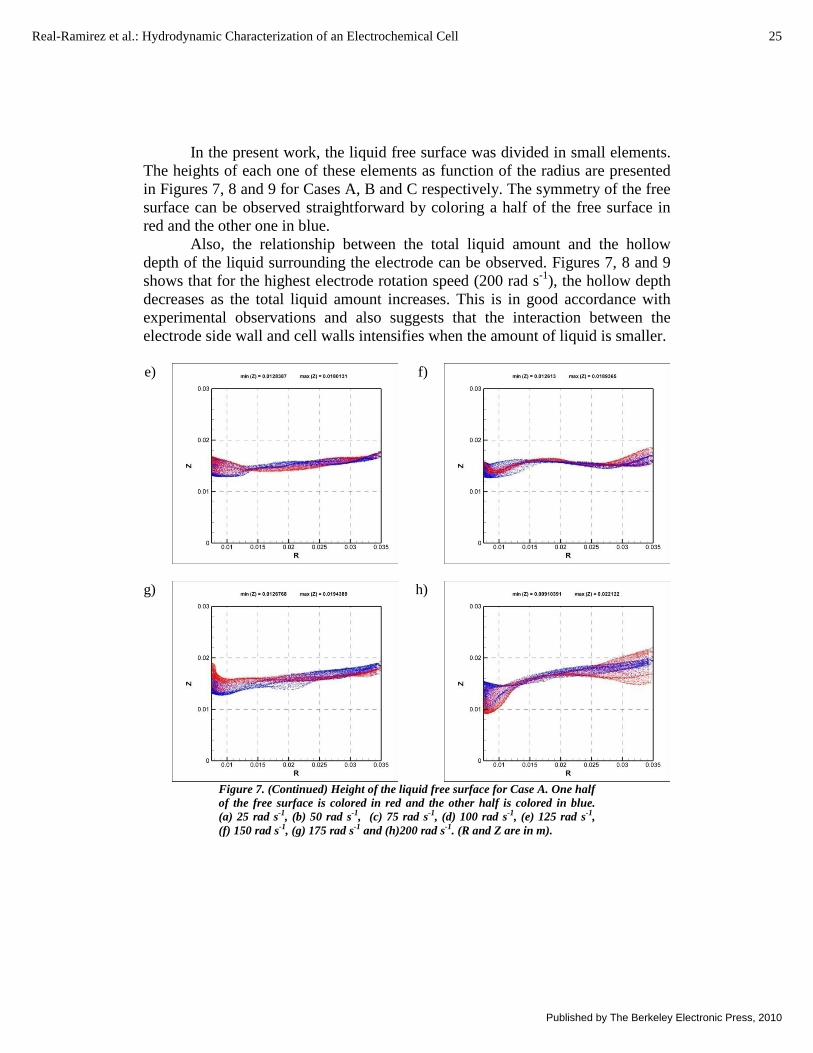
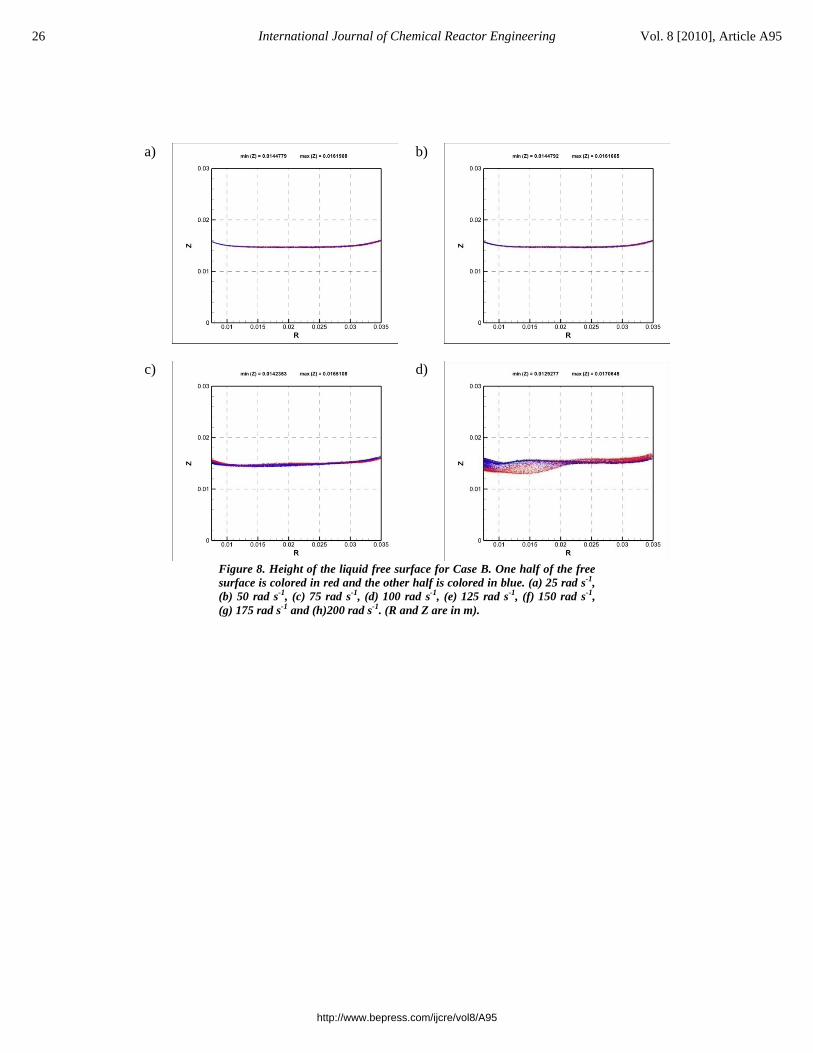
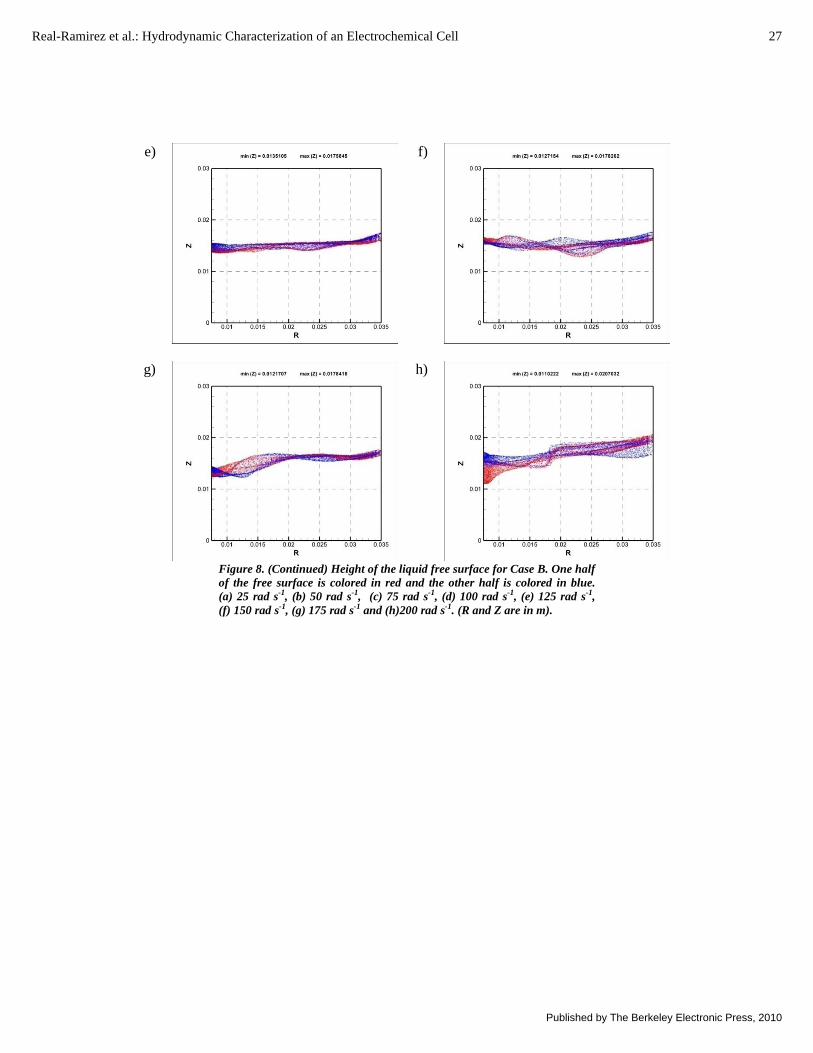
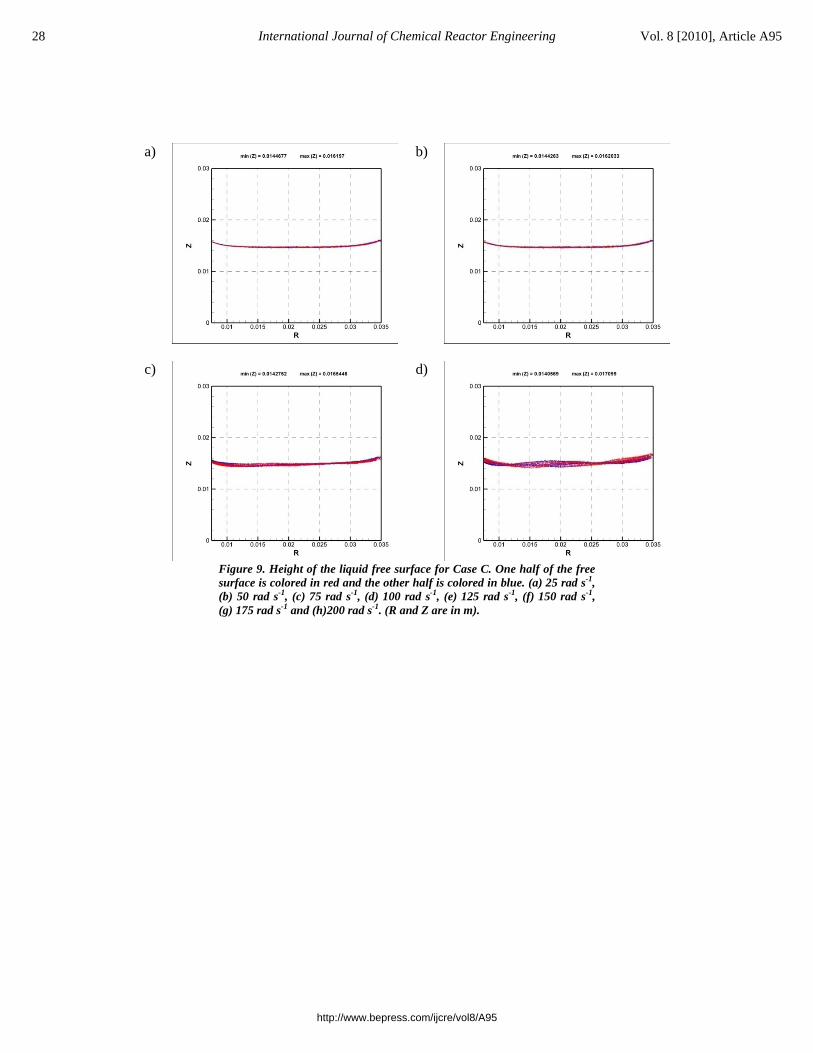
In the present work, the liquid free surface was divided in small elements. The heights of each one of these elements as function of the radius are presented in Figures 7, 8 and 9 for Cases A, B and C respectively. The symmetry of the free surface can be observed straightforward by coloring a half of the free surface in red and the other one in blue.
Also, the relationship between the total liquid amount and the hollow depth of the liquid surrounding the electrode can be observed. Figures 7, 8 and 9 shows that for the highest electrode rotation speed (200 rad s-1), the hollow depth decreases as the total liquid amount increases. This is in good accordance with experimental observations and also suggests that the interaction between the electrode side wall and cell walls intensifies when the amount of liquid is smaller.
e)
f)
g)
h)
Figure 7. (Continued) Height of the liquid free surface for Case A. One half of the free surface is colored in red and the other half is colored in blue. (a) 25 rad s-1, (b) 50 rad s-1, (c) 75 rad s-1, (d) 100 rad s-1, (e) 125 rad s-1, (f) 150 rad s-1, (g) 175 rad s-1 and (h)200 rad s-1. (R and Z are in m).
25Real-Ramirez et al.: Hydrodynamic Characterization of an Electrochemical Cell
Published by The Berkeley Electronic Press, 2010
a)
b)
c)
d)
Figure 8. Height of the liquid free surface for Case B. One half of the free surface is colored in red and the other half is colored in blue. (a) 25 rad s-1, (b) 50 rad s-1, (c) 75 rad s-1, (d) 100 rad s-1, (e) 125 rad s-1, (f) 150 rad s-1, (g) 175 rad s-1 and (h)200 rad s-1. (R and Z are in m).
26 International Journal of Chemical Reactor Engineering Vol. 8 [2010], Article A95
http://www.bepress.com/ijcre/vol8/A95
e)
f)
g)
h)
Figure 8. (Continued) Height of the liquid free surface for Case B. One half of the free surface is colored in red and the other half is colored in blue. (a) 25 rad s-1, (b) 50 rad s-1, (c) 75 rad s-1, (d) 100 rad s-1, (e) 125 rad s-1, (f) 150 rad s-1, (g) 175 rad s-1 and (h)200 rad s-1. (R and Z are in m).
27Real-Ramirez et al.: Hydrodynamic Characterization of an Electrochemical Cell
Published by The Berkeley Electronic Press, 2010
a)
b)
c)
d)
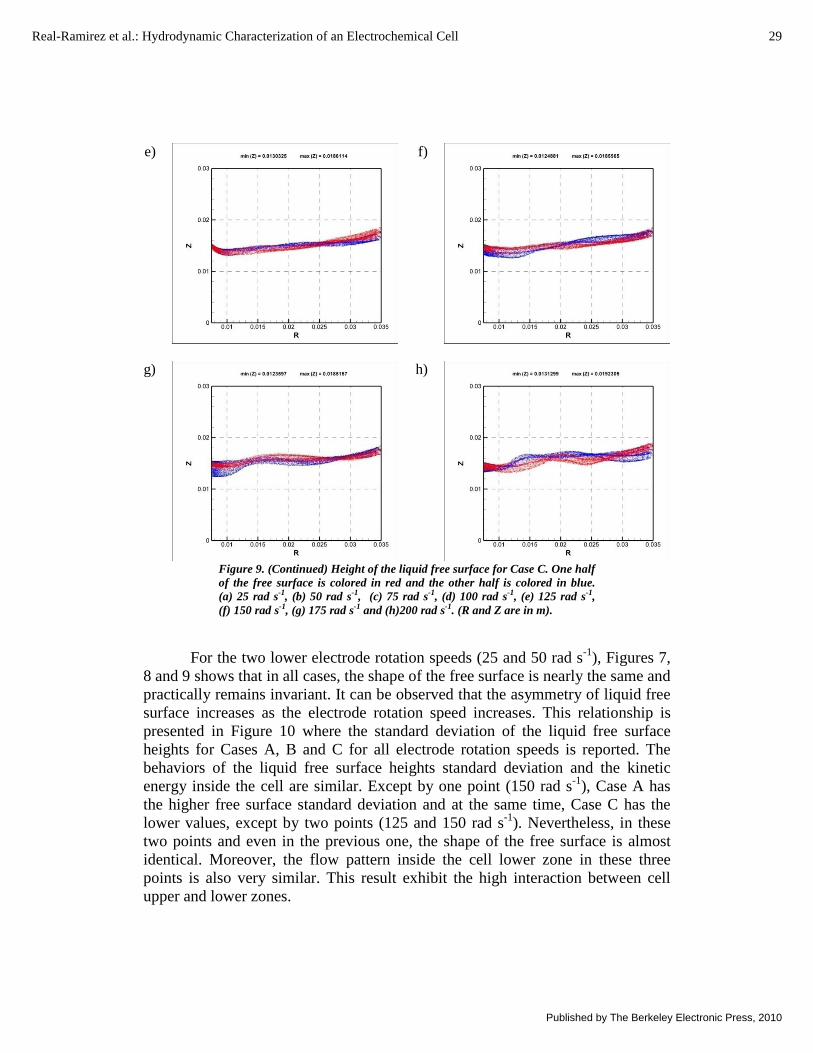
Figure 9. Height of the liquid free surface for Case C. One half of the free surface is colored in red and the other half is colored in blue. (a) 25 rad s-1, (b) 50 rad s-1, (c) 75 rad s-1, (d) 100 rad s-1, (e) 125 rad s-1, (f) 150 rad s-1, (g) 175 rad s-1 and (h)200 rad s-1. (R and Z are in m).
28 International Journal of Chemical Reactor Engineering Vol. 8 [2010], Article A95
http://www.bepress.com/ijcre/vol8/A95
e)
f)
g)
h)
Figure 9. (Continued) Height of the liquid free surface for Case C. One half of the free surface is colored in red and the other half is colored in blue. (a) 25 rad s-1, (b) 50 rad s-1, (c) 75 rad s-1, (d) 100 rad s-1, (e) 125 rad s-1, (f) 150 rad s-1, (g) 175 rad s-1 and (h)200 rad s-1. (R and Z are in m).
For the two lower electrode rotation speeds (25 and 50 rad s-1), Figures 7,
8 and 9 shows that in all cases, the shape of the free surface is nearly the same and practically remains invariant. It can be observed that the asymmetry of liquid free surface increases as the electrode rotation speed increases. This relationship is presented in Figure 10 where the standard deviation of the liquid free surface heights for Cases A, B and C for all electrode rotation speeds is reported. The behaviors of the liquid free surface heights standard deviation and the kinetic energy inside the cell are similar. Except by one point (150 rad s-1), Case A has the higher free surface standard deviation and at the same time, Case C has the lower values, except by two points (125 and 150 rad s-1). Nevertheless, in these two points and even in the previous one, the shape of the free surface is almost identical. Moreover, the flow pattern inside the cell lower zone in these three points is also very similar. This result exhibit the high interaction between cell upper and lower zones.
29Real-Ramirez et al.: Hydrodynamic Characterization of an Electrochemical Cell
Published by The Berkeley Electronic Press, 2010

Figure 10. Standard deviation of the liquid free surface heights for Cases A, B and C for all electrode rotation speeds. (ω is in rad s-1 and the free surface standard deviation is in m).
The analysis above presented showed that there exist a feedback between the liquid free surface shape and the fluid flow pattern inside the cell lower zone. A less symmetric free surface induces a less symmetric flow pattern inside the cell and viceversa.
3.3 COMPARISON BETWEEN IDEAL AND THREE-DIMENSIONAL BIPHASIC MODEL
The exceptionally complex behavior inside the cell is the result of the synergetic interaction among the submerged electrode side wall, the electrochemical cell walls and the liquid free surface. However, none of these aspects are taken into account in the ideal model developed by von Kármán (von Kármán 1921) and Cochran (Cochran 1934).
Given that approximate solutions of the ideal model in the vicinity of the electrode active face are employed to interpret experimental results obtained in electrochemical cells by using equations like that proposed by Levich (Levich 1962), it is necessary to compare the fluid flow patterns obtained with the ideal and the three-dimensional biphasic models in this zone.
Figure 11 shows the calculated liquid velocity magnitude below the electrode for the lowest electrode rotation speed (25 rad s-1) using the ideal model and the three cases of the three-dimensional biphasic model. In these figures are reported only the velocities of those elements whose radius is less or equal than the electrode radius. The extent of the fluid was limited to -35.00×10 m and each point was colored according its radius magnitude. Qualitatively, the velocities magnitude distribution obtained with the three-dimensional model is almost identical to the ideal model.
ω
Free
surfa
cest
anda
rdde
viat
ion
50 100 150 2000.0E+00
5.0E-04
1.0E-03
1.5E-03
2.0E-03
2.5E-03
3.0E-03
ABC
30 International Journal of Chemical Reactor Engineering Vol. 8 [2010], Article A95
http://www.bepress.com/ijcre/vol8/A95
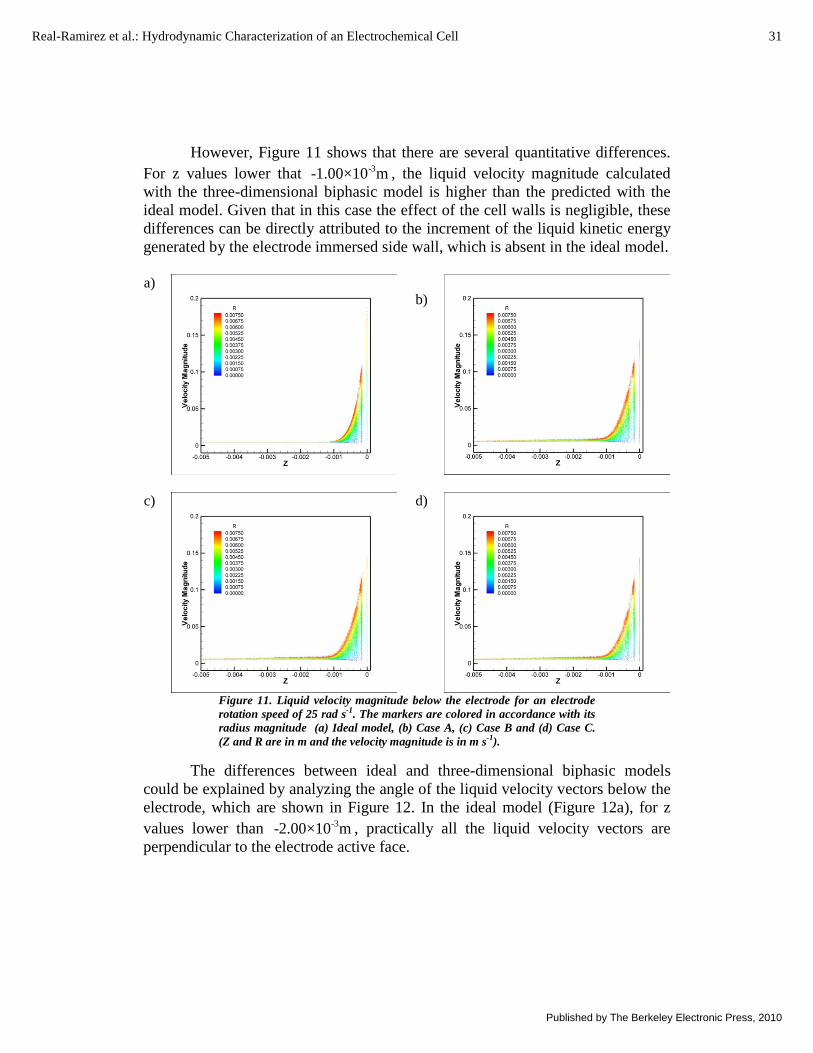
However, Figure 11 shows that there are several quantitative differences. For z values lower that -3-1.00×10 m , the liquid velocity magnitude calculated with the three-dimensional biphasic model is higher than the predicted with the ideal model. Given that in this case the effect of the cell walls is negligible, these differences can be directly attributed to the increment of the liquid kinetic energy generated by the electrode immersed side wall, which is absent in the ideal model. a)
b)
c)
d)
Figure 11. Liquid velocity magnitude below the electrode for an electrode rotation speed of 25 rad s-1. The markers are colored in accordance with its radius magnitude (a) Ideal model, (b) Case A, (c) Case B and (d) Case C. (Z and R are in m and the velocity magnitude is in m s-1).
The differences between ideal and three-dimensional biphasic models could be explained by analyzing the angle of the liquid velocity vectors below the electrode, which are shown in Figure 12. In the ideal model (Figure 12a), for z values lower than -3-2.00×10 m , practically all the liquid velocity vectors are perpendicular to the electrode active face.
31Real-Ramirez et al.: Hydrodynamic Characterization of an Electrochemical Cell
Published by The Berkeley Electronic Press, 2010

a)
b)
Figure 12. Angle with respect to the horizontal of the liquid velocity vectors below the electrode for an electrode rotation speed of 25 rad s-1. The markers are colored in accordance with its radius magnitude. (a) Ideal model and (b) Case C. (Z and R are in m and the velocity magnitude is in m s-1).
a)
b)
c)
d)
Figure 13. Liquid velocity magnitude below the electrode for an electrode rotation speed of 200 rad s-1. The markers are colored in accordance with its radius magnitude (a) Ideal model, (b) Case A, (c) Case B and (d) Case C. (Z and R are in m and the velocity magnitude is in m s-1).
32 International Journal of Chemical Reactor Engineering Vol. 8 [2010], Article A95
http://www.bepress.com/ijcre/vol8/A95

a)
b)
c)
d)
Figure 14. Angle with respect to the horizontal of the liquid velocity vectors below the electrode for an electrode rotation speed of 200 rad s-1. The markers are colored in accordance with its radius magnitude. (a) Ideal model, (b) Case A, (c) Case B and (d) Case C. (Z and R are in m and the velocity magnitude is in m s-1).
Close to the electrode active face, practically all the liquid velocity vectors
are parallel to this face. In the three-dimensional biphasic model (exemplified by Case C in Figure 12b), the asymmetry inside the lower zone deviates from the vertical the ascending liquid flow and then, the inflow that arrives to the electrode active face is smaller than in the ideal model. In addition, the outwards flow inside the displacement layer near the electrode edge, collides against an ascending flow, which is not considered in the ideal model.
The behavior previously described for the lowest electrode rotation speed (25 rad s-1), can be also observed in Figures 13 and 14 for the highest electrode rotation speed (200 rad s-1). Nevertheless, the quantitative differences between the ideal and the three-dimensional biphasic models increase as the electrode rotation speed increases.
33Real-Ramirez et al.: Hydrodynamic Characterization of an Electrochemical Cell
Published by The Berkeley Electronic Press, 2010

4 CONCLUDING REMARKS Certainly, electrochemical cells with a rotating disc electrode are the preferred devices to characterize electrochemical reactions. The three-dimensional numerical simulations of the cell hydrodynamic behavior presented in this work shows that the fluid flow pattern inside the cell was erroneously interpreted (Blurton and Riddiford 1965). Therefore, the effect of several aspects not included in the equations that commonly are employed to interpret the experiments carried out in these cells has been underestimated and should be considered. Nevertheless, the present work also shows the way these effects can be minimized to enhance the accuracy of the studies using the same correlations actually employed.
It was observed that with the current designs is almost impossible to attain an axisymmetric behavior inside the cell. The asymmetry of the cell flow pattern is intensified by the free surface asymmetry, which depends directly on the electrode rotation speed and the electrode submergence depth. To broke or at least weaken this feedback loop, the liquid free surface must be symmetric, and flat preferably. This effect can be obtained if the cell is equipped with a floating lid which ensures that the electrode active face always is in contact with electrolyte for all electrode rotation speed values. In a future work, an electrochemical cell with this design will be presented.
It was also found that the submerged electrode side wall along with its right angle shape induces that the liquid velocities in the vicinity of the electrode active face were lower than that predicted with the ideal model. In order to obtain in the electrode active face vicinity a velocities field as close as possible to the ideal one, different electrode border shapes will be evaluated in a future work.
REFERENCES
Adair, D. and P. G. Tucker (1997). "Efficient modelling of rotating disks and cylinders using a Cartesian grid." Applied Mathematical Modelling 21(12): 749-762.
Ariel, P. D. (1996). "The flow near a rotating disk: An approximate solution." Journal of Applied Mechanics-Transactions of the Asme 63(2): 436-438.
Bard, A. and R. Faulkner (2001). Electrochemical methods: Fundamentals and applications. New York, USA, Wiley Interscience.
34 International Journal of Chemical Reactor Engineering Vol. 8 [2010], Article A95
http://www.bepress.com/ijcre/vol8/A95
Blurton, K. F. and A. C. Riddiford (1965). "Shapes of Practical Rotating Disc Electrodes." Journal of Electroanalytical Chemistry 10(5-6): 457-464.
Brøns, M., W. Z. Shen, et al. (2007). "The influence of imperfections on the flow structure of steady vortex breakdown bubbles." Journal of Fluid Mechanics 578: 453.
Cochran, W. G. (1934). "The flow due to a rotating disc." Proceedings of the Cambridge Philosophical Society 30: 365-375.
Dong, Q., S. Santhanagopalan, et al. (2007). "Simulation of the oxygen reduction reaction at an RDE in 0.5 m H2SO4 including an adsorption mechanism." Journal of the Electrochemical Society 154(9): A888-A899.
Dong, Q., S. Santhanagopalan, et al. (2008). "A comparison of numerical solutions for the fluid motion generated by a rotating disk electrode." Journal of the Electrochemical Society 155(9): B963-B968.
Fluent Inc. (2006). Fluent 6.3 User's Guide. Lebanon, Fluent Inc.
Gregory, N., J. T. Stuart, et al. (1955). "On the Stability of Three-Dimensional Boundary Layers with Application to the Flow Due to a Rotating Disk." Philosophical Transactions of the Royal Society of London Series a-Mathematical and Physical Sciences 248(943): 155-199.
Hewitt, R. E. and P. W. Duck (2000). "Non-axisymmetric rotating-disk flows: nonlinear travelling-wave states." Journal of Fluid Mechanics 413: 287-316.
Jaksic, M. M. and V. P. Komnenic (1991). "Hydrodynamic Flow Visualization by an Electrochemical Method." Experimental Thermal and Fluid Science 4(1): 56-75.
Lai, C. Y., K. R. Rajagopal, et al. (1985). "Asymmetric Flow above a Rotating-Disk." Journal of Fluid Mechanics 157(Aug): 471-492.
Levich, V. G. (1962). Physicochemical Hydrodynamics. New Jersey, USA, Prentice-Hall, Englewood Cliffs.
35Real-Ramirez et al.: Hydrodynamic Characterization of an Electrochemical Cell
Published by The Berkeley Electronic Press, 2010

Mandin, P., C. Fabian, et al. (2006). "Importance of the density gradient effects in modelling electro deposition process at a rotating cylinder electrode." Electrochimica Acta 51(19): 4067-4079.
Mandin, P., C. Fabian, et al. (2006). "Mean and unsteady hydrodynamic and mass transport properties at a rotating cylinder electrode: From laminar to transitional flow regime." Journal of Electroanalytical Chemistry 586(2): 276-296.
Mandin, P., C. Fabian, et al. (2006). "Numerical simulation of hydrodynamic and mass-transport properties at a laminar rotating cylinder electrode." Journal of the Electrochemical Society 153(3): D40-D50.
Mandin, P., T. Pauporte, et al. (2004). "Modelling and numerical simulation of hydrodynamical processes in a confined rotating electrode configuration." Journal of Electroanalytical Chemistry 565(2): 159-173.
Mangiavacchi, N., J. Pontes, et al. (2007). "Rotating disk flow stability in electrochemical cells: Effect of the transport of a chemical species." Physics of Fluids 19(11): 1-15.
Newman, J. (1966). "Current Distribution on a Rotating Disk Below Limiting Current." Journal of the Electrochemical Society 113(12): 1235-1241.
Parys, H. V., E. Tourwé, et al. (2008). "Modeling of mass and charge transfer in an inverted rotating disk electrode (IRDE) reactor." Journal of Electroanalytical Chemistry 622: 44.
Real, C., J. González, et al. (2008). A CFD hydrodinamics condition simulation of electrochemical cells with rotating electrodes. International Materials Research Congress, Cancun, NACE International.
Serre, E. and P. Bontoux (2007). "Vortex breakdown in a cylinder with a rotating bottom and a flat stress-free surface." International Journal of Heat and Fluid Flow 28: 229-248.
Sides, P. J. and J. D. Hoggard (2004). "Measurement of the zeta potential of planar solid surfaces by means of a rotating disk." Langmuir
Sorensen, J. N., I. Naumov, et al. (2006). "Experimental investigation of three-dimensional flow instabilities in a rotating lid-driven cavity."
20: 11493-11498.
Experiments in Fluids 41(3): 425-440.
36 International Journal of Chemical Reactor Engineering Vol. 8 [2010], Article A95
http://www.bepress.com/ijcre/vol8/A95
Spohn, A., M. Mory, et al. (1998). "Experiments on vortex breakdown in a confined flow generated by a rotating disc." Journal of Fluid Mechanics 370: 73-99.
Ventikos, Y. (2002). "The effect of imperfections on the emergence of three-dimensionality in stationary vortex breakdown bubbles." Physics of Fluids 14: L13-L16.
Volgin, V. M. and A. D. Davydov (2007). "Numerical simulation of steady-state ion transfer to rotating disk electrode: Accuracy and computational efficiency." Journal of Electroanalytical Chemistry 600(1): 171-179.
von Kármán, T. (1921). "Über laminare und turbulente Reibung." Zeitschrift für Angewandte Mathematik und Mechanik 1: 486.
37Real-Ramirez et al.: Hydrodynamic Characterization of an Electrochemical Cell
Published by The Berkeley Electronic Press, 2010