hydrofoil river power system
TRANSCRIPT

Hydrofoil River Power System P-12464
TEAM:
Geoffrey Bastian (ME) – Generator/Gear Train Engineer
Christopher Donnelly (ME) – Boom Engineer
Joseph Fertitta (ME) – System Controls Engineer
Justin Grates (ISE) – Team Leader/Project Manager
Donald Leclerc (ME) – Chief Engineer/Base Engineer
Matt Marion (ME) – Hydrofoil Engineer
Harshita Sood (ES) – Environmental Scientist
Guide: Ed Hanzlik
Customer: Dr. Mario Gomes
Sponsor: EPA P3 Grant

Project Description
O Harvest power from a river using a hydrofoil
O Produce at least 50 watts of power from a
1 m/s river flow
O Identify potential environmental impacts the
system will have on the river
O Create assessment plans to quantify these
impacts

Customer Needs

Engineering Specifications

Concept Summary (1/2)

Concept Summary (2/2)
O Morphological Chart

System Architecture

Cost Breakdown
O Total Cost:
O $2,217.06
$463.60
$92.17
$218.71
$349.40 $358.29
$734.89
Base
Boom
Hydrofoil
End-cap
Generator
DAQ & Laptop
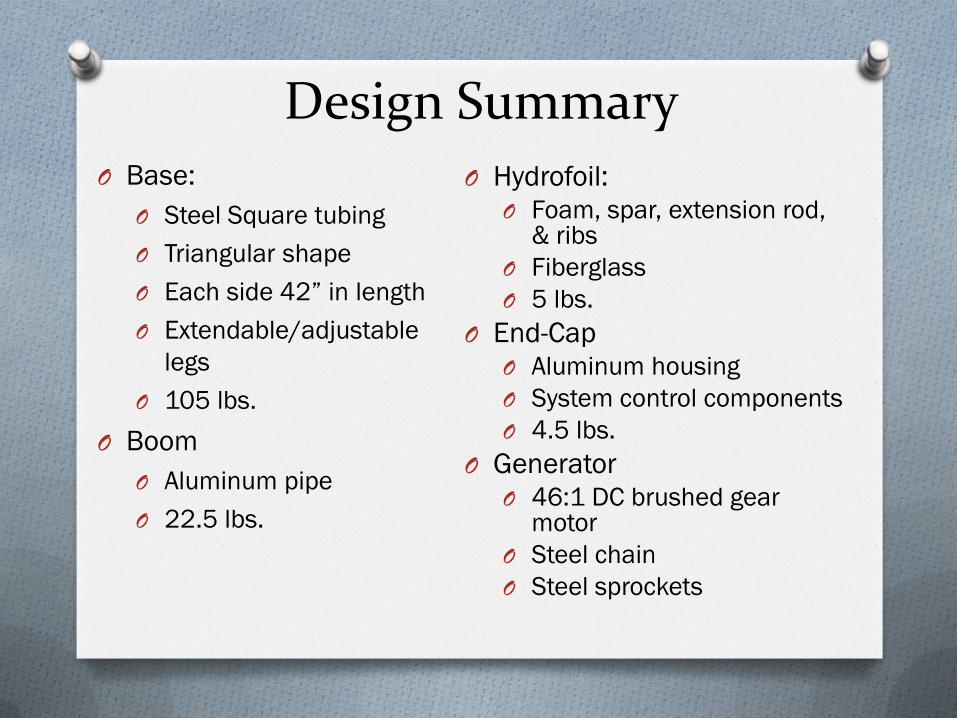
Design Summary O Base:
O Steel Square tubing
O Triangular shape
O Each side 42” in length
O Extendable/adjustable
legs
O 105 lbs.
O Boom
O Aluminum pipe
O 22.5 lbs.
O Hydrofoil:
O Foam, spar, extension rod, & ribs
O Fiberglass
O 5 lbs.
O End-Cap
O Aluminum housing
O System control components
O 4.5 lbs.
O Generator
O 46:1 DC brushed gear motor
O Steel chain
O Steel sprockets

Full-Scale System
Generator End Cap Hydrofoil Boom Arm Base
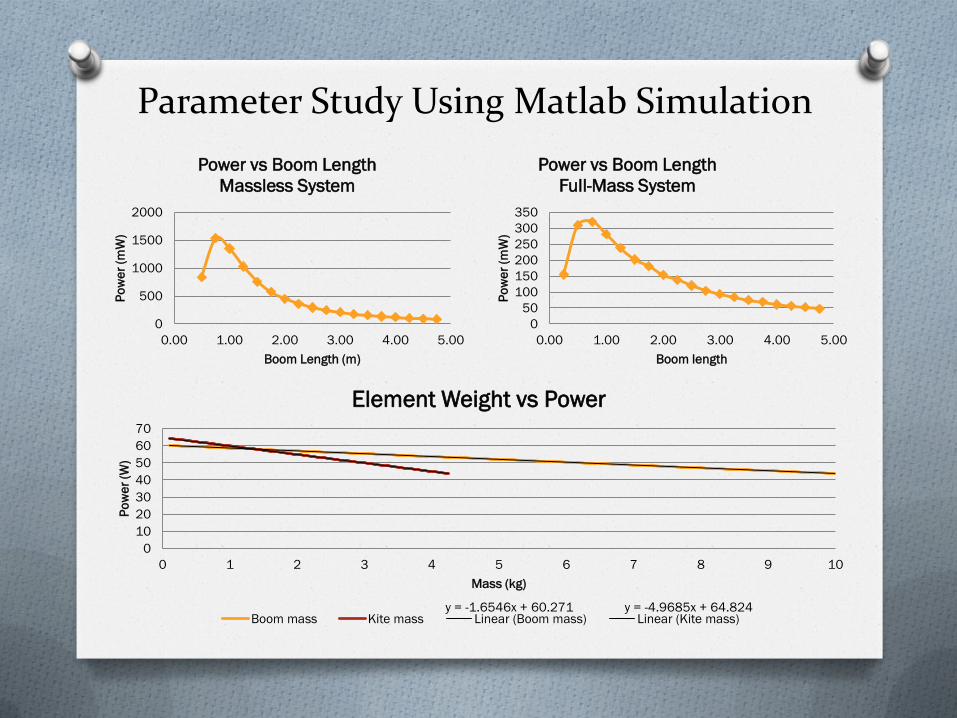
Parameter Study Using Matlab Simulation
0
500
1000
1500
2000
0.00 1.00 2.00 3.00 4.00 5.00
Po
we
r (m
W)
Boom Length (m)
Power vs Boom Length
Massless System
0
50
100
150
200
250
300
350
0.00 1.00 2.00 3.00 4.00 5.00
Po
we
r (m
W)
Boom length
Power vs Boom Length
Full-Mass System
y = -1.6546x + 60.271 y = -4.9685x + 64.824
0
10
20
30
40
50
60
70
0 1 2 3 4 5 6 7 8 9 10
Po
we
r (W
)
Mass (kg)
Element Weight vs Power
Boom mass Kite mass Linear (Boom mass) Linear (Kite mass)

Computer Simulation Results
O Parameters:
O 5 meter
boom
O 0.5 m/s
flow rate
O Output:
O 0.02
Watts

River Data O 0.09 watts of power
O Peak values over 0.5 Watts in a river flow of 0.3
m/s.

Genesee River O Genesee River and Pollution
O Industrial Waste
O Agricultural Waste
O Municipal Waste
O Project: Design assessment
plans to quantify the level of
impact of our device on the
Genesee river

Concern: Physical Harm to Sturgeons
O Critically Endangered Species
O Reintroduction program
O Assessment plan: O Use a 7m x 2m fishing net to capture fish swimming
through the swept area of the device over ~ 1 hour time period during the migratory season.
O Number and physical condition of fish will be recorded both in front and behind the device
O All unharmed fish will be released back into the river
O Prediction: O Not significant: benthic organisms, pollution
level of Genesee river (turbine paper study showed that velocities of our boom and leading edge radius will not significantly damage fish of this size)
O Mitigation plan: O If harmful: Device can be removed from the river
during migratory season

Concern: Chemical Pollution O Galvanized Steel Corrosion: Zinc Pollution
O Aluminum Boom: Al chips and ions in the water
O Threats: O Bioaccumulation, groundwater contamination, threat to plant species,
impact on soil aquatic organisms, change in pH
O Assessment plan: O Water sampling, to test for ionic concentration of Al and Zn and pH of
the water
O Approximately 25 mL samples for laboratory testing
O Initial sampling every day for a week during peak summer time
O Continue taking samples once a week thereafter
O Prediction: O Minimum impact, as pollution levels in the Genesee are really high
O Mitigation Plan: O Replace aluminum with a different material
O Paint the base

Concern: Sediment Stir-Up and Water Clarity
O Risk of sediment stir up due to erosion of the bank while the device is being installed
O Assessment Plan:
O Water sampling, to test for suspended solid particles
O 25 mL samples taken 10 minutes after installation, 2 hours after installation, 8 hours after installation
O Drying the contents in a chamber and comparing the dry weight of the contents.
O Prediction:
O Minimal Impact, because the device is not adding new sediment to the river
O Slight sediment stir up initially, which will settle down eventually
O Mitigation Plan:
O Will depend on the level of impact

Objective Project Evaluation: Success and Failure
O Success
O It worked!
O However:
O Produced only 0.09
watts in a 0.3 m/s
river flow
O Not 50 watts
O Challenges:
O Tension wire
O Low river flow
velocities
O System mass
O Wind


Engineering Specs (RYG) Specification Marginal Value Ideal Value Status
Max. Transport Dimension 40 in ≤35 in
Weight 300 lbs. ≤150 lbs
Hydrofoil Angle Resolution 2 degrees ≤1 degree
Aspect Ratio of Hydrofoil 4 10 in/in
Data Sample Rate TBD. 50,000 Hz
Data Resolution 16 bits 16 bits
Time Data Resolution .01 s .001 s
Setup Time 20 min < 15 min
Removal Time 20 min < 10 min
Run time per setup 2 hours 5 hours
Environmental impact (water: chemical) 1 test plan 2 test plans
Environmental impact (water: organisms) 1 test plan 2 test plans
Environmental impact (land) 2 test plans 3 test plans
Environmental impact (air) 1 test plan 2 test plans
Number of cycles with data at a given river
speed 400 cycles
# = to > 2 hours of run
time
Hydrofoil Shape 0018 0015

Test Results
0 20 40 60 80 100 120 140 16040
45
50
55
60
65
70
75
80
85
90Boom Angle Versus Time
Time (s)
Angle
(deg)
1 2 3 4 5 6 7 8 9 10 11 120
0.01
0.02
0.03
0.04
0.05
0.06
0.07
0.08
0.09Cycle Power (W)
Cycles Completed
Pow
er (
W)
40 45 50 55 60 65 70 75 80 85 90-0.2
0
0.2
0.4
0.6
0.8
1
1.2Instanteneou Power v. Boom Position
Boom Angle
Pow
er (
W)
0 2 4 6 8 10 120.03
0.04
0.05
0.06
0.07
0.08
0.09Cycle Power (W)
Cycles Completed
Watt
s

Future Work O Determine how much power is consumed by flipping the
hydrofoil
O Create/test methods for doing that flip passively
O Explore the use of flywheels for increasing the system efficiency
O Begin execution of some environmental assessment plans to quantify the environmental impact of our device
O Explore the use of curved plates for foil in place of more costly hydrodynamic shapes and lastly,
O Replace the rigid boom with a tether system
O increase efficiency
O lower cost and weight
O generate more power