hydrogen and copper isotope analysis of turquoise by...
TRANSCRIPT
1
Please note that this is an author-produced PDF of an article accepted for publication following peer review. The definitive publisher-authenticated version is available on the publisher Web site.
Chemical Geology February 2015, Volume 395, Pages 41-49 http://dx.doi.org/10.1016/j.chemgeo.2014.11.024 http://archimer.ifremer.fr/doc/00239/35008/ © 2014 Elsevier B.V. All rights reserved.
Achimer http://archimer.ifremer.fr
Hydrogen and copper isotope analysis of turquoise by SIMS: Calibration and matrix effects
Othmane Guillaume 1,
*, Hull Sharon 1, Fayek Mostafa
1, Rouxel Olivier
2, Geagea Majdi Lahd
3,
Kyser T. Kurtis 3
1 Dept. of Geological Sciences, University of Manitoba, Winnipeg, MB, Canada R3T 2 N2
2 IFREMER, Centre de Brest, Plouzané, 29280, France
3 Dept. of Geological Sciences, Queen’s University, Kingston, ON, Canada K7L 3 N6
* Corresponding author : Guillaume Othmane, tel.: + 1 204 474 7178 ; fax: + 1 204 474 7623 ; email address : [email protected]
Abstract : The hydrogen isotope system is used extensively to provide information on the genesis of minerals (e.g., source of fluids and mechanisms of precipitation). The copper isotopic system is less well understood, but has the potential to provide valuable insight on mineral precipitation, particularly supergene Cu-rich minerals. Here we present a rapid and precise method for measuring hydrogen and copper isotopes in semi-precious gem-quality turquoise (Cu(Al,Fe3 +)6(PO4)4(OH)8 · 4H2O ) by secondary ion mass spectrometry (SIMS). The suitability of standards for instrumental mass fractionation (IMF) calibration was assessed by external precision of SIMS measurements for each standard (2-4‰ for δDIMF and 0.2-0.4‰ for δ65CuIMF). IMF in turquoise was correlated with H and Fe contents for D/H measurements and Fe content for 65Cu/63Cu measurements. Based on these correlations, IMF can be corrected to enable δD and δ65Cu analyses by SIMS with accuracies of ± 5‰ and ± 0.5‰, respectively. The precision and accuracy of SIMS thus rivals those of other mass spectrometric methods for H and Cu isotopes and demonstrates the potential of SIMS applications in identifying gemstones provenance and understanding the genesis of turquoise deposits.
Highlights
► We developed a method for measuring H and Cu isotopes in turquoise by SIMS. ► IMF in turquoise is correlated with H and Fe contents for D/H measurements. ► IMF in turquoise is correlated with Fe content for
65Cu/
63Cu measurements. ► δD and δ
65Cu in turquoise can be measured by SIMS with
precision of ± 5‰ and ± 0.4‰, respectively. ► Applications of this method include determining gemstones provenance and understanding the genesis of turquoise deposits.
Keywords : turquoise, SIMS, copper isotopes, hydrogen isotopes, matrix effects

ACC
EPTE
D M
ANU
SCR
IPT
ACCEPTED MANUSCRIPT
1. Introduction
Isotope ratio mass spectrometry (IRMS) is the high-precision method for measuring
isotopes ratios with applications in isotope geochemistry, geochronology and
cosmochemistry (Ireland, 2013). Three types of mass spectrometers are mainly used
for bulk isotopes analysis. Elements that can be easily introduced as gases, such as H,
are typically analyzed using gas source mass spectrometers. In contrast, other
elements such as Cu, are analyzed by thermal-ionization mass spectrometers (TIMS)
(Walker et al., 1958) and more recently by multi-collector inductively coupled plasma
mass spectrometers (MC-ICP-MS) (Maréchal et al., 1999). Although bulk isotopic
analysis techniques frequently offer better precision and accuracy than in situ
techniques, there are several analytical considerations. All traditional bulk isotopic
analysis techniques are destructive, which can be problematic for (semi-) precious
gemstones or archaeological artifacts analysis. In addition, some of these techniques
require extensive sample processing prior to analysis. Sample preparation often
involves chemical separation of the element of interest, which is time consuming and
requires a large amount of material. In addition, Maréchal et al., 1999 and Maréchal
and Albarède, 2002 showed that failure to achieve total Cu recovery from ion
exchange columns prior to mass spectrometry analysis resulted in severe isotopic
fractionation (up to 24‰). Other analytical considerations include the occurrence of
mineral inclusions at the micron-scale in the sample studied, which may be
incorporated in bulk analysis and produce erroneous values.
Laser ablation (LA) MC-ICP-MS techniques are now increasingly used to
measure spatially resolved and high-precision copper isotope ratios (Graham et al.,
2004; Ikehata et al., 2008; Li et al., 2010). Laser ablation techniques have many
advantages compared with bulk techniques. Indeed isotopic ratios measurements

ACC
EPTE
D M
ANU
SCR
IPT
ACCEPTED MANUSCRIPT
using laser ablation require a smaller amount of sample and a much easier sample
preparation procedure (i.e., without chemical extraction procedures), and can provide
spatial distributions of isotopic composition.
Secondary ion mass spectrometry (SIMS) is a technique that was developed to
provide in situ measurement of isotopic ratios with a spatial resolution on the scale of
a few m. Despite its higher cost, the SIMS technique can potentially overcome the
issues associated with the more destructive laser isotopic analysis methods, especially
for (semi-) precious gemstones studies. SIMS is less destructive than laser ablation,
especially in terms of spot size (10 µm for SIMS versus >40 µm or raster areas that
are several 100’s of µm for LA-ICP-MS to achieve the same level of precision) and
penetration depth (0.5 to 1.0 mm for SIMS versus >40 µm for LA-ICP-MS) and is
better suited to avoid sample impurities at the micron-scale. SIMS has been used for
many studies in the earth sciences, including trace elements, light stable isotopes,
geochronology and cosmochemistry (Fayek, 2009; MacRae, 1995; Reed, 1989), and
in the cultural heritage (Darque-Ceretti and Aucouturier, 2004; Dowsett and Adriaens,
2004). For example, SIMS has been used to determine the provenance of gem
minerals (Giuliani et al., 2000; Ludwig et al., 2011; Shabaga et al., 2010; Giuliani et
al., 2000).
As with other mass spectrometers, during the measurement process by SIMS,
an intrinsic mass dependent bias is introduced, which is referred to as instrumental
mass fractionation (IMF) and typically favors the low mass isotope. IMF occurs at
various analysis stages, including sputtering, ionization, extraction, transmission of
the secondary ions through the mass spectrometer, and secondary ion detection.
However, the greatest contributor to the IMF is the ionization process, which depends
most strongly upon sample characteristics (i.e., chemical composition). This is
ACC
EPTE
D M
ANU
SCR
IPT
ACCEPTED MANUSCRIPT
referred to as compositionally dependent fractionation or “matrix effects” (e.g.,
Riciputi et al., 1998). Therefore, accurate isotopic SIMS analysis requires that IMF be
corrected for by standardizing the IMF using mineral standards that are
compositionally similar to the unknown. In the case of mineral solid solutions,
standards spanning a wide compositional range are often necessary to accurately
correct the IMF. Corrections using linear interpolations between only the two end-
members of one solid solution may indeed lead to large errors (e.g., Bell et al., 2009;
Eiler et al., 1997; Page et al., 2010; Riciputi et al., 1998; Valley and Kita, 2009).
The aim of this study is to develop protocols for precise and accurate, in situ,
microanalysis of hydrogen and copper isotopes in turquoise by SIMS. Turquoise is a
semi-precious gem stone with a range of chemical compositions (e.g., turquoise-
chalcosiderite solid-solution series, Cu(Al,Fe3+
)6(PO4)4(OH)8·4H2O; Abdu et al.,
2011; Foord and Taggart, 1998). Therefore, the development of standardization
protocols for D/H and 65
Cu/63
Cu measurements by SIMS over a wide range of
turquoise compositions can provide a relatively non-destructive, valuable method for
determining the provenance of this semi-precious gem mineral.
2. Standards and cross-calibration
2.1. Samples
Nine samples from turquoise deposits throughout the Southwestern United States
were collected (Table 1). Turquoise samples purity was assessed by powder X-ray
diffraction (XRD) and Fourier-transform infrared (FTIR) spectroscopy. Samples were
crushed and sieved to the < 350 mesh (5-10 μm) size fraction prior to XRD analysis.

ACC
EPTE
D M
ANU
SCR
IPT
ACCEPTED MANUSCRIPT
Powder XRD measurements were performed with Cu K radiation in Bragg-Brentano
geometry on a Philips (PANalytical) PW1710 automated diffractometer. Data were
processed using the MDI Jade+ software. FTIR spectra were collected in the
transmission mode at room temperature, using a Bruker Tensor 27 FTIR spectrometer
equipped with a KBr beam splitter and a DLATGS detector. Spectra over the range
400–4000 cm–1
were obtained by averaging 100 scans with a resolution of 4 cm–1
. To
record IR spectra, approximately 2 mg of dried sample was gently ground with 200
mg of dried KBr. The mixture was pressed at 10 tons/cm2, oven-dried overnight to
remove adsorbed water and pressed again to produce a KBr pellet. Baseline correction
was done using the OPUS spectroscopic software (Bruker Optic GmbH).
2.2. Samples preparation for EPMA and SIMS analysis
For electron probe micro-analysis (EPMA) and SIMS analysis, 1 mm to 1 cm size
pieces of turquoise were arranged in holes drilled in 25 mm diameter aluminium
mounts. Buehler "Epoxide" epoxy resin was then poured in and allowed to harden
overnight. The hardened epoxy mounts were then polished using various grit (600-
1200) SiC sandpaper and 1-15 μm diamond polishing compounds. The mounts were
then washed with a dilute soap solution, ultrasonically cleaned in deionized water and
ethanol, and placed in an oven at 60°C for 20 minutes to remove adsorbed water.
2.3. EPMA
Sample mounts were coated with a thin layer of carbon for conductivity. The major
element concentrations of the turquoise standards were determined using a Cameca

ACC
EPTE
D M
ANU
SCR
IPT
ACCEPTED MANUSCRIPT
SX-100 electron microprobe at the University of Manitoba. Operating conditions
were 15 keV accelerating voltage, 20 nA beam current, a beam size of 10 m and data
acquisition in wavelength-dispersive spectrometry (WDS) mode. The following
standards were used: albite (Na), olivine (Mg), andalusite (Al), diopside (Si, Ca),
apatite (P), pyrite (S), orthoclase (K), titanite (Ti), chromite (Cr), fayalite (Fe),
chalcopyrite (Cu), and gahnite (Zn). Corresponding detection limits were on the order
of 0.1 wt. %. H2O contents were determined by difference.
2.4. Standards composition
Powder XRD and FTIR analyses showed that all samples mainly consist of turquoise,
with traces of kaolinite for some samples (data not shown). The turquoise samples
selected as standards (5 for the hydrogen study and 6 for the copper study) showed
textural and chemical homogeneity (Table 2) and their chemical compositions (e.g.,
Fe content; Table 2) covered a wide range within the turquoise-chalcosiderite
Cu(Al,Fe3+
)6(PO4)4(OH)8·4H2O solid-solution series. Therefore, IMF that may be due
to matrix effects could be quantified.
2.5. Calibration of D/H and 65
Cu/63
Cu values of standards
Hydrogen isotopes ratios “true” values were measured by using a Finnigan MAT
Delta 252 and a V.G. model 602 C gas source mass spectrometer. Water content of
turquoise samples was obtained using the protocol of Kyser and O'Neil, 1984. Gas
source mass spectrometer analyses were performed using a dual inlet system or a
continuous flow method. In the dual inlet technique, the sample and standard gases

ACC
EPTE
D M
ANU
SCR
IPT
ACCEPTED MANUSCRIPT
were alternately introduced in the mass spectrometer ionization chamber. Prior to
injection, the water was converted to H2 by reaction with uranium at 900°C following
the method of Bigeleisen et al., 1952, as modified by Kyser and O'Neil, 1984. The
dual-inlet method is very accurate because the sample and standard gases can be
compared under essentially identical instrument conditions. In the continuous flow
technique, the sample or the standard water was delivered via a He carrier gas stream
to a furnace for reduction into H2 and subsequently to the ionization chamber. This
method is usually faster than the dual-inlet method, avoiding off-line gas conversion
steps, and requires less material (Sharp et al., 2001).
Copper isotopes ratios “true” values were measured using a multicollector
inductively coupled plasma mass spectrometer (MC-ICP-MS) Neptune (Thermo
Fisher Scientific) operating at the Pôle Spectrométrie Océan (IFREMER, Plouzané,
France). The experimental protocol used was similar to that described by Rouxel et
al., 2004; Maréchal et al., 1999; Chapman et al., 2006; Borrok et al., 2007; Palacios et
al., 2011 and described below.
Turquoise samples were cleaned in distilled water and ethanol in an ultrasonic
bath, dried and ground in an agate mortar. After a complete digestion step in
concentrated HF-HNO3 and HCl-HNO3 mixture, bulk rock and Cu0 samples were
dissolved in 2 mL of 6 mol/L distilled HCl in a closed beaker on a hot plate. A precise
volume of this solution was then purified using anion exchange chromatography in an
HCl medium (distilled grade). A 5 mL column was loaded with 1.8 mL Bio-Rad
AG1-X8 anion resin 200 – 400 mesh (chloride form) which was acid cleaned with 10
mL of 2 mol/L HNO3, 10 mL of ultrapure water and 10 mL of 0.24 mol/L HCl and
finally conditioned with 5 mL of 6 mol/L HCl. Under these conditions, Cu (along
with Fe) was adsorbed onto the anionic resin while the sample matrix was eluted

ACC
EPTE
D M
ANU
SCR
IPT
ACCEPTED MANUSCRIPT
using 5 mL of 6 mol/L HCl. Cu was then eluted (and separated from Fe) with 50 mL
of 6 mol/L HCl, collected in a PTFE vial and evaporated to dryness. The residue was
re-dissolved in 2-3 mL of 0.28 mol/L HNO3 and then further diluted to form a 0.1 to
0.5 ppm Cu solution ready for isotope analysis. Quantitative recovery of Cu through
the entire chromatographic procedure was checked by calculating chemistry yield for
each sample and also by checking Cu recovery in standard solution processes through
chemistry.
Analyses of 65
Cu/63
Cu were carried out on the Neptune MC-ICP-MS operating
at low resolution. The samples were introduced into the plasma using a double spray
quartz chamber system (cyclonic and double pass) and a microconcentric PFA
nebulizer operating at a flow rate of about 60 μL min-1
. Instrumental mass bias was
corrected for using Zn isotopes as an internal standard and involves simultaneous
measurement of a Zn standard solution (SRM 3168a Standard Solution). Also a
standard bracketing approach, which normalizes the Cu isotope ratio to the average
measured composition of a standard (SRM 976) was carried out before and after each
sample. Standard deviation values (1SD) were calculated using 4 duplicate analysis.
3. SIMS Methods
A ~200 Å thick Au coat was sputter-deposited on the sample mount surfaces, prior to
SIMS analysis using a Cameca IMS-7f ion microprobe at the University of Manitoba.
The mounts were placed in stainless steel sample holders and the entire assembly was
then placed in the SIMS sample lock and held at high vacuum for a minimum of eight
hours prior to the start of analysis. Positive secondary ions were produced by an O-
beam with impact energy of 22.5 keV. The samples were analyzed using 40 nA, -12.5
kV O- primary beam focused on a ~50 m spot. The largest contrast (400 m) and

ACC
EPTE
D M
ANU
SCR
IPT
ACCEPTED MANUSCRIPT
field (1800 m) apertures, in conjunction with 150 m image field and an energy
bandpass of ±25 eV, were used to maximize sensitivity. The secondary column high
voltage was set to 10 kV.
3.1. Isotopic measurements
For D/H isotopic measurements, the secondary ion mass spectrometer was operated at
a mass resolution of ~800 to separate D+ from H2
+ and sample voltage offset of -50 V,
while maintaining the secondary column at 10 kV to help minimize the H2+ peak (Liu
et al., 2011). Each analysis ran for 50 cycles with a magnet settle time of 0.5 s
between each mass and an analysis time of 1.04 seconds for H and 5.04 s for D. A
Faraday cup detector was used for H and an electron multiplier was used for D. The
gain on the faraday cup relative to electron multiplier was calibrated before each
analysis. Linear drift was corrected using mass H.
For 65
Cu/63
Cu isotopic measurements, isobaric interferences were minimized
by offsetting the sample high-voltage by -50 V. Each analysis ran for 60 cycles with a
magnet settle time of 0.5 seconds between mass 63
Cu and 65
Cu and analysis time of
1.04 s for both 63
Cu and 65
Cu. Both masses were measured using an electron
multiplier with a dead time of 37 ns.
The hydrogen and copper isotopic data are given in the Table 3 and 4,
respectively. Isotopic data determined by solution GS-MS or MC-ICP-MS are
presented using standard -notation relative to the appropriate international standard,
Vienna Standard Mean Ocean Water (V-SMOW) for hydrogen and NIST 976 for
copper. The equation for calculating values in units of per mil (‰) is:
sample=(Rsample-Rstd)/Rstd × 1000
[1]

ACC
EPTE
D M
ANU
SCR
IPT
ACCEPTED MANUSCRIPT
where Rsample and Rstd are the absolute ratios of D/H or 65
Cu/63
Cu in the sample
(turquoise) and the standard (V-SMOW or NIST 976), respectively. The absolute D/H
ratio of V-SMOW is 155.76x10⁻⁶
(Hagemann et al., 1970) and the absolute 65
Cu/63
Cu
ratio of NIST 976 is 4.4563x10⁻¹
(Shields et al., 1964).
The isotope mass fractionation that occurs during SIMS analysis was
calculated by using equation [2]:
αSIMS = RSIMS/Ractual [2]
where RSIMS is the ratio measured by SIMS and Ractual is the accepted ratio measured
by conventional techniques (GS-MS and MC-ICP-MS for hydrogen and copper
isotopes, respectively).
The isotope mass fractionation that occurs during SIMS analysis (αSIMS) can
be converted into notation (in units of per mil) by using equation [3]:
RIMF = [RSIMS/Ractual - 1] × 1000 = (αSIMS -1) × 1000 [3]
For each standard, at least 5 different spots (n) were analyzed sequentially. The SB-1
standard was periodically analyzed within each session and no significant within run
drift was observed. The internal precision is the average internal precision of the n
analysis spots. The external precision is calculated as the standard deviation of the n
analysis spots.
The internal precision of D/H measurements was around 3‰ whereas the
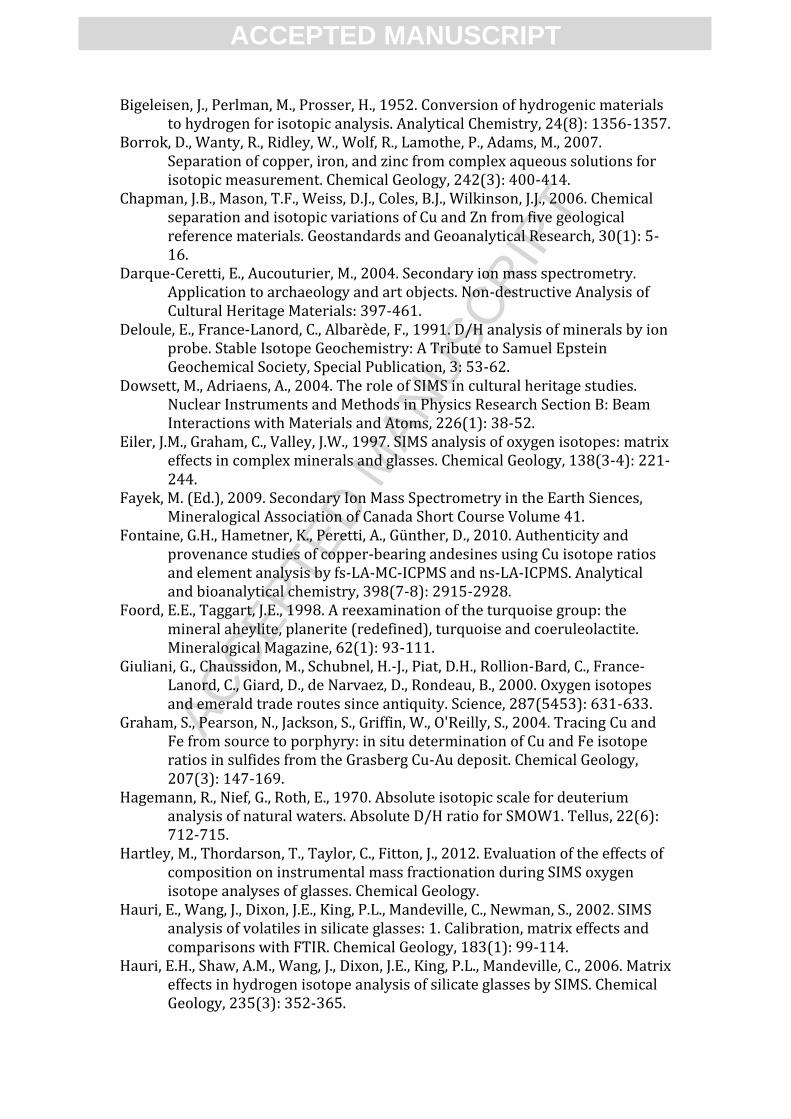
external precision of each standard DIMF ranged from 1 to 4‰ (Table 3). Figure 1a
shows SIMS hydrogen isotopic analyses of different spots of the SB-1 turquoise
standard made over several analysis sessions. The individual spots IMF values varied
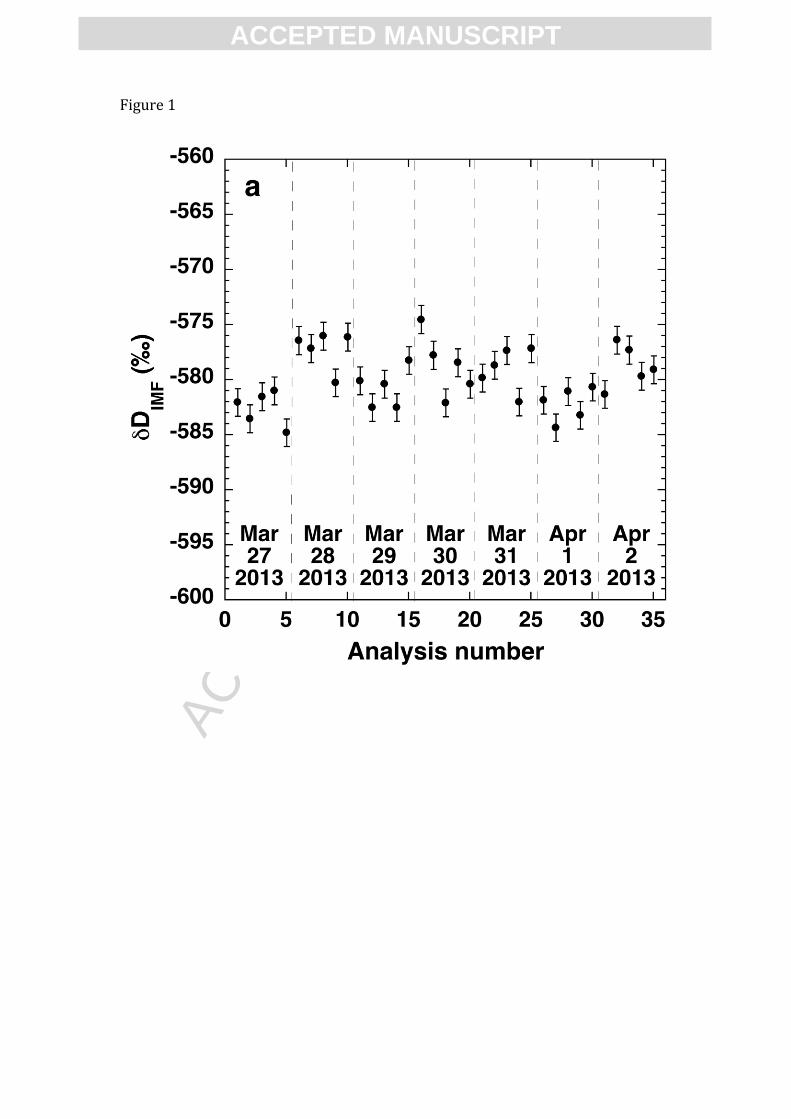
between -585‰ and -575‰. The internal precision of 65
Cu/63
Cu measurements
ranged from 0.3 to 0.4‰ whereas the external precision of each standard CuIMF
varied between 0.1 and 0.4‰ (Table 4). Figure 1a shows SIMS copper isotopic

ACC
EPTE
D M
ANU
SCR
IPT
ACCEPTED MANUSCRIPT
analyses of different spots of the SB-1 turquoise standard made over several analysis
sessions. The individual spots IMF values varied between -21.3‰ and -18.6‰.
These results show that the spot-to-spot reproducibility was good within each session,
which demonstrates that all the turquoise samples selected are sufficiently
homogeneous to be suitable calibration standards. The session-to-session variation
may be due to changes in instrumental parameters (e.g., mass spectrometer tuning,
gun alignment, electron multiplier efficiency). However, no significant variations in
IMF were observed when changing sample holder within an individual session.
Session-to-session changes in IMF require the instrument to be calibrated every
analytical session.
The isotopes ratios measured by SIMS are not correlated with the isotopes
ratios determined by conventional techniques (Fig. 2 and 3). This suggests that IMF in
turquoise is due to matrix effects for both hydrogen and copper isotopes. As it was
previously shown for the SB-1 standard, the isotopes ratios of each standard measured
by SIMS are slightly different between analytical sessions. To investigate the relative
variation of ratios between standards, the IMF was corrected using the SB-1 standard
in each session. The Cu isotopic values obtained for the other standards after IMF
correction show that the relative ratios between standards remain relatively consistent
(Fig. 4 and 5). Therefore, few standards can be used for IMF calibration of unknown
samples if the relationship between IMF and chemical composition is well
established.
3.2. Matrix effects
As the instrumental parameters affecting the IMF can be held constant or relatively
ACC
EPTE
D M
ANU
SCR
IPT
ACCEPTED MANUSCRIPT
easily corrected, the more problematic contributor to IMF is the matrix effects, which
mainly control isotopic fractionation during the ionization stage. Isotopic
fractionation during ionization depends on many factors, including binding energy of
the surface atoms (bond strength), the mass ratio of the isotopes, the work function of
the surface, emission angle, ionization potential, and kinetic energy of both the
sputtering and sputtered ions (Riciputi et al., 1998, and references therein). Although
various sputtering/ionization models have been proposed for simple chemical
compounds, these models generally cannot be applied to more complex geological
materials (Riciputi et al., 1998, and references therein). However, empirical models of
IMF in minerals or glasses have been established for various light stable isotopes,
including hydrogen (Deloule et al., 1991; Hauri et al., 2002; Hauri et al., 2006) or
oxygen (Eiler et al., 1997; Hartley et al., 2012; Hervig et al., 1992; Page et al., 2010;
Riciputi et al., 1998; Vielzeuf et al., 2005) . To our knowledge, copper isotopes IMF
due to matrix effects in geological materials have yet to be reported in the literature .
3.2.1. Hydrogen
The hydrogen isotopes IMF is negatively correlated with the H content and positively
correlated with the Fe content (Fig. 6). Such a correlation has been previously
observed for silicate glasses (Hauri et al., 2002; Hauri et al., 2006). More precisely,
IMF is related to the H and Fe contents (in at. %) by the following exponential model:
δDIMF = aexp(bFe0.04
/H)+c [4] (see Fig. 6)
The hydrogen isotopes IMF data obtained during three sessions were fitted using a

ACC
EPTE
D M
ANU
SCR
IPT
ACCEPTED MANUSCRIPT
least squares method and an exponential growth model (see Equation [4]). Fitting
results are given in the Table 5. Best fits have coefficient of determination (R2) values
greater than 0.88, which assessed the quality of the fits. The coefficients values of
equation [4] change between the three different analytical sessions, which accounts
for the session-to-session instrumental changes. Therefore, at least 3 standards that
bracket the Fe/H ratio of the unknown samples should be analyzed, in order to
delineate the overall shape of the curve and accurately determine the fit coefficients.
Standards should be analyzed during the same analysis session as samples to be
corrected.
The correction scheme reproduced the actual δD composition of the turquoise
standards used to ± 5‰ for all analytical sessions, except for the CS-1 sample in the
last session (Table 6).
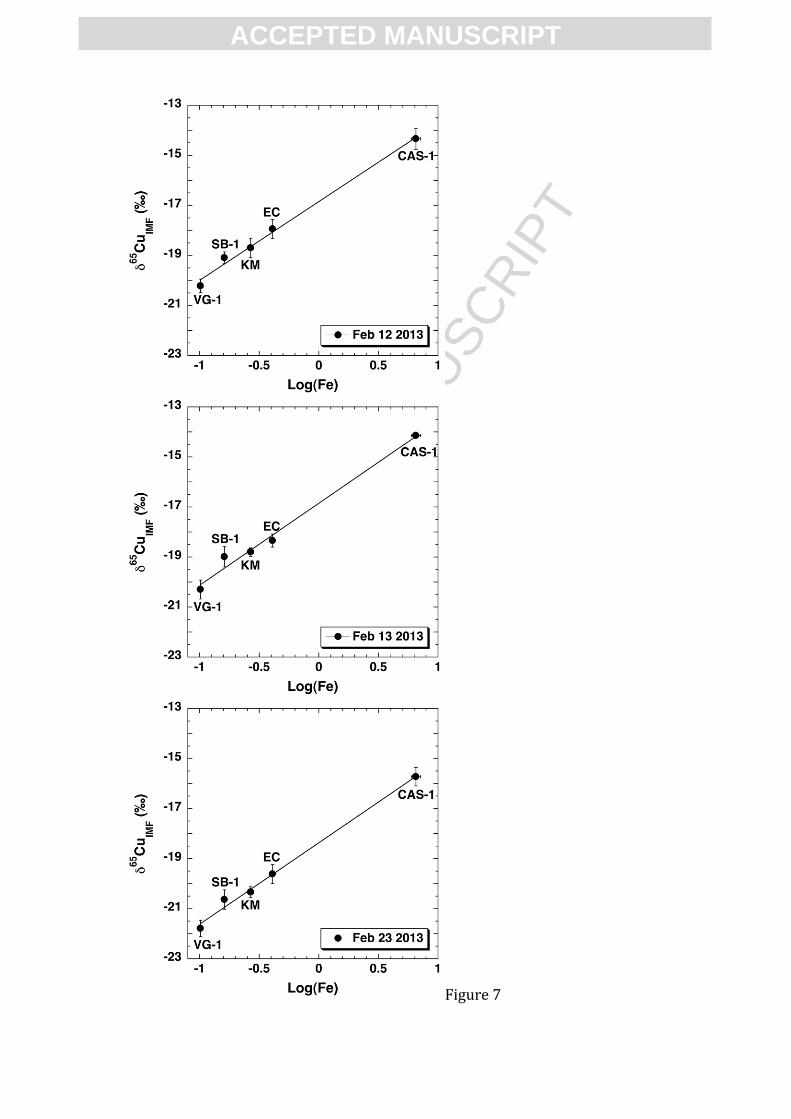
3.2.2. Copper
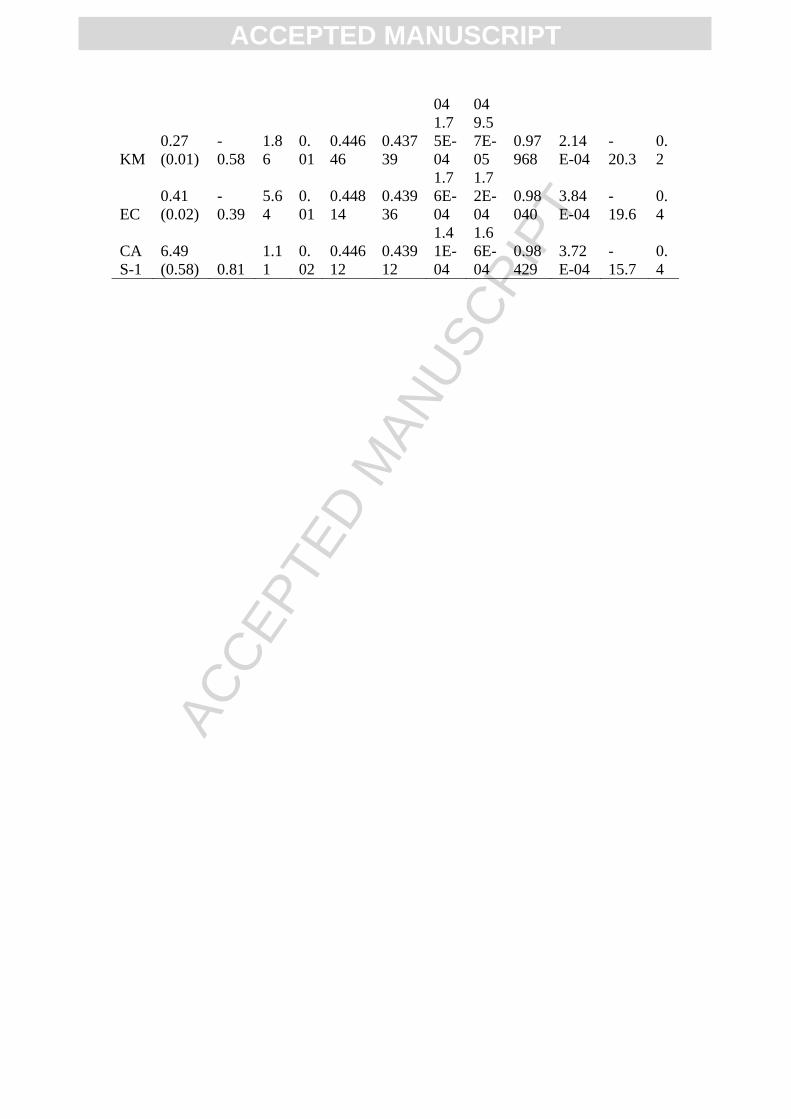
The copper isotopes IMF is positively correlated with the Fe content (Fig. 7). As the
Fe content is negatively correlated with the Al content within the turquoise-
chalcosiderite series (Abdu et al., 2011), the copper isotopes IMF is negatively
correlated to the Al content of turquoise samples. We tested least-square fitting
procedures to relate IMF and Fe, Al, Fe/Al, or Fe/(Al+Fe) and best coefficient of
determination (R2) values (i.e., best fits) were obtained using only the Fe content (in
at. %) with the following model:
δ65
CuIMF = alog(Fe)+b [5] (see Fig. 7)

ACC
EPTE
D M
ANU
SCR
IPT
ACCEPTED MANUSCRIPT
Fitting results for the copper isotopes IMF data obtained during three sessions are
given in Table 7. Best fits have coefficient of determination (R2) values superior to
0.98, which assessed the quality of the fits. The a coefficients values of equation [5]
are similar for the three different analytical sessions whereas the b values accounts for
the session-to-session instrumental changes. Therefore at least 2 standards that
bracket the chemical composition of the unknown samples (i.e., one Al-rich and one
Fe-rich turquoise standard) should be analyzed during each analytical session to
correct for the IMF.
Using the appropriate correction schemes for each analytical session, the
δ65
Cu measured by SIMS were reproduced within ± 0.5 ‰ of their actual value for all
sessions (Table 8).
4. Applications
The development of the SIMS calibration method for H and Cu isotopic
measurements in turquoise may have many applications. Accurate determination of H
and Cu isotopic composition by the relatively non-destructive SIMS technique may be
used to certify the provenance of turquoise, and other Cu-bearing gem minerals, if
similar IMF calibration studies are carried out. For example, such analysis could help
to identify the source of gem-quality Cu-rich tourmalines. Cu-bearing tourmaline
from Paraiba (Brazil) is a highly prized gem mineral and “Paraiba-type” tourmalines
of similar colour and quality are produced today from localities in Mozambique and
Nigeria. Developing provenance tools for Cu-rich tourmalines is necessary, as their
economic value partly depends on their origin. Li and B isotopes in Cu-rich
tourmalines have been shown to be a suitable provenance tool (Ludwig et al., 2011;

ACC
EPTE
D M
ANU
SCR
IPT
ACCEPTED MANUSCRIPT
Shabaga et al., 2010). Although the range in Cu isotopic composition of tourmalines
from pegmatites is unknown, the range in H isotopic composition can be from -120‰
to -40‰ (Jiang, 1998; Holcombe and Valasquez, 1997), Therefore, the analysis of H
and Cu isotopic composition of Cu-rich tourmalines could provide complementary
information.
Apart for provenance determination, H and Cu isotopic measurements may
also be applied to identify “fake” gems that have been modified from non-gem
starting material. For example, such analysis could help to distinguish natural red Cu-
bearing plagioclase feldspars from Cu-diffusion treated counterparts. Although red
Cu-containing andesine had been thought unique to the state of Oregon, new localities
for Cu-bearing feldspars were reported from the Democratic Republic of the Congo,
Mongolia and Tibet in the last decade (Rossman, 2011). As the high value of the
North America red feldspar partly depends on its strict origin, the new supposedly red
feldspars have been the subject of concerns about their provenance and natural color.
In fact, many studies suggest that a large part of red feldspars on the market is the
product of copper diffusion into pale yellow andesine from Inner Mongolia by
laboratory heat treatment (Rossman, 2011). Measuring Cu isotope ratios in Cu-
bearing andesine has proven to be helpful in determining their authenticity and
provenance, as laboratory diffused samples show a greater intra-sample variability for
65Cu/
63Cu due to the diffusion process (Fontaine et al., 2010). In addition, comparing
the Cu isotope ratios of two minerals without depth-profiling does not allow
distinguishing between a naturally colored and a Cu-diffused andesine, as the copper
isotopic composition of treated samples may be influenced by many factors (e.g.,
isotope composition of the treatment, exposure time, temperature).

ACC
EPTE
D M
ANU
SCR
IPT
ACCEPTED MANUSCRIPT
The analysis of H and Cu isotopic ratios by SIMS may also be useful for
identifying the provenance of archaeological artifacts. For example, source regions of
turquoise artifacts from the American Southwest have been identified by measuring
the isotopic ratios of hydrogen and copper (Hull and Fayek, 2012; Hull et al., 2008).
The measurement of D/1H and
65Cu/
63Cu was indeed successful in identifying unique
fingerprints for different turquoise mines, thus allowing determination of the
provenance of turquoise artifacts and improving the understanding of pre-Columban
turquoise trade networks.
5. Conclusions
SIMS analyses of D/H and 65
Cu/63
Cu ratios in turquoise reveal that variations in IMF
are correlated with the abundance of water and iron of the samples. The strong matrix
effect observed (~20‰ for H and ~7‰ for Cu) illustrates the importance of
evaluating such effects in isotope analysis by SIMS because the overall natural ranges
in H and Cu isotopic composition for turquoise are ~80‰ and 16‰, respectively
(Hull et al., 2014). Correction models have been proposed to calibrate IMF for matrix
effects: (1) an exponential growth model based on the H and Fe contents for D/H
measurements, (2) a logarithmic model based on the Fe content for the 65
Cu/63
Cu
measurements. All the standards used in this study have been shown to be suitable for
use as calibration standards in δD and δ65
Cu analysis in turquoise by SIMS. Although
the absolute value of the IMF changes with instrumental conditions (e.g., tuning or
electron multiplier efficiency) between two sessions, the relationship between IMF
and chemical composition remains similar. Therefore at least two (for 65
Cu/63
Cu
analysis) or three (for D/H analysis) standards that compositionally bracket the
ACC
EPTE
D M
ANU
SCR
IPT
ACCEPTED MANUSCRIPT
unknown should be analyzed during every analytical session to obtain a reliable
correction scheme.
This study demonstrates that accurate and reliable hydrogen and copper
isotopes ratios may be measured in turquoise by SIMS, once the hydrogen and iron
contents of unknown samples are known. The use of SIMS to analyse (semi-)
precious gem minerals or archeological artifacts has some advantages over bulk
isotope analyses methods as it is a relatively non-destructive technique and allows to
analyse samples, which contain mineralogical heterogeneities or are partly altered.
Acknowledgements
This research has been supported by the Canadian Foundation for Innovation (Fayek),
Natural Sciences and Engineering Council of Canada Discovery Grant (Fayek) and
Europole Mer (Rouxel). The authors would like to thank Brandi Shabaga (University
of Manitoba) and Emmanuel Ponzevera (IFREMER) for help in laboratory.
Figures captions
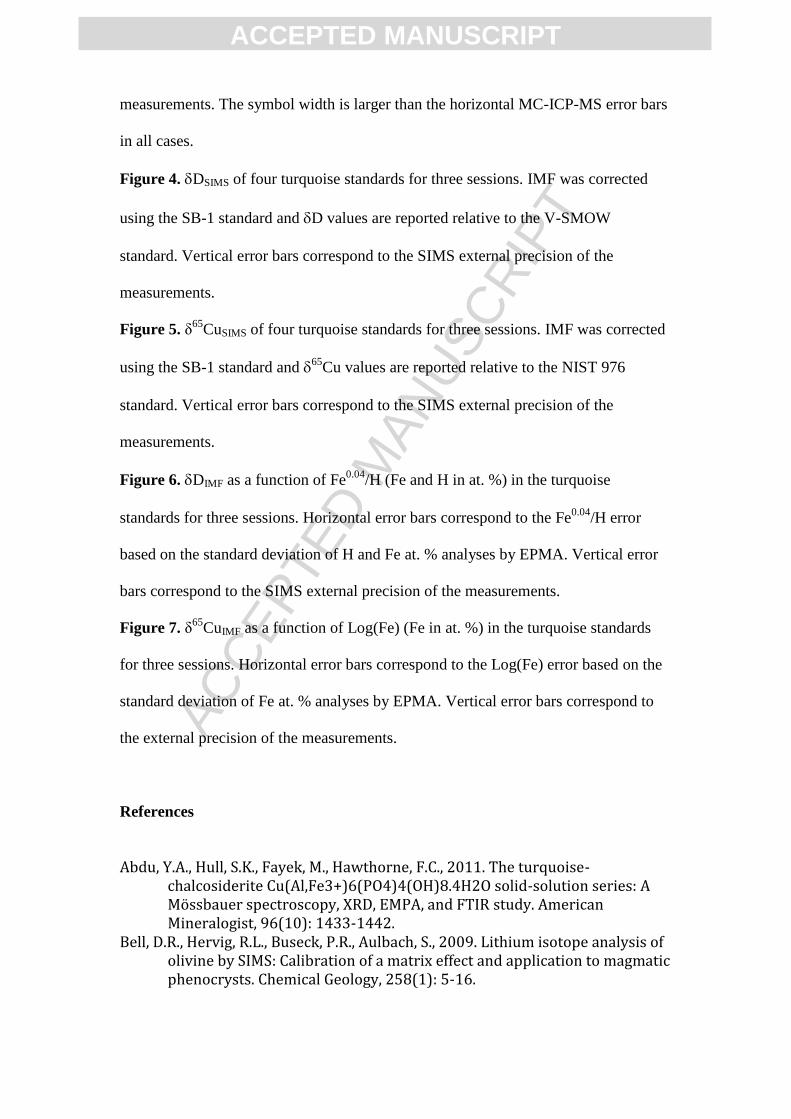
Figure 1. Plots of (a) hydrogen and (b) copper isotopic values showing the spot to
spot reproducibility during SIMS analytical sessions for the SB-1 sample.
Figure 2. D/H as a function of the “true” D/H values determined by GS-MS. Vertical
error bars correspond to the SIMS external precision of the measurements. The
symbol width is larger than the horizontal GS-MS error bars in all cases.
Figure 3. 65
Cu/63
Cu as a function of the “true” 65
Cu/63
Cu values determined by MC-
ICP-MS. Vertical error bars correspond to the SIMS external precision of the
ACC
EPTE
D M
ANU
SCR
IPT
ACCEPTED MANUSCRIPT
measurements. The symbol width is larger than the horizontal MC-ICP-MS error bars
in all cases.
Figure 4. DSIMS of four turquoise standards for three sessions. IMF was corrected
using the SB-1 standard and D values are reported relative to the V-SMOW
standard. Vertical error bars correspond to the SIMS external precision of the
measurements.
Figure 5. δ65
CuSIMS of four turquoise standards for three sessions. IMF was corrected
using the SB-1 standard and 65
Cu values are reported relative to the NIST 976
standard. Vertical error bars correspond to the SIMS external precision of the
measurements.
Figure 6. DIMF as a function of Fe0.04
/H (Fe and H in at. %) in the turquoise
standards for three sessions. Horizontal error bars correspond to the Fe0.04
/H error
based on the standard deviation of H and Fe at. % analyses by EPMA. Vertical error
bars correspond to the SIMS external precision of the measurements.
Figure 7. δ65
CuIMF as a function of Log(Fe) (Fe in at. %) in the turquoise standards
for three sessions. Horizontal error bars correspond to the Log(Fe) error based on the
standard deviation of Fe at. % analyses by EPMA. Vertical error bars correspond to
the external precision of the measurements.
References
Abdu, Y.A., Hull, S.K., Fayek, M., Hawthorne, F.C., 2011. The turquoise-chalcosiderite Cu(Al,Fe3+)6(PO4)4(OH)8.4H2O solid-solution series: A Mössbauer spectroscopy, XRD, EMPA, and FTIR study. American Mineralogist, 96(10): 1433-1442.
Bell, D.R., Hervig, R.L., Buseck, P.R., Aulbach, S., 2009. Lithium isotope analysis of olivine by SIMS: Calibration of a matrix effect and application to magmatic phenocrysts. Chemical Geology, 258(1): 5-16.
ACC
EPTE
D M
ANU
SCR
IPT
ACCEPTED MANUSCRIPT
Bigeleisen, J., Perlman, M., Prosser, H., 1952. Conversion of hydrogenic materials to hydrogen for isotopic analysis. Analytical Chemistry, 24(8): 1356-1357.
Borrok, D., Wanty, R., Ridley, W., Wolf, R., Lamothe, P., Adams, M., 2007. Separation of copper, iron, and zinc from complex aqueous solutions for isotopic measurement. Chemical Geology, 242(3): 400-414.
Chapman, J.B., Mason, T.F., Weiss, D.J., Coles, B.J., Wilkinson, J.J., 2006. Chemical separation and isotopic variations of Cu and Zn from five geological reference materials. Geostandards and Geoanalytical Research, 30(1): 5-16.
Darque-Ceretti, E., Aucouturier, M., 2004. Secondary ion mass spectrometry. Application to archaeology and art objects. Non-destructive Analysis of Cultural Heritage Materials: 397-461.
Deloule, E., France-Lanord, C., Albarède, F., 1991. D/H analysis of minerals by ion probe. Stable Isotope Geochemistry: A Tribute to Samuel Epstein Geochemical Society, Special Publication, 3: 53-62.
Dowsett, M., Adriaens, A., 2004. The role of SIMS in cultural heritage studies. Nuclear Instruments and Methods in Physics Research Section B: Beam Interactions with Materials and Atoms, 226(1): 38-52.
Eiler, J.M., Graham, C., Valley, J.W., 1997. SIMS analysis of oxygen isotopes: matrix effects in complex minerals and glasses. Chemical Geology, 138(3-4): 221-244.
Fayek, M. (Ed.), 2009. Secondary Ion Mass Spectrometry in the Earth Siences, Mineralogical Association of Canada Short Course Volume 41.
Fontaine, G.H., Hametner, K., Peretti, A., Günther, D., 2010. Authenticity and provenance studies of copper-bearing andesines using Cu isotope ratios and element analysis by fs-LA-MC-ICPMS and ns-LA-ICPMS. Analytical and bioanalytical chemistry, 398(7-8): 2915-2928.
Foord, E.E., Taggart, J.E., 1998. A reexamination of the turquoise group: the mineral aheylite, planerite (redefined), turquoise and coeruleolactite. Mineralogical Magazine, 62(1): 93-111.
Giuliani, G., Chaussidon, M., Schubnel, H.-J., Piat, D.H., Rollion-Bard, C., France-Lanord, C., Giard, D., de Narvaez, D., Rondeau, B., 2000. Oxygen isotopes and emerald trade routes since antiquity. Science, 287(5453): 631-633.
Graham, S., Pearson, N., Jackson, S., Griffin, W., O'Reilly, S., 2004. Tracing Cu and Fe from source to porphyry: in situ determination of Cu and Fe isotope ratios in sulfides from the Grasberg Cu-Au deposit. Chemical Geology, 207(3): 147-169.
Hagemann, R., Nief, G., Roth, E., 1970. Absolute isotopic scale for deuterium analysis of natural waters. Absolute D/H ratio for SMOW1. Tellus, 22(6): 712-715.
Hartley, M., Thordarson, T., Taylor, C., Fitton, J., 2012. Evaluation of the effects of composition on instrumental mass fractionation during SIMS oxygen isotope analyses of glasses. Chemical Geology.
Hauri, E., Wang, J., Dixon, J.E., King, P.L., Mandeville, C., Newman, S., 2002. SIMS analysis of volatiles in silicate glasses: 1. Calibration, matrix effects and comparisons with FTIR. Chemical Geology, 183(1): 99-114.
Hauri, E.H., Shaw, A.M., Wang, J., Dixon, J.E., King, P.L., Mandeville, C., 2006. Matrix effects in hydrogen isotope analysis of silicate glasses by SIMS. Chemical Geology, 235(3): 352-365.

ACC
EPTE
D M
ANU
SCR
IPT
ACCEPTED MANUSCRIPT
Hervig, R.L., Williams, P., Thomas, R.M., Schauer, S.N., Steele, I.M., 1992. Microanalysis of oxygen isotopes in insulators by secondary ion mass spectrometry. International Journal of Mass Spectrometry and Ion Processes, 120(1-2): 45-63.
Holcombe, B., Valasquez, M., 1997. Stable isotope variations in pegmatite systems associated with the Sebago batholith, southwestern Maine. Abstract, 10th Keck Symposium, College of Wooster, April 1, 1997: 191-194
Hull, S., Fayek, M., Mathien, F.J., Roberts, H., 2014. Turquoise trade of the ancestral puebloan: Chaco and beyond. Journal of Archaeological Science, 45 (1): 187-195.
Hull, S., Fayek, M., 2012. Cracking the Code of Pre-Columbian Turquoise Trade Networks and Procurement Strategies. In: King, J.C.H., Carocci, M., Cartwright, C., Mc Ewan, C., Stacey, R. (Eds.), Turquoise in Mexico and North America: Science, Conservation, Culture and Collections. Archetype Publications in Association with the British Museum, London, pp. 29-40.
Hull, S., Fayek, M., Mathien, F.J., Shelley, P., Durand, K.R., 2008. A new approach to determining the geological provenance of turquoise artifacts using hydrogen and copper stable isotopes. Journal of Archaeological Science, 35(5): 1355-1369.
Ikehata, K., Notsu, K., Hirata, T., 2008. In situ determination of Cu isotope ratios in copper-rich materials by NIR femtosecond LA-MC-ICP-MS. Journal of Analytical Atomic Spectrometry, 23(7): 1003-1008.
Ireland, T.R., 2013. Invited Review Article: Recent developments in isotope-ratio mass spectrometry for geochemistry and cosmochemistry. Review of Scientific Instruments, 84(1): 1-21.
Jiang, S-Y., 1998. Stable and radiogenic studies of tourmaline: An overview. Journal of the Czech Geological Society, 43 (1-2): 75-90.
Kyser, T.K., O'Neil, J.R., 1984. Hydrogen isotope systematics of submarine basalts. Geochimica et Cosmochimica Acta, 48(10): 2123-2133.
Li, W., Jackson, S.E., Pearson, N.J., Graham, S., 2010. Copper isotopic zonation in the Northparkes porphyry Cu-Au deposit, SE Australia. Geochimica et Cosmochimica Acta, 74(14): 4078-4096.
Liu, R., Hull, S., Fayek, M., 2011. A new approach to measuring D/H ratios with the Cameca IMS-7F. Surface and Interface Analysis, 43(1-2): 458-461.
Ludwig, T., Marschall, H., von Strandmann, P.P., Shabaga, B., Fayek, M., Hawthorne, F., 2011. A secondary ion mass spectrometry (SIMS) re-evaluation of B and Li isotopic compositions of Cu-bearing elbaite from three global localities. Mineralogical Magazine, 75(4): 2485-2494.
MacRae, N.D., 1995. Secondary-ion mass spectrometry and geology. The Canadian Mineralogist, 33(2): 219-236.
Maréchal, C.N., Albarède, F., 2002. Ion-exchange fractionation of copper and zinc isotopes. Geochimica et Cosmochimica Acta, 66(9): 1499-1509.
Maréchal, C.N., Télouk, P., Albarède, F., 1999. Precise analysis of copper and zinc isotopic compositions by plasma-source mass spectrometry. Chemical Geology, 156(1): 251-273.
Page, F.Z., Kita, N.T., Valley, J.W., 2010. Ion microprobe analysis of oxygen isotopes in garnets of complex chemistry. Chemical Geology, 270: 9-19.

ACC
EPTE
D M
ANU
SCR
IPT
ACCEPTED MANUSCRIPT
Palacios, C., Rouxel, O., Reich, M., Cameron, E.M., Leybourne, M.I., 2011. Pleistocene recycling of copper at a porphyry system, Atacama Desert, Chile: Cu isotope evidence. Mineralium Deposita, 46(1): 1-7.
Reed, S., 1989. Ion microprobe analysis‚ a review of geological applications. Mineralogical Magazine, 53(369): 3-24.
Riciputi, L.R., Paterson, B.A., Ripperdan, R.L., 1998. Measurement of light stable isotope ratios by SIMS: Matrix effects for oxygen, carbon, and sulfur isotopes in minerals. International Journal of Mass Spectrometry, 178(1): 81-112.
Rossman, G.R., 2011. The Chinese red feldspar controversy: Chronology of research through July 2009. Gems & Gemology, 47(1): 16-30.
Rouxel, O., Fouquet, Y., Ludden, J.N., 2004. Copper isotope systematics of the Lucky Strike, Rainbow, and Logatchev sea-floor hydrothermal fields on the Mid-Atlantic Ridge. Economic Geology, 99(3): 585-600.
Shabaga, B., Fayek, M., Hawthorne, F., 2010. Boron and lithium isotopic compositions as provenance indicators of Cu-bearing tourmalines. Mineralogical Magazine, 74(2): 241-255.
Sharp, Z., Atudorei, V., Durakiewicz, T., 2001. A rapid method for determination of hydrogen and oxygen isotope ratios from water and hydrous minerals. Chemical Geology, 178(1): 197-210.
Shields, W.R., Murphy, T.J., Garner, E.L., 1964. Absolute isotopic abundance ratio and the atomic weight of a reference sample of copper. Journal of research of the national bureau of standards, 68A: 589-92.
Valley, J.W., Kita, N.T., 2009. In situ oxygen isotope geochemistry by ion microprobe. MAC short course: secondary ion mass spectrometry in the earth sciences, 41: 19-63.
Vielzeuf, D., Champenois, M., Valley, J.W., Brunet, F., Devidal, J., 2005. SIMS analyses of oxygen isotopes: matrix effects in Fe-Mg-Ca garnets. Chemical Geology, 223(4): 208-226.
Walker, E.C., Cuttitta, F., Senftle, F.E., 1958. Some natural variations in the relative abundance of copper isotopes. Geochimica et Cosmochimica Acta, 15(3): 183-194.
ACC
EPTE
D M
ANU
SCR
IPT
ACCEPTED MANUSCRIPT
Figure 1
ACC
EPTE
D M
ANU
SCR
IPT
ACCEPTED MANUSCRIPT
Figure 1

ACC
EPTE
D M
ANU
SCR
IPT
ACCEPTED MANUSCRIPT
Figure 2

ACC
EPTE
D M
ANU
SCR
IPT
ACCEPTED MANUSCRIPT
Figure 3

ACC
EPTE
D M
ANU
SCR
IPT
ACCEPTED MANUSCRIPT
Figure 4

ACC
EPTE
D M
ANU
SCR
IPT
ACCEPTED MANUSCRIPT
Figure 5

ACC
EPTE
D M
ANU
SCR
IPT
ACCEPTED MANUSCRIPT
Figure 6
ACC
EPTE
D M
ANU
SCR
IPT
ACCEPTED MANUSCRIPT
Figure 7

ACC
EPTE
D M
ANU
SCR
IPT
ACCEPTED MANUSCRIPT
Table 1. Turquoise samples provenance.
Sample(s) Provenance
VG-1 Villa Grove, San Luis Valley, Colorado, U.S.A.
SB-1 Sleeping Beauty, Globe District, Arizona, U.S.A.
FX Fox Mine, Cortez, Nevada, U.S.A.
EC East Camp, Halloran Springs, California, U.S.A.
GT-1 Green Tree, Cortez, Nevada, U.S.A.
KG-1 Kingman, Mineral Park, Arizona, U.S.A.
RY-1, RY-2 Royston, Nevada, U.S.A.
CS-1, CAS-1 Castillian Mine, Cerrillos Hills, New Mexico, U.S.A.

ACC
EPTE
D M
ANU
SCR
IPT
ACCEPTED MANUSCRIPT
Table 2. Major element and isotopic compositions of the turquoise standards used in
this study. Standard deviations of the 5-10 EPMA analytical spots per standard are
given in parentheses.
VG-1 SB-1 FX EC GT-1 KG-1 RY-1 RY-2 CS-1 CAS-1
Major (wt. %)
Na2O n.d. a n.d.
0.02
(0.01)
0.01
(0.01)
0.02
(0.02) n.d. n.d. n.d. n.d. n.d.
MgO n.d. 0.01
(0.01) n.d.
0.01
(0.01)
0.01
(0.01)
0.01
(0.01)
0.01
(0.01)
0.01
(0.01)
0.01
(0.01) n.d.
Al2O3 42.34
(0.37)
41.69
(0.70)
41.03
(0.39)
40.47
(0.44)
40.83
(0.24)
42.27
(0.12)
40.73
(0.28)
40.28
(0.84)
31.10
(0.69)
20.54
(1.32)
SiO2 0.01
(0.01)
0.02
(0.01)
1.00
(0.05)
0.96
(0.05)
0.25
(0.03)
0.02
(0.02)
0.65
(0.03)
0.45
(0.03)
0.02
(0.01)
0.02
(0.01)
P2O5 36.66
(0.38)
36.25
(0.34)
34.59
(0.48)
35.13
(0.12)
35.82
(0.16)
36.91
(0.46)
36.39
(0.15)
35.63
(0.17)
34.38
(0.39)
32.85
(0.31)
SO2 0.12
(0.01)
0.34
(0.01)
0.49
(0.04)
0.13
(0.01)
0.13
(0.01)
0.27
(0.02)
0.14
(0.02)
0.14
(0.01)
0.43
(0.02)
0.76
(0.05)
K2O 0.05
(0.01)
0.07
(0.01)
0.08
(0.01)
0.06
(0.01)
0.04
(0.01)
0.06
(0.01)
0.04
(0.01)
0.05
(0.01)
0.08
(0.01)
0.06
(0.01)
CaO 0.04
(0.01)
0.02
(0.01)
0.23
(0.01)
0.17
(0.01)
0.20
(0.01)
0.04
(0.01)
0.08
(0.01)
0.09
(0.01)
0.09
(0.01)
0.01
(0.01)
TiO2 0.01
(0.01)
0.06
(0.02)
0.01
(0.01) n.d.
0.01
(0.01)
0.02
(0.01)
0.01
(0.01)
0.01
(0.01)
0.01
(0.01)
0.05
(0.01)
Cr2O3 0.03
(0.02)
0.01
(0.01)
0.16
(0.02)
0.01
(0.01)
0.09
(0.01)
0.02
(0.01)
0.01
(0.02)
0.02
(0.01)
0.01
(0.01)
0.01
(0.01)
Fe2O3 0.49
(0.03)
0.77
(0.03)
1.27
(0.06)
1.95
(0.07)
2.19
(0.27)
2.25
(0.13)
2.57
(0.14)
3.64
(0.21)
15.40
(0.77)
28.25
(2.09)
CuO 8.27
(0.20)
9.08
(0.11)
8.78
(0.05)
9.18
(0.05)
7.34
(0.45)
8.69
(0.19)
9.72
(0.15)
9.32
(0.13)
8.16
(0.17)
7.03
(0.42)
ZnO 0.17
(0.02)
0.01
(0.02)
0.30
(0.03)
0.22
(0.05)
1.98
(0.44)
0.46
(0.05)
0.03
(0.02)
0.06
(0.04)
0.09
(0.03)
0.01
(0.02)
H2O b
11.79
(0.47)
11.63
(0.71)
12.00
(0.58)
11.65
(0.63)
11.05
(0.39)
8.92
(0.88)
9.58
(0.51)
10.25
(0.89)
10.17
(0.79)
10.39
(0.75)
Isotopes (‰)
δDVSM
OW n.a. -76 n.a. n.a. n.a. -100 -116 -120 -103 n.a.
δ65
CuN
IST 976 2.10 7.30 13.64
5.64 13.31 n.a. n.a. n.a. n.a.
1.11
a n.d. = not detected
b calculated by difference
c n.a. = not analyzed

ACC
EPTE
D M
ANU
SCR
IPT
ACCEPTED MANUSCRIPT
Table 3. Hydrogen isotopes instrumental mass fractionation for turquoise standards.
Fe (at.
%)
H (at.
%)
Fe0.0
4/H
δ
D
(
‰
)
G
S-
M
Sa
D/H
GS-
MS
D/H
SIM
S
1σ
int
1σ
ext
αSIM
S
1σ δD
IMF
(‰
)
1
σ
(
‰
)
Mar 27 2013
SB
-1
0.16
(0.01)
21.35
(1.01)
0.04
35
-
7
6
1.43
92E-
04
6.00
80E-
05
1.8
0E-
07
2.2
4E-
07
0.41
744
1.56
E-03
-
58
3 2
K
G-
1
0.50
(0.04)
17.35
(1.36)
0.05
61
-
1
0
0
1.40
18E-
04
6.09
15E-
05
1.8
3E-
07
3.9
2E-
07
0.43
453
2.80
E-03
-
56
5 3
R
Y-
1
0.56
(0.03)
18.46
(0.77)
0.05
29
-
1
1
6
1.37
69E-
04
5.82
42E-
05
1.8
9E-
07
4.4
6E-
07
0.42
298
3.24
E-03
-
57
7 3
R
Y-
2
0.78
(0.05)
19.52
(1.32)
0.05
07
-
1
2
0
1.37
07E-
04
5.75
34E-
05
1.8
7E-
07
2.8
9E-
07
0.41
975
2.11
E-03
-
58
0 2
CS
-1
3.43
(0.19)
20.03
(1.24)
0.05
24
-
1
0
3
1.39
72E-
04
5.89
18E-
05
2.3
6E-
07
3.2
4E-
07
0.42
170
2.32
E-03
-
57
8 2
Mar 28 2013
SB
-1
0.16
(0.01)
21.35
(1.01)
0.04
35
-
7
6
1.43
92E-
04
6.08
54E-
05
1.8
3E-
07
2.5
5E-
07
0.42
282
1.77
E-03
-
57
7 2
K
G-
1
0.50
(0.04)
17.35
(1.36)
0.05
61
-
1
0
0
1.40
18E-
04
6.18
87E-
05
1.8
6E-
07
3.3
0E-
07
0.44
147
2.35
E-03
-
55
9 2
R
Y-
1
0.56
(0.03)
18.46
(0.77)
0.05
29
-
1
1
6
1.37
69E-
04
5.90
88E-
05
1.7
7E-
07
3.9
6E-
07
0.42
913
2.88
E-03
-
57
1 3
R
Y-
2
0.78
(0.05)
19.52
(1.32)
0.05
07
-
1
2
0
1.37
07E-
04
5.85
17E-
05
1.7
6E-
07
2.3
2E-
07
0.42
692
1.70
E-03
-
57
3 2
CS
-1
3.43
(0.19)
20.03
(1.24)
0.05
24
-
1
1.39
72E-
6.03
31E-
1.8
1E-
6.0
0E-
0.43
181
4.30
E-03
-
56 4

ACC
EPTE
D M
ANU
SCR
IPT
ACCEPTED MANUSCRIPT
0
3
04 05 07 07 8
Mar 30 2013
SB
-1
0.16
(0.01)
21.35
(1.01)
0.04
35
-
7
6
1.43
92E-
04
6.06
46E-
05
1.8
2E-
07
4.1
1E-
07
0.42
138
2.86
E-03
-
57
9 3
K
G-
1
0.50
(0.04)
17.35
(1.36)
0.05
61
-
1
0
0
1.40
18E-
04
6.12
04E-
05
1.8
4E-
07
3.9
6E-
07
0.43
660
2.82
E-03
-
56
3 3
R
Y-
1
0.56
(0.03)
18.46
(0.77)
0.05
29
-
1
1
6
1.37
69E-
04
5.82
71E-
05
2.0
4E-
07
1.3
7E-
07
0.42
320
9.97
E-04
-
57
7 1
R
Y-
2
0.78
(0.05)
19.52
(1.32)
0.05
07
-
1
2
0
1.37
07E-
04
5.78
17E-
05
2.1
7E-
07
3.5
2E-
07
0.42
181
2.57
E-03
-
57
8 3
CS
-1
3.43
(0.19)
20.03
(1.24)
0.05
24
-
1
0
3
1.39
72E-
04
5.98
20E-
05
1.7
9E-
07
3.8
2E-
07
0.42
815
2.73
E-03
-
57
2 3
a error of GS-MS analyses = 1‰ (1σ)

ACC
EPTE
D M
ANU
SCR
IPT
ACCEPTED MANUSCRIPT
Table 4. Copper isotopes instrumental mass fractionation for turquoise standards.
Fe (at.
%)
Log(
Fe)
δ65
Cu
(‰
)
IC
P-
MS
1σ
(
‰
)
65Cu/
63Cu
ICP-
MS
65Cu/
63Cu
SIMS
1σ
int
1σ
ext
αSIM
S
1σ δ65
C
uIMF
(‰)
1
σ
(
‰
)
Feb 12 2013
VG
-1
0.10
(0.01)
-
1.00
2.1
0
0.
04
0.446
57
0.437
54
1.7
5E-
04
1.2
1E-
04
0.97
979
2.71
E-04
-
20.2
0.
3
SB-
1
0.16
(0.01)
-
0.79
7.3
0
0.
07
0.448
88
0.440
32
1.7
6E-
04
1.0
5E-
04
0.98
092
2.34
E-04
-
19.1
0.
2
KM
0.27
(0.01)
-
0.58
1.8
6
0.
01
0.446
46
0.438
12
1.7
5E-
04
1.7
6E-
04
0.98
131
3.94
E-04
-
18.7
0.
4
EC
0.41
(0.02)
-
0.39
5.6
4
0.
01
0.448
14
0.440
11
1.7
6E-
04
1.7
3E-
04
0.98
207
3.86
E-04
-
17.9
0.
4
CA
S-1
6.49
(0.58) 0.81
1.1
1
0.
02
0.446
12
0.439
73
1.4
1E-
04
1.8
7E-
04
0.98
567
4.19
E-04
-
14.3
0.
4
Feb 13 2013
VG
-1
0.10
(0.01)
-
1.00
2.1
0
0.
04
0.446
57
0.437
51
1.7
5E-
04
1.6
9E-
04
0.97
971
3.79
E-04
-
20.3
0.
4
SB-
1
0.16
(0.01)
-
0.79
7.3
0
0.
07
0.448
88
0.440
36
1.7
6E-
04
1.8
3E-
04
0.98
102
4.07
E-04
-
19.0
0.
4
KM
0.27
(0.01)
-
0.58
1.8
6
0.
01
0.446
46
0.438
07
1.7
5E-
04
7.6
5E-
05
0.98
121
1.71
E-04
-
18.8
0.
2
EC
0.41
(0.02)
-
0.39
5.6
4
0.
01
0.448
14
0.439
93
1.7
6E-
04
1.1
6E-
04
0.98
167
2.60
E-04
-
18.3
0.
3
CA
S-1
6.49
(0.58) 0.81
1.1
1
0.
02
0.446
12
0.439
82
1.3
2E-
04
3.8
2E-
05
0.98
587
8.57
E-05
-
14.1
0.
1
Feb 23 2013
VG
-1
0.10
(0.01)
-
1.00
2.1
0
0.
04
0.446
57
0.436
84
1.7
5E-
04
1.4
7E-
04
0.97
822
3.30
E-04
-
21.8
0.
3
SB-
1
0.16
(0.01)
-
0.79
7.3
0
0.
07
0.448
88
0.439
63
1.7
6E-
1.7
4E-
0.97
938
3.87
E-04
-
20.6
0.
4
ACC
EPTE
D M
ANU
SCR
IPT
ACCEPTED MANUSCRIPT
04 04
KM
0.27
(0.01)
-
0.58
1.8
6
0.
01
0.446
46
0.437
39
1.7
5E-
04
9.5
7E-
05
0.97
968
2.14
E-04
-
20.3
0.
2
EC
0.41
(0.02)
-
0.39
5.6
4
0.
01
0.448
14
0.439
36
1.7
6E-
04
1.7
2E-
04
0.98
040
3.84
E-04
-
19.6
0.
4
CA
S-1
6.49
(0.58) 0.81
1.1
1
0.
02
0.446
12
0.439
12
1.4
1E-
04
1.6
6E-
04
0.98
429
3.72
E-04
-
15.7
0.
4

ACC
EPTE
D M
ANU
SCR
IPT
ACCEPTED MANUSCRIPT
Table 5. Coefficients a, b and c and R2
values for the fit δDIMF = aexp(bFe0.04
/H)+c,
with Fe and H in at. %.
Session a b c R2
Mar 27 2013 2.3736 10-8
364.08 -582.76 0.99952
Mar 28 2013 1.5491 10-5
250.48 -577.98 0.96522
Mar 30 2013 3.3865 10-9
396.83 -578.9 0.88843

ACC
EPTE
D M
ANU
SCR
IPT
ACCEPTED MANUSCRIPT
Table 6. Comparison between GS-MS and SIMS hydrogen isotopic results for
turquoise standards.
a Calculated using the correction schemes given in Table 5
δDGS-MS
(‰)
1σ
(‰)
δDSIMSa (‰)
Mar 27
2013
1σ
(‰)
δDSIMSa (‰)
Mar 28
2013
1σ
(‰)
δDSIMSa (‰)
Mar 30
2013
1σ
(‰)
SB-1 -76 -76 3 -76 4 -76 6
KG-1 -100 -100 6 -100 5 -100 6
RY-1 -116 -116 7 -120 6 -121 2
RY-2 -120 -120 4 -120 3 -122 5
CS-1 -103 -103 5 -99 9 -96 6

ACC
EPTE
D M
ANU
SCR
IPT
ACCEPTED MANUSCRIPT
Table 7. Coefficients a and b and R2
values for the linear regression δ65
CuIMF =
aLog(Fe)+b, with Fe in at. %.
Session a b R2
Feb 12 2013 3.1425 -16.825 0.9929
Feb 13 2013 3.2738 -16.828 0.9864
Feb 23 2013 3.2541 -18.342 0.9934

ACC
EPTE
D M
ANU
SCR
IPT
ACCEPTED MANUSCRIPT
Table 8. Comparison between ICP-MS and SIMS copper isotopic results for turquoise
standards.
a Calculated using the correction schemes given in Table 7
δ65
CuICP-MS
(‰)
1σ
(‰)
δ65
CuSIMSa
(‰)
Feb 12
2013
1σ
(‰)
δ65
CuSIMSa
(‰)
Feb 13
2013
1σ
(‰)
δ65
CuSIMSa
(‰)
Feb 23
2013
1σ
(‰)
VG-1 2.10 0.04 1.8 0.3 1.9 0.4 1.9 0.3
SB-1 7.30 0.07 7.5 0.2 7.8 0.4 7.6 0.4
KM 1.86 0.01 1.8 0.4 1.8 0.2 1.7 0.2
EC 5.64 0.01 5.8 0.4 5.4 0.3 5.7 0.4
CAS-1 1.11 0.02 1.0 0.4 1.2 0.1 1.1 0.4