hydrogen and fuel cell activities - us department of energy · 2011-11-02 · hydrogen and fuel...
TRANSCRIPT

Hydrogen and Fuel Cell Activities
Mr. Pete Devlin U.S. Department of Energy
Fuel Cell Technologies Program Market Transformation Manager

Stationary Fuel Cell Applications
First National Bank of Omaha Omaha, Nebraska
Assured Power
Off-Grid Power
4 Times Square New York, New York
Indoor Green Power / Cogeneration
Wastewater treatment plants New York, New York
Renewable Fuel (ADG)
On-Line Critical Power
Verizon Garden City, New York
Central Park Police Station, New York, New York
Variety of stationary fuel cell applications highlight positive market potential.
2

Data Centers Are A Good Fit Multiple Uses for FC Energy
Streams
• Power – Lighting – Air conditioning
• Thermal Energy – Adsorption A/C
• Supplements electric chillers
– Thermal reduces electricity consumption
– Reduces grid CO2 generation
– Space and water heating – Desiccant dehumidification
3
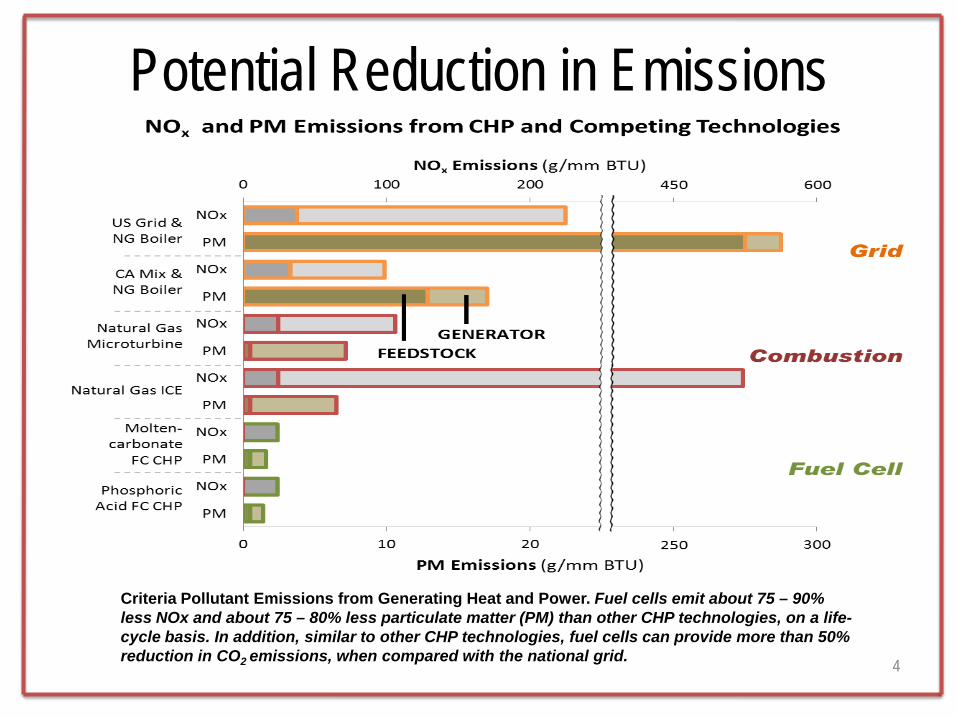
Criteria Pollutant Emissions from Generating Heat and Power. Fuel cells emit about 75 – 90% less NOx and about 75 – 80% less particulate matter (PM) than other CHP technologies, on a life-cycle basis. In addition, similar to other CHP technologies, fuel cells can provide more than 50% reduction in CO2 emissions, when compared with the national grid.
Potential Reduction in Emissions
4

Fuel cells use an efficient electrochemical process to generate electricity and heat, with low or zero emissions, offering benefits in a wide range of applications.
Types of Fuel Cells • Polymer Electrolyte Membrane (PEMFC)
• Pros: Low-temperature operation, quick start, and high power density
• Cons: Expensive catalysts • Applications: Stationary generation, specialty vehicles,
transportation, portable power • Phosphoric Acid Fuel Cell (PAFC)
• Pros: Low-temperature operation and high efficiency • Cons: Low current and power density • Applications: Distributed generation
• Alkaline Fuel Cell (AFC) • Pros: Low temperature operation and high efficiency • Cons: Expensive impurity removal • Applications: Military and space
• Solid Oxide Fuel Cell (SOFC) • Pros: High efficiency, multiple fuel feedstocks, usable
waste heat, and inexpensive catalysts • Cons: Slow start-up and corrosion issues • Applications: Auxiliary Power Units (APUs) and
distributed generation • Molten Carbonate Fuel Cell (MCFC)
• Pros: High efficiency, multiple fuel feedstocks, and usable waste heat
• Cons: Slow start-up and corrosion issues • Applications: Electric utility

0
10
20
30
40
50
60
70
2008 2009 2010
Total Megawatts Shipped Worldwide for Stationary Fuel Cells*
Year
Mega
watt
Source: 2011 Pike Research Preliminary Analysis

Typical Efficiency
0%
10%
20%
30%
40%
50%
60%
70%
SteamTurbine
Recip.Engine
GasTurbine
Micro-Turbine
Fuel Cell
Typi
cal E
lect
rical
Effi
cien
cy (H
HV)
Fuel Cells vs. Combustion
Fuel cells are not heat engines, so their efficiency can exceed the Carnot efficiency
Fuel cells convert chemical energy directly into electrical energy, bypassing inefficiencies associated with thermal energy conversion. The available energy is equal to the Gibbs free energy.
Conventional engines and turbines convert chemical energy into thermal energy prior to conversion to electrical energy. The efficiency of converting thermal energy to electrical energy is bounded by the Carnot efficiency.
Source: EPA, Catalog of CHP Technologies, December 2008
Adapted from Larminie and Dicks, Fuel Cell Systems Explained, 2000

Analysis efforts are underway, to provide information on potential costs and benefits of a variety of stationary fuel cell applications.
Example: Cost of Electricity from Commercial-Scale Stationary Fuel Cell
8 9 10 11 12 13 14
% Equity Financing(54%, 100%)
Federal Incentive(30%, 0% of cap cost)
Stack Life (3, 5, 7 yrs)
After-TaxReal IRR(3%, 5%, 15%)
Installed FC Cost(3, 3.8, 4.5 k-$/kW)
Heat Utilization(80, 50, 0%)
NG Cost(5, 9, 11 $/MMBTU)
Cost of Electricity (¢/kWh)
80% 50%
3.8
0%
9
5%
5
0
54%
3.0 4.5
5 11
3% 15%
7 3
30%
100%
Performance ParametersSystem Electric Efficiency = 45% (LHV Basis)System Total Efficiency = 77% (LHV Basis)System Size = 1,400 kWSystem Life = 20 yearsCapital cost = $3.5 millionInstalled cost = $5.3 million
Operation AssumptionsSystem utilization factor = 95% Restacking cost = 30% of installed cap. costHeat value = cost of displaced natural gas from
80% efficient device
Financial AssumptionsStartup year = 2010Financing = 54% equityInterest rate = 7% Financing period = 20 yearsAfter-tax Real IRR = 5%Inflation rate = 1.9%Total tax rates = 38.9%Depreciation schedule = 7 years (MACRS)Payback period = 11 yearsStack replacement cost distributed annually
Source: NREL Fuel Cell Power Model
Example for MCFC 1.4 MW
Stationary Fuel Cells – Cost Analysis
8

Residential Electric$/KwH
$0.118 to $0.179 (8)$0.096 to $0.118 (6)$0.086 to $0.096 (6)$0.083 to $0.086 (5)$0.082 to $0.083 (1)$0.077 to $0.082 (10)$0.071 to $0.077 (8)$0.06 to $0.071 (7)
Assessing the Potential for Micro CHP Natural Gas Cost ($/kWh)
WYOMING $ 0.029
ALASKA $ 0.030
UTAH $ 0.032
COLORADO $ 0.035
MONTANA $ 0.038
NORTH DAKOTA $ 0.039
IDAHO $ 0.040
SOUTH DAKOTA $ 0.040
NEW MEXICO $ 0.042
CALIFORNIA $ 0.042
Energy Price Ratio ALASKA 5.03
CALIFORNIA 3.47
CONNECTICUT 3.33
NEW YORK 3.23
NEW JERSEY 3.03
MASSACHUSETTS 2.88
WYOMING 2.80
COLORADO 2.75
UTAH 2.70
TEXAS 2.68
Electricity Cost ($/kWh) HAWAII $ 0.235
CONNECTICUT $ 0.194
NEW YORK $ 0.181
MASSACHUSETTS $ 0.165
NEW JERSEY $ 0.159
ALASKA $ 0.153
MAINE $ 0.151
NEW HAMPSHIRE $ 0.150
CALIFORNIA $ 0.146
VERMONT $ 0.146
Price of electricity -----------------
Price of natural gas
Inexpensive Natural Gas Expensive Electricity
Natural Gas Prices Electricity Prices
9

CERL Emergency Backup Deployments • Objectives, Goals, and Background of Joint Efforts
– Bundle emergency backup power needs across multiple DOD and NASA sites to realize price reductions on a per site basis to demonstrate the advantages of fuel cells over incumbent technologies, which include:
• Longer continuous run-time and greater durability than batteries (fuel cells will last 15 years or more, depending on actual use)
• Require less maintenance than batteries or generators • Monitored remotely • Nearly 25% reduction in lifecycle costs for a 5-kW, 52-hour
backup-power system**
– Project funded by DOE and managed by Army CERL.
• Results to Date – Project awarded, installations will roll out over the next 12
months across 9 sites and installing over 40 units producing over 220kW of power,
• Next Steps – Collect operation data to facilitate future bundled
deployments.
9 Sites Chosen: • U.S Army Aberdeen Proving Ground,
MD • U.S. Army Fort Bragg, NC • U.S. Army Fort Hood, TX • U.S. Army National Guard, OH • U.S. Army Picatinny Arsenal, NJ • NASA Ames Research Center, CA • USMC AGGC 29 Palms, CA (2 Buildings) • U.S. Military Academy West Point, NY • U.S. Air Force Cheyenne Mountain Air Station
10

MicroCHP costs are becoming competitive with grid power and ROIs are estimated at under 5 yrs. Deployments will target areas where a business case can be made with pay back periods which meet industry needs. • Next Steps
– Review proposals and make awards
– Gather material performance data.
– “Real world” evaluation operations and testing of equipment.
Project Details Up to 50 units 5 kW units
Prove business case for MicroCHP applications
Micro CHP
11
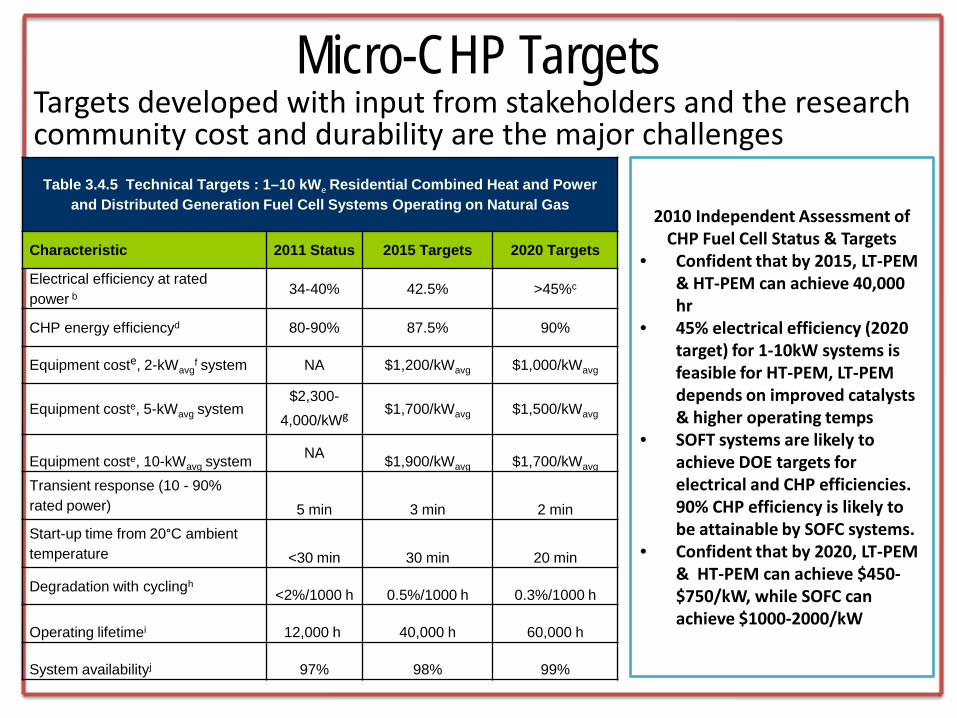
Micro-CHP Targets Targets developed with input from stakeholders and the research community cost and durability are the major challenges
2010 Independent Assessment of CHP Fuel Cell Status & Targets
• Confident that by 2015, LT-PEM & HT-PEM can achieve 40,000 hr
• 45% electrical efficiency (2020 target) for 1-10kW systems is feasible for HT-PEM, LT-PEM depends on improved catalysts & higher operating temps
• SOFT systems are likely to achieve DOE targets for electrical and CHP efficiencies. 90% CHP efficiency is likely to be attainable by SOFC systems.
• Confident that by 2020, LT-PEM & HT-PEM can achieve $450-$750/kW, while SOFC can achieve $1000-2000/kW
Table 3.4.5 Technical Targets : 1–10 kWe Residential Combined Heat and Power and Distributed Generation Fuel Cell Systems Operating on Natural Gas
Characteristic 2011 Status 2015 Targets 2020 Targets
Electrical efficiency at rated power b
34-40% 42.5% >45%c
CHP energy efficiencyd 80-90% 87.5% 90%
Equipment coste, 2-kWavgf system NA $1,200/kWavg $1,000/kWavg
Equipment coste, 5-kWavg system $2,300-
4,000/kWg $1,700/kWavg $1,500/kWavg
Equipment coste, 10-kWavg system NA $1,900/kWavg $1,700/kWavg
Transient response (10 - 90% rated power) 5 min 3 min 2 min
Start-up time from 20°C ambient temperature <30 min 30 min 20 min
Degradation with cyclingh <2%/1000 h 0.5%/1000 h 0.3%/1000 h
Operating lifetimei 12,000 h 40,000 h 60,000 h
System availabilityj 97% 98% 99%

• 12.4 million MT per year of methane is available from landfills in the U.S.
• ~50% of this resource could provide ~8 million kg/day of hydrogen.
SOURCE: Wastewater Treatment, could provide enough H2 to refuel 100,000 vehicles per day.
• 500,000 MT per year of methane is available from wastewater treatment plants in the U.S.
• ~50% of this resource could provide ~340,000 kg/day of hydrogen.
Background: Biogas as an Early Source of Renewable Hydrogen • The majority of biogas resources are situated near large urban centers—ideally located
near the major demand centers for hydrogen for FCEVs. • Hydrogen can be produced from this renewable resource using existing steam-
methane-reforming technology.
SOURCE: Landfills, could provide enough H2 to refuel 2–3 million vehicles/day.
13

Waste To Energy Example
Los Alamitos JFTB
Urban Compost
25 ton/day
Gasifier & Cleanup
Fuel Cells 1,600 kW
Resource potential for Los Alamitos • 300 tons/day • 19,200 kW
Urban wood waste is an abundant feedstock around the US
14
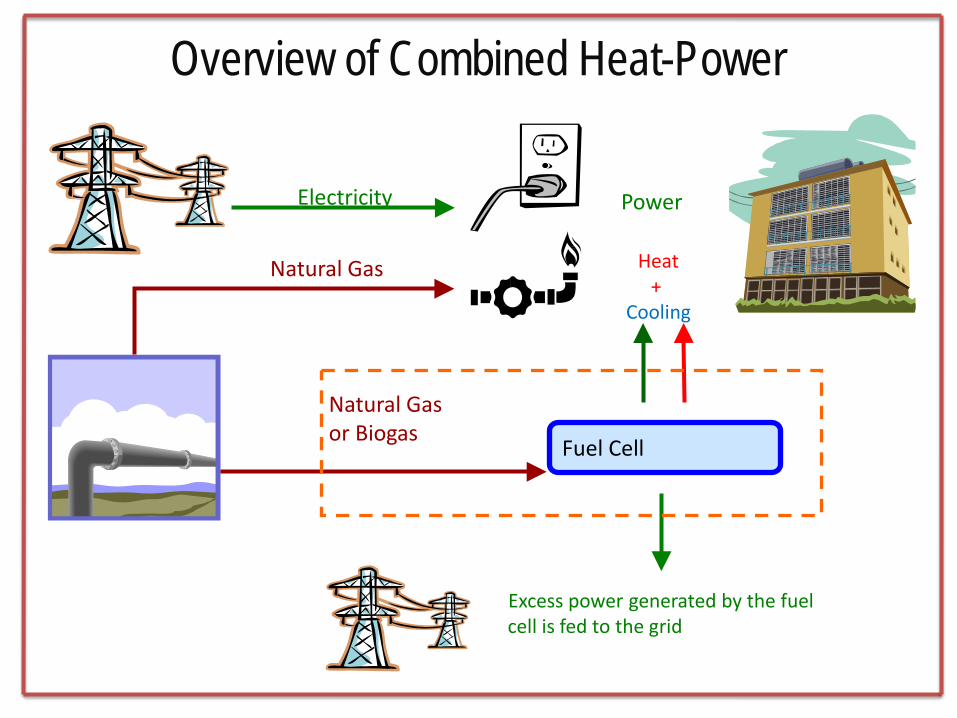
Natural Gas
Power
Heat +
Cooling
Natural Gas or Biogas Fuel Cell
Excess power generated by the fuel cell is fed to the grid
Electricity
Overview of Combined Heat-Power

Cost Goals for Fuel Cell R&D – Stationary Fuel Cell Cost-Reduction
16

Federal Policies Promoting Fuel Cells Grants for Energy Property in Lieu of Tax Credits*
Grant instead of claiming the Investment Tax Credit or Production Tax Credit. Only entities that pay taxes are eligible.
Construction must begin by expiration date, 12/31/2011.
Residential Renewable Energy Credit
30% tax credit. Raises ITC dollar cap for residential fuel cells in joint occupancy dwellings to $3,334/kW.
Expires Dec. 31, 2016.
Investment Tax Credit
30% tax credit for qualified fuel cell property or $3,000/kW of the fuel cell nameplate capacity. 10% credit for CHP-system property.
Equipment must be installed by Dec. 31, 2016.
Alternative Fuel Infrastructure Tax Credit
30% of expenditures. Expires 2/31/2014.
*Applies to fuel cell and CHP technologies
Fuel Cell Motor Vehicle Tax Credit: $4,000 for LDV, $10,000-$40,000 range for heavier vehicles. Expires 12/31/2014. Hydrogen Fuel Excise Tax Credit: $0.50/gallon. Hydrogen must be sold or used as a fuel to operate a motor vehicle. Expires 9/30/2014. Alternative Fuel Infrastructure Tax Credit: $1,000 cap for residential use. Residential Renewable Energy Credit: Fuel Cell maximum - $500/0.5kW. Fuel cells must have electricity-only generation efficiency greater than 50% and 0.5kW minimum. Residential Renewable Energy Credit: 30% tax credit. Raises ITC dollar cap for residential fuel cells in joint occupancy dwellings to $3,334/kW. Expires 12/31/2016.
17

State Policies Promoting Fuel Cells CA’s Self-Generation Incentive Program (SGIP) extends the current program for three year to 2014. SGIP provides a total of $249M of support for CHP, wind energy, waste heat recovery, and energy storage projects in CA, with in-state manufacturers getting a 20% additional incentive credit.
– CHP is eligible for $0.50/W in capital cost incentives. – Stationary fuel cells will receive $2.25/W. – Energy storage projects receive $2.00/W. – Biogas fueled projects received $2.00/W bonus.
*Applies to fuel cell and CHP technologies
Connecticut offers 100% tax exemption for Class I renewable energy systems. An exemption claim must be filed before November 1 of each applicable year.
Since 2007, South Carolina offers a 100% sales tax exemption on equipment used to produce or research hydrogen fuel cells.
Ohio’s Qualified Energy Property Tax Exemption, passed in 2010 allows for 100% property tax exemption for fuel cell systems <250kW as well as those systems >250kW, though payment in lieu of tax is required.
18

Procurement Guide This document is intended to provide federal agencies with initial guidance on how to procure energy from fuel cell combined heat and power (CHP) technology. This document is based on best practices and the experience of agency personnel and laboratory and industry collaborators.
Clear efficiency benefits with CHP
Provides clear guidance on CHP technology – its benefits, ideal usage, and financing options.
Decision tree to help assess
feasibility of CHP systems
for each unique
situation.
19
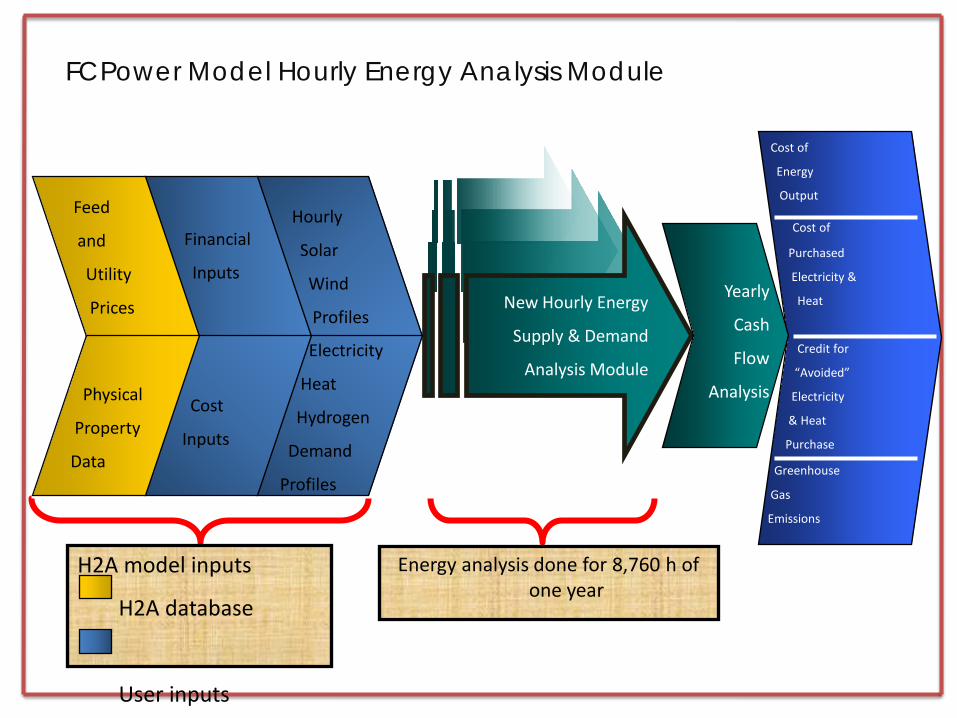
New Hourly Energy
Supply & Demand
Analysis Module
Feed
and
Utility
Prices
Physical
Property
Data
Cost
Inputs
Electricity
Heat
Hydrogen
Demand
Profiles
Hourly
Solar
Wind
Profiles Yearly
Cash
Flow
Analysis
Cost of
Energy
Output
Cost of
Purchased
Electricity &
Heat
Credit for
“Avoided”
Electricity
& Heat
Purchase
Greenhouse
Gas
Emissions
Financial
Inputs
Energy analysis done for 8,760 h of one year
H2A model inputs
H2A database
User inputs
FCPower Model Hourly Energy Analysis Module

21
LBNL
PNNL*
LLNL NTS NREL*
LANL
ANL*
ORNL* SRNL
TJNAF
Fermi
SLAC
* FY2009 Feasibility
Study
SNL

Example of ITC Benefit to a Fuel Cell Project
*http://www1.eere.energy.gov/hydrogenandfuelcells/pdfs/fuel_cell_financing_fact_sheet.pdf

Education & Outreach Collaborations with universities, governments,
and industry help to educate the public about H2 and fuel cells.
Thank you
For more information, please contact
hydrogenandfuelcells.energy.gov