hydrogen capacity and absorption rate of the saes...
TRANSCRIPT

SANDIA REPORT SAND2010-5402 Unlimited Release Printed August 2010
Hydrogen Capacity and Absorption Rate of the SAES St707TM Non-Evaporable Getter at Various Temperatures Irving Hsu and Bernice E. Mills Prepared by Sandia National Laboratories Albuquerque, New Mexico 87185 and Livermore, California 94550
Sandia National Laboratories is a multi-program laboratory managed and operated by Sandia Corporation, a wholly owned subsidiary of Lockheed Martin Corporation, for the U.S. Department of Energy’s National Nuclear Security Administration under Contract DE-AC04-94AL85000.
Approved for public release; further dissemination unlimited.

2
Issued by Sandia National Laboratories, operated for the United States Department of Energy by Sandia Corporation. NOTICE: This report was prepared as an account of work sponsored by an agency of the United States Government. Neither the United States Government, nor any agency thereof, nor any of their employees, nor any of their contractors, subcontractors, or their employees, make any warranty, express or implied, or assume any legal liability or responsibility for the accuracy, completeness, or usefulness of any information, apparatus, product, or process disclosed, or represent that its use would not infringe privately owned rights. Reference herein to any specific commercial product, process, or service by trade name, trademark, manufacturer, or otherwise, does not necessarily constitute or imply its endorsement, recommendation, or favoring by the United States Government, any agency thereof, or any of their contractors or subcontractors. The views and opinions expressed herein do not necessarily state or reflect those of the United States Government, any agency thereof, or any of their contractors. Printed in the United States of America. This report has been reproduced directly from the best available copy. Available to DOE and DOE contractors from U.S. Department of Energy Office of Scientific and Technical Information P.O. Box 62 Oak Ridge, TN 37831 Telephone: (865) 576-8401 Facsimile: (865) 576-5728 E-Mail: [email protected] Online ordering: http://www.osti.gov/bridge Available to the public from U.S. Department of Commerce National Technical Information Service 5285 Port Royal Rd. Springfield, VA 22161 Telephone: (800) 553-6847 Facsimile: (703) 605-6900 E-Mail: [email protected] Online order: http://www.ntis.gov/help/ordermethods.asp?loc=7-4-0#online

3
SAND2010-5402 Unlimited Release
Printed August 2010
Hydrogen Capacity and Absorption Rate of the SAES St707TM Non-Evaporable Getter at Various
Temperatures
Irving Hsu and Bernice E. Mills Materials Chemistry Department, 8223
Sandia National Laboratories P.O. Box 969, MS9403
Livermore, California 94550
Abstract: A prototype of a tritium thermoelectric generator (TTG) is currently being developed at Sandia. In the TTG, a vacuum jacket reduces the amount of heat lost from the high temperature source via convection. However, outgassing presents challenges to maintaining a vacuum for many years. Getters are chemically active substances that scavenge residual gases in a vacuum system. In order to maintain the vacuum jacket at approximately 1.0×10⁻⁴ torr for decades, non-evaporable getters that can operate from -55ºC to 60ºC are going to be used. This paper focuses on the hydrogen capacity and absorption rate of the St707TM non-evaporable getter by SAES. Using a getter testing manifold, we have carried out experiments to test these characteristics of the getter over the temperature range of -77ºC to 60ºC. The results from this study can be used to size the getter appropriately.

4
This page intentionally left blank.

5
Table of Contents:
ABSTRACT .................................................................................................................................... 3
LIST OF FIGURES ........................................................................................................................ 7
INTRODUCTION .......................................................................................................................... 9
EXPERIMENTAL ........................................................................................................................ 11
Getter Activation ........................................................................................................................ 11
Hydrogen Capacity Testing ....................................................................................................... 11
Obtaining Different Temperatures ............................................................................................. 13
RESULTS ..................................................................................................................................... 15
Analysis of Temperature and Pressure ...................................................................................... 21
CONCLUSIONS........................................................................................................................... 25
REFERENCES ............................................................................................................................. 27
DISTRIBUTION........................................................................................................................... 28

6
This page intentionally left blank.

7
List of Figures:
Figure 1. Prototype of the tritium thermoelectric generator. .......................................................... 9
Figure 2. Schematic of getter activation setup. The railing allows for the position of the reaction vessel inside the furnace to be adjusted. ................................................................................ 11
Figure 3. A photograph of the getter testing manifold with pressure transducers, valves, and designated volumes A-E indicated. ....................................................................................... 12
Figure 4. Schematic of getter testing manifold. ............................................................................ 13
Figure 5. Comparison of pressure change over time for each trial in the -77ºC experiment. ....... 16
Figure 6. Comparison of pressure change over time for each trial in the 60ºC experiment. ........ 17
Figure 7. Comparison of pressure change over time for each trial in the 20ºC experiment. ........ 19
Figure 8. Comparison of the time taken to pump down to 0.01 torr for each temperature at which the getter was tested. .............................................................................................................. 20
Figure 9. Comparison of the pressure at 1 minute for each experiment. ...................................... 21
Figure 10. Relationship between temperature and pressure from cooling the getter after the 60ºC experiment. ............................................................................................................................ 22
Figure 11. Relationship between temperature and pressure from the getter warming to room temperature after the -77ºC experiment. ................................................................................ 22
Figure 12. Leica M420 optical microscope images of unhydrided (left) and hydrided getter (right). .................................................................................................................................... 23
List of Tables:
Table 1. Hydrogen capacity and pressure data for each trial at -77ºC. ......................................... 15
Table 2. Hydrogen capacity and pressure data for each trial at 60ºC. .......................................... 17
Table 3. Hydrogen capacity and pressure data for each trial at 20ºC. .......................................... 18
Table 4. Summary of hydrogen capacity of getter across all experiments. .................................. 25

8
This page intentionally left blank.

9
Introduction: Sandia is developing a thermoelectric generator that uses tritium as the heat source. A vacuum is used to minimize heat loss from the source through convection. In high-vacuum environments, residual gases can accumulate as a result of outgassing. A getter is a chemically active substance which scavenges any traces of impurities in a vacuum system [1-3]. To maintain a vacuum of approximately 1.0×10⁻⁴ torr over many years, a non-evaporable getter is used. Non-evaporable getters require no power during use. In the tritium thermoelectric generator (TTG), the getter is required to operate from -55ºC to 60ºC. A prototype of the TTG is shown in Figure 1 [4]. In order for the getter to be activated at a high temperature, it is placed in a remote location from the main body of the TTG. The goal of our study is to measure the absorption capacity of the St707 TM non-evaporable getter at temperatures between -77ºC and 60ºC. This will allow us to approximate the amount of getter required to sustain the vacuum in the TTG. At the same time, these tests will enable us to determine the gettering rate.
Figure 1. Prototype of the tritium thermoelectric generator. The St707TM non-evaporable getter is a ternary alloy Zr57V36Fe7 composed of 70% Zirconium, 24.6% Vanadium, and 5.4% Iron by weight [5, 6]. This getter type was chosen because of its ability to operate at room temperature. Since hydrogen is one of the most abundant residual gases in vacuum systems [7], we have tested the St707TM non-evaporable getter for both its capacity and absorption rate for hydrogen over the temperature range of -77ºC to 60ºC. The results of our study can be used to estimate the amount of getter required to sustain a high vacuum for decades.
Heat Source Bottle
Getter Location Vacuum Jacket

10
This page intentionally left blank.

11
Furnace
Reaction Vessel Railing
Experimental: Getter Activation Before the getter can be tested for gas absorption, it must be activated. A non-evaporable getter has a protective passivation layer that is produced during its manufacture. In the activation process, the passivation layer dissolves into the bulk of the getter, exposing the surface of the getter and making gas sorption possible. The getter was placed in a stainless steel reaction vessel. The steel reactor has a valve that allows the sample to be isolated from the surrounding environment. Both the reactor and the valve have conflat mini flanges sealed with a copper gasket. To measure the temperature of the sample, a Type-K thermocouple was spot-welded to the side of the vessel. Using a turbomolecular pump (Pfeiffer Vacuum TCM 180), the reaction vessel was first evacuated. Then, the reactor was inserted so that the getter was in the center of the furnace. The getter was baked at 200ºC for two to three days. The set point of the furnace was then raised to 400ºC, and the sample was kept at this temperature for 45 minutes for activation. The setup of the activation process is shown in Figure 2. Pressure and temperature data were acquired using the WorkBench PCTM program by Omega Engineering, Inc. After activation, the sample is transferred under vacuum to the getter testing manifold.
Figure 2. Schematic of getter activation setup. The railing allows for the position of the reaction vessel inside the furnace to be adjusted.
Hydrogen Capacity Testing The basic apparatus used to test getters was designed and built at Sandia [8]. The manifold consists of both manual and pneumatic valves, and is shown as a photograph in Figure 3 and as a schematic in Figure 4. The pneumatic valves are controlled by computer-activated solenoids, and are labeled as 7 and 8 in the schematic. In Figures 3 and 4, the volumes shown are designated as A through E and are 102.5 mL, 3.9 mL, 13.0 mL, 20.8 mL, and 38.3 mL respectively. The manifold is equipped with both a turbomolecular pump and a separate roughing pump. The pressure readings were initially taken using 10 torr and 1000 torr Baratron® pressure transducers, both of which were manufactured by MKS Instruments, Inc. These transducers were used for the

12
tests run at -77ºC and 60ºC. For the experiment run at 20ºC (room temperature), additional 1 torr and 0.02 torr pressure transducers were installed at Volume D on the getter manifold for a greater degree of accuracy. This allows for further pressure readings to be taken even after the 10 torr and 1000 torr transducers have reached their lower limits. Each time a change was made to the system, the affected volumes were re-measured. These new values were then incorporated in the calculations for the quantity of hydrogen absorbed at the different temperatures. For all of the experiments, pressure and temperature data were recorded using the LabVIEWTM 6i data acquisition program. The St707TM non-evaporable getter samples we used had a diameter of 0.396 inches, a height of 0.125 inches, and a mass of approximately 1.19 grams. To test the hydrogen uptake capacity of the getter, the steel reaction vessel (Volume E) containing the sample was attached to the manifold. The manifold was first evacuated and flushed with hydrogen. 99.99999% pure hydrogen gas was produced with a hydrogen generator by Parker Analytical Gas Systems. For each of the different temperatures at which the getter was tested, multiple trials were carried out. For each trial, Valve 7 was kept closed while Volumes A through C were filled with ~18 std cm3 hydrogen. The gas was then expanded into Volume D and given time to equilibrate. Finally, Valve 6 was opened, initiating the absorption of hydrogen by the getter in the vessel.
Figure 3. A photograph of the getter testing manifold with pressure transducers, valves, and designated volumes A-E indicated.

13
Figure 4. Schematic of getter testing manifold. Obtaining Different Temperatures Different methods were used to obtain the temperatures at which the tests were conducted. For 60ºC, a heating mantle was laced around the reaction vessel to apply heat to the container. A Type-K thermocouple was placed between the mantle and the vessel, and the set point of the heating mantle was adjusted to the desired temperature. The amount of heat applied by the mantle was based on the reading given by the thermocouple. Originally, an attempt was made to create a slush bath at -55ºC using a mixture of m-xylene and o-xylene. Although we could achieve -55ºC, it was not possible to maintain a stable temperature for an extended period of time. Therefore, it was decided to use dry ice in acetone, a mixture at the sublimation temperature of CO2 with the acetone remaining in liquid form at all times. By submerging the reaction vessel in a Dewar containing dry ice and 250 mL acetone, a temperature of -77ºC could be achieved. Pellets of dry ice were periodically added to maintain the temperature.
Rea
ctor
Rea
ctor
H2
Gen
era
tor
Res
ervo
ir
Rea
ctio
n V
esse
l
Roughing Pump
Turbo Pump
Manual Valve
Pneumatic Valve
In-Line Regulator
Pressure Transducer
7 8
1
23
4
5
6
10
A
B
E
C
D

14
This page intentionally left blank.

15
Results: The hydrogen capacity of the St707TM non-evaporable getter was tested at -77ºC, 20ºC, and 60ºC. A total of four experiments were performed, including a preliminary experiment carried out at room temperature (20ºC). In the preliminary test, 223.4 std cm3/g hydrogen was taken up, and the final stabilized pressure was 397.2 torr. These values provided an overall indication of the quantity of hydrogen that can be absorbed by the getter. For each of the subsequent tests, multiple trials using aliquots of approximately 18 std cm3 hydrogen were carried out. Each trial was terminated when the pressure in the manifold stabilized. The experiments at -77ºC, 20ºC, and 60ºC were terminated at pressures of 13.9 torr, 16.2 torr, and 0.314 torr, respectively. A summary of the results of each trial at -77ºC is shown in Table 1. The hydrogen capacity is given in std cm3/g. To determine the std cm3 of each trial, the number of moles of hydrogen absorbed was used along with the values of STP (Standard Temperature and Pressure) set by the National Institute of Standards and Technology (NIST). For STP, NIST uses a temperature of 293.15 K and an absolute pressure of 1 atm. The capacity is also given in moles of hydrogen absorbed per gram of getter. Figure 5 shows the pressure change during the first seven minutes of every trial as equilibrium is approached. This shows the initial kinetics for each trial. There is a distinct transition in rate at about 15 seconds; this transition becomes less prominent during later trials. During this experiment, the lowest pressure that could be measured was with a 10 torr Baratron® pressure transducer, which cannot reliably make measurements at the smallest pressure indicated in Figure 5.
Table 1. Hydrogen capacity and pressure data for each trial at -77ºC.
Trial H2 Capacity (std cm3/g)
Cumulative H2 Capacity (std cm3/g)
Cumulative Mol H2/g
Pressure at 1 Minute (torr)
Time Taken to Reach 0.01 Torr
(min)
1 14.97 14.97 6.22×10⁻⁴ 0.065 2.7 2 14.99 29.96 1.24×10⁻³ 0.066 2.7 3 14.99 44.95 1.87×10⁻³ 0.071 2.8 4 14.99 59.94 2.49×10⁻³ 0.075 2.9 5 14.97 74.91 3.11×10⁻³ 0.078 3.0 6 15.00 89.91 3.74×10⁻³ 0.080 3.1 7 14.96 104.87 4.36×10⁻³ 0.080 3.3 8 14.97 119.84 4.98×10⁻³ 0.083 3.4 9 14.99 134.83 5.60×10⁻³ 0.084 3.4 10 14.99 149.82 6.22×10⁻³ 0.090 3.7 11 14.96 164.78 6.85×10⁻³ 0.099 3.7 12 14.96 179.74 7.47×10⁻³ 0.10 3.9 13 14.99 194.73 8.09×10⁻³ 0.12 4.1 14 15.01 209.74 8.71×10⁻³ 0.20 7.2 15 14.95 224.69 9.34×10⁻³ 0.62 51.7 16 13.16 237.85 9.88×10⁻³ 35.82 —

16
0.0001
0.001
0.01
0.1
1
10
100
0 1 2 3 4 5 6 7
161116
Pre
ssur
e (T
orr)
Time (Min.)
GA
11 a
llTria
ls L
egen
d I
Hsu
/BE
Mill
s 2
0100
805
Trial
Figure 5. Comparison of pressure change over time for each trial in the -77ºC experiment.
The results of each trial performed at 60ºC are summarized in Table 2. Both the pressure at 1 minute and the time taken to reach 0.01 torr gradually increased with each subsequent trial. A representation of the kinetics for the first seven minutes of each trial is shown in Figure 6. The distinct transition in absorption rate seen in the -77ºC experiment is not as evident in this case. A more asymptotic approach to equilibrium is observed.
-77ºC

17
0.0001
0.001
0.01
0.1
1
10
100
0 1 2 3 4 5 6 7
1
5
9
13
Pre
ssur
e (T
orr)
Time (Min.)
GA
09 a
llTria
ls L
egen
d
IHsu
/BE
Mill
s
2010
0805
Trial
60ºC
Table 2. Hydrogen capacity and pressure data for each trial at 60ºC.
Trial H2 Capacity (std cm3/g)
Cumulative H2 Capacity (std cm3/g)
Cumulative Mol H2/g
Pressure at 1 Minute (torr)
Time Taken to Reach 0.01 Torr (min)
1 15.06 15.06 6.26×10⁻⁴ 0.0010 0.23 2 15.06 30.12 1.25×10⁻³ 0.0025 0.34 3 15.08 45.20 1.88×10⁻³ 0.010 1.03 4 15.08 60.28 2.50×10⁻³ 0.025 1.90 5 15.08 75.36 3.13×10⁻³ 0.034 2.50 6 15.08 90.44 3.76×10⁻³ 0.042 3.10 7 15.09 105.53 4.38×10⁻³ 0.050 3.95 8 15.06 120.59 5.01×10⁻³ 0.068 4.70 9 15.09 135.68 5.64×10⁻³ 0.089 6.10 10 15.09 150.77 6.26×10⁻³ 0.11 7.50 11 15.09 165.86 6.89×10⁻³ 0.16 10.00 12 15.08 180.94 7.52×10⁻³ 0.26 — 13 15.02 195.96 8.14×10⁻³ 1.03 —
Figure 6. Comparison of pressure change over time for each trial in the 60ºC experiment.
18
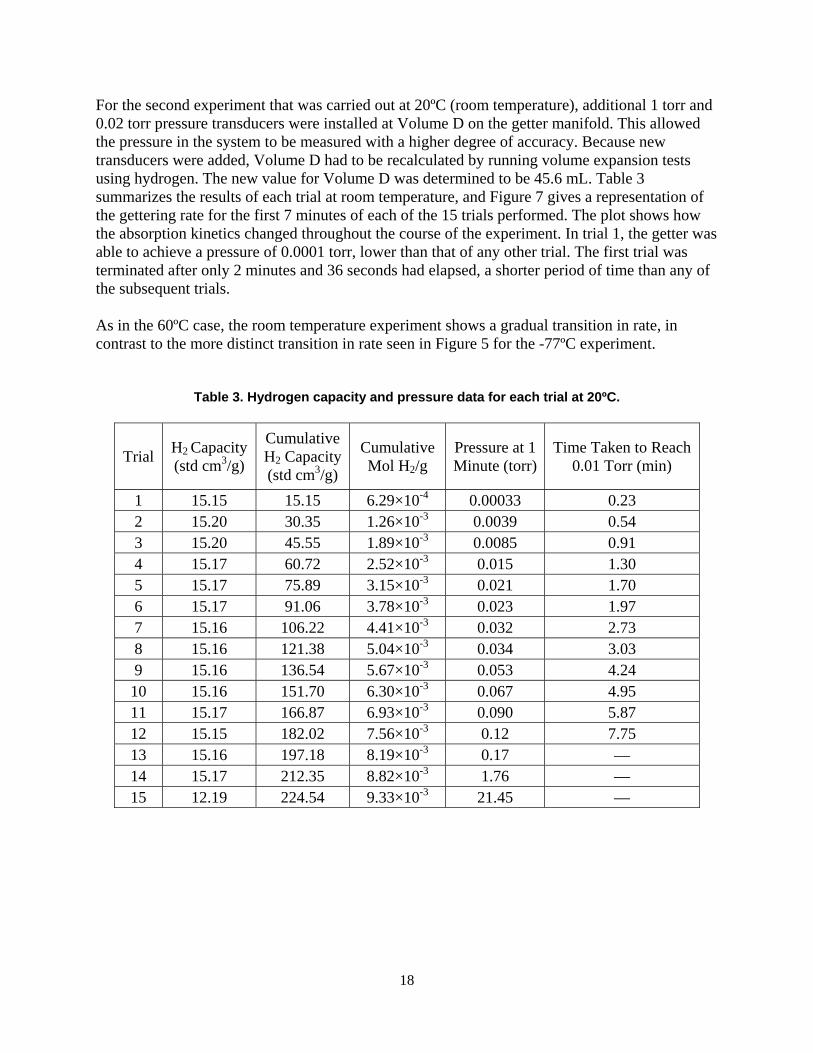
For the second experiment that was carried out at 20ºC (room temperature), additional 1 torr and 0.02 torr pressure transducers were installed at Volume D on the getter manifold. This allowed the pressure in the system to be measured with a higher degree of accuracy. Because new transducers were added, Volume D had to be recalculated by running volume expansion tests using hydrogen. The new value for Volume D was determined to be 45.6 mL. Table 3 summarizes the results of each trial at room temperature, and Figure 7 gives a representation of the gettering rate for the first 7 minutes of each of the 15 trials performed. The plot shows how the absorption kinetics changed throughout the course of the experiment. In trial 1, the getter was able to achieve a pressure of 0.0001 torr, lower than that of any other trial. The first trial was terminated after only 2 minutes and 36 seconds had elapsed, a shorter period of time than any of the subsequent trials. As in the 60ºC case, the room temperature experiment shows a gradual transition in rate, in contrast to the more distinct transition in rate seen in Figure 5 for the -77ºC experiment.
Table 3. Hydrogen capacity and pressure data for each trial at 20ºC.
Trial H2 Capacity (std cm3/g)
Cumulative H2 Capacity (std cm3/g)
Cumulative Mol H2/g
Pressure at 1 Minute (torr)
Time Taken to Reach 0.01 Torr (min)
1 15.15 15.15 6.29×10⁻⁴ 0.00033 0.23 2 15.20 30.35 1.26×10⁻³ 0.0039 0.54 3 15.20 45.55 1.89×10⁻³ 0.0085 0.91 4 15.17 60.72 2.52×10⁻³ 0.015 1.30 5 15.17 75.89 3.15×10⁻³ 0.021 1.70 6 15.17 91.06 3.78×10⁻³ 0.023 1.97 7 15.16 106.22 4.41×10⁻³ 0.032 2.73 8 15.16 121.38 5.04×10⁻³ 0.034 3.03 9 15.16 136.54 5.67×10⁻³ 0.053 4.24 10 15.16 151.70 6.30×10⁻³ 0.067 4.95 11 15.17 166.87 6.93×10⁻³ 0.090 5.87 12 15.15 182.02 7.56×10⁻³ 0.12 7.75 13 15.16 197.18 8.19×10⁻³ 0.17 — 14 15.17 212.35 8.82×10⁻³ 1.76 — 15 12.19 224.54 9.33×10⁻³ 21.45 —

19
0.0001
0.001
0.01
0.1
1
10
100
0 1 2 3 4 5 6 7
Room Temperature
151015
Pre
ssur
e (T
orr)
Time (Min.)
GA
14 a
llTri
als
Lege
nd
IHsu
/BE
Mill
s 2
0100
808
Trial
Figure 7. Comparison of pressure change over time for each trial in the 20ºC experiment. In all of the experiments, the time taken to reach 0.01 torr increased monotonically (Figure 8). On the initial trials, the getters at room temperature and 60ºC are approximately an order of magnitude faster in pumping down to 0.01 torr than the getter at -77ºC. At a cumulative total of 90 std cm3/g, the rates of the getters at 60ºC and -77ºC became identical. In comparison, the rates of the room temperature and -77ºC experiments became identical at a cumulative total of ~125 std cm3/g. After these points of intersection, the -77ºC experiment, which had previously changed little in rate, displayed faster kinetics than both the other two experiments. Furthermore, we see that after a cumulative total of 165.86 cm3/g, the 60ºC getter stopped achieving a pressure of 0.01 torr. The room temperature getter ceased to pump down to 0.01 torr after 182.02 cm3/g. In contrast, the getter tested at -77ºC is able to achieve 0.01 torr until it reaches a capacity of 224.69 std cm3/g. A similar way of visualizing the variation in rate between the different experiments and different degrees of hydriding is seen in Figure 9, where the pressure at 1 minute is plotted against the cumulative std cm3/g. The plot shows that the getters at 20ºC and 60ºC are initially able to

20
0.1
1
10
100
0 50 100 150 200 250
Time Taken to Reach 0.01 Torr, 60¡CTime Taken to Reach 0.01 Torr, RTTime Taken to Reach 0.01 Torr, -77¡C
GA
09G
A14
GA
11 T
imeT
o 01
torr
B
EM
ills/
IHsu
20
1008
08
Min
utes
achieve a lower pressure at a faster rate than the getter in the cold experiment (-77ºC). Starting from trial 9, however, the kinetics of the cold experiment surpassed the kinetics of the other two experiments. As with the time taken to reach 0.01 torr, the pressure at 1 minute for all of the temperatures at which the getter was tested shows a monotonic increase. In both Figures 8 and 9, the lines on the plots are terminated when the experiments are ended. Overall, the greatest number of trials was carried out at -77ºC, indicating that the capacity of the getter was the highest at this temperature. In general, the absorption behavior and kinetics of the room temperature experiment were more similar to those of the experiment performed at 60ºC. Both of these experiments also show a more gradual progression to equilibrium than the -77ºC experiment.
Figure 8. Comparison of the time taken to pump down to 0.01 torr for each temperature at which the getter was tested.
Cumulative Standard cm3/gram (NIST)
Time Taken to Reach 0.01 Torr, 60ºC Time Taken to Reach 0.01 Torr, RT Time Taken to Reach 0.01 Torr, -77ºC

21
0.0001
0.001
0.01
0.1
1
10
100
0 50 100 150 200 250
Pressure at 1 min, 60¡CPressure at 1 min, RTPressure at 1 min, -77¡C
Tor
r
GA
09G
A14
GA
11 P
ress
at 1
min
B
EM
ills
/IH
su
2010
0808
Figure 9. Comparison of the pressure at 1 minute for each experiment.
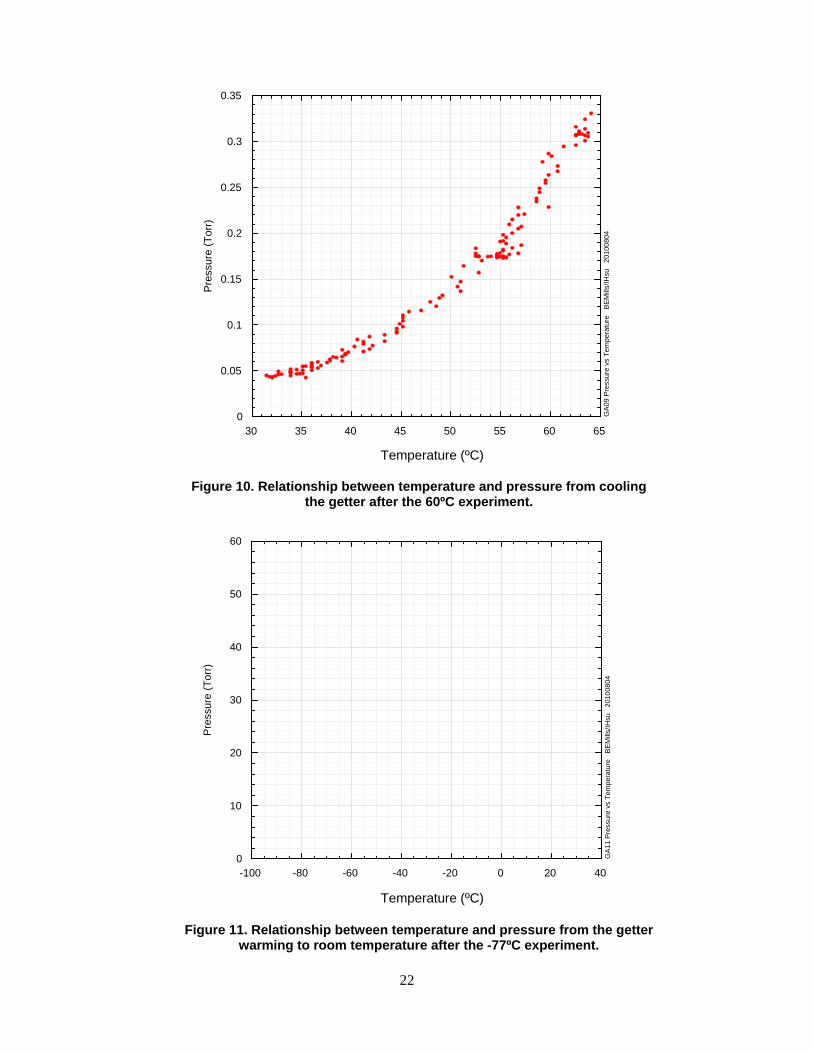
Analysis of Pressure and Temperature After completion of the -77ºC and 60ºC experiments, the getter was allowed to return to room temperature while the pressure was still being measured. For the experiment at -77ºC, the relationship between the pressure and temperature is shown in Figure 10. The relationship between the pressure and temperature for the 60ºC experiment is shown in Figure 11. The decrease in capacity at elevated temperatures is consistent with the expected change in the width of the plateaus in the PCT (pressure-composition-temperature) diagram [9] of the zirconium-hydrogen system.
Cumulative Standard cm3/gram (NIST)
Pressure at 1 min, 60ºC Pressure at 1 min, RT Pressure at 1 min, -77ºC
22
0
0.05
0.1
0.15
0.2
0.25
0.3
0.35
30 35 40 45 50 55 60 65
GA
09
Pre
ssu
re v
s T
em
pe
ratu
re
BE
Mill
s/IH
su
20
10
08
04
Pre
ssur
e (T
orr)
0
10
20
30
40
50
60
-100 -80 -60 -40 -20 0 20 40
GA
11 P
ress
ure
vs T
empe
ratu
re
BE
Mill
s/IH
su
201
0080
4
Pre
ssur
e (T
orr)
Temperature (ºC)
Temperature (ºC)
Figure 10. Relationship between temperature and pressure from cooling the getter after the 60ºC experiment.
Figure 11. Relationship between temperature and pressure from the getter
warming to room temperature after the -77ºC experiment.

23
Hydrogen reacts exothermically with zirconium to form zirconium (II) hydride. For each of the different temperatures at which the getter was tested, an increase of 1ºC was observed for the first few trials. As the getter hydrided, its density decreased [10], causing cracks to form (Figure 12). Eventually, most of the getter material crumbled into powder.
Figure 12. Leica M420 optical microscope images of unhydrided (left) and hydrided getter (right).
GA
unh
ydri
ded
BE
Mill
s/IH
su
2010
0719
GA
aft
er
hyd
ridin
g M
ont
age
B
EM
ills/
IHsu
2
010
0712

24
This page intentionally left blank.
25
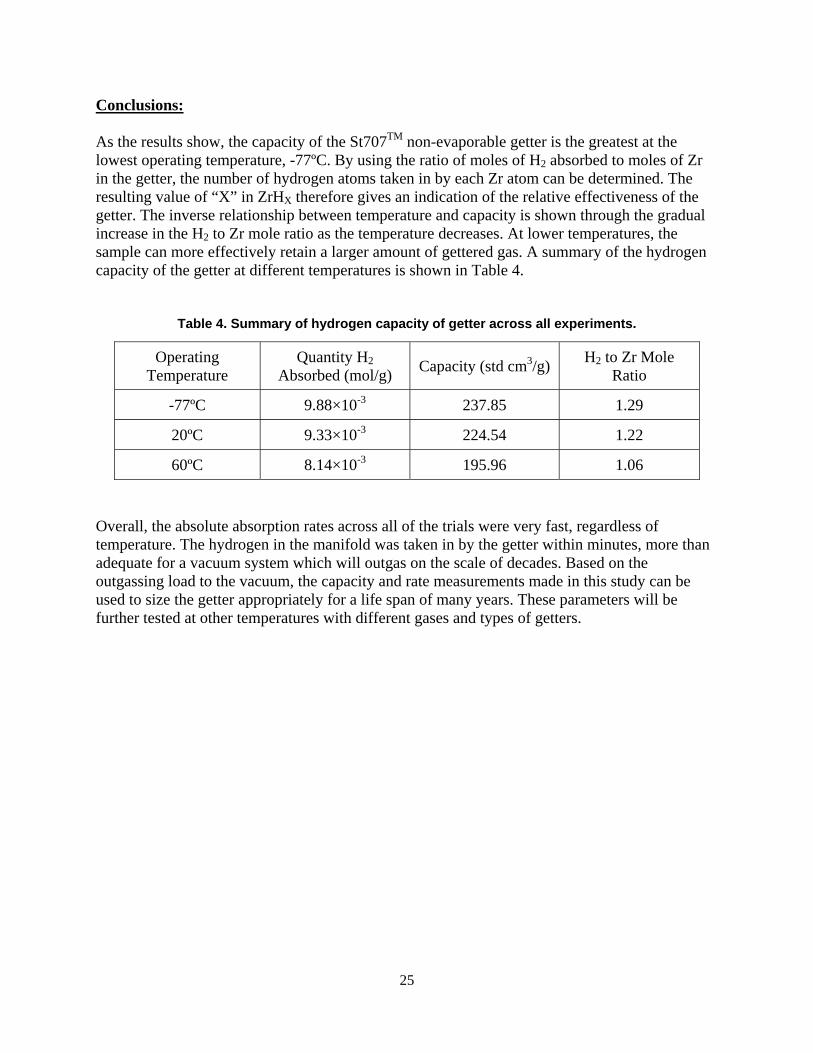
Conclusions: As the results show, the capacity of the St707TM non-evaporable getter is the greatest at the lowest operating temperature, -77ºC. By using the ratio of moles of H2 absorbed to moles of Zr in the getter, the number of hydrogen atoms taken in by each Zr atom can be determined. The resulting value of “X” in ZrHX therefore gives an indication of the relative effectiveness of the getter. The inverse relationship between temperature and capacity is shown through the gradual increase in the H2 to Zr mole ratio as the temperature decreases. At lower temperatures, the sample can more effectively retain a larger amount of gettered gas. A summary of the hydrogen capacity of the getter at different temperatures is shown in Table 4.
Table 4. Summary of hydrogen capacity of getter across all experiments.
Overall, the absolute absorption rates across all of the trials were very fast, regardless of temperature. The hydrogen in the manifold was taken in by the getter within minutes, more than adequate for a vacuum system which will outgas on the scale of decades. Based on the outgassing load to the vacuum, the capacity and rate measurements made in this study can be used to size the getter appropriately for a life span of many years. These parameters will be further tested at other temperatures with different gases and types of getters.
Operating Temperature
Quantity H2 Absorbed (mol/g)
Capacity (std cm3/g) H2 to Zr Mole
Ratio
-77ºC 9.88×10⁻³ 237.85 1.29
20ºC 9.33×10⁻³ 224.54 1.22
60ºC 8.14×10⁻³ 195.96 1.06

26
This page intentionally left blank.

27
References:
1. F. Rosebury, Handbook of Electron Tube and Vacuum Techniques. American Institute of Physics, New York, 1993.
2. V. Nemanic, M. Zumer, and B. Zajec, In situ Pressure Measurements in Small Gettered
Volumes, in Journal of Vacuum Science & Technology A: Vacuum, Surfaces, and Films, 2002. 20(6): pp. 2018-2022.
3. B. Ferrario, Chemical Pumping in Vacuum Technology, in Vacuum, 1996. 47(4): pp. 363-
370. 4. B. Sanchez and T. Johnson, Model and Cutaway of Tritium Thermoelectric Generator,
Sandia National Laboratories, Livermore, CA. 5. M.M. Gunter, D. Herein, R. Schumacher, G. Weinberg, and R. Schlogl, Microstructure and
Bulk Reactivity of the Nonevaporable Getter Zr57V36Fe7, in Journal of Vacuum Science & Technology A: Vacuum, Surfaces, and Films, 1998. 16(6): pp. 3526-3535.
6. Non Evaporable Getters Activatable at Low Temperatures. SAES St707TM Getter
Informational Catalog, SAES Getters USA, Inc., Colorado Springs, CO. 7. A. Tripathi, N. Singh, and D. K. Avasthi, Hydrogen Intake Capacity of ZrVFe Alloy Bulk
Getters, in Vacuum, 1997. 48 (12): pp. 1023-1025. 8. G.M. Buffleben, T.J. Shepodd, and P.J. Nigrey, Evaluation of SAES Combogetter® for Use
in Nuclear Material Transportation Packages, Sandia Technical Report SAND2000-8252. Sandia National Laboratories, Livermore, CA, January 2001.
9. R.L. Beck and W.M. Mueller in Metal Hydrides, W.M. Mueller, J.P. Blackledge and G.G.
Libowitz, Eds., Academic Press, New York, 1968. 10. S.M. Toy and J.B. Vetrano, Properties of Zirconium Hydride and Zirconium-Uranium
Alloy Hydrides, NAA-SR-4244 (Del). Atomics International, Canoga Park, CA, September 1960.

28
Distribution: 1 MS0346 D. Dobranich 01516 1 MS0614 M. M. Contreras 02547 1 MS0614 B. M. Sanchez 02547 1 MS0614 D. E. Wesolowski 02547 1 MS1349 C. A. Apblett 18152 1 MS9035 P. A. Spence 08224 1 MS9035 S. F. Rice 08224 1 MS9114 R. Ng 03655 1 MS9161 G. M. Buffleben 08623 1 MS9291 D. Robinson 08651 1 MS9402 N. Y. C. Yang 08651 1 MS9403 T. J. Shepodd 08223 1 MS9403 J. T. Hachman 08223 5 MS9403 I. Hsu 08223 5 MS9403 B. E. Mills 08223 1 MS9403 A. M. Morales 08223 1 MS9403 A. Nissen 08223 1 MS9403 L. L. Whinnery 08223 1 MS9404 S. H. Goods 08222 1 MS9409 T. A. Johnson 08365 1 MS9661 P. V. Blarigan 08224 1 MS9661 A. D. Shugard 08224 1 MS0899 Technical Library 09536
