hydrogen demand analysis for h2@scale · – develop lca for environmental analysis of new pathways...
TRANSCRIPT
dr
2019 DOE Hydrogen and Fuel Cells Program Annual Merit Review
Hydrogen Demand Analysisfor H2@Scale
hg fdj hng ng fmhg mg hmg hj mg hfmf
AMGAD ELGOWAINY (PI), MARIANNE MINTZ , JEONGWOO HAN (currently with Exxon), UISUNG LEE, THOMAS STEPHENS, PINGPING SUN, ANANT VYAS, YAN ZHOU, LEAH
TALABER, STEPHEN FOLGA, MICHAEL MCLAMOR
Argonne National Laboratory
April 30, 2019 SA172 This presentation does not contain any proprietary, confidential, or otherwise restricted information

Overview
Timeline Barriers to Address • Start: October 2018 A: Future Market Behavior • End: Determined by DOE Potential market for low value • % complete (FY19): 80% energy and potential hydrogen
markets beyond transportation D: Insufficient Suite of Models & Tools E: Unplanned Studies and Analysis H2@Scale is a new concept and
requires analysis of its potential impacts
Budget Partners/Collaborators • Funding for FY19: $200K • NREL, INL, PNNL, SNL, LLNL, LBNL
• DOE NE Office • Industry partners (utilities, energy
companies and OEMs)
2
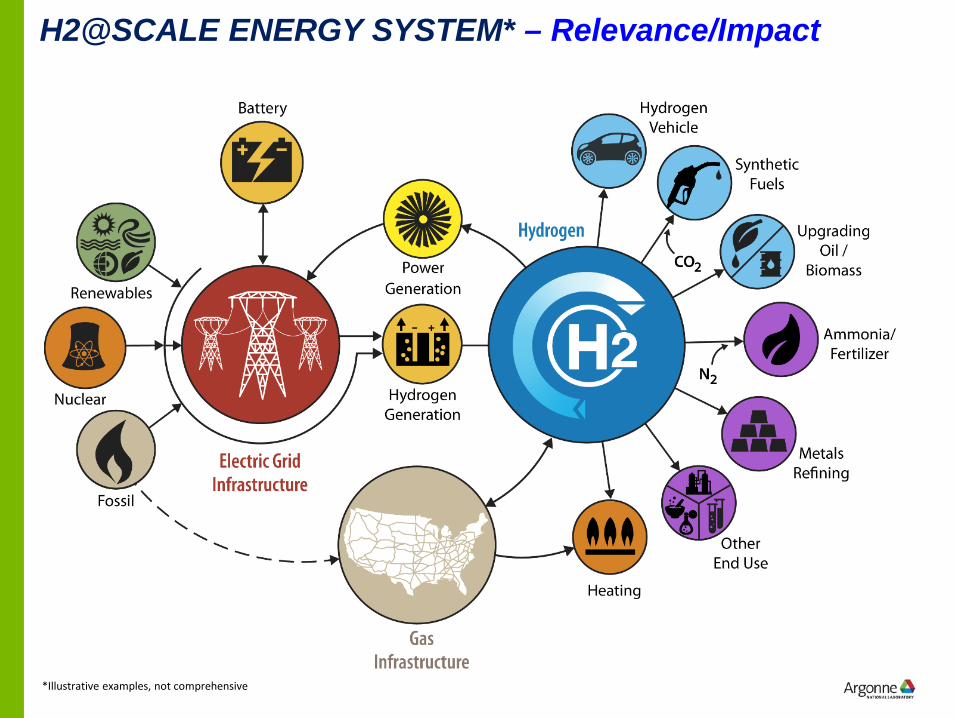
H2@SCALE ENERGY SYSTEM* – Relevance/Impact
*Illustrative examples, not comprehensive

TODAY, MORE THAN 10M METRIC TONS OF HYDROGEN ARE PRODUCED IN THE U.S. ANNUALLY – Relevance/Impact
1600 mi. of H2 pipeline; 10 Liquefaction plants in North America
4 planned liquefaction plants recently announced
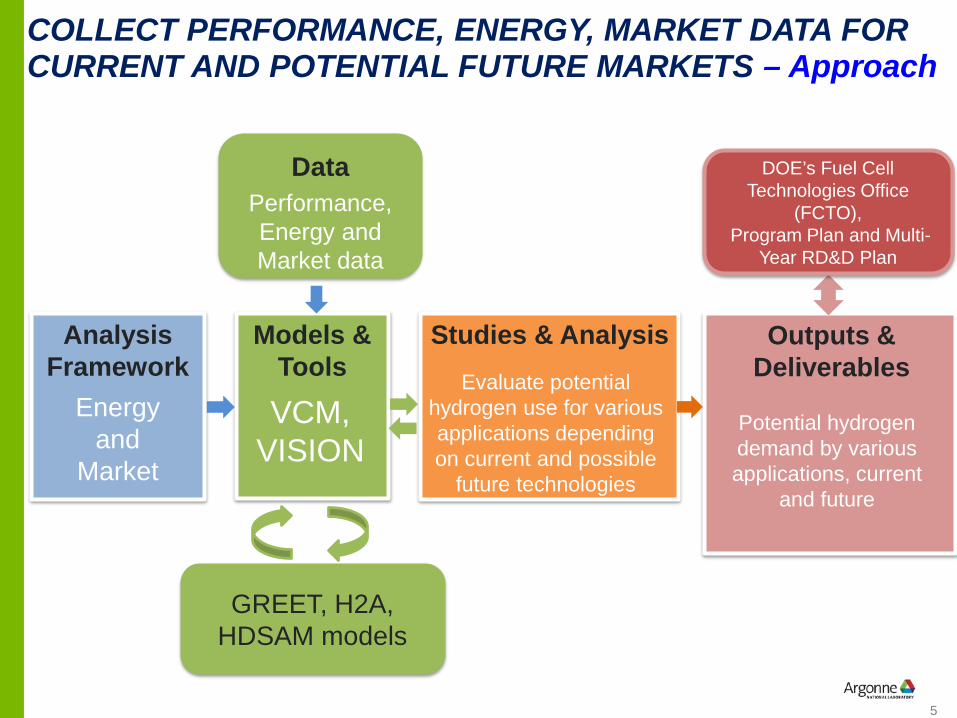
COLLECT PERFORMANCE, ENERGY, MARKET DATA FOR CURRENT AND POTENTIAL FUTURE MARKETS – Approach
Analysis Framework
Models & Tools
Studies & Analysis Outputs & Deliverables
GREET, H2A, HDSAM models
DOE’s Fuel Cell Technologies Office
(FCTO), Program Plan and Multi-
Year RD&D Plan
Energy and
Market
VCM, VISION
Evaluate potential hydrogen use for various applications depending on current and possible
future technologies
Potential hydrogen demand by various applications, current
and future
Data Performance, Energy and Market data
5

POTENTIAL HYDROGEN DEMAND BY REFINERIES
6

HYDROGEN CONSUMERS IN PETROLEUM REFINING – Relevance/Impact
Major consumers • Hydrocracker Diesel from
Heavy Crude • ULSD Hydrotreater Diesel • FCCU Feed Hydrotreater
Heavy Crude and S removal • Hydrotreater S removal
Elgowainy et al. Environmental Science and Technology, 2014 7

HYDROGEN DEMAND ASSESSMENT FOR PETROLEUM REFINING – Approach
Regression Function of H2 Demand by Refineries
Crude API Gravity and S Content Crude Inputs & Product Slate
EIA’s Annual Energy Outlook (Up to 2040)
H2 Demand (US, PADD Regions)
EIA’s Database
Gasoline, Diesel and Jet Displacement by
Biofuels
ANL’s High Octane Fuel Analysis for 2022 and
2030 Estimates
8

DEVELOPMENT OF REGRESSION FUNCTION OF H2 DEMAND BY REFINERIES USING EIA’S DATABASE – Accomplishment H2 (mmBtu/mmBtu Crude) = 0.059-0.00175 x (Crude API)+0.02218 x (Sulfur
Ratio)-0.00139 x (G/D Ratio)-0.59416 x (LPG/Total)
Good for Crude API: 28.5 – 34.3 Sulfur Ratio: 0.65 – 1.6 G/D Ratio: 0.5 – 5.8
9
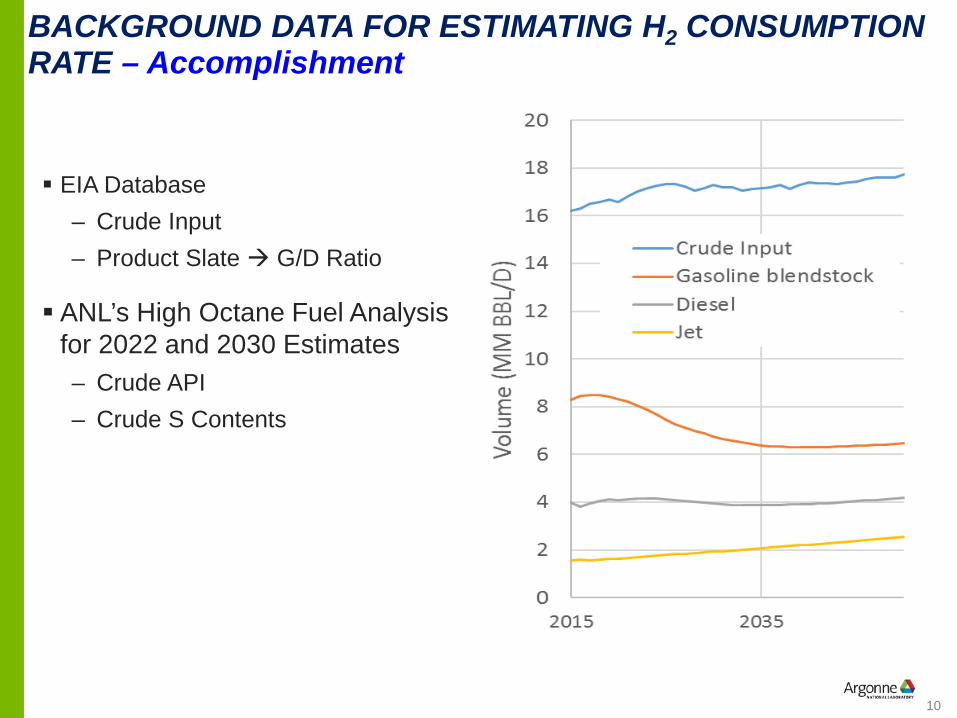
BACKGROUND DATA FOR ESTIMATING H2 CONSUMPTION RATE – Accomplishment
EIA Database – Crude Input – Product Slate G/D Ratio
ANL’s High Octane Fuel Analysis for 2022 and 2030 Estimates – Crude API – Crude S Contents
10

7
RECENTLY, H2 DEMAND FOR US REFINERIES HAS INCREASED SIGNIFICANTLY – Accomplishment
H2 demand has been increased due to increased diesel demand and more stringent regulations. H2/Crude ratio shows regional variation; H2/Crude increases
over time. 600
PADD1 PADD2 PADD3 PADD4 PADD5 PADD1 PADD2 PADD3 PADD4 PADD5 US
Hyd
roge
n de
man
d fo
r US
refin
erie
s (M
illion
met
ric to
ns p
er y
ear)
6
5
4
3
2
1
0
H2/
Cru
de (c
ubic
feet
per
bar
rel) 500
400
300
200
100
02009 2010 2011 2012 2013 2014 2015 2016 2009 2010 2011 2012 2013 2014 2015 2016
Source: EIA 11

ESTIMATION OF FUTURE H2 DEMAND FOR US REFINERIES – Accomplishment H2/Crude will increase through 2030 Crude capacity would increase 9% from 2015 to 2021 (EIA AEO)
PADD1 PADD2 PADD3 PADD4 PADD5 US H2 demand in 2030 (MMT) 0.2 1.5 3.8 0.4 1.8 7.5
700 8.0
Hyd
roge
n de
man
d fo
r US
refin
erie
s (M
illion
met
ric to
ns p
er y
ear)
7.0
H2/
Cru
de (c
ubic
feet
per
bar
rel) 600
6.0 500
5.0 400
4.0 300
3.0
200 2.0
100 1.0
0 0.0 2010 2020 2030 2040 2050 2010 2015 2020 2025 2030 2035 2040 2045 2050
PADD1 PADD2 PADD3 PADD4 PADD5 PADD1 PADD2 PADD3 PADD4 PADD5
Generally increasing H2 consumption by refineries – Increasing H2 consumption rate due to heavier and more sour crude – Increasing D/G ratio – Increasing crude inputs
12
POTENTIAL HYDROGEN DEMAND FOR AMMONIA PRODUCTION
13
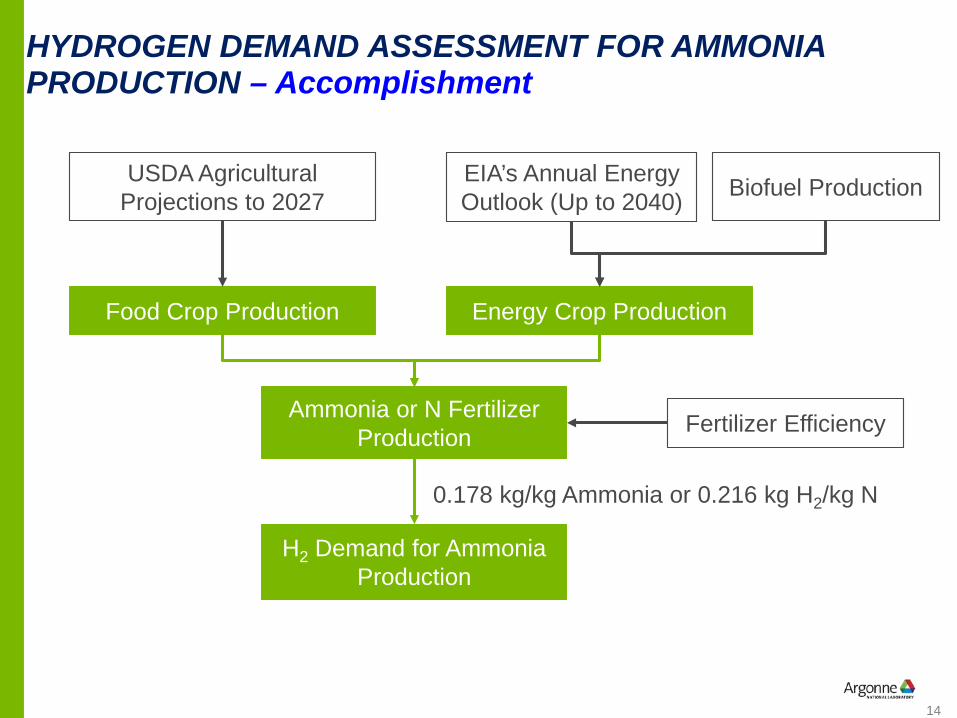
HYDROGEN DEMAND ASSESSMENT FOR AMMONIA PRODUCTION – Accomplishment
USDA Agricultural EIA’s Annual Energy Biofuel Production Projections to 2027 Outlook (Up to 2040)
Food Crop Production Energy Crop Production
Ammonia or N Fertilizer Production Fertilizer Efficiency
H2 Demand for Ammonia Production
0.178 kg/kg Ammonia or 0.216 kg H2/kg N
14
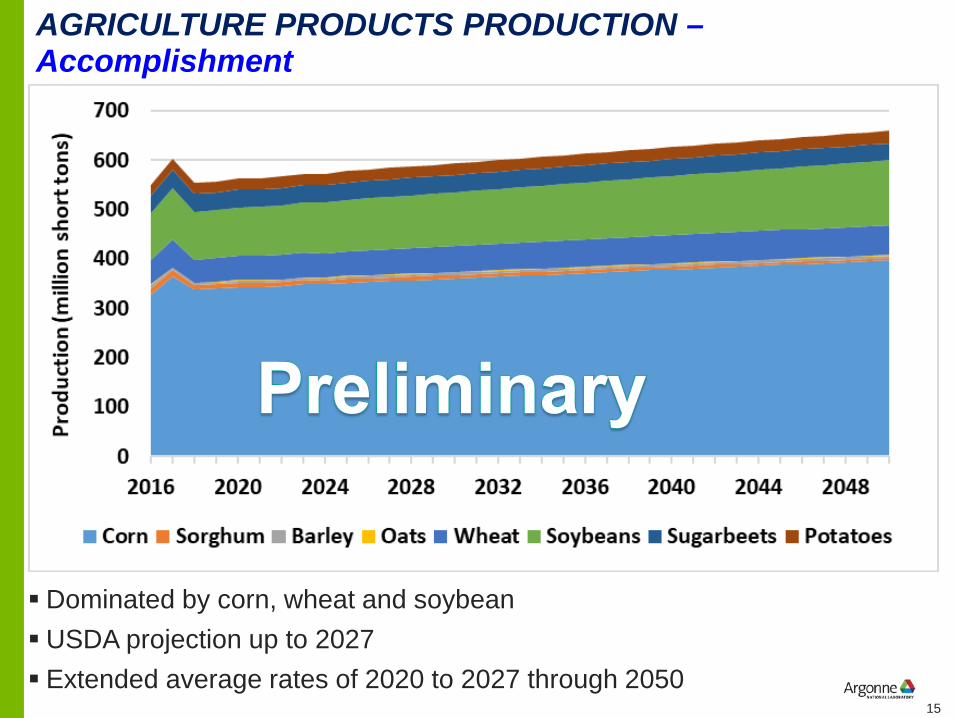
AGRICULTURE PRODUCTS PRODUCTION – Accomplishment
Dominated by corn, wheat and soybean USDA projection up to 2027 Extended average rates of 2020 to 2027 through 2050
15
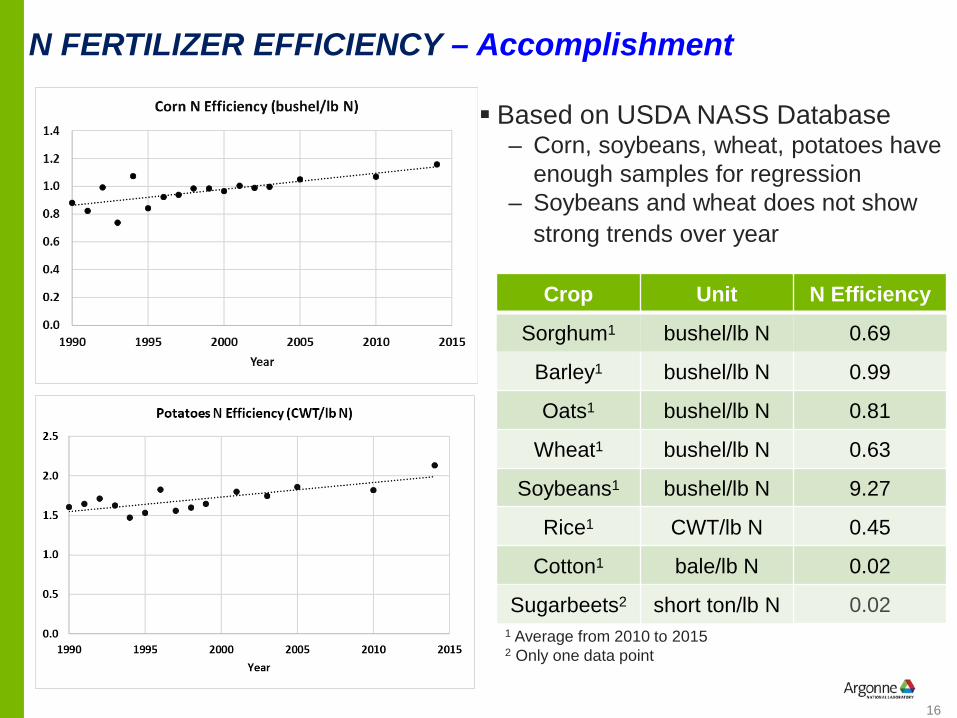
N FERTILIZER EFFICIENCY – Accomplishment
Based on USDA NASS Database – Corn, soybeans, wheat, potatoes have
enough samples for regression – Soybeans and wheat does not show
strong trends over year
Crop Unit N Efficiency
Sorghum1 bushel/lb N 0.69
Barley1 bushel/lb N 0.99
Oats1 bushel/lb N 0.81
Wheat1 bushel/lb N 0.63
Soybeans1 bushel/lb N 9.27
Rice1 CWT/lb N 0.45
Cotton1 bale/lb N 0.02
0.02Sugarbeets2 short ton/lb N 1 Average from 2010 to 2015 2 Only one data point
16
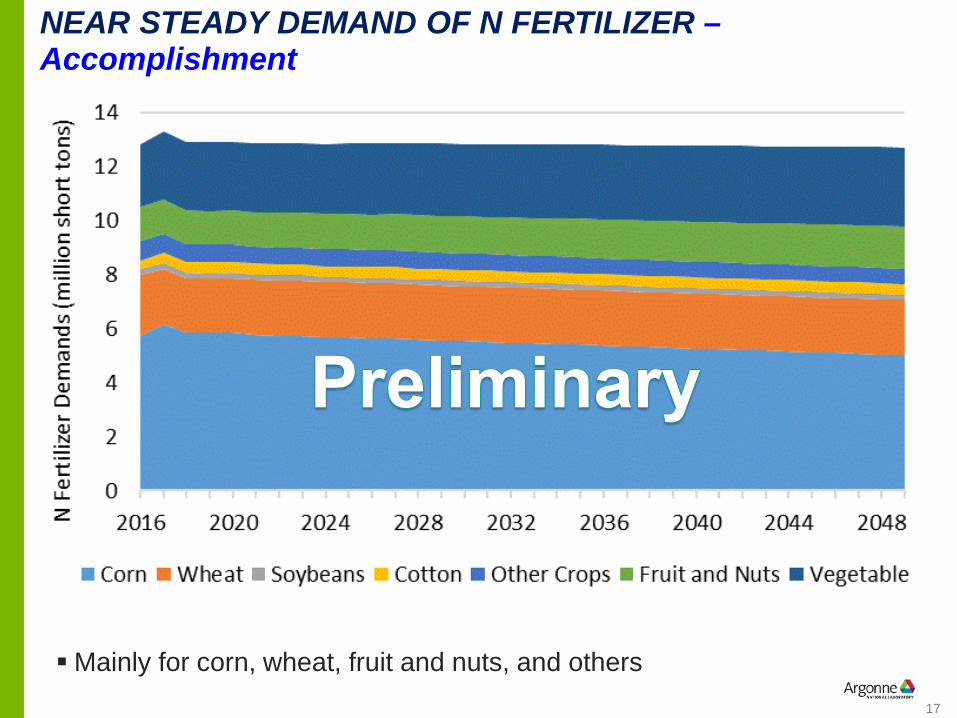
NEAR STEADY DEMAND OF N FERTILIZER – Accomplishment
Mainly for corn, wheat, fruit and nuts, and others 17
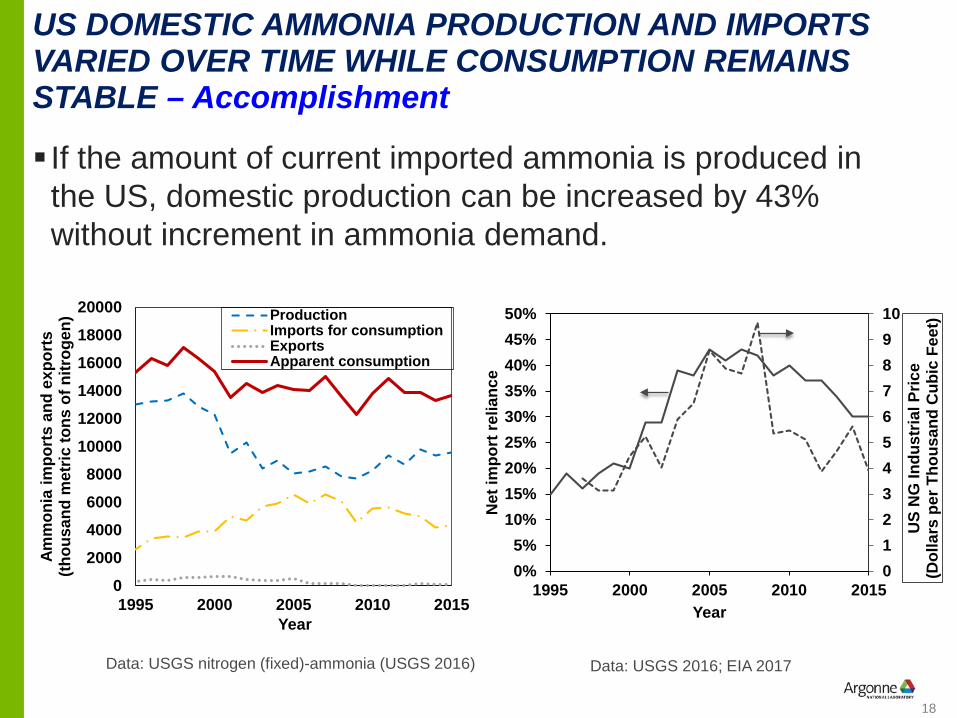
US DOMESTIC AMMONIA PRODUCTION AND IMPORTS VARIED OVER TIME WHILE CONSUMPTION REMAINS STABLE – Accomplishment
If the amount of current imported ammonia is produced in the US, domestic production can be increased by 43% without increment in ammonia demand.
20000 18000
Production Imports for consumption ExportsApparent consumption
45%
0 1 2 3 4 5 6 7 8 9 10
10% 15% 20% 25% 30% 35% 40%
50%
1995 2000 2005 2010 2015
Amm
onia
impo
rts
and
expo
rts
(thou
sand
met
ric to
ns o
f nitr
ogen
)
16000
Net
impo
rt re
lianc
e
14000 12000 10000
8000
5%2000
0% 0 1995 2000 2005 2010 2015 Year
Year
Data: USGS nitrogen (fixed)-ammonia (USGS 2016) Data: USGS 2016; EIA 2017
6000 4000 U
S N
G In
dust
rial P
rice
(Dol
lars
per
Tho
usan
d C
ubic
Fee
t)
18
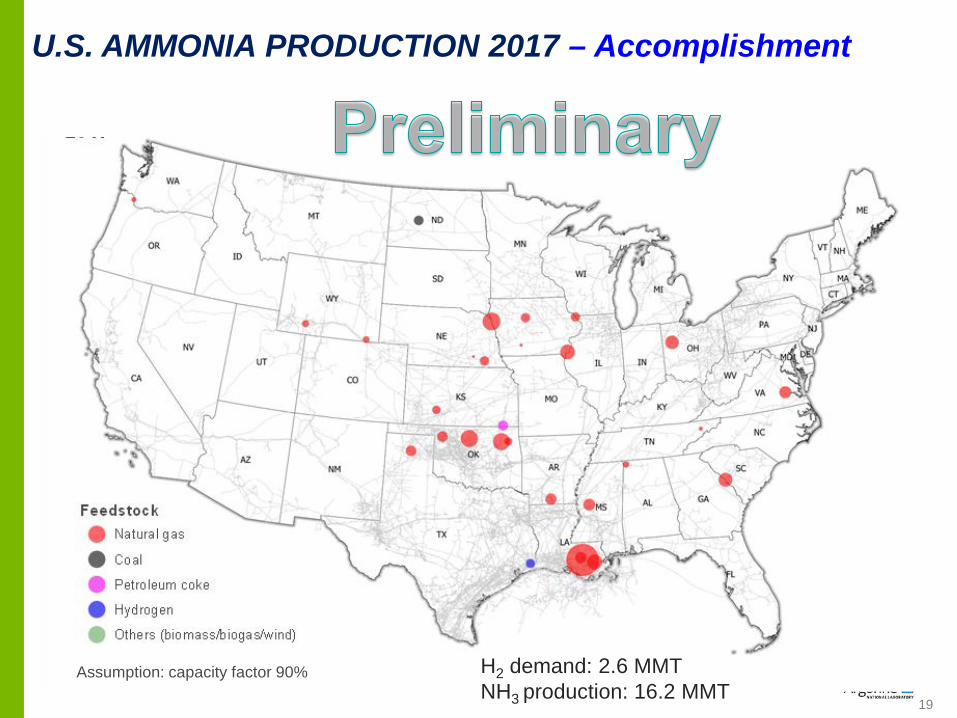
U.S. AMMONIA PRODUCTION 2017 – Accomplishment
Assumption: capacity factor 90% H2 demand: 2.6 MMT NH3 production: 16.2 MMT
19
E-FUEL (SYNFUEL) PRODUCTION (H2 +CO2 LIQUID HC)
20
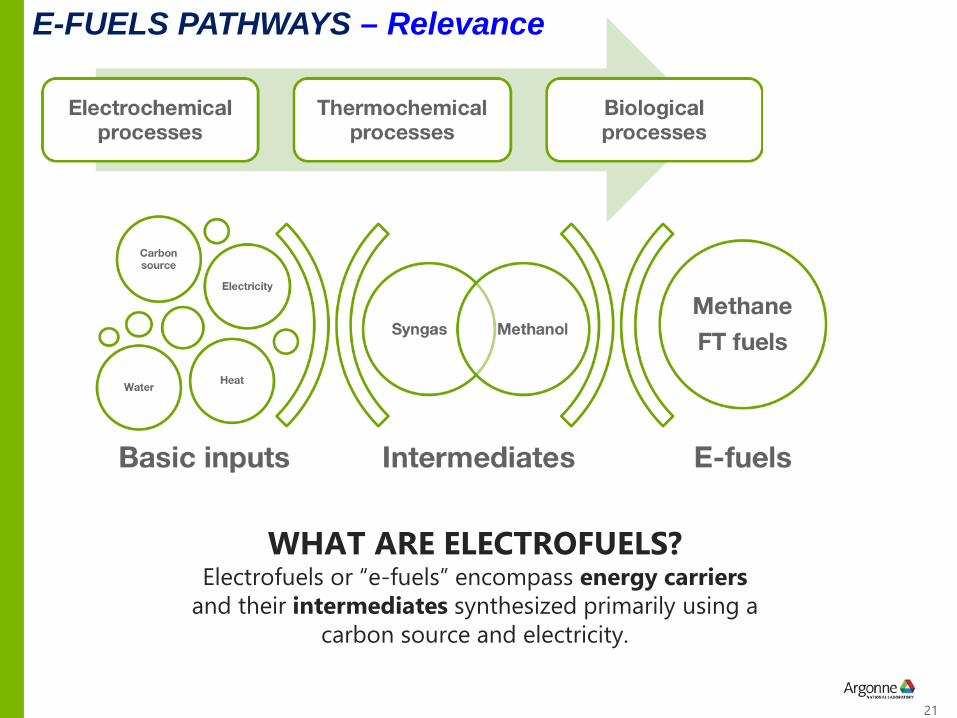
E-FUELS PATHWAYS – Relevance
WHAT ARE ELECTROFUELS? Electrofuels or “e-fuels” encompass energy carriers
and their intermediates synthesized primarily using a carbon source and electricity.
21

DEMAND FOR E-FUEL PRODUCTION CO2 SOURCES – Accomplishment • 100 million MT of concentrated CO2 produced annually (out of total 3 GT CO2)
44 million MT from ethanol plants Current market supply capacity of 14 MMT, and demand of 11 MMT
Remainder from hydrogen SMR (refineries) and ammonia plants
Supekar and Skerlos, ES&T (2014)
22
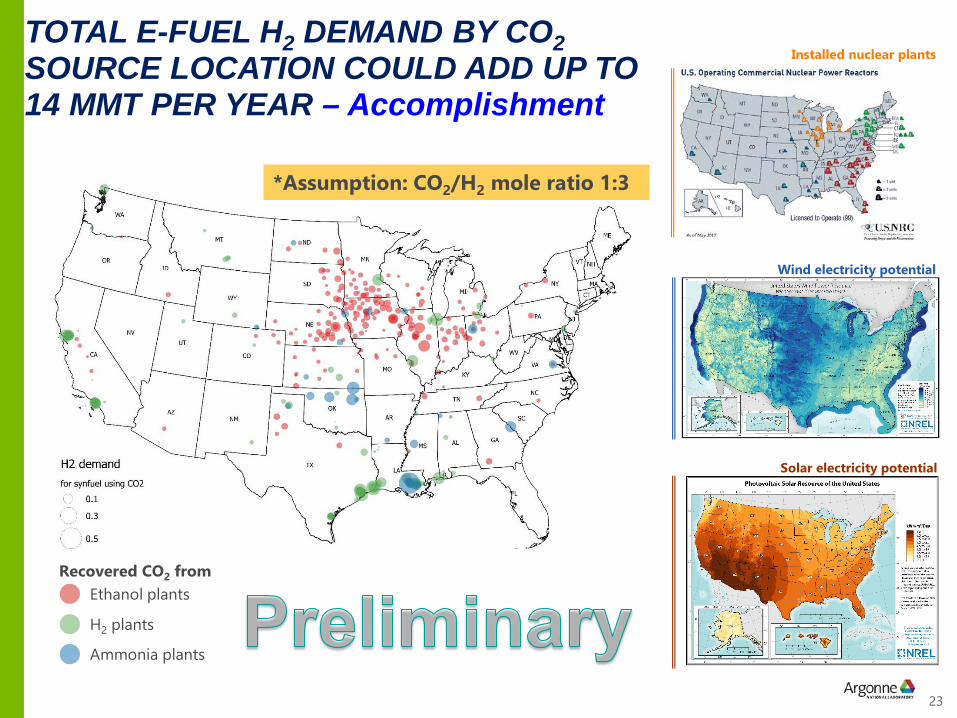
TOTAL E-FUEL H2 DEMAND BY CO2 Installed nuclear plants SOURCE LOCATION COULD ADD UP TO 14 MMT PER YEAR – Accomplishment
Recovered CO2 from Ethanol plants
H2 plants
Ammonia plants
*Assumption: CO2/H2 mole ratio 1:3
Wind electricity potential
Solar electricity potential
23

POTENTIAL HYDROGEN DEMAND FOR STEEL REFINING
24

STEEL MAKING AND POTENTIAL HYDROGEN DEMAND – Accomplishment
Inde
x (n
ot q
uant
ity)
Projected growth from 80 to 120 MMT (50%)
by 2040
• 100 kg of hydrogen is estimated to produce 1 MT of hot iron with direct reduction iron (DRI) technology 1 ton of H2 can replace 5 ton of coke If all imported steel (35 MMT steel) is replaced with U.S. production via DRI,
demand would be 3.5 MMT H2
If all steel is produced via DRI in U.S. in 2040 (120 MMT steel), demand would be 12 MMT H2 In near-term, DRI in a mix of 30% H2 by energy is feasible (Midrex)
H2 price of ~$1.50 (2017 dollars)/kg would generate positive NPV for DRI1
1. Sohn, H.Y., and Y. Mohassab, 2016. “Development of a Novel Flash Ironmaking Technology with Greatly Reduced Energy Consumption and CO2 Emissions,” Journal of Sustainable Metallurgy, Vol. 2(3):216–227. DOI 10.1007/s40831-016-0054-8.
25

POTENTIAL HYDROGEN DEMAND FOR OTHER APPLICATIONS – Accomplishment
Application Target H2 Price [$/kg]
Potential H2 Demand [MMT] Notes
Light-Duty FCEV (cars) 5 2.5 Vehicle choice model (VCM)
2.7 3.3 Vehicle choice model 5 4 Vehicle choice model
Light-Duty FCEV (trucks)
Medium-Duty FCEV 5 1 Zero-emissions mandate 2.7 6.2 Vehicle choice model
Heavy-Duty FCEV 5 0.5 Zero-emissions mandate
Petroleum Refining inelastic demand 7.5 No substitute for H2 in refining process
Biofuels inelastic demand 4 Renewable Fuel Standard
inelastic demand 2.6 Demand for current production of NH3NH3 2 3.6 Competitive with SMR H2
Synthetic MeOH 2 3.8 Competitive with SMR H2
Synthetic FT Diesel 1.5 6 To compete with petroleum diesel Injection to NG Infrastructure
0.8 10 Competitive with NG HHV
Iron Reduction and 1.7 3.5 Techno-economic analysis of DRI Steelmaking 0.8 12 Competitive with NG HHV
We note that the assessed scenarios for potential H2 demand by various applications may be exclusive of one another (i.e., the H2 demand by different scenarios may not be additive)
26

SUMMARY – Accomplishment Evaluated current and potential future annual hydrogen
demand for various applications – Petroleum refining (7.5 MMT) – Ammonia production (3.6 MMT) – e-fuels (14 MMT) – Steel refining (12 MMT)
Additional potential H2 market demands were evaluated – Biofuels production – FCEVs (LDV and M/HDV) – Injection into NG pipelines
Documented all data sources, modeling approach and analysis in a report – Report has been peer reviewed – Awaiting clearance for public release
27

Collaborations and Acknowledgments Mark Ruth, Paige Jadun and Bryan Pivovar: NREL Richard Boardman: INL Jamie Holliday: PNNL Troy Hawkins, Krishna Reddi, Sarang Supekar, Ted Krause and John
Kopasz: ANL Elizabeth Connelly: DOE George Parks: FuelScience
28

Future Work Develop LCA for environmental analysis of new pathways
– e.g., e-fuels and steel refining
Conduct regional analysis considering proximity of supply and demand
– Delivered H2 vs. onsite production
– Delivery mode / bulk storage requirement
• As a function of volume, schedule, and pressure requirement
Consider potential other markets (e.g., hythane for NG power generators)
Consider non-physical materials for delivering and storing hydrogen (e.g., chemical carriers)
Publish H2@Scale Demand Report
29
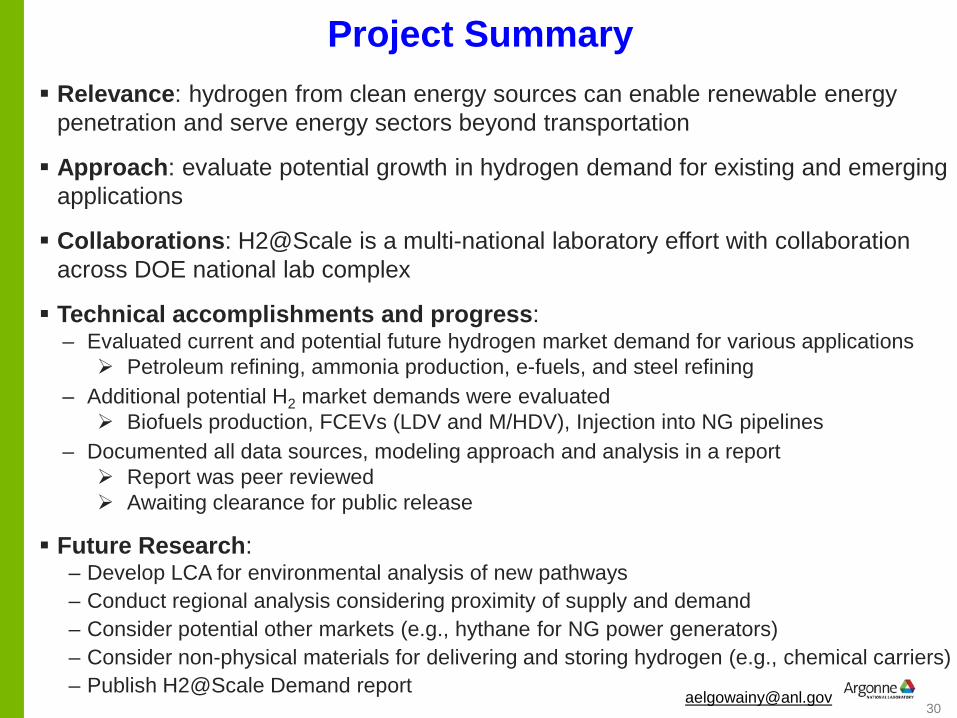
Project Summary Relevance: hydrogen from clean energy sources can enable renewable energy
penetration and serve energy sectors beyond transportation
Approach: evaluate potential growth in hydrogen demand for existing and emerging applications
Collaborations: H2@Scale is a multi-national laboratory effort with collaboration across DOE national lab complex
Technical accomplishments and progress: – Evaluated current and potential future hydrogen market demand for various applications Petroleum refining, ammonia production, e-fuels, and steel refining
– Additional potential H2 market demands were evaluated Biofuels production, FCEVs (LDV and M/HDV), Injection into NG pipelines
– Documented all data sources, modeling approach and analysis in a report Report was peer reviewed Awaiting clearance for public release
Future Research: – Develop LCA for environmental analysis of new pathways – Conduct regional analysis considering proximity of supply and demand – Consider potential other markets (e.g., hythane for NG power generators) – Consider non-physical materials for delivering and storing hydrogen (e.g., chemical carriers) – Publish H2@Scale Demand report [email protected]
30

Backup Slides
34
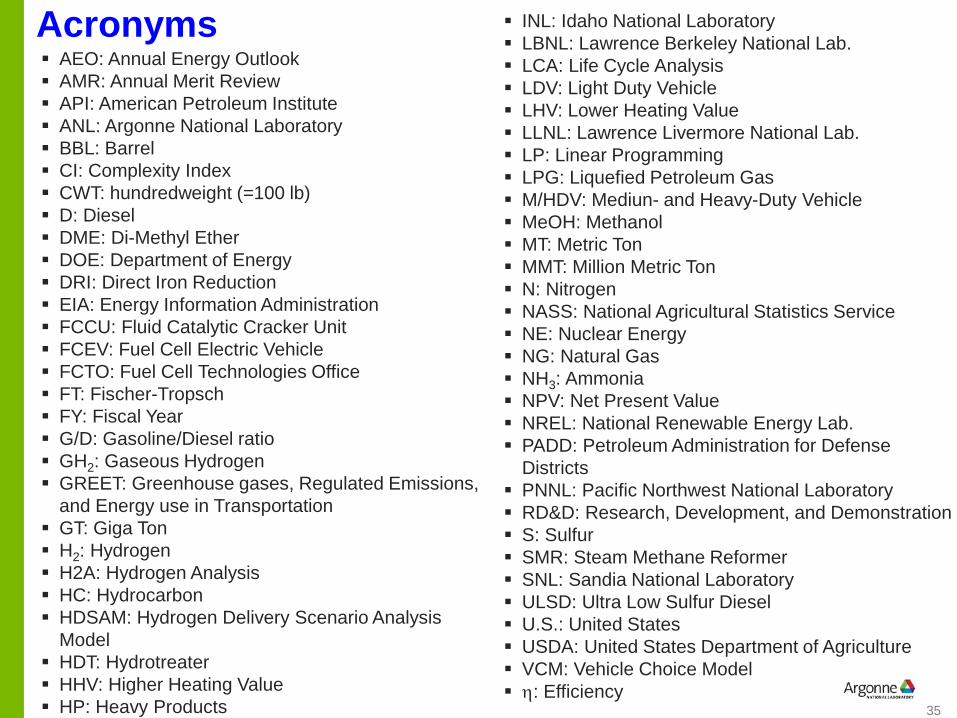
INL: Idaho National Laboratory Acronyms LBNL: Lawrence Berkeley National Lab.
AEO: Annual Energy Outlook LCA: Life Cycle Analysis AMR: Annual Merit Review LDV: Light Duty Vehicle API: American Petroleum Institute LHV: Lower Heating Value ANL: Argonne National Laboratory LLNL: Lawrence Livermore National Lab. BBL: Barrel LP: Linear Programming CI: Complexity Index LPG: Liquefied Petroleum Gas CWT: hundredweight (=100 lb) M/HDV: Mediun- and Heavy-Duty Vehicle D: Diesel MeOH: Methanol DME: Di-Methyl Ether MT: Metric Ton DOE: Department of Energy MMT: Million Metric Ton DRI: Direct Iron Reduction N: Nitrogen EIA: Energy Information Administration NASS: National Agricultural Statistics Service FCCU: Fluid Catalytic Cracker Unit NE: Nuclear Energy FCEV: Fuel Cell Electric Vehicle NG: Natural Gas FCTO: Fuel Cell Technologies Office NH3: Ammonia FT: Fischer-Tropsch NPV: Net Present Value FY: Fiscal Year NREL: National Renewable Energy Lab. G/D: Gasoline/Diesel ratio PADD: Petroleum Administration for Defense GH2: Gaseous Hydrogen Districts GREET: Greenhouse gases, Regulated Emissions, PNNL: Pacific Northwest National Laboratory
and Energy use in Transportation RD&D: Research, Development, and Demonstration GT: Giga Ton S: Sulfur H2: Hydrogen SMR: Steam Methane Reformer H2A: Hydrogen Analysis SNL: Sandia National Laboratory HC: Hydrocarbon ULSD: Ultra Low Sulfur Diesel HDSAM: Hydrogen Delivery Scenario Analysis U.S.: United States
Model USDA: United States Department of Agriculture HDT: Hydrotreater VCM: Vehicle Choice Model HHV: Higher Heating Value η: Efficiency HP: Heavy Products 35

ANL STUDY COVERED 70% OF U.S. REFINING CAPACITY – Approach LP modeling of 43 large (>100k bbl/d) refineries in four PADD regions
LP Coverage: 62%
PADD Region
Crude Input to Refineries
(1000 bbl/day)a
I 921 II 3,451 III 7,755 IV 574 V 2,337
Total 15,038
LP Coverage: 84%
LP Coverage: 44%
LP Coverage: 77% Elgowainy et al. Environmental Science and Technology, 2014
Forman et al. Environmental Science and Technology, 2014 Han et al. Fuel, 2015
LP=Linear programming 36

CORRELATED REFINERY OVERALL EFFICIENCY WITH KEY REFINERY PARAMETERS – Relevance/Impact
Efficiency=f(API, sulfur%, heavy product yield, refinery complexity index)
87.59 0.2008 0.7628 0.07874 0.1847LHV API S HP CI η = + × − × + × − ×
ηLHV is the refinery’s overall efficiency (on an LHV basis) in %;
API is the API gravity of crude oil; S is the sulfur content of crude oil in
% by weight; HP is the heavy products yield in %
by energy; CI is the actual utilized Complexity
Index of the refinery.
70% of US refining capacity, covering 43 large (>100K bbl/d) refineries in four PADD regions Crude API Gravity , S Content,
product slate
37

FACILITY-LEVEL H2 DEMAND FOR US REFINERIES (2017) – Accomplishment
PADD1 PADD2 PADD3 PADD4 PADD5 US H2 demand (MMT) 0.12 1.2 3.0 0.3 1.4 5.9 H2/Crude (ft3/bbl) 100 315 329 430 504 342
Estimated based on facilities’ crude distillation capacity and PADD H2/crude ratios
38
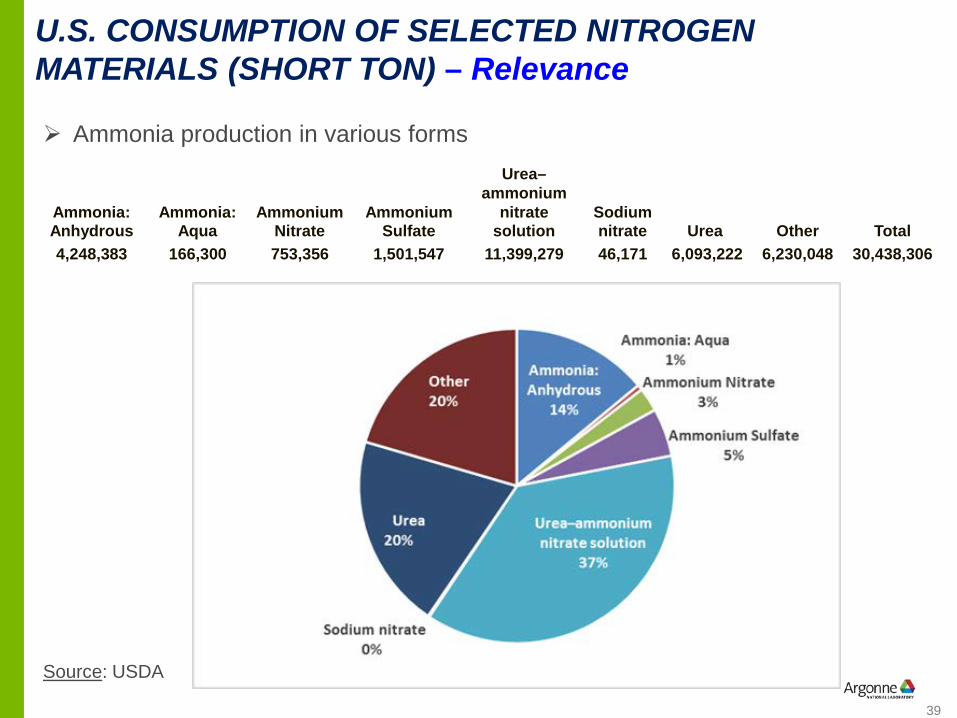
U.S. CONSUMPTION OF SELECTED NITROGEN MATERIALS (SHORT TON) – Relevance
Ammonia production in various forms Urea–
ammonium Ammonia: Ammonia: Ammonium Ammonium nitrate Sodium Anhydrous Aqua Nitrate Sulfate solution nitrate Urea Other Total 4,248,383 166,300 753,356 1,501,547 11,399,279 46,171 6,093,222 6,230,048 30,438,306
Source: USDA
39

U.S. IMPORTS AND EXPORTS OF SELECTED N FERTILIZERS – Relevance
2012
Export(short ton)
Import (shortton)
Net Import (shortton)
Ammonium Nitrate (Solid) 400,000 900,000 500,000 Urea (Solid) 400,000 7,700,000 7,300,000 Urea–ammonium nitrate solution 160,000 3,300,000 3,140,000 Ammonium Sulfate 1,400,000 300,000 -1,100,000 Anhydrous Ammonia 40,000 6,900,000 6,860,000 Aqua Ammonia 7,000 97,000 90,000 Calcium Nitrate 0 43,000 43,000 Diammonium Phosphate (DAP) 4,000,000 100,000 -3,900,000 Monammonium Phosphate (MAP) 2,700,000 600,000 -2,100,000 Other Nitrogen Fertilizers 30,000 460,000 430,000 Potassium Nitrate 17,000 175,000 158,000 Potassium-Sodium Nitrate 0 600 600 Sodium Nitrate 4,000 164,000 160,000 Total ~9,000,000 ~21,000,000 ~12,000,000
Source: USDA (estimates rounded)
40
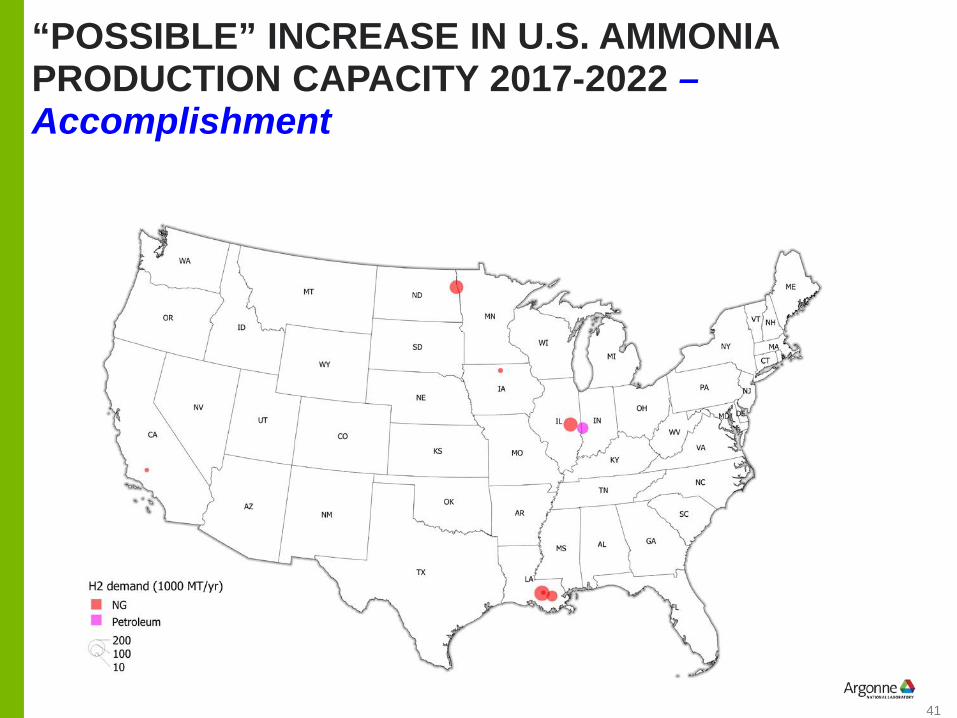
“POSSIBLE” INCREASE IN U.S. AMMONIA PRODUCTION CAPACITY 2017-2022 – Accomplishment
41
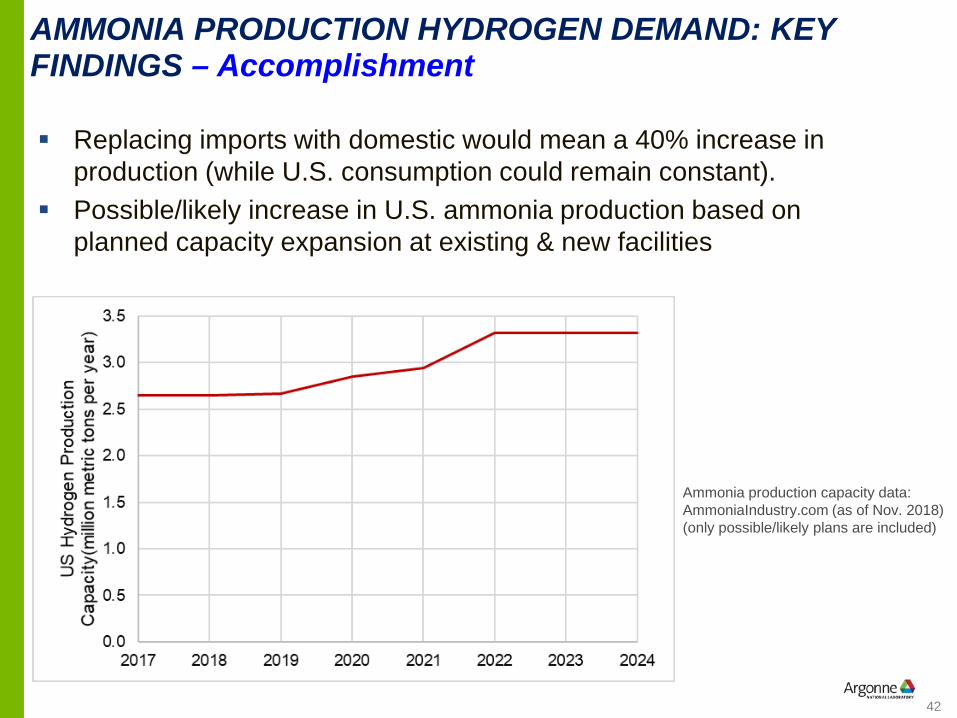
AMMONIA PRODUCTION HYDROGEN DEMAND: KEY FINDINGS – Accomplishment
Replacing imports with domestic would mean a 40% increase in production (while U.S. consumption could remain constant).
Possible/likely increase in U.S. ammonia production based on planned capacity expansion at existing & new facilities
Ammonia production capacity data: AmmoniaIndustry.com (as of Nov. 2018) (only possible/likely plans are included)
42
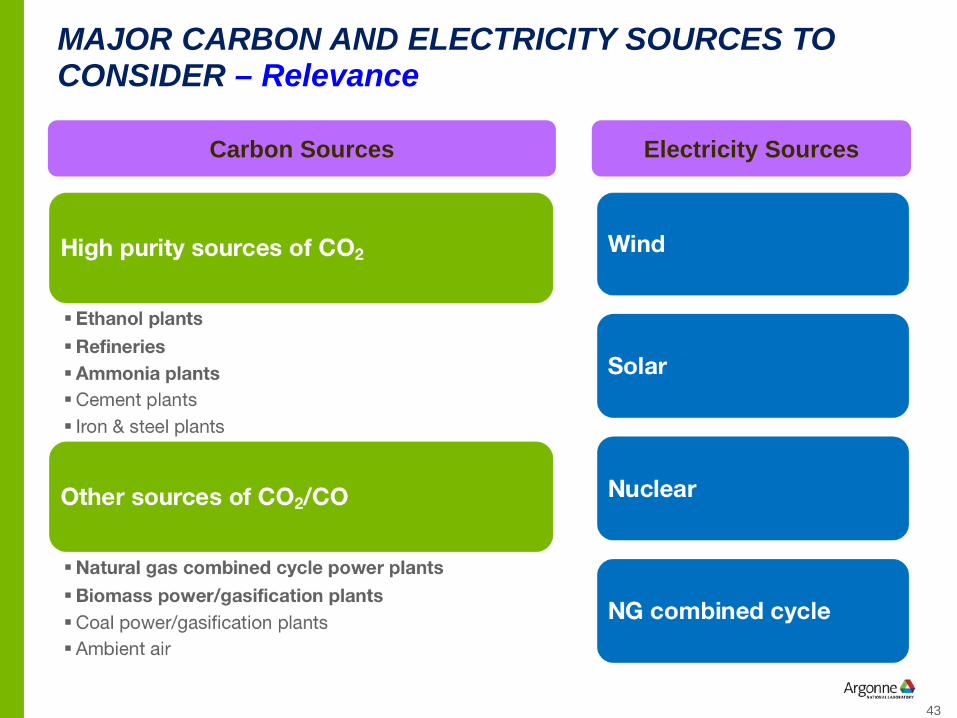
MAJOR CARBON AND ELECTRICITY SOURCES TO CONSIDER – Relevance
Carbon Sources Electricity Sources
43

DEMAND FOR E-FUEL PRODUCTION – H2 DEMAND – Accomplishment
Tremel et al., Int. J. H2 Energy (2015)
• For 44 million MT of concentrated CO2 annually 6 MMT of H2 will be needed to produce FTD or DME via synthesis
CO2/H2 mole ratio = 1:3 (two H2 moles to take out O2) 1 MMT of H2 will be needed to produce FTD via electrochemical reduction
of CO2
CO2/H2 mole ratio = 2:1
44
STEEL MAKING AND POTENTIAL HYDROGEN DEMAND – Accomplishment
• 106 million MT of steel consumed in the U.S. in 20171
81 MMT produced (68% electric arc [EA], 32% BF) 1
Scrap constitute 15% of BF feed and almost all EA feed DRI feedstock enables higher quality steel than scrap metal feedstock 1,100 MT (Only 0.1%) in U.S. produced via DRI1
35 MMT imported2
• Use of scrap metal can reduce quality of steel produced by EA
• DRI can provide up to 100% of the feed to EA furnace to enable higher steel quality
• 430 kg of coke is required to produce 1 MT of hot iron in blast furnace (BF) DRI reduces CO2 emissions by approximately 35% compared to BF H2 for DRI virtually eliminates CO2 emissions from the iron-making
process
1. USGS, 2017. Iron and Steel Statistics. January 2. Global Steel Monitor
45