hydrogen embrittlement and piezonuclear reactions …...brittle fracture experiment on carrara...
TRANSCRIPT
Hydrogen Hydrogen embrittlementembrittlement and and piezonuclearpiezonuclearreactions in electrolysis experiments reactions in electrolysis experiments
A. Carpinteri, O. A. Carpinteri, O. BorlaBorla, A. Goi, , A. Goi, A. Manuello, D. VenezianoA. Manuello, D. Veneziano
DepartmentDepartment ofof StructuralStructural, , GeotechnicalGeotechnical and Building and Building EngineeringEngineeringPolitecnico di Torino, ItalyPolitecnico di Torino, Italy

ACKNOWLEDGEMENTS
G. Lacidogna, for his extensive collaboration G. Lacidogna, for his extensive collaboration
R. Sandrone for his contribution in geological issuesR. Sandrone for his contribution in geological issues
A. Chiodoni and S. A. Chiodoni and S. GuastellaGuastella for their contribution in microfor their contribution in micro--chemical chemical
analysisanalysis
NEUTRON EMISSION FROM FRACTURE
AND EARTHQUAKES
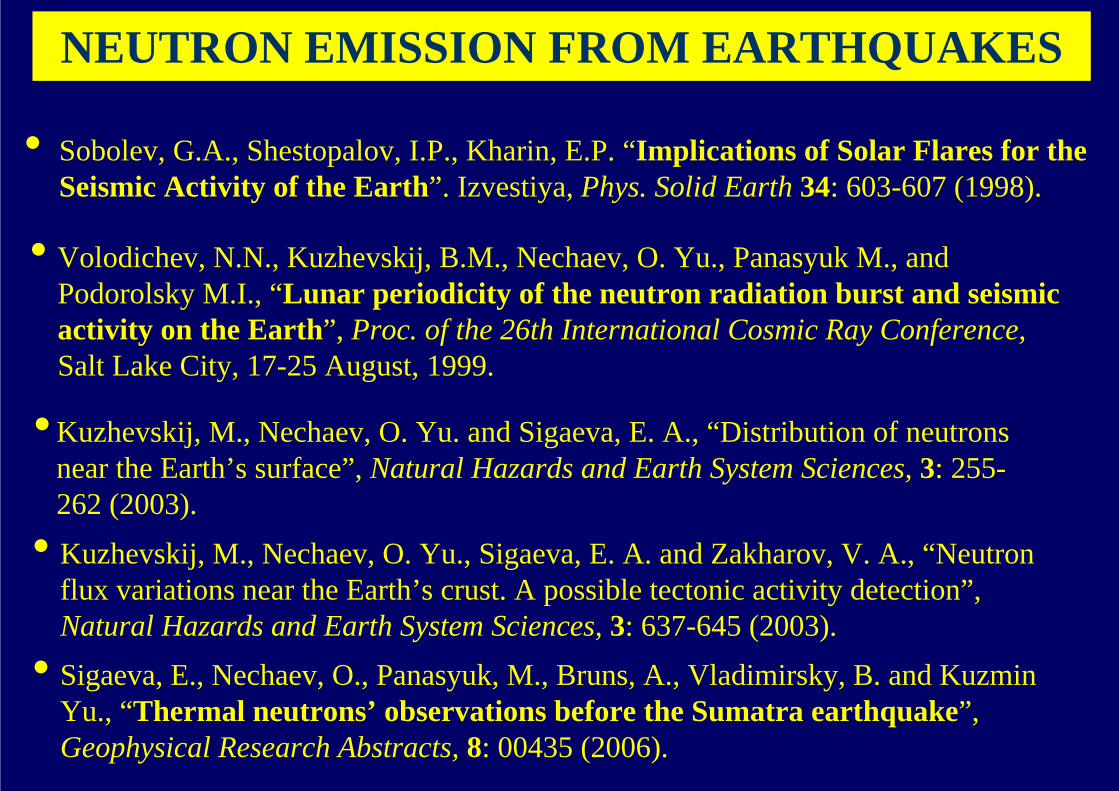
• Volodichev, N.N., Kuzhevskij, B.M., Nechaev, O. Yu., Panasyuk M., and Podorolsky M.I., “Lunar periodicity of the neutron radiation burst and seismic activity on the Earth”, Proc. of the 26th International Cosmic Ray Conference, Salt Lake City, 17-25 August, 1999.
NEUTRON EMISSION FROM EARTHQUAKES
• Kuzhevskij, M., Nechaev, O. Yu., Sigaeva, E. A. and Zakharov, V. A., “Neutron flux variations near the Earth’s crust. A possible tectonic activity detection”, Natural Hazards and Earth System Sciences, 3: 637-645 (2003).
• Sigaeva, E., Nechaev, O., Panasyuk, M., Bruns, A., Vladimirsky, B. and KuzminYu., “Thermal neutrons’ observations before the Sumatra earthquake”,Geophysical Research Abstracts, 8: 00435 (2006).
•Kuzhevskij, M., Nechaev, O. Yu. and Sigaeva, E. A., “Distribution of neutrons near the Earth’s surface”, Natural Hazards and Earth System Sciences, 3: 255-262 (2003).
• Sobolev, G.A., Shestopalov, I.P., Kharin, E.P. “Implications of Solar Flares for the Seismic Activity of the Earth”. Izvestiya, Phys. Solid Earth 34: 603-607 (1998).

As reported in the literature, an average thermal neutron flux up to 100 cm–2 s–1
(103 times the background level) was detected in correspondence to earthquakes with a magnitude of the 4th degree in Richter Scale (Volodichev N.N., et al. (1999)).
Global seismic activity and neutron flux measurements in the period 1974-1988. Laboratory of Geophysical Precursors, Oblast' Murmansk, Apatity, Kola Peninsula,Russia (Sobolev et al. 1998).
(Continued)
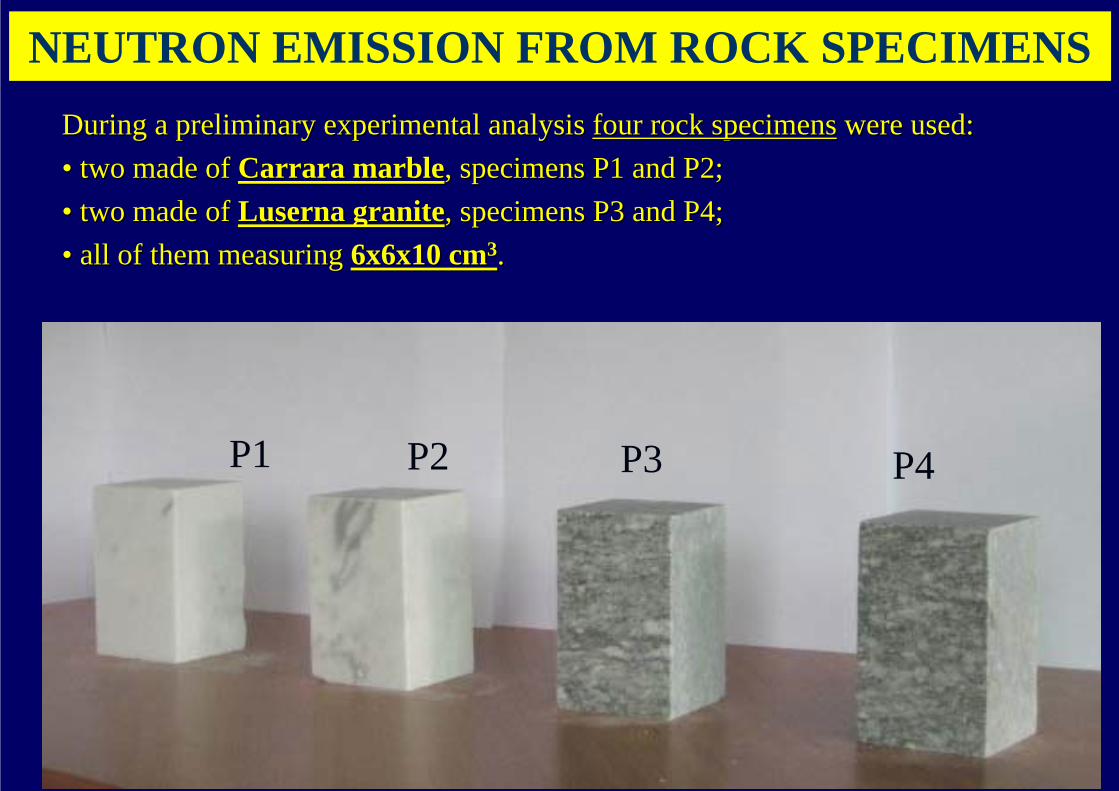
During a preliminary experimental analysis During a preliminary experimental analysis four rock specimensfour rock specimens were used:were used:•• two made of two made of CarraraCarrara marblemarble, specimens P1 and P2;, specimens P1 and P2;•• two made of two made of Luserna graniteLuserna granite, specimens P3 and P4; , specimens P3 and P4; •• all of them measuring all of them measuring 6x6x106x6x10 cmcm33..
P1 P2 P3 P4
NEUTRON EMISSION FROM ROCK SPECIMENS

P1 P2 P1 P2
P3P4 P3P4
Specimens P1 and P2 in Specimens P1 and P2 in CarraraCarrara marblemarble following compression failure.following compression failure.
Specimens P3 e P4 in Specimens P3 e P4 in Luserna graniteLuserna granite following compression failure.following compression failure.

Load vs. time and cps curve for P1 test specimen of Load vs. time and cps curve for P1 test specimen of CarraraCarrara marble.marble.
Brittle Fracture Experiment on Carrara Marble specimen
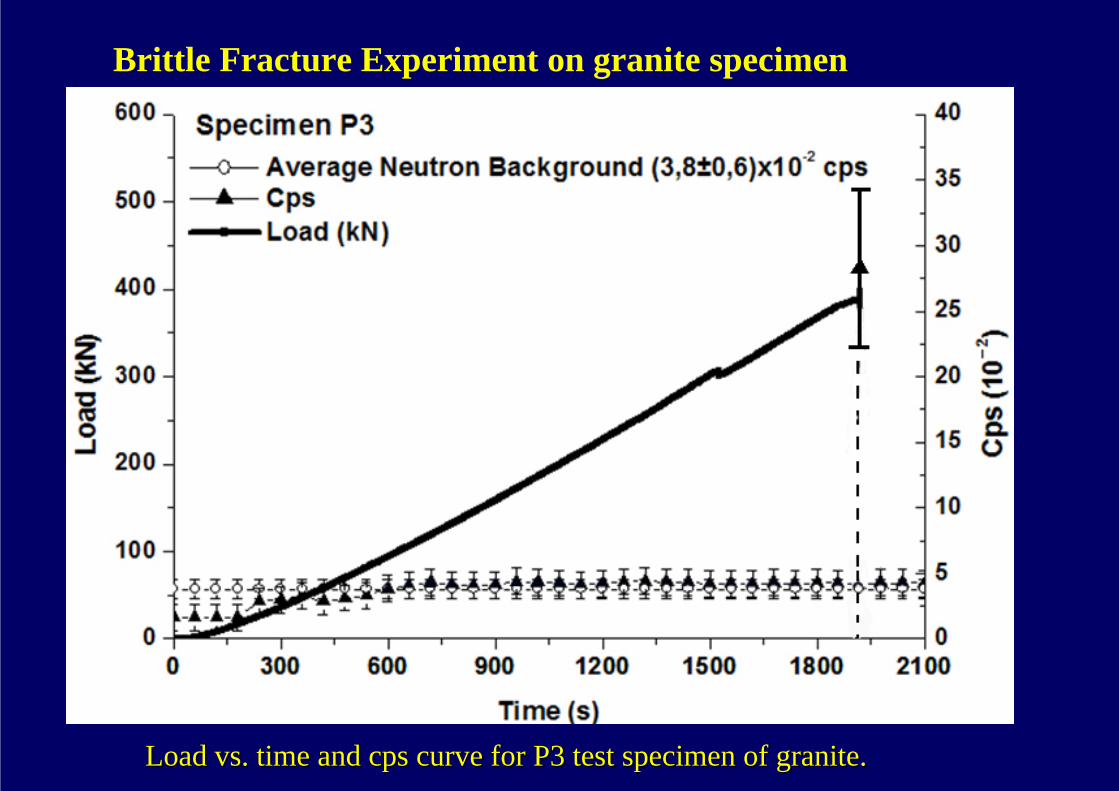
Load vs. time and cps curve for P3 test specimen of granite.Load vs. time and cps curve for P3 test specimen of granite.
Brittle Fracture Experiment on granite specimen
Granite (Fe Granite (Fe ∼∼ 1.5%)1.5%)
NEUTRON EMISSION FROM CAVITATION IN LIQUIDS AND FRACTURE IN SOLIDS
BasaltBasalt (Fe (Fe ∼∼ 15%)15%)
Magnetite Magnetite (Fe (Fe ∼∼ 75%)75%)
MarbleMarble
LIQUIDSLIQUIDS −− CavitationCavitation
NEUTRON EMISSIONNEUTRON EMISSION
Iron chlorideIron chloride
SOLIDSSOLIDS −− FractureFracture
101011 timestimes the Background the Background LevelLevel
2.52.5 timestimes the Background the Background LevelLevel
up to up to
101022 timestimes the Background the Background LevelLevelup to up to
101033 timestimes the Background the Background LevelLevelup to up to
up to up to
Background LevelBackground Level
MATERIALMATERIAL
SteelSteel 2.52.5 timestimes the Background the Background LevelLevelup to up to

The equivalent neutron dose, at the end of the test on basaltic The equivalent neutron dose, at the end of the test on basaltic rock, was 2.62 rock, was 2.62 ±± 0,53 0,53 µµSv/hSv/h(Average Background Dose = 41.95 (Average Background Dose = 41.95 ±± 0,85 0,85 nSv/hnSv/h).).
Effective Neutron DoseEffective Neutron DoseAverage Background DoseAverage Background Dose ≅≅ 5050
Cyclic Loading Experiments on Basaltic Rocks


CHEMICAL COMPOSITION
CHANGES AT THE LABORATORY
SCALE
ENERGY DISPERSIVE X-RAY SPECTROSCOPY: COMPOSITIONAL ANALYSIS OF PRODUCT
ELEMENTS
A quantitative analysis was performed on the collected spectra iA quantitative analysis was performed on the collected spectra in order to recognize n order to recognize specific specific variations in each element between external and fracture surfacevariations in each element between external and fracture surfacess..
Two different kinds of samples were examined: (i) polished thin Two different kinds of samples were examined: (i) polished thin sections from the sections from the external surface; (ii) small portions from the fracture surface.external surface; (ii) small portions from the fracture surface.

56 2726 13Fe 2Al 2n→ +
PhengitePhengite (Granite)(Granite)

56 28 2426 14 12Fe Si Mg 4n→ + +
BiotiteBiotite (Granite)(Granite)
56 2726 13Fe 2Al 2n→ +
56 28 2426 14 12Fe Si Mg 4n→ + +
Olivine (Basalt)Olivine (Basalt)
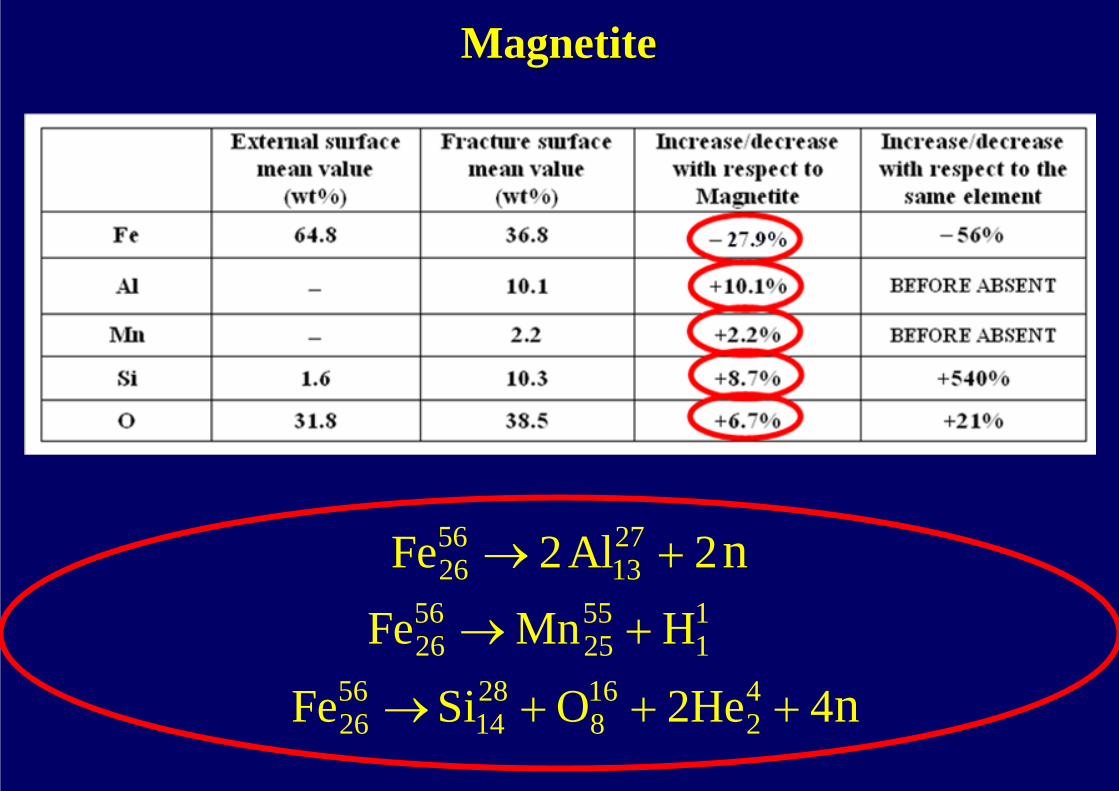
MagnetiteMagnetite
56 2726 13Fe 2Al 2n→ +
56 55 126 25 1Fe Mn H→ +
56 28 16 426 14 8 2Fe Si O 2He 4n→ + + +
He3CCa 42
126
4020 +→
24 12
612Mg 2C→
HeCO 4
2
12
6
16
8 +→
CarraraCarrara MarbleMarble

MICROMICRO--CRACKINGCRACKING&&
FRACTURE IN FRACTURE IN ELECTROLYSISELECTROLYSISELECTRODES ELECTRODES

RECURRING PHENOMENA IN THE SO-CALLED COLD FUSION (CF)
1989 - Fleishman & Pons
1998 - Mizuno
2008 - Mosier-Boss et al.
Heat Generation
Heat GenerationNeutron EmissionCompositional changes
Heat GenerationNeutron EmissionCompositional changesAlpha particle emissions
Mizuno, 1998. Infinite Energy Press.Fleischmann, Pons, Hawkins, 1989. J. Electroanalitical Chemistry
Mosier-Boss, P.A., et al., 2008. Eur. J. of Applied Physics
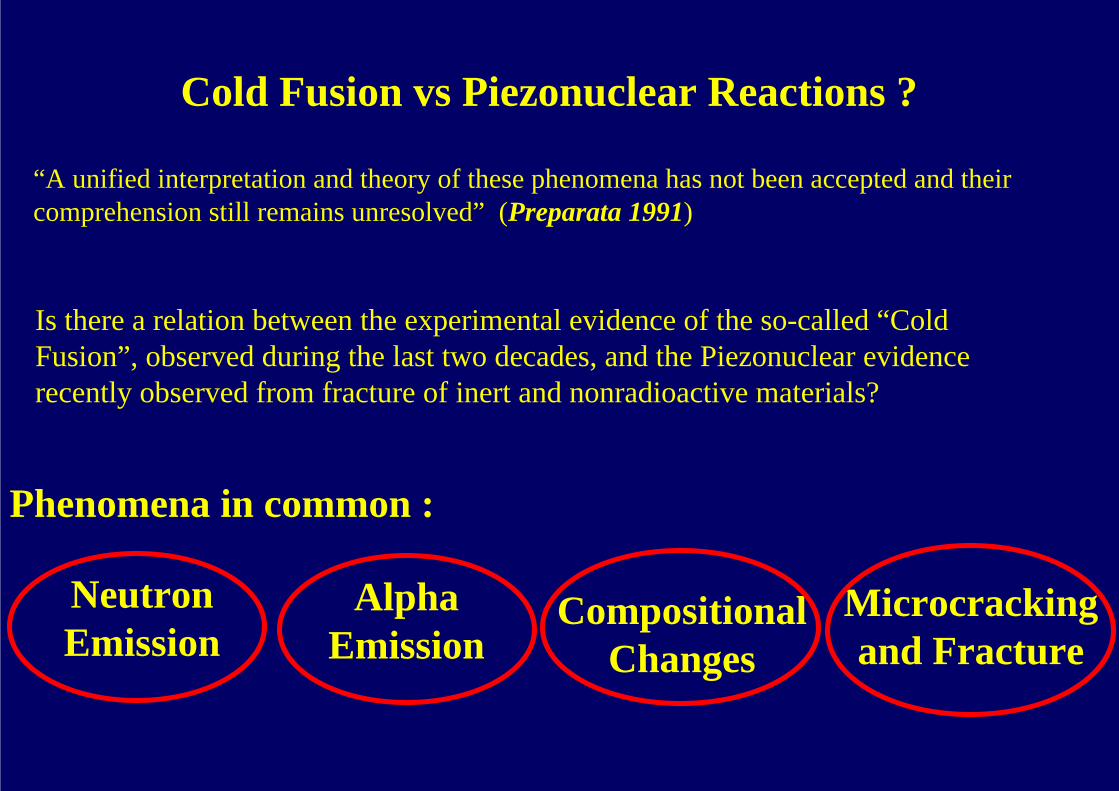
Is there a relation between the experimental evidence of the so-called “Cold Fusion”, observed during the last two decades, and the Piezonuclear evidence recently observed from fracture of inert and nonradioactive materials?
NeutronEmission
Compositional Changes
Microcrackingand Fracture
AlphaEmission
Cold Fusion vs Piezonuclear Reactions ?
“A unified interpretation and theory of these phenomena has not been accepted and their comprehension still remains unresolved” (Preparata 1991)
Phenomena in common :
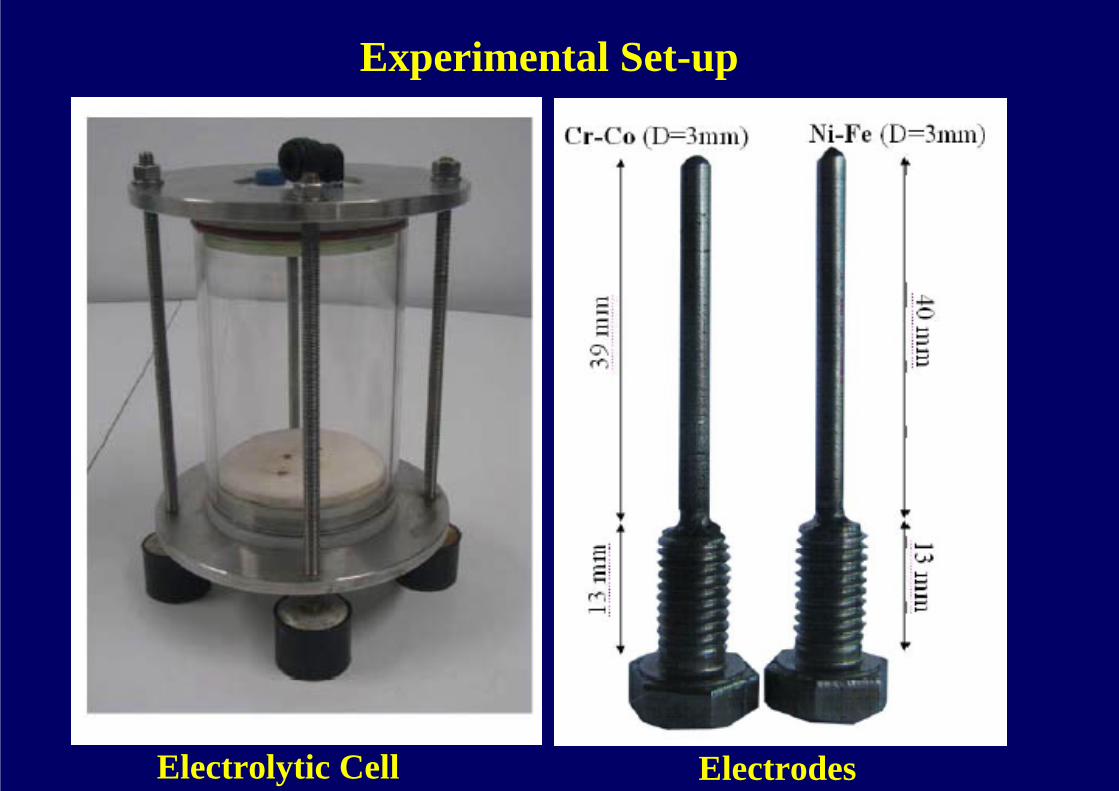
Experimental Set-up
Electrolytic Cell Electrodes

Instantaneous Neutron Emission between 4 times and 10 times the background level
Neutron Emission

Total acquisition time: 1 hour
AlphaAlpha ParticleParticle EmissionEmission
CELL ON: 0.030 CsCELL ON: 0.030 Cs--11((meanmean valuevalue))

AlphaAlpha ParticleParticle EmissionEmission
CELL OFF: 0.015 CsCELL OFF: 0.015 Cs--11((meanmean valuevalue))
Total acquisition time: 1 hour

Cumulative Cumulative CurvesCurves forfor the the AlphaAlpha EmissionsEmissions
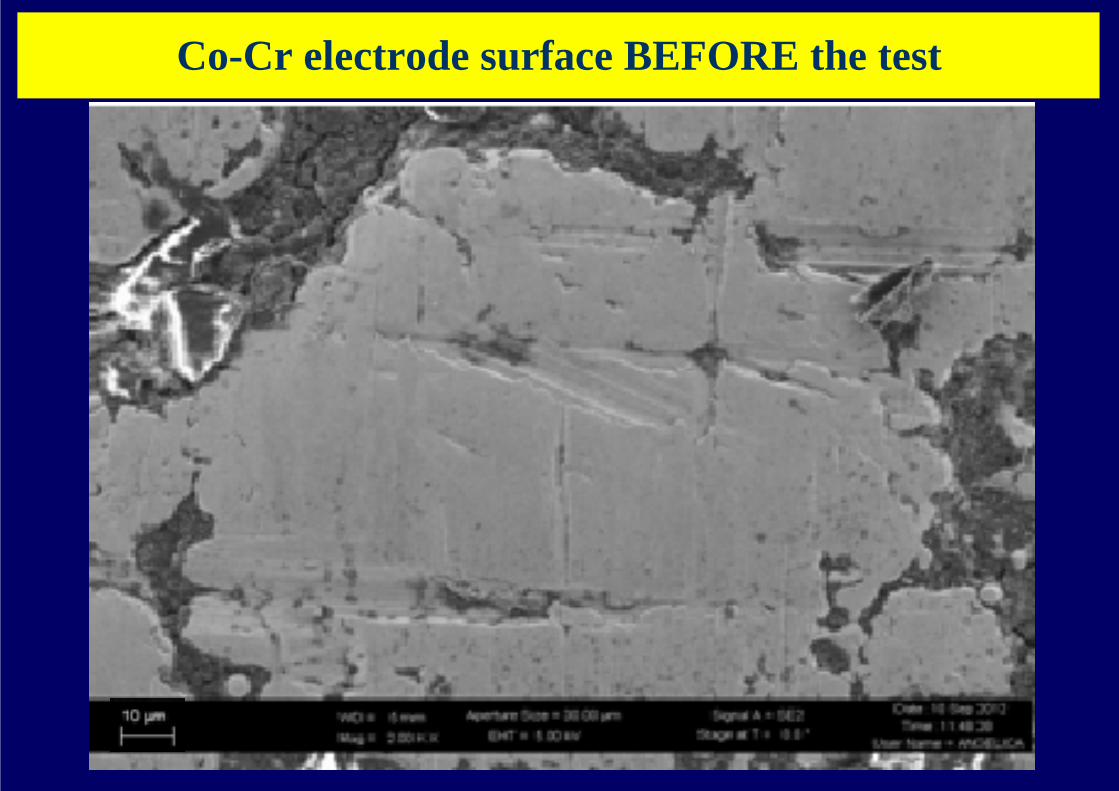
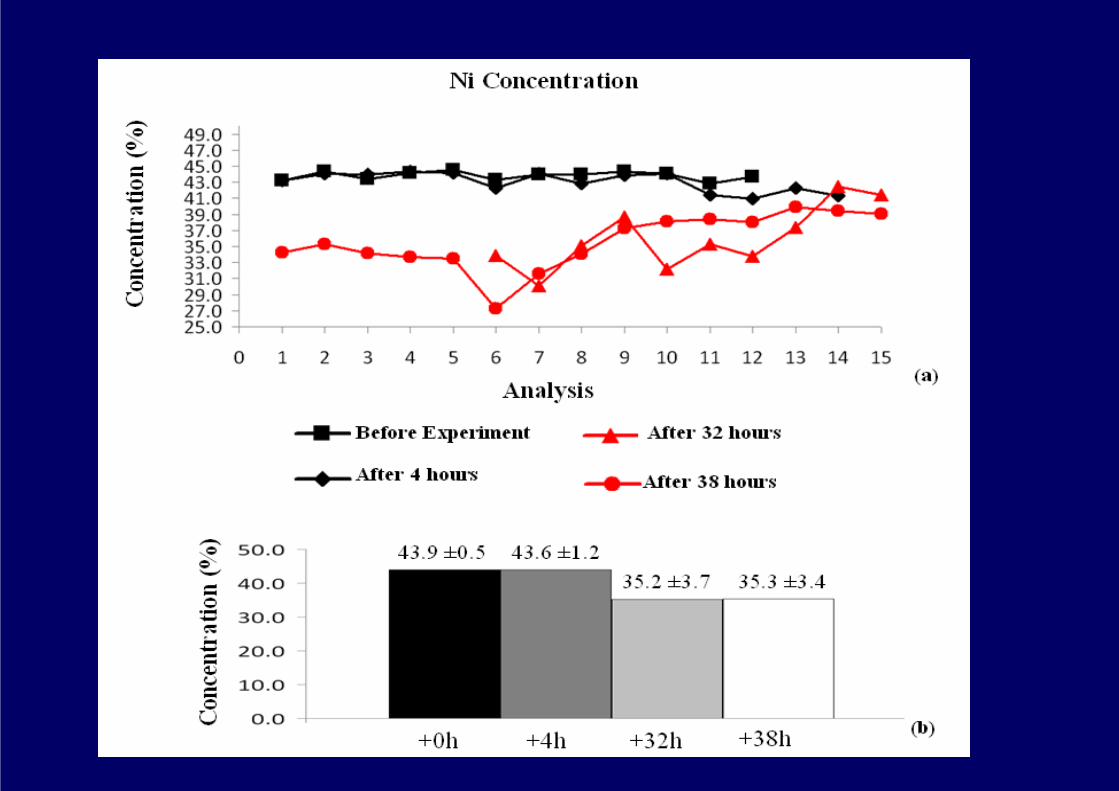
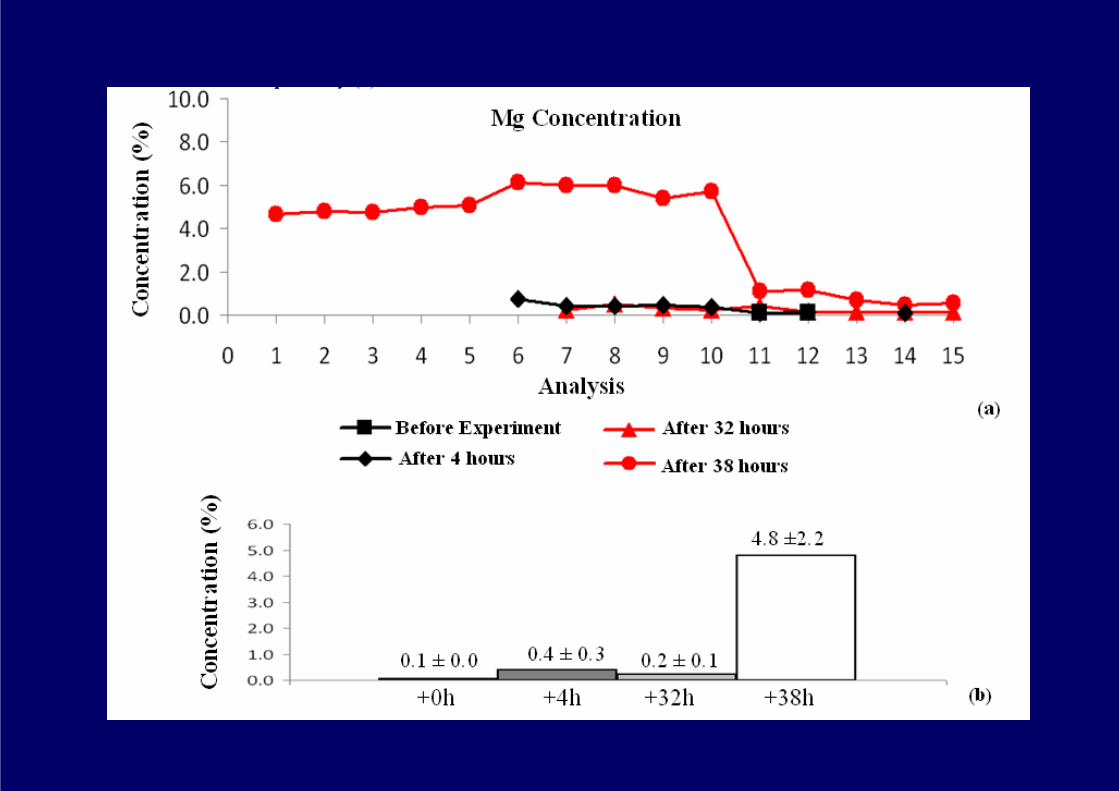
CompositionalCompositional AnalysisAnalysis ofof thethe ElectrodesElectrodesCo-Cr electrode surface BEFORE the test

Micro-cracking after 38 hours
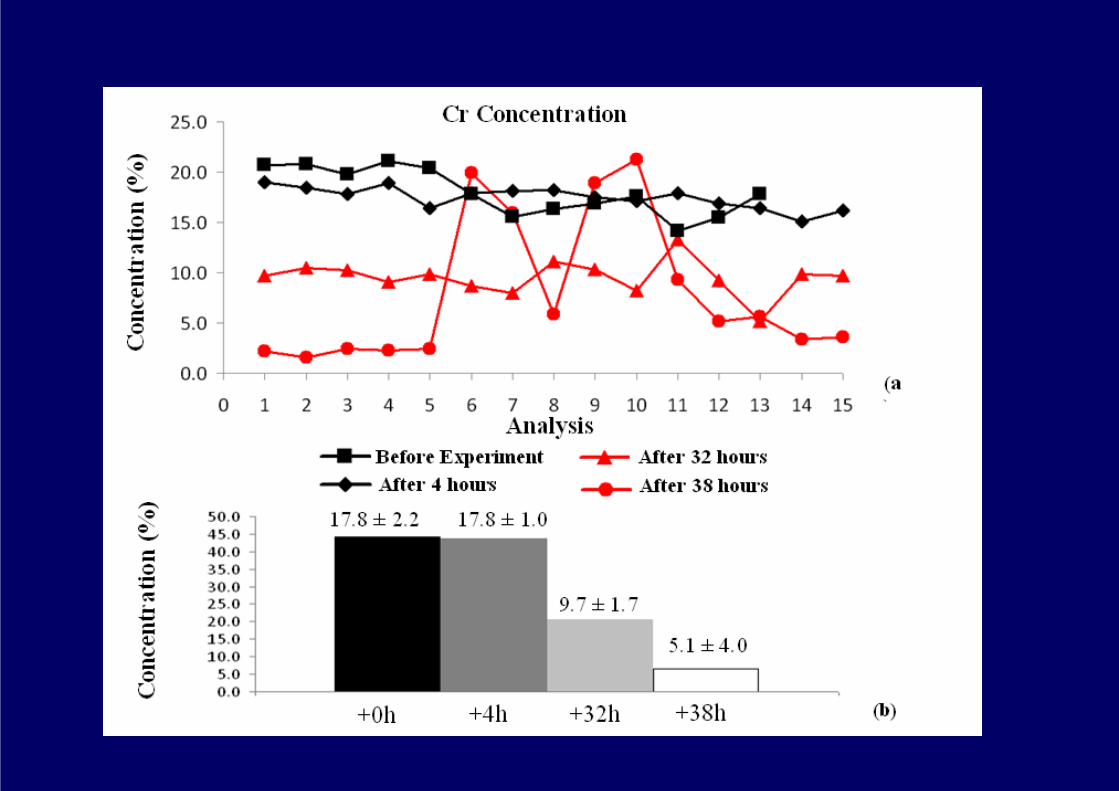
CompositionalCompositional AnalysisAnalysis ofof thethe ElectrodesElectrodesCo-Cr electrode surface AFTER the test


Electrode Ni-Fe: Compositional Changes
58 2828 14Ni 2Si + 2n→
58 24 428 12 2Ni 2Mg + 2He + 2n→
56 52 426 24 2Fe Cr + He →
Ni (Ni (−−8.6%) = Si (+3.9%)8.6%) = Si (+3.9%) +Mg+Mg (+4.7%)(+4.7%)
Fe (Fe (−−3.2%) = Cr (+3.0%)3.2%) = Cr (+3.0%)

59 56 127 26 1Co Fe + H + 2n→
52 39 4 124 19 2 1Cr K + 2He + H + 4n→
Co (Co (−−23.5%) = Fe (+23.2%)23.5%) = Fe (+23.2%)
Cr (Cr (−−8.1%) + K8.1%) + K22COCO3 3 ((−−4.3%) = K (+12.4%) 4.3%) = K (+12.4%)
Electrode Co-Cr: Compositional Changes
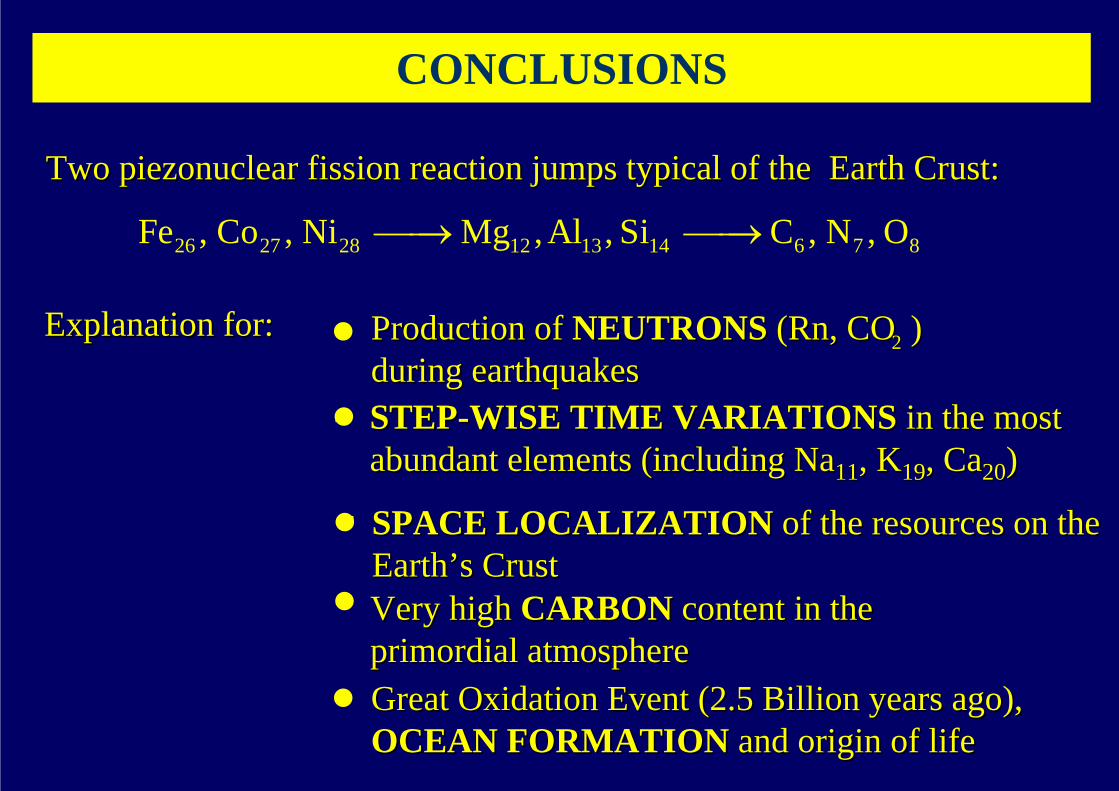
Two Two piezonuclearpiezonuclear fission reaction jumps typical of the Earth Crust:fission reaction jumps typical of the Earth Crust:
26 27 28 12 13 14 6 7 8Fe , Co , Ni Mg ,Al , Si C , N , O⎯⎯→ ⎯⎯→
Explanation for:Explanation for:
STEPSTEP--WISE TIME VARIATIONSWISE TIME VARIATIONS in the most in the most abundant elements (including Naabundant elements (including Na1111, K, K1919, Ca, Ca2020))
Great Oxidation Event (2.5 Billion years ago), Great Oxidation Event (2.5 Billion years ago), OCEAN FORMATIONOCEAN FORMATION and origin of lifeand origin of life
Very high Very high CARBONCARBON content in the content in the primordial atmosphereprimordial atmosphere
Production of Production of NEUTRONSNEUTRONS ((RnRn, CO , CO ) ) during earthquakesduring earthquakes
22
CONCLUSIONS
SPACE LOCALIZATIONSPACE LOCALIZATION of the resources on the of the resources on the EarthEarth’’s Crusts Crust

Evolution of the planets of the Evolution of the planets of the SOLAR SYSTEMSOLAR SYSTEM: : Mercury, Mars, Jupiter, Saturn (and the Sun itself)Mercury, Mars, Jupiter, Saturn (and the Sun itself)
The so-called COLD NUCLEAR FUSION may be explained by piezonuclear fission reactions occurring in the electrodes and due to HYDROGEN EMBRITTLEMENT, rather than by fusion of hydrogen isotopes
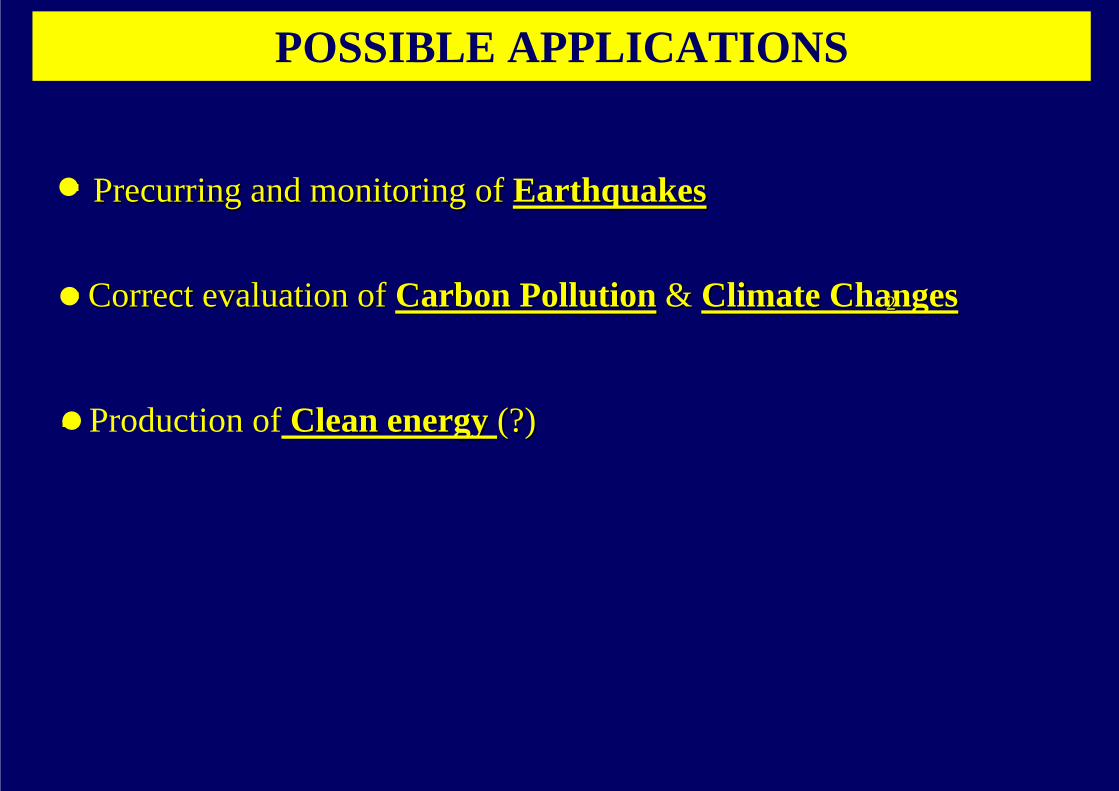
PrecurringPrecurring and monitoring of and monitoring of EarthquakesEarthquakes
Production of Clean energy Clean energy (?)(?)
Correct evaluation of Correct evaluation of Carbon PollutionCarbon Pollution & & Climate ChangesClimate Changes22
POSSIBLE APPLICATIONS


APPENDIX AAPPENDIX A

IRON DEPLETIONvs
CARBON POLLUTION
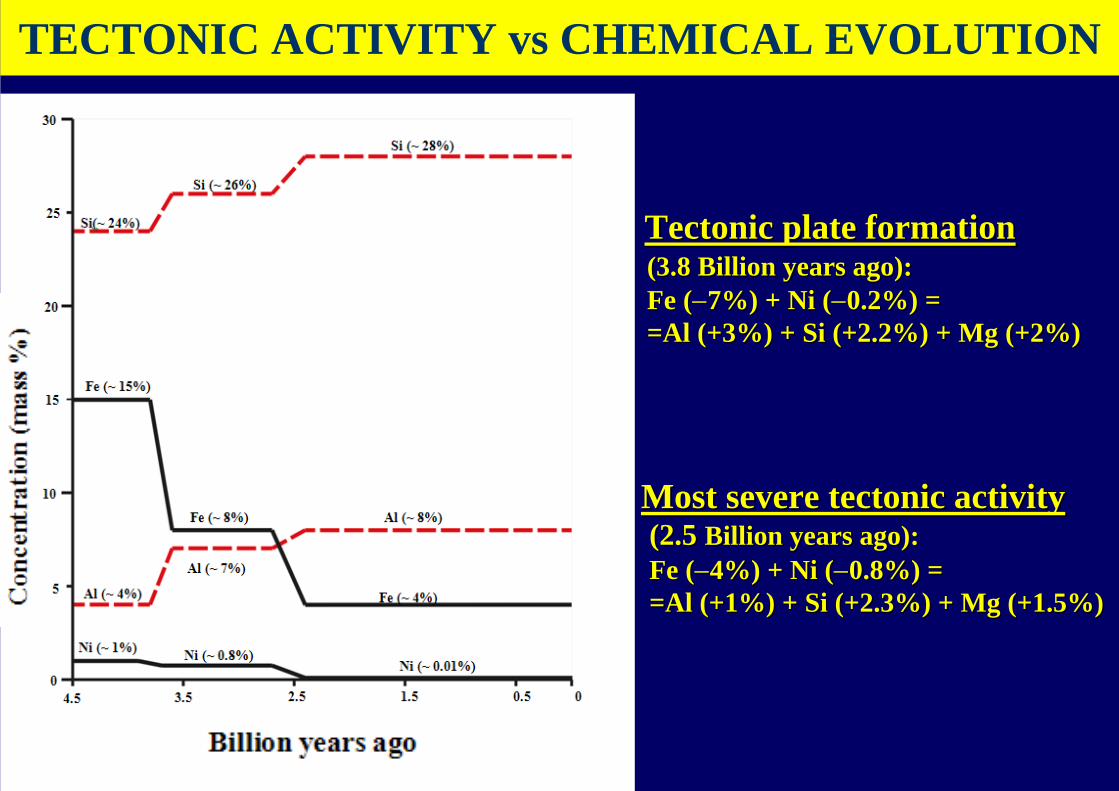
(3.8 (3.8 BillionBillion yearsyears ago): ago): Fe (Fe (−−7%) + Ni 7%) + Ni ((−−0.2%) = 0.2%) = =Al=Al (+3%) + Si (+2.2%) + Mg (+2%)(+3%) + Si (+2.2%) + Mg (+2%)
(2.5 (2.5 BillionBillion yearsyears ago): ago): Fe (Fe (−−4%) + Ni 4%) + Ni ((−−0.8%) =0.8%) ==Al=Al (+1%) + Si (+2.3%) + Mg (+1.5%)(+1%) + Si (+2.3%) + Mg (+1.5%)
Tectonic plate formationTectonic plate formation
Most severe tectonic activityMost severe tectonic activity
TECTONIC ACTIVITY vs CHEMICAL EVOLUTION

56 2726 13Fe 2Al 2n→ +56 28 2426 14 12Fe Si + Mg + 4n→
59 28 2727 14 13Co Si + Al + 4n→
(1)
(2)
(3)
Conjecture about ferrous elementsConjecture about ferrous elements’’ trasformationstrasformations in in the Earth Crustthe Earth Crust
59 2828 14Ni 2 Si + 3n→59 23 3528 11 17Ni Na + Cl + 1n→
(5)
(4)
56 40 1226 20 6Fe Ca + C + 4n→
(6)

(*)(*) World Iron Ore producers. Available at World Iron Ore producers. Available at http://www.mapsofworld.com/minerals/worldhttp://www.mapsofworld.com/minerals/world--ironiron--oreore--producers.html.producers.html.(**) (**) World Mineral Resources Map. Available at World Mineral Resources Map. Available at http://www.mapsofworld.com/worldhttp://www.mapsofworld.com/world--mineralmineral--map.htmlmap.html. .
Iron reservoirsMore than 40 Mt/year
from 0 to 40 Mt/year
Iron reservoirsMore than 40 Mt/year
from 0 to 40 Mt/year
Localization of iron minesLocalization of iron mines
from 10 to 40 Mt/year

(*)(*) World Iron Ore producers. Available at World Iron Ore producers. Available at http://www.mapsofworld.com/minerals/worldhttp://www.mapsofworld.com/minerals/world--ironiron--oreore--producers.html.producers.html.(**) (**) World Mineral Resources Map. Available at World Mineral Resources Map. Available at http://www.mapsofworld.com/worldhttp://www.mapsofworld.com/world--mineralmineral--map.htmlmap.html. .
Localization of Localization of AluminumAluminum minesmines
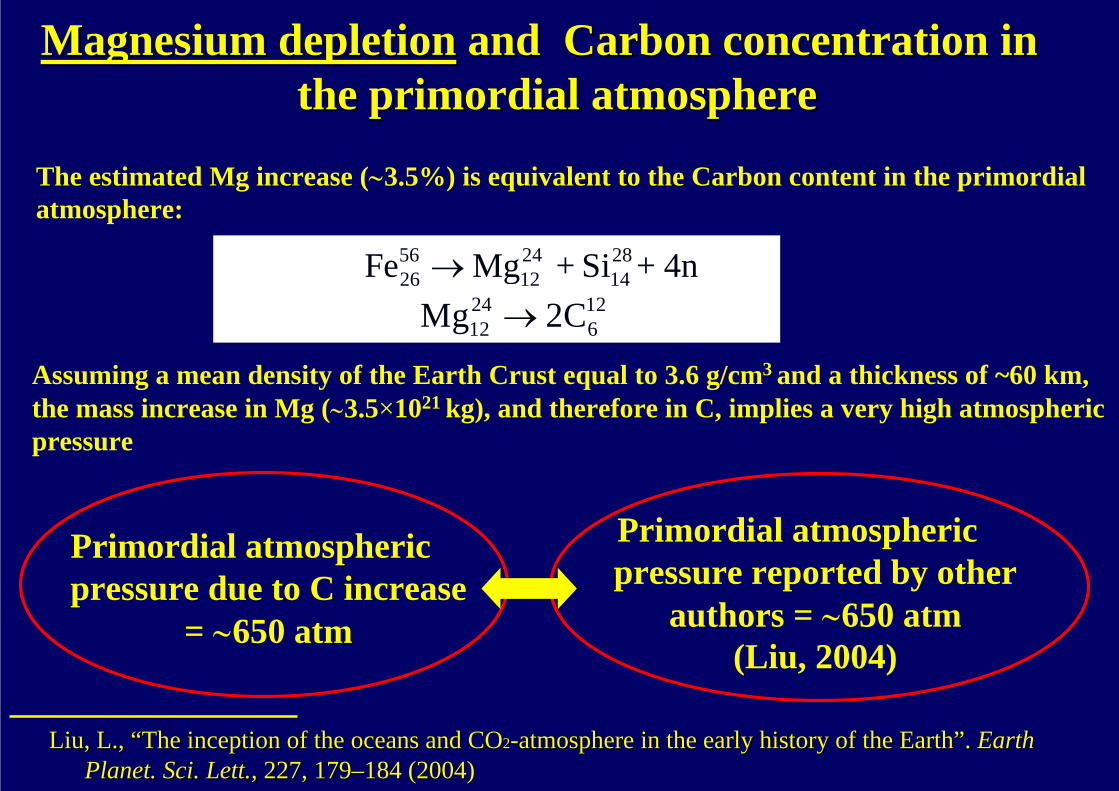
Magnesium depletionMagnesium depletion and Carbon concentration in and Carbon concentration in the primordial atmospherethe primordial atmosphere
The estimated Mg increase (∼3.5%) is equivalent to the Carbon content in the primordial atmosphere:
Assuming a mean density of the Earth Crust equal to 3.6 g/cm3 and a thickness of ~60 km,the mass increase in Mg (∼3.5×10²¹ kg), and therefore in C, implies a very high atmospheric pressure
Primordial atmosphericpressure due to C increase
= ∼650 atm
Primordial atmosphericpressure reported by other
authors = ∼650 atm(Liu, 2004)
24 1212 6Mg 2C →
56 24 2826 12 14Fe Mg + Si + 4n→
Liu, L., Liu, L., ““The inception of the oceans and COThe inception of the oceans and CO22--atmosphere in the early history of the Earthatmosphere in the early history of the Earth””.. Earth Earth Planet. Sci. Planet. Sci. LettLett.,., 227, 179227, 179––184 (2004) 184 (2004)
CALCIUMDEPLETION
vsOCEAN
FORMATION
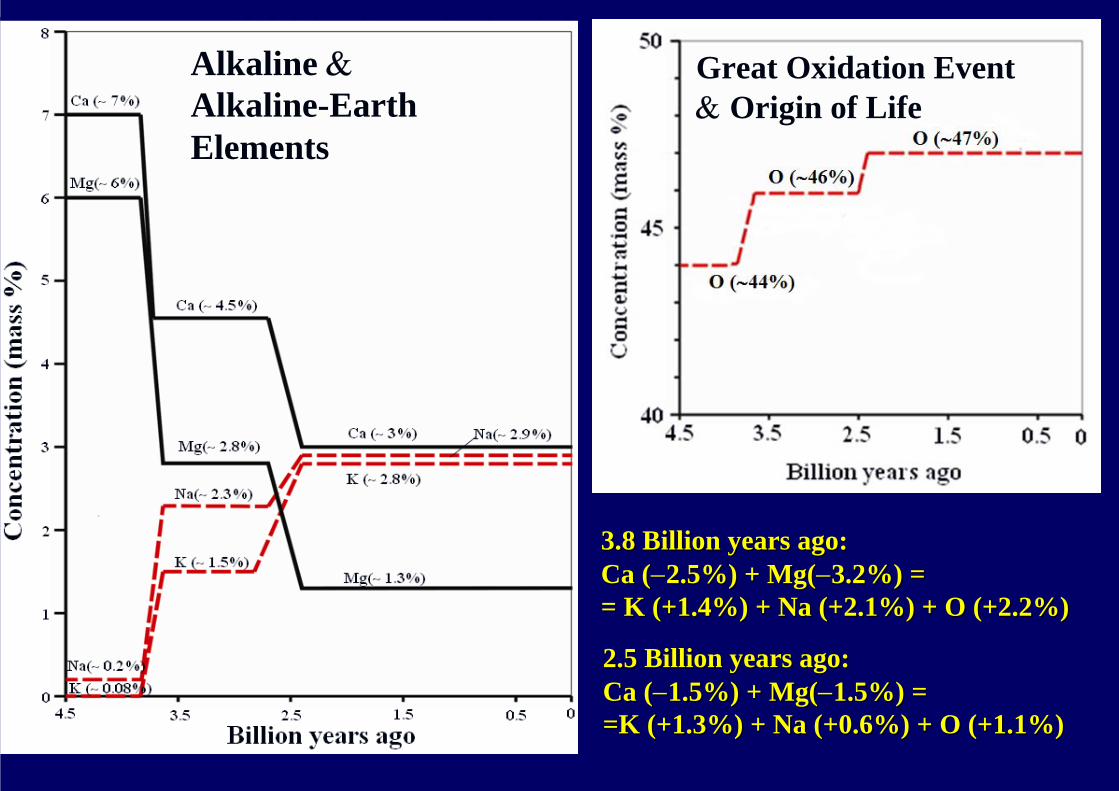
3.8 3.8 BillionBillion yearsyears ago: ago: Ca (Ca (−−2.5%) + Mg(2.5%) + Mg(−−3.2%) = 3.2%) = = K (+1.4%) + = K (+1.4%) + NaNa (+2.1%) + O (+2.2%)(+2.1%) + O (+2.2%)
2.5 2.5 BillionBillion yearsyears ago: ago: Ca (Ca (−−1.5%) + Mg(1.5%) + Mg(−−1.5%) = 1.5%) = =K=K (+1.3%) + (+1.3%) + NaNa (+0.6%) + O (+1.1%)(+0.6%) + O (+1.1%)
Great Oxidation Event& Origin of Life
Alkaline &Alkaline-Earth Elements

(7) 24 23 112 11 1Mg Na + H→24 16 1 412 8 1 2Mg O + 2H +He 2n→ +
40 39 120 19 1Ca K + H→40 16 120 8 1Ca 2O + 4H + 4n→
(9)
(10)
(11)
(12) 40 12 420 6 2Ca 3C + He→
(8)
24 1212 6Mg 2C →
Conjecture about AlkalineConjecture about Alkaline--Earth elementsEarth elements’’transformationstransformations
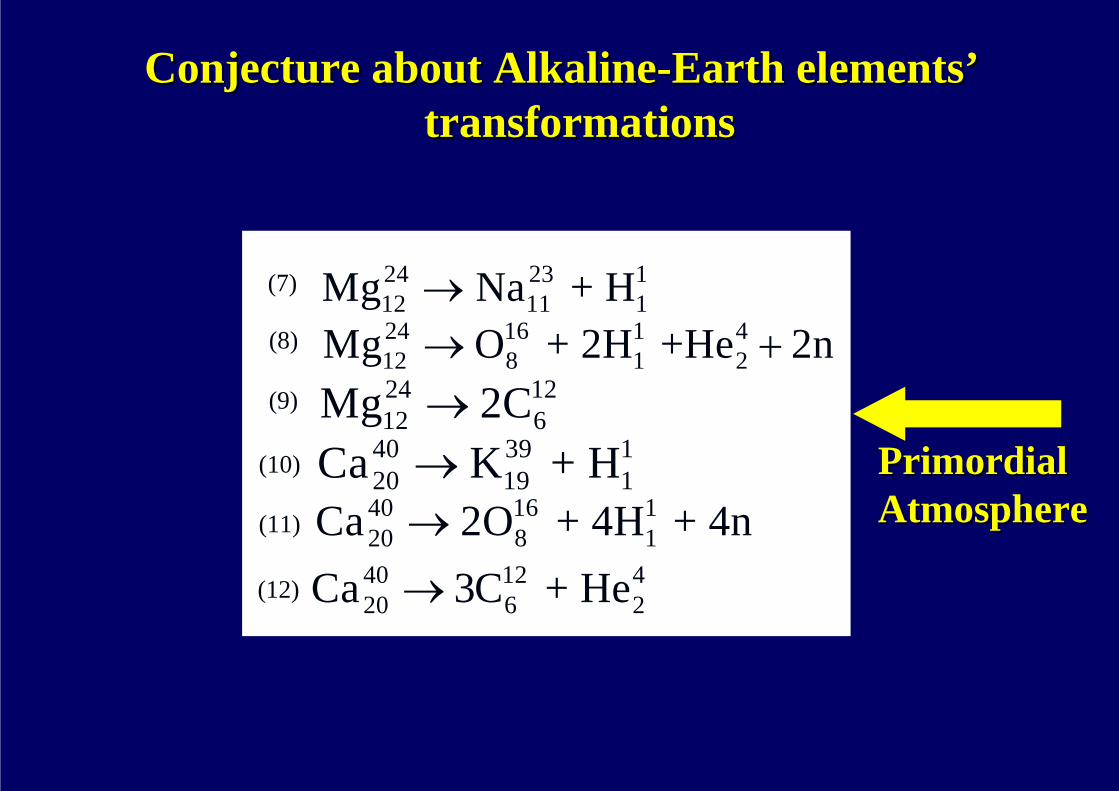
Primordial Primordial AtmosphereAtmosphere
Conjecture about AlkalineConjecture about Alkaline--Earth elementsEarth elements’’transformationstransformations
(7) 24 23 112 11 1Mg Na + H→24 16 1 412 8 1 2Mg O + 2H +He 2n→ +
40 39 120 19 1Ca K + H→40 16 120 8 1Ca 2O + 4H + 4n→
(9)
(10)
(11)
(12) 40 12 420 6 2Ca 3C + He→
(8)
24 1212 6Mg 2C →

Ocean Ocean FormationFormation
Conjecture about AlkalineConjecture about Alkaline--Earth elementsEarth elements’’transformationstransformations
(7) 24 23 112 11 1Mg Na + H→24 16 1 412 8 1 2Mg O + 2H +He 2n→ +
40 39 120 19 1Ca K + H→40 16 120 8 1Ca 2O + 4H + 4n→
(9)
(10)
(11)
(12) 40 12 420 6 2Ca 3C + He→
(8)
24 1212 6Mg 2C →

Calcium depletionCalcium depletion and ocean formationand ocean formation
Global decrease in Ca ( –4.0%) is counterbalanced by an increase in K (+2.7%) and in H2O (+1.3%).
40 39 120 19 1Ca K + H→
40 16 120 8 1Ca 2O + 4H + 4n→
Assuming a mean density of the Earth Crust equal to 3.6 g/cm3 and a thickness of ~60 km, the partial mass decrease in Ca due to the second reaction is about 1.41 ×10²¹ kg.
Considering a global ocean surface of 3.61 ×10¹⁴ m2, and an average depth of 3950 m, we obtaina mass of water of about 1.35 ×10²¹ kg
Partial decrease in Ca 1.41 ×10²¹ kg
Mass of H2O in the oceans today
1.35 ×10²¹ kg
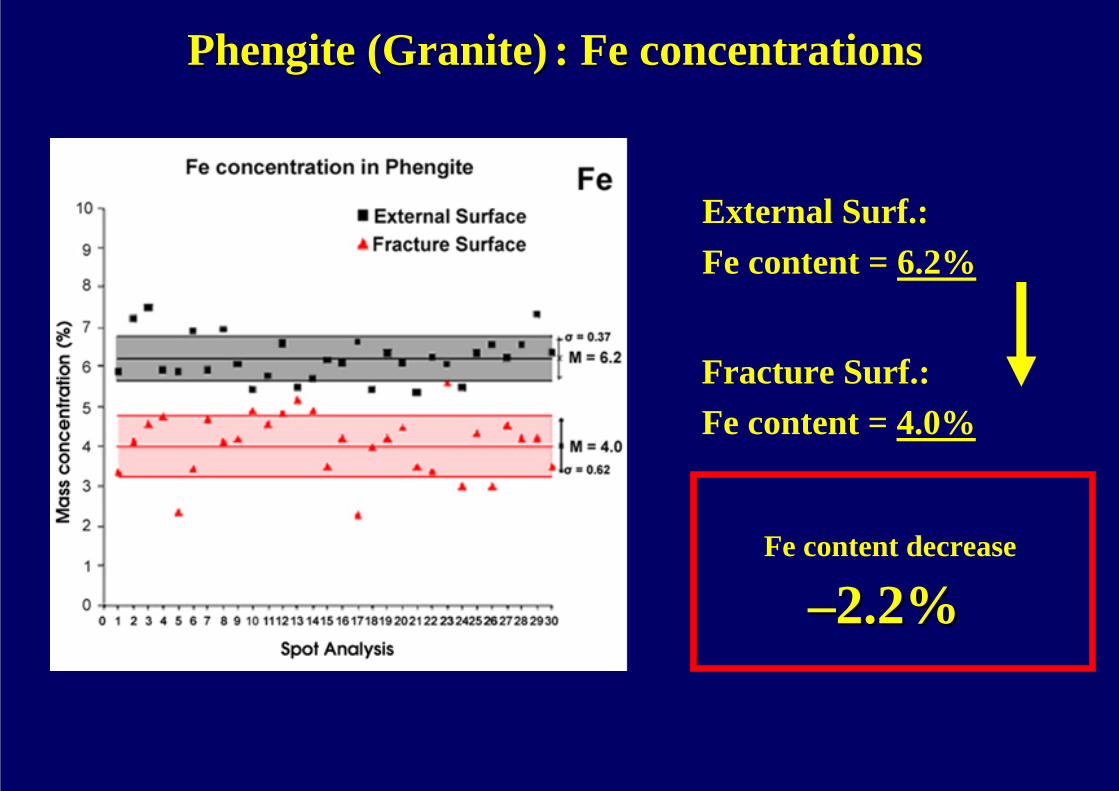
PhengitePhengite (Granite)(Granite) : Fe concentrations: Fe concentrations
External Surf.: Fe content = 6.2%
Fracture Surf.: Fe content = 4.0%
––2.2%2.2%Fe content decrease

External Surf.: Al content = 12.5%
Fracture Surf.: Al content = 14.5%
++2.0%2.0%Al content increase
PhengitePhengite (Granite)(Granite) : Al concentrations: Al concentrations

No appreciable variations can be recognized between the average No appreciable variations can be recognized between the average valuesvalues
PhengitePhengite (Granite)(Granite) : Si, Mg and K concentrations: Si, Mg and K concentrations

56 2726 13Fe 2Al 2n→ +
PhengitePhengite (Granite)(Granite)

BiotiteBiotite (Granite)(Granite): Fe concentrations: Fe concentrations
External Surf.: Fe content = 21.2%
Fracture Surf.: Fe content = 18.2%
––3.0%3.0%Fe content decrease

Fracture Surf.: Al content = 9.6%
++1.5%1.5%Al content increase
External Surf.: Al content = 8.1%
BiotiteBiotite (Granite)(Granite) : Al concentrations: Al concentrations
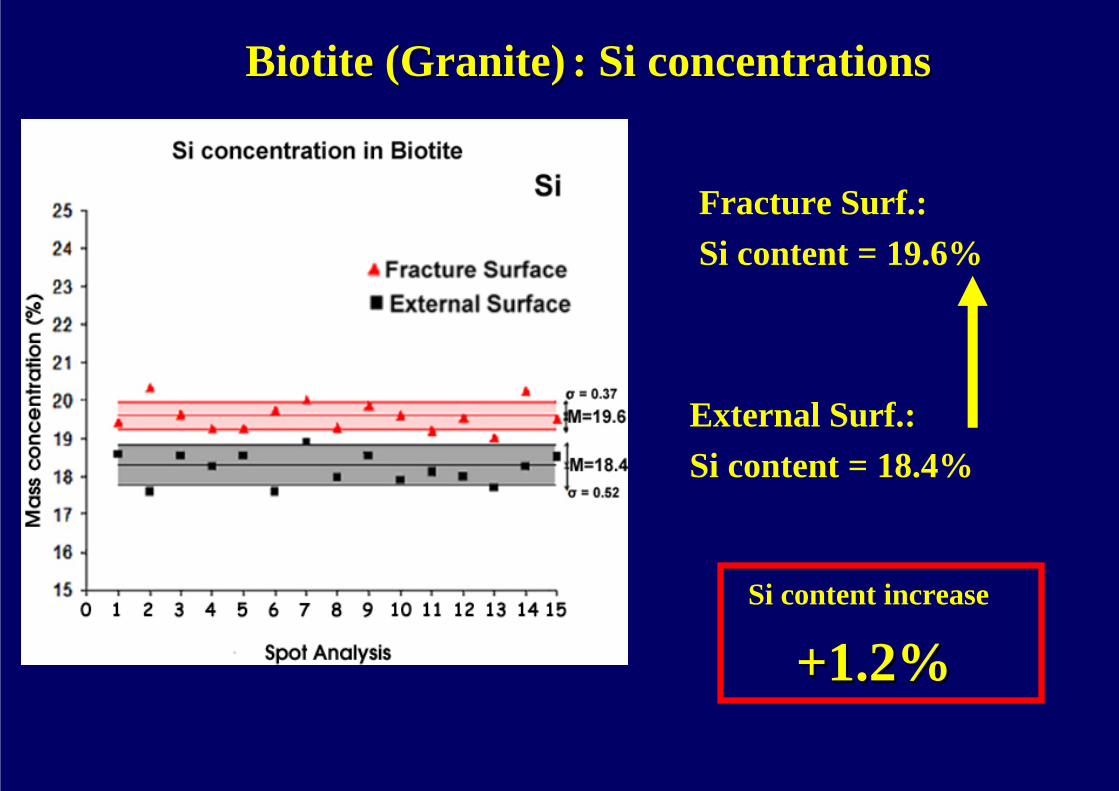
Fracture Surf.: Si content = 19.6%
++1.2%1.2%Si content increase
External Surf.: Si content = 18.4%
BiotiteBiotite (Granite)(Granite) : Si concentrations: Si concentrations

Fracture Surf.: Mg content = 2.2%
++0.7%0.7%Mg content increase
External Surf.: Mg content = 1.5%
BiotiteBiotite (Granite)(Granite) : Mg concentrations: Mg concentrations
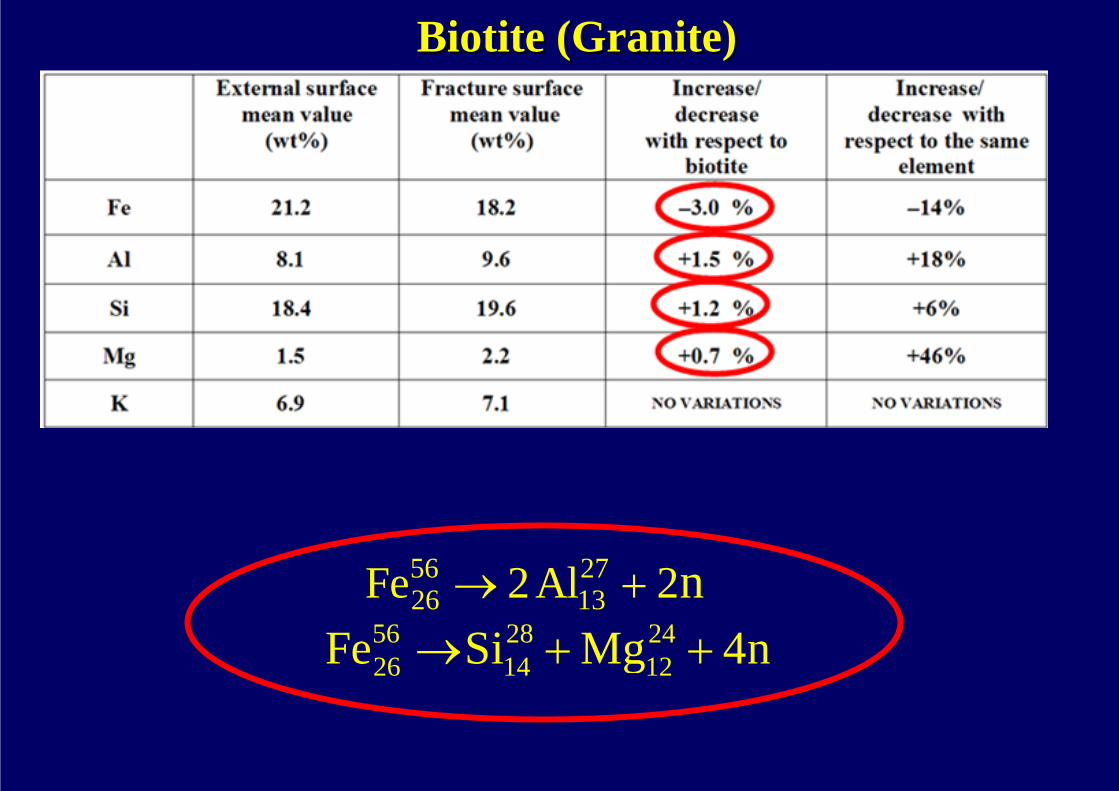
56 28 2426 14 12Fe Si Mg 4n→ + +
BiotiteBiotite (Granite)(Granite)
56 2726 13Fe 2Al 2n→ +

External Surf.: Fe content = 18.4%
Fracture Surf.: Fe content = 14.4%–– 4.0%4.0%
Fe content decrease
Olivine (Basalt): Fe concentrationsOlivine (Basalt): Fe concentrations

External Surf.: Fe content = 18.3%
Fracture Surf.: Fe content = 20.5%
+ 2.2%+ 2.2%Si content increase
Basalt (Olivine):Basalt (Olivine): Si concentrationsSi concentrations
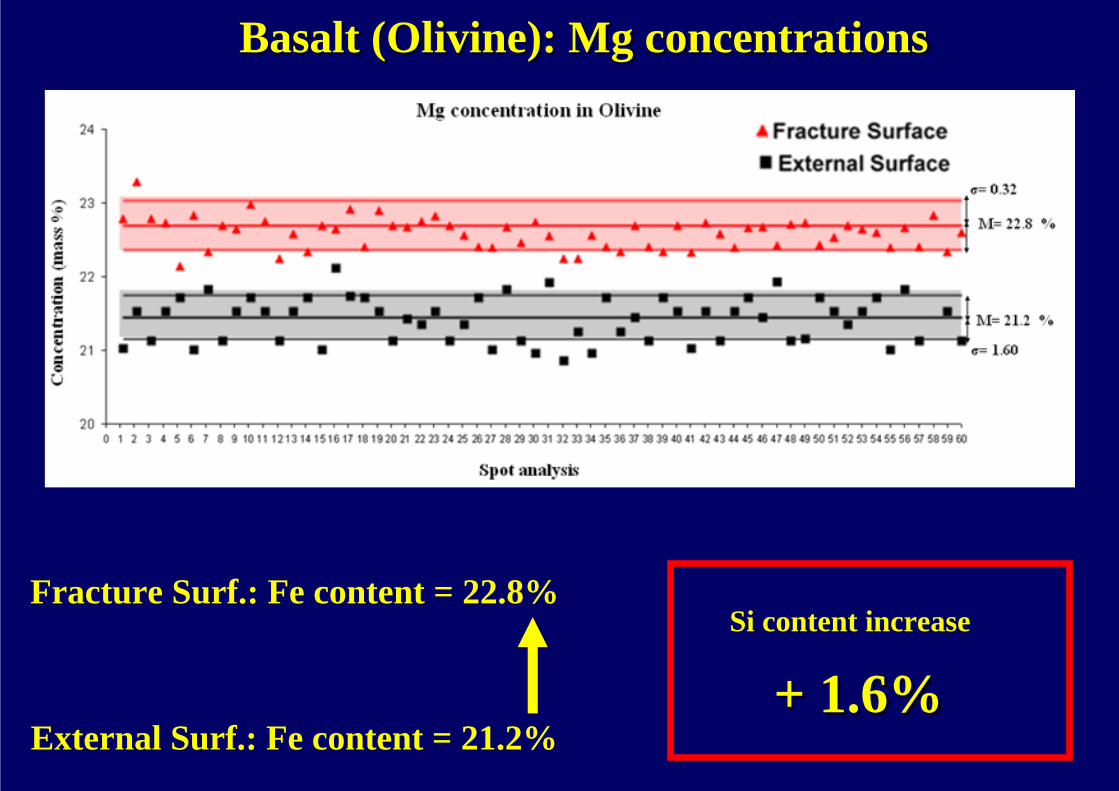
External Surf.: Fe content = 21.2%
Fracture Surf.: Fe content = 22.8%
+ 1.6%+ 1.6%Si content increase
Basalt (Olivine):Basalt (Olivine): Mg concentrationsMg concentrations

56 28 2426 14 12Fe Si Mg 4n→ + +
Olivine (Basalt)Olivine (Basalt)
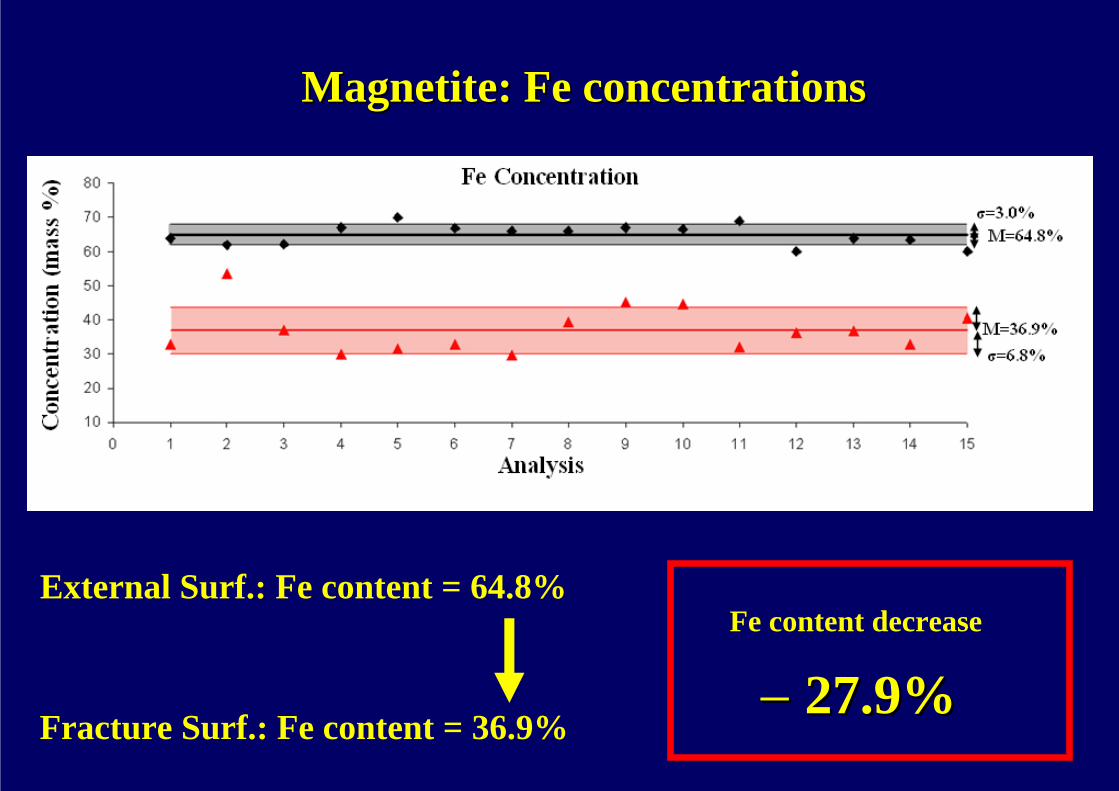
External Surf.: Fe content = 64.8%
Fracture Surf.: Fe content = 36.9%−− 27.9%27.9%
Fe content decrease
Magnetite:Magnetite: Fe concentrationsFe concentrations
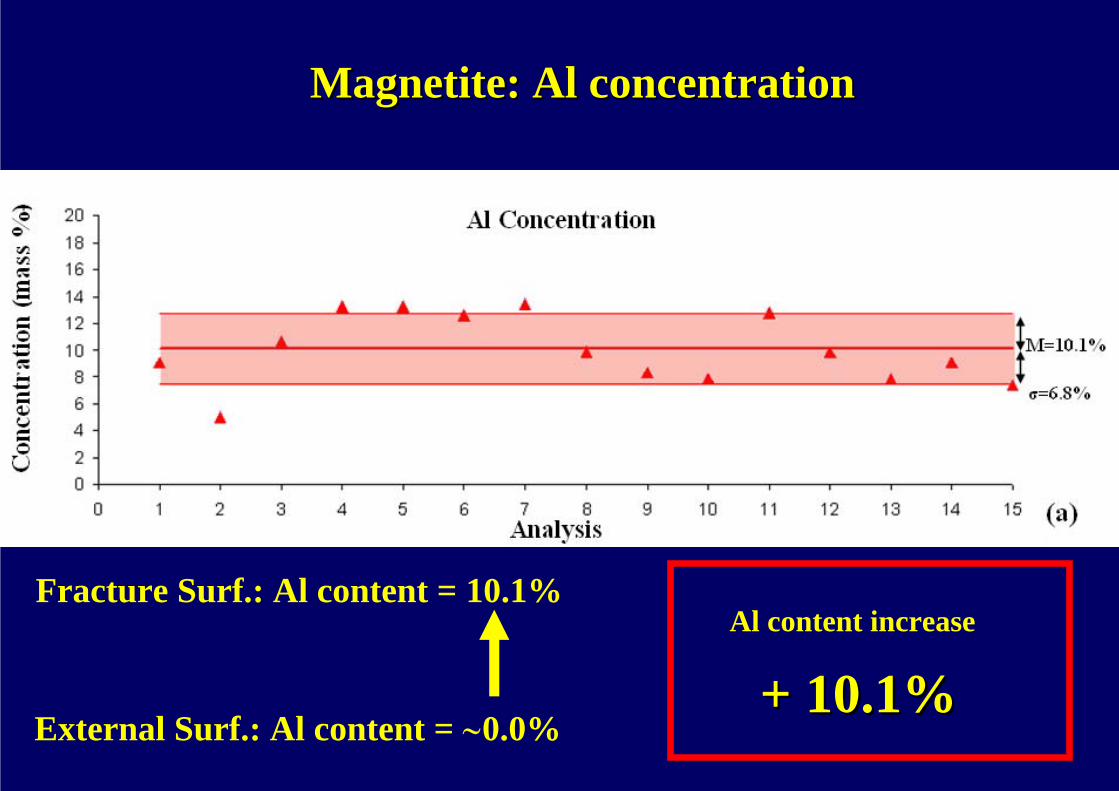
++ 10.1%10.1%Al content increase
Magnetite:Magnetite: Al concentrationAl concentration
External Surf.: Al content = ∼0.0%
Fracture Surf.: Al content = 10.1%
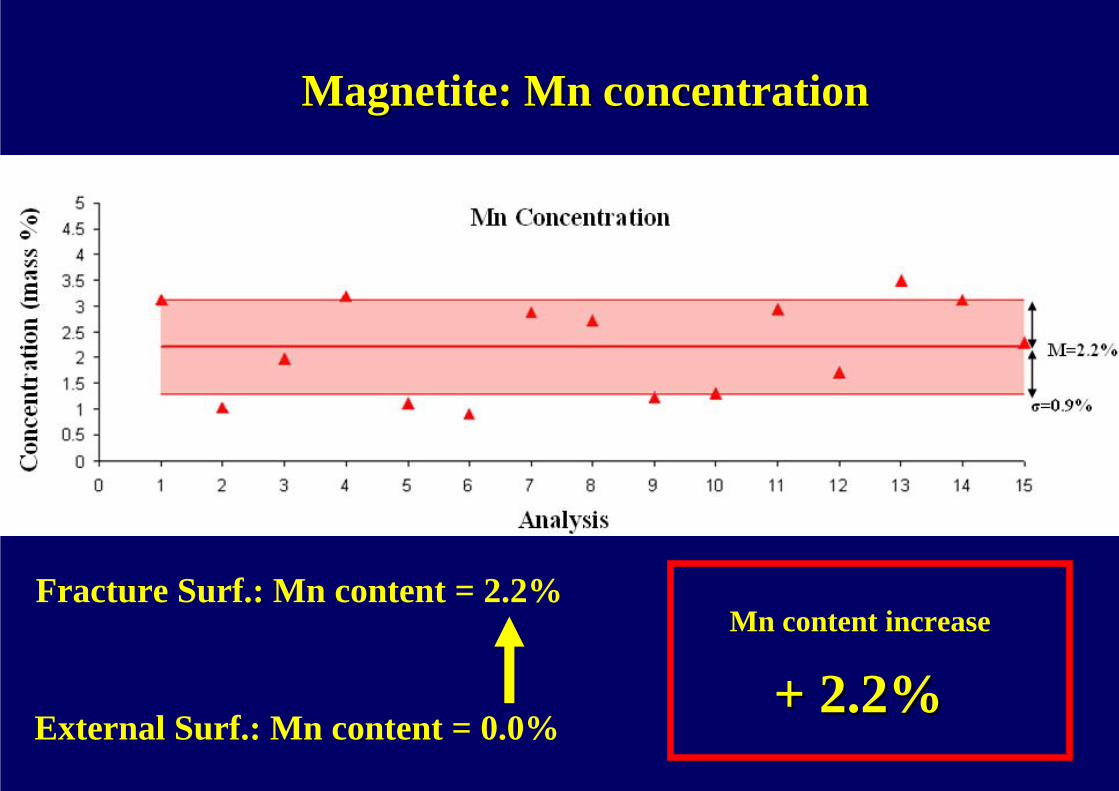
External Surf.: Mn content = 0.0%
Fracture Surf.: Mn content = 2.2%
++ 2.2%2.2%Mn content increase
Magnetite:Magnetite: MnMn concentrationconcentration

External Surf.: Si content = 1.6%
Fracture Surf.: Si content = 10.3%
++ 8.7%8.7%Si content increase
Magnetite:Magnetite: Si concentrationSi concentration

External Surf.: Fe content = 31.8%
Fracture Surf.: Fe content = 38.5%
++ 6.7%6.7%O content increase
Magnetite:Magnetite: O concentrationO concentration

MagnetiteMagnetite
56 2726 13Fe 2Al 2n→ +
56 55 126 25 1Fe Mn H→ +
56 28 16 426 14 8 2Fe Si O 2He 4n→ + + +

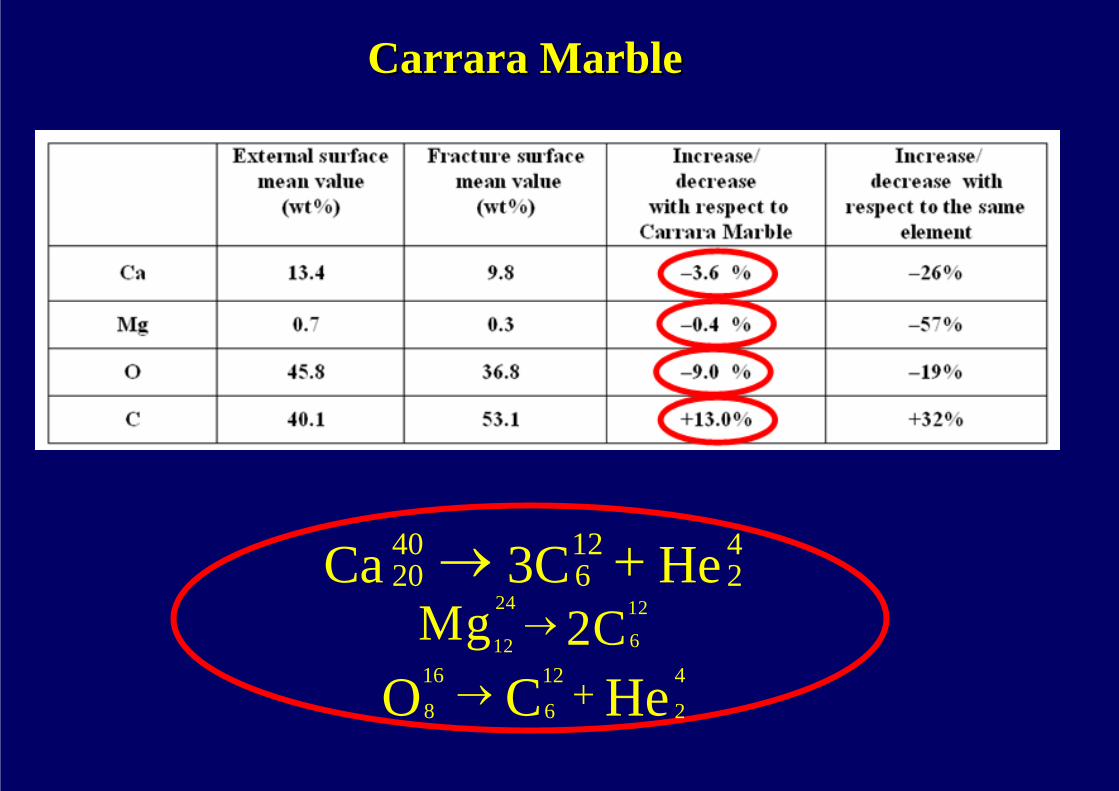
CarraraCarrara Marble: Ca concentrationsMarble: Ca concentrations
External Surf.: Ca content = 13.4%
Fracture Surf.: Ca content = 9.8%
––3.6%3.6%Ca content decrease
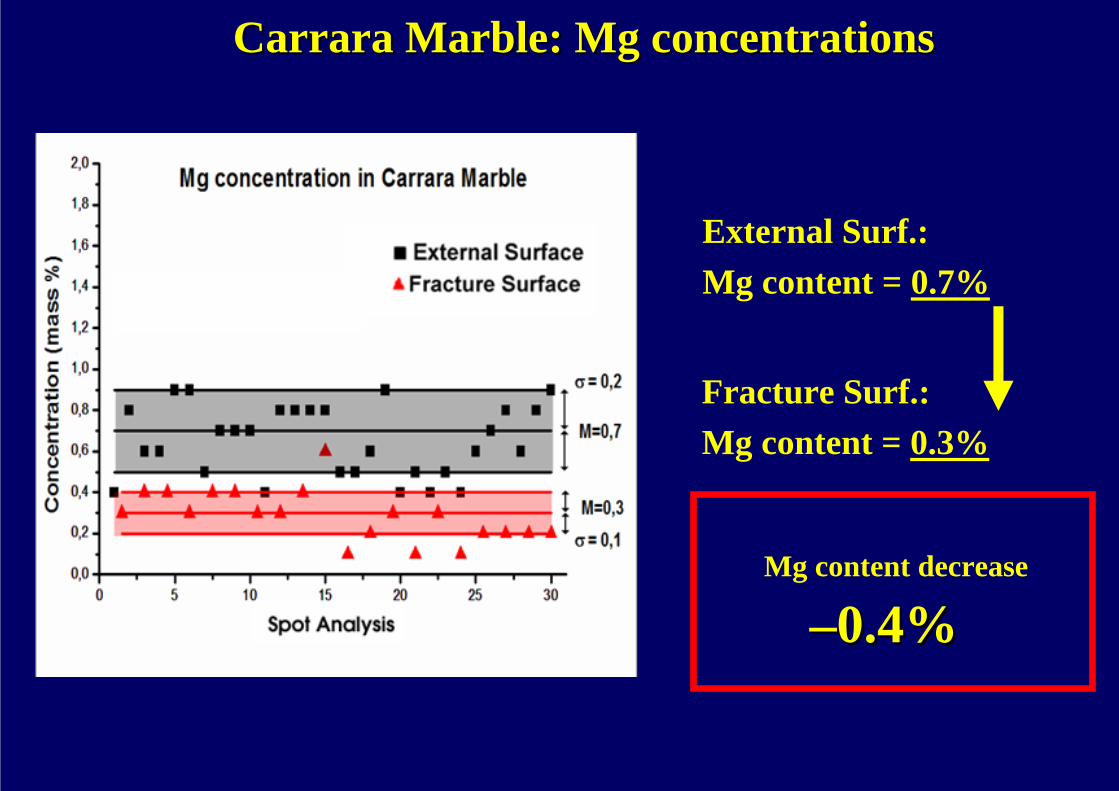
CarraraCarrara Marble: Mg concentrationsMarble: Mg concentrations
External Surf.: Mg content = 0.7%
Fracture Surf.: Mg content = 0.3%
––0.4%0.4%Mg content decrease

External Surf.: O content = 45.8%
Fracture Surf.: O content = 36.8%
––9.0%9.0%O content decrease
CarraraCarrara Marble: Marble: O concentrationsO concentrationsXX--ray Photoelectron Spectroscopyray Photoelectron Spectroscopy
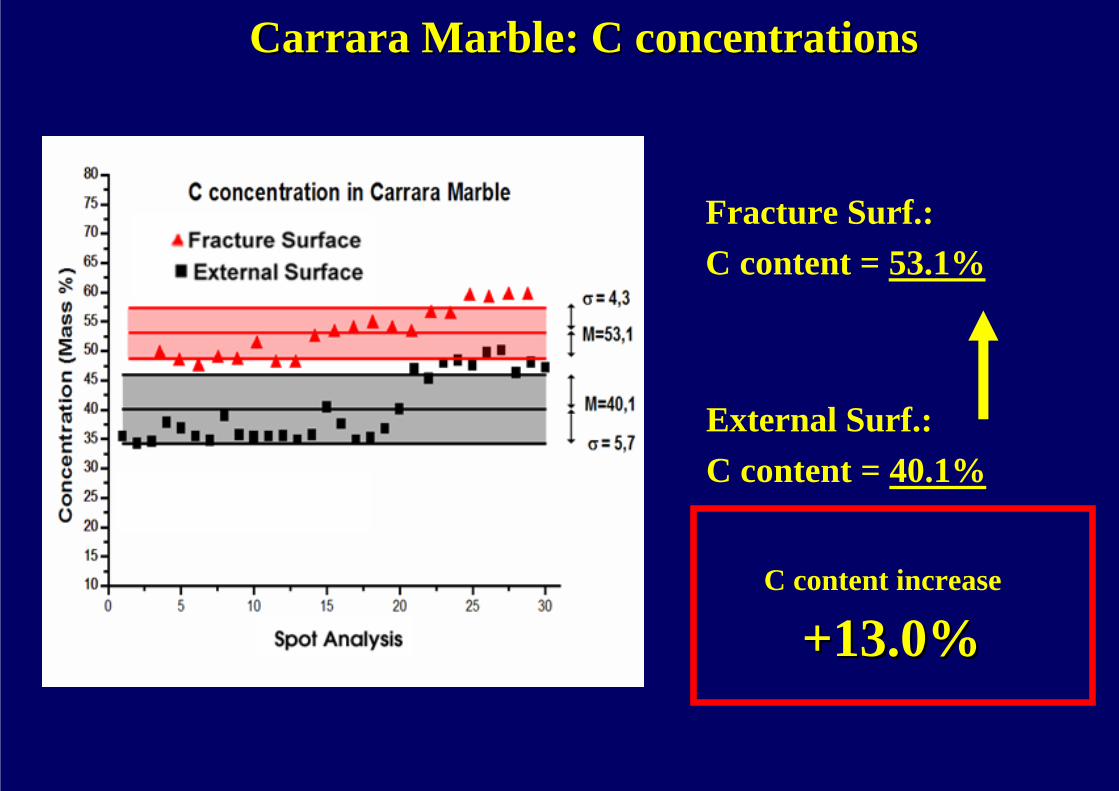
CarraraCarrara Marble: C concentrationsMarble: C concentrations
External Surf.: C content = 40.1%
Fracture Surf.: C content = 53.1%
+13.0%+13.0%C content increase

He3CCa 42
126
4020 +→
24 12
612Mg 2C→
HeCO 4
2
12
6
16
8 +→
CarraraCarrara MarbleMarble
APPENDIX BAPPENDIX B