hydrogen production by water gas shift reaction …
TRANSCRIPT

HYDROGEN PRODUCTION BY WATER GAS SHIFT REACTION FOLLOWING DRY
REFORMING OF BIOGAS METHANE IN MEMBRANE AND PACKED BED
TUBULAR REACTORS
A Thesis
Submitted to the Faculty of Graduate Studies and Research
In Partial Fulfillment of the Requirements
For the Degree of
Master of Applied Science
In
Process Systems Engineering
University of Regina
By
Ishioma Judith Oluku
Regina, Saskatchewan
December, 2013
Copyright 2013: I.J. Oluku

UNIVERSITY OF REGINA
FACULTY OF GRADUATE STUDIES AND RESEARCH
SUPERVISORY AND EXAMINING COMMITTEE
Ishioma Judith Oluku, candidate for the degree of Master of Applied Science in Process Systems Engineering, has presented a thesis titled, Hydrogen Production by Water Gas Shift Reaction Following Dry Reforming of Biogas Methane in Membrane and Packed Bed Tubular Reactors, in an oral examination held on November 12, 2013. The following committee members have found the thesis acceptable in form and content, and that the candidate demonstrated satisfactory knowledge of the subject material. External Examiner: Dr. Fanhua Zeng, Peroleum Systems Engineering
Supervisor: Dr. Raphael Idem, Process Systems Engineering
Committee Member: Dr. Hussameldin Ibrahim, Process Systems Engineering
Committee Member: Dr. David deMontigny, Process Systems Engineering
Committee Member: *Dr. Gang Zhao, Petroleum Systems Engineering
Chair of Defense: Dr. Renata Raina-Fulton, Department of Chemistry/Biochemistry *Not present at defense

i
ABSTRACT
The goal of this study was to develop a high performance catalyst for the water
gas shift reaction of reformate gas obtained from the dry reforming of biogas methane, in
order to produce bio-renewable hydrogen suitable for feed to a fuel cell. Accordingly,
three phases of the study were executed involving the identification and optimization of
the catalyst, application in a membrane reactor and kinetic studies of the water gas shift
reaction. A portfolio of ternary oxide catalysts with a nominal composition of
3Ni5Cu/CeZrM (where M = La, Mg, Y, Gd, Ca) were developed and prepared by
surfactant assisted route. A binary oxide catalyst was also prepared to serve as a
benchmark for comparing the effect of incorporating a promoter element.
The catalysts were screened for the water gas shift reaction at 500oC at
atmospheric pressure in a packed bed tubular reactor using 30% CO/balance N2 gas and
the catalyst with Ca promoter element showed the best performance. This catalyst was
further tested using reformate gas comprising of 46.2%CO, 8.5% CH4, 7.2% CO2 and
38.1 % H2 to simulate a realistic product stream from a biogas dry reformer. Again, the
Ca catalyst fared well even under such conditions without any deactivation, making it a
potential candidate for possible commercialization.
To optimize the catalyst preparation method, the method of impregnation was
varied using atmospheric pressure or vacuum conditions; the amount of surfactant used
and calcination temperature were also varied. Subsequently, the operating conditions
were also varied including reaction temperature, steam/CO ratio and reactor pressure. An
extended TOS stability test was performed for 12 hours to evaluate the continuous
performance of the catalyst over extended time duration. Several characterization

ii
techniques were also employed to investigate the correlation between the catalyst
structure and the performance exhibited. The techniques employed include TPR, TPO,
XRD, ICP-MS, N2 Physisorption, and H2 Chemisorption. Several statistical methods
including Analysis of Variance (ANOVA) and two level factorial design of experiment
(DOE) analysis were used to determine the main effects and interacting effects
contributing to the observed activity based on the catalyst structure and operating
conditions. The catalyst developed was further tested in a membrane reactor in order to
investigate the possibility of reducing the number of units usually required in a
conventional water gas shift process.
The results from the membrane tests showed a better performance compared to
the conventional packed bed reactor whilst allowing for the production of 100% pure
hydrogen. As part of the membrane studies, permeation tests were performed to correlate
the amount of hydrogen recovered through the membrane with pressure and temperature.
Furthermore, kinetic studies were performed on the packed bed tubular reactor operating
at atmospheric pressure and high pressure (200 psi) in addition to the membrane reactor.
The parameters varied were temperature ranging between 400 – 500oC and W/FA0
ranging from 1.1 to 1.6 g-cat.hr/mol. An empirical power law model was used to
correlate the resulting experimental data giving orders with respect to CO of 1.27, 1.78,
0.24 and activation energies of 137.2 kJ/mol, 190.3 kJ/mol and 99.8 kJ/mol for the
packed bed (atmospheric), packed bed (high pressure) and membrane reactors,
respectively. These kinetic results re-emphasized the benefit of incorporating a
membrane reactor into the water gas shift reaction process.

iii
ACKNOWLEDGEMENTS
I am most grateful to God Almighty for giving me the wisdom, strength and
patience to carry out this research program.
I wish to immensely thank my supervisor, Dr. Raphael Idem, for his guidance,
support and encouragement from the very beginning which enabled me go through this
Master’s program and finally complete this project successfully.
I am also grateful to Dr. Hussameldin Ibrahim for his assistance and helpful
suggestions within the course of this research and for his special contribution in the
aspect of kinetics and the use of the membrane reactor. I would like to thank Dr.
Ataullah Khan for his contributions especially in the aspect of catalysis.
I also wish to appreciate my family and friends for their prayers, understanding
and continuous encouragement throughout the program. Many thanks go to the members
of the H2 production research group of the University of Regina led by Dr Raphael Idem,
specifically Faezeh Sabri, Harry Inibehe and Ahmad Abdul Ghani for their
encouragement, support and invaluable suggestions.
I am grateful for the financial support from the Hydrogen Canada (H2CAN)
NSERC strategic networks through a grant to my supervisor, and the opportunities this
provided me to present this work in several conferences. I also acknowledge the
International Test Centre for CO2 Capture (ITC) for the opportunity to conduct the
experimental work in their labs. Finally I wish to thank the Faculty of Graduate Studies
and Research of the University of Regina for their financial support through the award of
several scholarships.
iv
TABLE OF CONTENTS
ABSTRACT i
ACKNOWLEDGMENTS iii
TABLE OF CONTENTS iv
LIST OF TABLES x
LIST OF FIGURES xi
NOMENCLATURE xvi
CHAPTER 1 INTRODUCTION 1
1.1 Hydrogen Production methods 2
1.1.1 Hydrocarbon Reforming 2
1.1.2 Gasification Process 4
1.2 Water Gas Shift Reaction 5
1.3 Knowledge Gap and Problem Identification 6
1.4 Research Objectives and Scope 8
1.4.1 Phase 1: Development of Catalyst 8
1.4.2 Phase 2: Membrane Reactor Studies 9
1.4.3 Phase 3: Kinetic Modelling 9
CHAPTER 2 LITERATURE REVIEW 11
2.1 Synopsis 11
2.2 Catalysts for Water Gas Shift Reaction 11
2.3 Membrane Reactor applications in the Water Gas Shift 18

v
Reaction
2.4 High Pressure Water Gas Shift Reaction 25
2.5 Kinetic Studies Water Gas Shift Reaction 26
CHAPTER 3 EXPERIMENTAL SECTION 32
3.1 Safety Precautions 32
3.2 Catalyst Preparation 33
3.2.1 Chemicals used for catalyst preparation 33
3.2.2 Equipment used for catalyst preparation 33
3.2.3 Preparation of ternary oxide support 34
3.2.4 Preparation of binary oxide support 35
3.2.5 Preparation of supported bimetallic catalysts 35
3.3 Catalyst Characterization 38
3.3.1 Instruments used for characterization 38
3.3.2 N2 Physisorption 40
3.33 H2 Chemisorption 40
3.3.4 X-ray Diffraction Measurements 41
3.3.5 Thermo-gravimetric Analysis 41

vi
3.3.6 Temperature Programmed Reduction 41
3.3.7 Temperature Programmed Oxidation 42
3.3.8 Inductively Coupled Plasma Mass 43
Spectrometry
3.4 Catalyst Activity Evaluation – PBTR 43
3.5 Membrane Reactor Studies 47
3.5.1 Membrane Characterization 50
3.5.2 Catalyst Evaluation in Membrane Reactor 52
3.6 Performance Evaluation Criteria 54
3.7 Kinetic Experiments 55
CHAPTER 4 RESULTS AND DISCUSSION 57
4.1 Catalyst Characterization 57
4.1.1 Catalysts 57
4.1.2 N2 Physisorption 57
4.1.3 H2 Chemisorption and ICP-MS 65
4.1.4 Temperature Programmed Reduction 67
4.1.5 Thermo-gravimetric analysis 70

vii
4.1.6 Temperature Programmed oxidation 72
4.1.7 X-ray Diffraction 74
4.2 Catalyst Activity Evaluation 78
4.2.1 Catalyst Screening 78
4.2.2 Parametric Study 84
4.2.2.1 Effect of Calcination temperature 84
4.2.2.2 Effect of Surfactant/Metal Ratio 87
4.2.2.3 Effect of Reaction Temperature 89
4.2.2.4 Effect of Feed Composition 92
4.2.2.5 Effect of steam/CO ratio 96
4.2.2.6 Effect of Pressure in PBTR 99
4.2.2.7 Statistical Analysis of operating
parameters affecting catalyst activity 102
4.2.2.8 Extended TOS Stability 105
4.3 Structure Activity Relationship 107
4.3.1 Statistical Analysis for Structure Activity
Relationship 112

viii
4.4 Membrane Characterization Results 117
4.5 WGSR in membrane reactor 122
4.6 Parametric Study in Membrane Reactor 126
4.6.1 Effect of catalyst weight and feed flow rate in MR 126
4.6.2 Effect of steam/CO ratio in Membrane Reactor 130
4.7 Results of Kinetic Experiments 133
4.7.1 Investigation of heat & mass transfer
limitations 133
4.7.1.1 Heat Transport Effects 133
4.7.12 Mass Transport Effects 136
4.7.2 Kinetic Rate Model 137
4.7.2.1 Power Law Model 137
4.7.2.2 Experimental Rates of Reaction 138
4.7.2.3 Effect of Pressure on Reaction rate 145
4.7.2.4 Estimation of Parameters of rate model 147
CHAPTER 5 CONCLUSIONS AND RECOMMENDATIONS 151
5.1 Conclusions 151

ix
5.2 Recommendations 154
REFERENCES 156
APPENDICES 169
Appendix A: Representative GC Data Sheets 169
Appendix B: Results for SAR empirical correlation using Minitab 175
Appendix C: Non linear regression results for reaction kinetics using
NLREG 178
Appendix D: Heat & Mass transfer resistance determination 181

x
LIST OF TABLES
Table 3.1 Portfolio of catalysts prepared 37
Table 3.2 Classification of catalyst characterization techniques 39
Table 3.3 Design of kinetic experiments 56
Table 4.1 N2 Physisorption Results 61
Table 4.2 H2-Chemisorption and ICP-MS results 66
Table 4.3 Carbon Propensity factors for 3Ni5Cu/CeZrM catalysts 73
Table 4.4: Experimental kinetic data 143
Table 4.5: Estimation of the values of the parameters of the models 148

xi
LIST OF FIGURES
Figure 3.1 Schematic diagram of experimental setup for water gas shift 45
reaction using PBTR
Figure 3.2 Schematic diagram of membrane reactor 48
Figure 3.3 Schematic diagram of membrane reactor experimental setup 49
Figure 4.1 (a) N2 isotherms of CeZrM supports 59
Figure 4.1 (b) N2 isotherms of 3Ni5Cu/CeZrM catalysts 60
Figure 4.2 (a) Variation of PV/SA with surfactant/metal ratio 64
Figure 4.2 (b) Variation of pore size with calcination temperatures 64
Figure 4.3 TPR profiles for CeZrM supports and 3Ni5Cu/CeZrM catalysts 69
Figure 4.4 TGA pattern for 3Ni5Cu/CeZrM, M=La and Ca 71
Figure 4.5 (a) XRD pattern for 3Ni5Cu/CeZrM, M= Gd and Mg 75
Figure 4.5 (b) XRD pattern for 3Ni5Cu/CeZrM, M=La and Y 76
Figure 4.5 (c) XRD pattern for 3Ni5Cu/CeZrM, M=Ca for S/M = 0 and 1.25 77
Figure (4.6a) Performance evaluation of 3Ni5Cu/CeZrM catalysts (normal 81
atmospheric impregnation) for water gas shift reaction using
30%CO/balance N2 at 5000C in PBTR at atmospheric pressure.

xii
Figure (4.6b) Performance evaluation of 3Ni5Cu/CeZrM catalysts (vacuum 82
impregnation) for water gas shift reaction using 30%CO/balance N2
at 161sccm and 5000C in PBTR at atmospheric pressure.
Figure (4.6c) Turnover frequency of 3Ni5Cu/CeZrM catalysts 83
Figure (4.7) Effect of variation of calcination temperatures on activity of 86
3Ni5Cu/CeZrCa catalyst using 30%CO/balance N2 at 5000C in
PBTR at atmospheric pressure.
Figure (4.8) Effect of surfactant/metal ratio on activity of 3Ni5Cu/CeZrCa 88
catalyst using 30%CO/balance N2 at 5000C in PBTR at atmospheric
pressure.
Figure (4.9a) Effect of reaction temperature on activity of 3Ni5Cu/CeZrCa 90
catalyst using 30%CO/balance N2 at 5000C in PBTR at atmospheric
pressure.
Figure (4.9b) Effect of reaction temperature on product distribution of
3Ni5Cu/CeZrCa catalyst using 30%CO/balance N2 in PBTR at atmospheric
pressure. 90
Figure(4.10a) Comparison of 3Ni5Cu/CeZrCa and 3Ni5Cu/CeZr catalysts 94
using reformate gas at 5000C in PBTR at atmospheric pressure.

xiii
Figure (4.10b) Product distribution comparison of 3Ni5Cu/CeZrCa and
3Ni5Cu/CeZr catalysts using reformate gas at 5000C in PBTR at
atmospheric pressure. 94
Figure (4.11) Comparison of reformate and 30%CO/balance N2 feed using 95
3Ni5Cu/CeZrCa catalyst at 5000C in PBTR at atmospheric pressure.
Figure (4.12) Effect of steam/CO ratio using reformate gas as feed with 98
3Ni5Cu/CeZrCa catalyst at 5000C in PBTR at atmospheric pressure.
Figure (4.13) Effect of pressure on WGSR using reformate gas at 275sccm 101
gas with steam/CO ratio of 2.7 and 3Ni5Cu/CeZrCa catalyst at
500oC in PBTR
Figure (4.14) Main Effects ANOVA plot for parameters affecting catalyst activity 103
Figure (4.15) Interaction Effects plot for parameters affecting catalyst 103
Figure (4.16) Pareto plot for parameters affecting catalyst activity 104
Figure 4.17 Normal Probability Plot of effect of operating parameters on 104
conversion
Figure (4.18) Extended TOS stability test using reformate gas with steam/CO 106
ratio of 1.7 and 3Ni5Cu/CeZrCa catalyst at 5000C in PBTR at
atmospheric pressure.

xiv
Figure (4.19a) Structure activity relationship for 3Ni5Cu/CeZrM catalyst in 110
WGSR; (I) Activity versus Pore volume/surface area (II) Metal
dispersion (III) Carbon Propensity Factor (IV) Reducibility
Figure (4.19b) Structure activity relationship for 3Ni5Cu/CeZrM catalyst in 111
WGSR; (I) Activity versus Hammett Basicity(II) Basicity versus
Reducibility
Figure 4.20 Analysis of Variance plots for structure activity relationship; (I) Main
Effects Plot (II) Interaction Plot 114
Figure 4.21 Pareto Plot showing the contribution of each structural characteristic
to the catalytic activity 115
Figure 4.22 Radar Plot showing the contribution of each structural characteristic
to the catalytic activity 115
Figure 4.23 Parity plot of experimental versus predicted conversion 116
Figure 4.24 (a) Membrane Characterization Results in terms of H2
Recovery 120
Figure 4.24 (b) Membrane Characterization results showing Sievert’s 121
Figure (4.25a) WGSR performance in membrane reactor in terms of CO conversion
and H2 yield using reformate gas at 275sccm gas with steam/CO ratio

xv
of 2.7 and 3Ni5Cu/CeZrCa catalyst at 500oC in PBTR 124
Figure (4.25b) WGSR performance in membrane reactor in terms of H2 selectivity
and recovery using reformate gas at 275sccm gas with steam/CO ratio
of 2.7 and 3Ni5Cu/CeZrCa catalyst at 500oC in PBTR 125
Figure (4.26a) Effect of catalyst weight and flow rate on WGSR performance in 128
membrane reactor in terms of CO conversion and H2 yield
using reformate gas steam/CO ratio of 2.7 and 3Ni5Cu/CeZrCa
catalyst at 500oC at 200 psi.
Figure (4.26b) Effect of catalyst weight and flow rate on WGSR performance 129
in membrane reactor in terms of H2 selectivity and H2 recovery
using reformate gas steam/CO ratio of 2.7 and 3Ni5Cu/CeZrCa catalyst
at 500oC at 200 psi
Figure (4.27) Effect of steam/CO on WGSR performance in membrane reactor 132
using reformate gas and 3Ni5Cu/CeZrCa catalyst at 500oC at
200 psi
Figure 4.28 Conversion versus W/FA0 for all three systems using reformate 140
gas and 0.5g of 3Ni5Cu/CeZrCa catalyst
xvi
Figure 4.29 Rate-Pressure relationships of all three systems 146
Figure 4.30 Parity plot for the reaction rates of all three systems 148

xvii
NOMENCLATURE
Å Angstrom
A
Ag
Al2O3
atm
Au
BET
Pre-exponential factor
Silver
Aluminium oxide
Atmosphere (pressure unit)
Gold
Brunauer, Emmett and Teller
CH4 Methane
Cr Chromium
CO2 Carbon dioxide
Co Cobalt
CO Carbon monoxide
oC
ΔH
Degrees Celsius
Heat of reaction
CPF Carbon propensity factor
Cu
Ca
CZM
D
Dp
E
Eu
Copper
Calcium
Ceria-zirconia-metal oxide
Internal diameter of the reactor
Particle size of the catalyst
Europium element
Activation Energy

xviii
Fe Iron
GC
Gd
Gas chromatography
Gadolinium
H2
H2O
H2S
HP
ICP-MS
IUPAC
kJ
k
kPa
L
La
Mo
Mg
Mn
MR
mg
Ni
NH2
N2
P
Pe
Pe*
Hydrogen
Water
Hydrogen sulfide
High Pressure
Inductively Coupled Plasma-Mass Spectroscopy
International Union of Pure and Applied Chemistry
Kilojoule
Rate constant
Kilo Pascal
Catalyst bed height
Lanthanum
Molybdenum
Magnesium
Manganese
Membrane reactor
Milligram
Nickel
Hydrogen flux
Nitrogen
Pressure
Permeance
Permeability

xix
PBTR Packed Bed Tubular Reactor
pH
ppm
PV
Pt
Pd
psi
Rh
SA
SAR
sccm
SiO2
S/M
S/CO
Sr
Tmax
TCD
TGA
TOS
TPO
TPR
UHP
Vol.
W/FA0
WGSR
Negative logarithm of hydrogen ion concentration
Parts Per Million
Pore volume
Platinum
Palladium
Pound per square inch (pressure unit)
Rhodium
Specific surface area
Structure activity relationship
Standard cubic centimetre per minute
Silica
Surfactant/metal ratio
Steam/CO
Strontium
Temperature at maximum peak
Thermal conductivity detector
Thermo gravimetric analysis
Time on stream
Temperature programmed oxidation
Temperature programmed reduction
Ultra high purity
Volume
Weight time
Water-gas-shift

xx
wt.
XRD
Weight
X-ray diffraction
Y
Zn
Yttrium
Zinc
Zr
%
α
ᵟ
ɣ
Zirconium
Percent
Alpha
Delta
Gamma

1
CHAPTER 1
INTRODUCTION
There has been an ever increasing consumption of energy worldwide over the
past few decades. This trend is expected to continue far into the future. Much of the
world energy is typically derived from fossil fuels resulting in a corresponding increase
in greenhouse gas (GHG) emissions blamed for global warming and climate change
issues (Gawade et al., 2010). There is extensive research worldwide aimed at developing
methods and strategies to mitigate GHG emissions. Such strategies include either the
development of CO2 capture technologies or by the development and utilization of clean
renewable energy. One key source of clean and renewable energy is hydrogen which can
be used as a feed to a fuel cell – a device that converts chemical energy to electrical
energy (Naidja et al., 2003). Amongst the fuel cells, the polymer electrolyte membrane
fuel cell (PEMFC) is the most attractive because of its characteristic low temperature
requirement (80–1000C), high amount of current produced per unit volume, quick start-
up, suitability for alternating operation and compactness (Marcello et al., 2011).
The use of hydrogen as a potential source of clean energy has been known for
about two centuries since 1805 when Isaac de Rivaz built the first combustion energy
fueled with hydrogen (Abdollahi M. 2011). Hydrogen used as a fuel burns clean to
produce water without any carbon emission according to the equation;
2H2 + O2 → 2H2O + 572kJ ∆H = -286kJ/mol ------------ (1.1)
Hydrogen, though abundant in the atmosphere, does not exist in its elemental form and
therefore has to be formed either by electrolysis of water or by the reforming of
hydrocarbons mainly, fossil fuels (natural gas, coal, petroleum products) and biofuels

2
(Mendes et al., 2010). However, due to the uneconomical nature of electrolysis,
hydrocarbon reforming is a major means of producing hydrogen. Hydrogen can also be
produced by biological processes such as fermentation and photolysis (Levin et al.,
2004).
1.1 HYDROGEN PRODUCTION METHODS
1.1.1 Hydrocarbon reforming
The reforming reaction is a gas phase process which can produce hydrogen cost-
effectively and efficiently at the point of application, thereby meeting the requirements
of a hydrogen fuel cell (Idem et al., 2010). Partial oxidation, auto thermal reforming and
steam reforming are the three major methods of producing hydrogen from hydrocarbons
for fuel cell application. In addition, dry reforming, involving the reaction between
hydrocarbon and carbon dioxide can also be used in the production of hydrogen. Partial
oxidation involves the combustion of the fuel at high temperatures using a limited supply
of oxygen. On the other hand, steam reforming involves the reaction of the hydrocarbon
fuel with steam whereas auto thermal reforming is the combination of both steam and
partial oxidation reforming to produce hydrogen and carbon monoxide (Pastore et al.,
2010). The applicable chemical reactions are as follows:
Steam Reforming
CmHn + mH2O mCO + (m+1/2n) H2 ....................................................... (1.2)
Auto thermal Reforming
CmHn + 1/4mO2 +
1/2mH2O mCO + (
1/2m+
1/2n) H2 ................... (1.3)

3
Partial Oxidation Reforming
CmHn+ 1/2mO2 mCO +
1/2H2....................................................... (1.4)
Dry Reforming
CmHn + mCO2 2mCO + 1/2 H2....................................................... (1.5)
The steam reforming process alone produces 90% of hydrogen used
commercially. Typical hydrocarbons and oxygenated hydrocarbons that have been used
for the reforming process include methane (natural gas), methanol, ethanol, diesel,
glycerol and mixtures of the oxygenated hydrocarbon. It has been reported that methane
is the most common commercial raw material for hydrogen production by steam
reforming (Lee et al., 2012). Another potential raw material for producing hydrogen is
biogas produced by the anaerobic digestion of biodegradable waste because it is cheap,
readily available and serves as a waste-cleanup process since biogas is produced mainly
from landfills, in addition, its two key components – CH4 and CO2 – can be readily used
as raw materials for the dry reforming of methane to produce hydrogen (Saha, 2011).
According to Nauman and Myren (1995), the high CO2 content of biogas enables it to be
used directly for the production of hydrogen by the dry reforming reaction and the
subsequent reduction of the CO level to an acceptable composition by the water gas shift
reaction for use in a fuel cell. The electrical efficiency obtained by using biogas is
comparable to that obtained when natural gas is used, thus making it a viable source of
energy.

4
1.1.2 Gasification Process
Gasification is a process that involves the conversion of carbonaceous materials
at high temperature (700oC) into a gaseous product containing CO, CO2 and H2 in the
presence of controlled amounts of oxygen and/or steam without complete combustion
taking place. Gasification is typically carried out on coal or biomass under high
pressures. Biomass is derived from forest residues, agricultural products, municipal and
industrial wastes while coal can be obtained from natural reserves. Gasification thus has
the potential to reduce CO2 emissions and produce clean energy. The carbon dioxide
generated while producing hydrogen can be sequestered at the source of production and
is not released into the environment.
The hydrogen and carbon monoxide mixture accompanied by carbon dioxide which is
produced from reforming and gasification processes, typically known as syngas can be
used as the raw material for producing synthetic fuels according to the Fischer-Tropsch
(GTL) synthesis process or can be further processed by the water gas shift reaction to
produce pure H2 and CO2 so as to get a higher yield of hydrogen (Bharadwaj and
Schmidt, 1995) or to increase the ratio of H2 to CO to make the syngas suitable for the
Fischer-Tropsch (GTL) synthesis process.

5
1.2 WATER GAS SHIFT REACTION
The reforming reaction produces carbon monoxide (CO) alongside the hydrogen
which needs to be separated in order to obtain pure hydrogen feed with less than 10 – 20
ppm CO suitable for the PEMFC to avoid corrosion of the anode and enhance the fuel
cell efficiency. The water gas shift reaction (WGSR) is one of the several methods used
in purifying the hydrogen produced from hydrocarbon reforming and so far, has proven
to be the most technologically feasible purification method (Barbieri et al., 2008). The
water gas shift reaction occurs downstream of the reformer and involves the reaction
between carbon monoxide (CO) and steam (H2O) to form hydrogen and carbon dioxide
according to the following equation;
CO + H2O H2 + CO2 ∆H= - 41 kJ/mol ................................ (1.6)
The water gas shift reaction is kinetically and thermodynamically limited because it
is both a reversible and exothermic reaction. As an exothermic reaction, it requires low
temperature to promote the forward reaction; however, as a reversible reaction it also
requires a high temperature to favour its kinetics. Thus the reaction is conventionally
carried out in two reactors operating at high temperature (300-500oC) and low
temperature (200-300oC) utilizing Fe-Cr and Cu-ZnO- Al2O3 catalysts, respectively
(Wade, 2004). The product stream from this conventional system contains a mixture of
H2 and CO2 which is then separated downstream using methods such as methanation,
preferential oxidation (PROX), pressure swing adsorption (PSA), absorption with
physical solvents (Rectisol and Selexol) or chemicals such as MDEA.

6
1.3 KNOWLEDGE GAP AND PROBLEM IDENTIFICATION
Certain problems associated with the production and utilization of hydrogen need to
be addressed before it can replace fossil fuels. These include lack of infrastructure for
distribution and efficient storage (Elghawi et al., 2008). In the mean time, on board
hydrogen production can serve as a short term solution (Cheekatamarla et al., 2008).
However, this on-board production also has its setbacks such as the need for
compactness of process units and the performance of catalysts used. With respect to
catalysts, typical high temperature shift catalysts are not active at temperatures lower
than 300 °C, while Cu-ZnO-Al2O3 catalysts which are used for low temperature shift
degenerate above 250 °C. Furthermore, there are certain factors that make the
commercial WGS catalysts unsuitable for on board fuel processors. For instance, the
catalysts need to be activated by reduction. These catalysts can be pyrophoric in the
reduced state which could lead to sintering and subsequent deactivation of the catalyst.
Also, in the course of shutting down, these catalysts may reoxidize due to exposure to
condensing steam. Therefore, the catalyst could be prone to poor mechanical stability as
a result of its exposure to frequent start-ups and shutdowns. In addition, the conventional
catalysts are designed exclusively to catalyze the WGSR with the feed being CO and
H2O. However, in reformate gas (the products of dry reforming or gasification), for
which WGSR would be their realistic clean-up process, the feed would consist of CO2,
H2 or CH4 in addition to CO and H2O. It has been reported that the conventional
catalysts perform poorly (Kumar and Idem, 2007) if there is any variation of the typical
WGSR feed. Moreover, Chromium (Cr) which is present in high temperature shift (HTS)
catalyst is hazardous to the environment and its utilization should be kept at a minimum

7
(Newsome et al., 1980). Therefore the challenges involved with this process over the
past years include developing a suitable catalyst with high activity and stability (Naidja
et al., 2003) for WGSR process involving reformate gas.
Moreover, the conventional process for the water gas shift reaction involves two
shift reactors and several purification units downstream resulting in significant energy
and equipment requirements in order to meet the desired purity of hydrogen. This leads
to a reduced plant efficiency and hydrogen recovery (Zou et al., 2007; Marcello et al.,
2011). Several efforts have been made to simplify the conventional water gas shift
process such as the cyclic water gas shift reaction (Galvita and Sundmacher, 2007) and
sorption enhanced water gas shift reaction (Stevens et al., 2010). However, with the
recent development of membrane reactors which combine the reaction and separation
step in one unit, the traditional process can be redesigned in order to achieve more
compact plant size and improved yield (Mendes et al., 2010). Again, these membrane
reactors have specific requirements in the type of catalyst employed and so far, there has
not been any significant catalyst development suitable for use in membrane reactors as
more effort has been tailored to optimize membrane manufacture methods (Basile et al.,
1995), membrane material selection (Basile et al., 1996) and theoretical modeling
(Bracht et al., 1996).
Furthermore, kinetic studies and performance tests on water gas shift reaction of
reformate gas from dry reforming of biogas in a membrane reactor using similar catalyst
formulation has never been attempted in the literature, to the best of our knowledge, thus
making this current work unique.

8
1.4 RESEARCH OBJECTIVES AND SCOPE
Although there are several sources of syngas as identified above that could be used
as feed to the water gas shift reaction, the focus of this study was to use reformate gas
from dry reforming of biogas as the feed material for the water gas shift reaction. The
main objectives of this work were (i) to develop a catalyst suitable for the water gas shift
reaction using reformate gas, (ii) to study the effect of using a membrane reactor for the
water gas shift reaction, (iii) to develop intrinsic kinetics of the water gas shift reaction in
both the packed bed and membrane reactors. These objectives were mapped into three
phases.
1.4.1 Phase 1: Development of Catalyst
a) Evaluate the performance of a portfolio of catalysts for the water gas shift reaction
using pure CO as feed.
b) Test the best catalyst using a simulated reformate gas (from biogas dry reforming)
feed for the water gas shift reaction at atmospheric pressure in a packed bed
tubular reactor (PBTR).
c) Optimise the catalyst preparation method and reaction operating conditions.
d) Characterize the catalysts using bulk and surface techniques like temperature
programmed reduction (TPR), N2 physisorption, H2 chemisorption, X-ray
Diffraction (XRD), Thermo-gravimetric analysis, Inductively Coupled Plasma
(ICP) techniques.
e) Relate the structure and characteristics to the catalyst performance using structure-
activity relationships (SAR) for possible catalyst refinements and improvements.

9
1.4.2 Phase 2: Membrane Reactor Studies
a) Characterize the membrane reactor using different hydrogen compositions and
operating conditions.
b) Test the novel catalyst in the membrane reactor at high pressures.
c) Perform the WGSR in the packed bed tubular reactor at high pressures to compare
with the membrane performance.
d) Vary operating parameters such as flow rate, catalyst weight, and steam/CO ratio.
1.4.3 Phase 3: Kinetic Modelling
a) Perform kinetic studies on the three systems identified above: PBTR at
atmospheric pressure, PBTR at high pressures and Membrane reactor at high
pressures.
b) Derivation of power law rate model for the three systems above.
c) Parameter estimation and validation of the power law model.
The thesis is organized as follows:
Chapter 2 gives an extensive survey of the literature addressing the catalysts that have
been developed to date for the water gas shift reaction, kinetic studies and the application
of membrane reactors to the water gas shift reaction. Chapter 3 outlines the experimental
methods used in this research including the catalyst preparation method and
characterization techniques employed as well as the operating conditions, equipment and
performance evaluation criteria used in determining the activity of the developed
catalyst. Chapter 4 presents the results of this study obtained from each phase outlined

10
above alongside the justification of the results while chapter 5 gives the conclusions and
recommendations.

11
CHAPTER 2
LITERATURE REVIEW
2.1 Synopsis
In this section, extensive literature survey is presented that represents the core
areas covered in this work in order to put the research in perspective. This includes the
catalyst materials employed, catalyst preparation and characterization techniques used,
feed composition, reactor type and operating conditions employed. Studies on the
kinetics of the water gas shift reaction will be presented as well. Since the catalyst
developed in this work is suited for high temperature water gas shift, the review will
focus on high temperature shift catalysts (>3000C) that have been studied in literature.
2.2 Catalysts for Water Gas Shift Reaction
In addition to other conditions such as operating conditions and reactor type, the catalyst
composition and the preparation method also exert considerable influence on the activity
of the catalyst (Azzam et al., 2007). There are two important side reactions that may
occur during the water gas shift reaction. These are given as follows;
CO + 3H2 CH4 + H2O (Methanation) (2.1a)
CO2 + 4H2 CH4 + H2O (Methanation) (2.1b)
2CO C + CO2 (Boudouard Reaction) (2.2)
Methanation reduces the amount of hydrogen produced and can damage the catalyst due
to the exothermicity of the methanation reaction whereas the Boudouard reaction leaves
carbon deposits on the catalyst causing the catalyst to deactivate. Several researchers
have developed catalysts used for the water gas shift reaction in a fuel processor aimed at
avoiding the above side reactions. Some authors have focused on avoiding Cr in the

12
catalyst (Gawade et al., 2010), while others have focused on developing sulphur resistant
catalysts for the WGSR occurring downstream a reformer whose feed contains sulphur
such as off gas from a coal gasifier or even a natural gas reformer. These catalysts are
known as Sour Shift Catalysts (SSC).
Storch and Pinkel (1937) reported that a mixture of cobalt carbonate and small
amounts (5 - 25%) of copper oxide heated rapidly (in 3 minutes) from room temperature
to about 1100oC yield a catalyst with good activity and mechanical stability. They tested
the catalyst with reformate gas from natural gas steam reforming having a composition
of 68%H2, 23%CO, 1.5%CO2, 5%N2, 2% CH4, 0.5%O2 at 3100C for over 100 hours
using a high steam ratio of 4 and noticed a stable activity. However they observed that
the catalyst produced by rapid heating was sintered, while that produced from slower
heating was unsuitable. Also the catalyst deactivated in the presence of hydrogen
sulphide but could be regenerated in the presence of air. Co/Mn and CoCr2O4 WGS
catalysts which demonstrated 90% conversion with minimal methane formation have
also been used (Gottschalk et al., 1988; Mellor et al., 1997). More recently, Park et al.
(2000), Hla et al. (2011) and Osa et al. (2011) amongst others, have developed Mo and
Co based catalysts supported on Al2O3 with only slight variation from each group. For
instance, Park et al. (2000) and Laniecki et al. (2000) added nickel (Ni) to the active
metal and support respectively, and this was found to enhance the catalytic activity
whereas Nickolov et al. (2000) observed that the addition of potassium (K) improved the
activity and texture which was confirmed by activity test at 4000C under atmospheric
pressure and N2 physisorption test for BET surface area, respectively.

13
Other catalysts proposed for the water gas shift reaction include Ir/TiO2 and
Ru/Fe2O3 (Erdohelyi et al., 1996, Basinska and Domka, 1999). In the latter case, the
support was doped with Samarium (Sm), Lanthanum (La) or Cerium (Ce). It was
observed that Sm and La doped supports performed better at low temperatures whereas
Ce doped support performed better at a higher temperature of 350oC. Hua et al. (2005)
proposed the use of MgAl2O4 spinel support due to its thermal and mechanical stability
and impregnated this with ɣ-Fe2O3 while using Ru and La as promoters. This catalyst
gave a good conversion of 89% at 400oC with a low steam to gas ratio of 0.6.
Recently, the focus has moved to the use of supported noble metals such as Pt,
Pd, Rh, and Au as active metals which provide resistance to coking and offer high
activity and stability. For catalyst supports, ceria based supports are being explored for
the water gas shift reaction due to its oxygen storage property. However, the structure of
ceria has been found to be a contributing factor to the activity it exhibits. High activity is
favoured at low calcination temperatures were the crystallite size is small and is easily
reducible (Bunluesin et al., 1998; Thormann, 2008). In a similar study, Gorte and Zhao
(2005) observed that the effect of adding promoters was to improve the WGS activity for
ceria supported precious metals of Pt and Pd, and found out that the addition of Fe
drastically increased the catalyst activity. They also observed that the addition of Tb3+
,
Gd3+
, Y3+
, Sm3+
, Pr3+
, Eu3+
, and Bi3+
to ceria had no effect whereas the addition of Mo
reduced the activity. Gold has also been proposed by Karpenko et al. (2007) to promote
the WGS activity. However, according to Luengnaruemitchai et al. (2003), Pt/ceria had a
better catalytic activity over Au/ceria. These noble metal catalysts show a better
performance than the conventional ones but are very expensive. Meanwhile Liu et al.

14
(2005) reported that Pt/CeO2 deactivates under the frequent start ups and shutdown
experienced in a fuel cell due to the irreversible deposition on the catalyst surface of
carbonates from the reformate gas used. An in situ regeneration of the poisoned catalyst
with reformate is impossible but is possible with air. Again, in line with ceria
development, Zerva and Philippopoulos (2006) studied the effect of preparation method
on the activity of WGS catalysts (Cu-CeO2, Cu/CeO2-La2O3) using impregnation with
aqueous and organic solutions, as well as coprecipitation methods. They observed that
those prepared by the coprecipitation method gave the highest activity while those
prepared by impregnation gave the highest surface area. Also, amongst the impregnated
catalysts, those prepared with aqueous solution gave better activity over those prepared
with organic solutions.
It is more cost effective to develop cheap nickel-based catalysts which yield
similar performance to those of noble metal catalysts. Iwamoto et al. (1983) examined a
variety of metal ion exchanged zeolites for the water gas shift reaction at temperatures up
to 773K (500oC) using Mn, Co, Ni, Cu, Zn, Fe in the zeolites. They observed that
amongst the portfolio of metal ions tested, Cu and Ni showed the best performance and
related their performance to the electro negativities of the metal ions. Li et al. (2000)
studied the activity of Cu and Ni loaded cerium oxide prepared by co-precipitation-
gelation method using La as a structural stabilizer for ceria. They observed that Cu and
Ni increased the reducibility of ceria and though the catalyst did not require activation,
yet it retained high activity and stability up to 600oC. Hilaire et al. (2004) observed that
Ni/ceria had similar performance with Pd/ceria and were more active than Co/ceria and
Fe/ceria. Similarly, Huang et al. (2006) reported that increasing the Cu and Ni loading in

15
a Ni-Cu catalyst supported on Sm doped ceria increased the rate of the water gas shift
reaction over methanation reaction and performed better than α-Al2O3. Ni/Fe based
catalysts have also been used (Watanabe et al., 2009) in which it was reported that the
addition of Fe reduced methanation whilst Lee et al. (2011) doped the Ni-Fe catalyst
with Cs using reformate from methane steam reforming and assuming 100% methane
conversion.
The problem associated with using this type of catalyst (nickel based) is its easy
deactivation due to coking which stems from carbon deposition and sintering of the
nickel. Choudhary et al. (2002) proposed that composite oxides with perovskite structure
like LaNiO3, La0.8Ca(or Sr)0.2NiO3, and LaNi1−xCoxO3 (where x = 0.2–1) were coke
resistant. Also, Bolt et al. (1995) reported that NiAl2O4 catalyst offers less sintering of
the nickel as a result of its discontinuous interfacial layers. Methanation has been
reported to be minimized in a nickel based catalyst when Fe is added to a Ni-Al catalyst.
Redox supports like cerium oxide based solid solutions have been found to prevent
catalyst coking as a result of its ability to disperse the active component – Nickel. Ceria-
zirconia in particular are more advantageous when compared to other redox supports
because of their better redox characteristics (e.g. high oxygen storage capacity (OSC)
and oxygen buffer/transport capacity (OBC/OTC). On the other hand, zirconia (Zr)
offers good thermal stability to the catalyst (Idem et al., 2010; Khan et al., 2012). Ceria
has also been reported to increase the surface area and pore volume of the catalyst as
well as decrease the reduction temperature (Lilong et al., 2008) according to the BET
and TPR tests conducted.

16
Using these characteristics, Kumar and Idem (2007) developed a high
temperature Ni-Cu/CeO2-ZrO2 catalyst for the WGSR which could be used at
temperatures up to 700oC in a packed bed tubular reactor. The addition of Copper (Cu)
improves the selectivity to hydrogen. The metals were dispersed on the support by
wetness impregnation technique while the supports were prepared by surfactant
templating method because this method of preparation yields a mesoporous and
thermally stable catalyst. When this support is combined with suitable loadings of Ni
and/or Cu it results in high performance water gas shift catalysts. They also reported that
the mixed bimetal oxides in the support overcome methanation problems and both Ni
and Cu were used due to their respective properties of conversion and selectivity. Thus
this catalyst was suitable for use downstream of a natural gas dry reformer because it
worked well in the presence of reformate gas. Flytzani et al. (2004) also used CeO2
support with Cu as the active metal for the WGSR at temperatures below 4500C. They
however used urea as the surfactant to synthesize their support, whereas according to
Idem et al. (2010), cetyl-trimethyl-ammonium-bromate (CTAB) offers better activity
than urea. Other preparation routes used for WGS catalysts include flame synthesis (Pati
et al., 2009), deposition-precipitation (Lenite et al., 2011), mechano-chemical activation
(Andreeva et al., 2010), hard template and solution combustion synthesis (Galletti et al.,
2011), solution spray plasma technique which gave high dispersion of the active phase –
Ni (Watanabe et al., 2009). In some cases, sintering occurred or a large amount of
methane was formed due to the preparation method. Galletti et al. (2011) had used a
simulated reformate gas comprising of 5%CO, 20%H2O, 11%CO2 and 40% H2.

17
However, the problem with the ceria-zirconia support is that it deactivates in the
presence of steam as discussed by Khan et al. (2012), in the dry reforming of methane
due to the inherent hydrophilic nature of the ceria-zirconia support which increases the
affinity of the support to water inhibition of active sites, which deactivates the catalyst.
The addition of foreign or dopant cations can be used to adjust the catalytic activity
including its hydrophilicity/hydrophobicity. In conjunction with this, Khan et al. (2012)
used several aliovalent and isovalent cations (Al, Y, La, Pr, Sm, Tb, Ca, Sr, Ba, Hf), to
form ternary oxide supports of the general formula Ce0.5Zr0.33- M0.17O2-δ using the
surfactant (CTAB) - assisted route. The catalyst activity was tested for CO2 reforming of
CH4 at 800oC with addition of steam, and was compared to the performance of the binary
support catalyst. They also performed low-temperature (500oC) and long term
(100hours) tests for the CO2 reforming of CH4 including steam in order to test for
possible membrane reactor application. Ternary oxide catalysts with the promoter
elements Ca, La and Y, showed exceptional activity and tolerance to steam. This is
concurrent with other literature reports in which Lanthanum (La) and Yittrium (Y) have
been added as promoters (Tabakova et al., 2007; Yusheng et al., 2009). Magnesium and
Gadolinium have also been reported to improve the Ce-Zr support in reforming
applications (Sengupta et al., 2012; Haryanto et al., 2009) although Mg gave higher
activity and has also been used to dope alumina support (Yixin et al., 2009, Saha, 2011)
towards improvement of the overall catalytic activity. Following this review and the
cognizance of the need for a novel catalyst for the WGSR at high temperatures, a
portfolio of ceria based ternary oxide supported catalysts were developed and tested for
the WGSR using some of the promoter elements identified above.

18
2.3 Membrane Reactor application in the Water Gas Shift Reaction
In all the literature cited above, the reactions were performed at atmospheric
pressure and in a fixed bed reactor. Membrane reactors have been widely studied over
the years for hydrogen production because they have been observed to enhance the
hydrogen yield and reactant conversion either as a reforming unit or a water gas shift
reactor. Kikuchi et al. (1989) reported a conversion of 100% using a palladium based
membrane reactor at a pressure of 5 atm and temperature of 400oC in the presence of a
Fe-Cr high temperature catalyst. Seok and Hwang (1990) also performed WGSR in a
porous vycor glass membrane coated with ruthenium chloride serving as the catalyst,
from which they obtained a conversion of 85% less than the equilibrium conversion of
99% at 430K (157oC). The membrane reactor typically comprises of a membrane
enclosed inside a reactor shell which is selectively permeable to one of the reaction
products, in most cases hydrogen, and a catalytic bed outside the membrane tube. The
reaction takes place on the catalyst in the retentate side and the hydrogen produced is
transferred to the permeate side, thus the continual removal of a product, according to Le
Chatelier’s principle promotes the forward reaction (Kim et al., 2012). The rate of
permeation of the species across the membrane is dependent on temperature and trans-
membrane pressure acting as the driving force (Bracht et al., 1996). The trans-membrane
pressure is achieved by operating at a high pressure on the retentate side while the
permeate side is kept at atmospheric pressure in the presence or absence of an inert
sweep gas.
According to Mendes et al. (2010), it is better to apply a membrane reactor as a
water gas shift reactor rather than as a reforming unit because when used as a reforming

19
unit, the membrane metal may be damaged due to the formation of hotspots in addition
to reducing the overall hydrocarbon conversion; for instance, high pressure increases the
yield of hydrogen as a result of increasing permeation; however, the number of moles in
the forward steam reforming reaction is increased thereby enhancing the reverse reaction
rate and reducing the hydrocarbon conversion depending on the operating conditions.
Consequently, the use of membranes for the hydrogen recovery enhancement through the
WGS reaction yields a better process efficiency.
It has also been reported that the incorporation of a membrane reactor reduces the
amount of catalyst required (Brunetti et al., 2007). In a similar study, Barbieri et al.
(2008), used CuO/CeO2 in a Pd-alloy MR working at 280oC and 1000 kPa (9.9 atm) to
reach 90% of the equilibrium conversion with a reduced catalyst volume of 25% of that
used in a conventional reactor. The use of membrane reactors in the WGSR thus offers
the following advantages:
It allows the use of high temperatures to achieve higher CO conversion thus
overcoming the thermodynamic equilibrium restriction (Ciocco et al., 2003)
It reduces the steam-to-CO ratio requirement of the WGSR from 9:1 for
conventional WGS reactors to 2:1 thereby reducing energy requirement (Basile et
al., 2001),
It integrates chemical reaction with product separation into a single unit,
eliminating the need for additional purification equipment and reducing capital
costs (Munera et al., 2003),
It yields higher hydrogen recovery and purity by utilization of a completely
hydrogen selective membrane (Mendes et al., 2010),

20
It allows for lower amount of catalyst required to achieve equivalent conversion
in a conventional reactor (Enick et al., 2002),
It also allows the utilization of higher pressure to enhance the permeation of
hydrogen gas through the membrane (Enrico et al., 2011).
Although the membrane reactor reduces the amount of steam required for the WGSR,
low steam/CO ratio results in certain side reactions producing unwanted products like
carbon and methane. The degree to which these side reactions proceed depends on the
catalyst, reaction operating conditions and reaction kinetics. It is therefore important that
the catalyst chosen has a high activity and selectivity for the WGSR (Xue et al., 1996).
In line with this phenomenon, the authors tested commercial Fe-Cr and Cu-Zn, including
laboratory prepared Co-Cr, Pt/ZrO2 catalysts at a steam/CO ratio of 1.33 in quartz
tubular reactor at 150 – 450oC and observed that Pt/ZrO2 catalyst gave the best
conversion of 72% and selectivity at high temperature of 3500C with minimal carbon and
methane formation even when the ratio of steam/CO was reduced to 0.33. According to
Cornaglia et al., (2011), the catalyst for the WGS reaction in a membrane reactor
application should;
(i) Operate above 680 K (407oC) to limit the poisoning effect of CO on the Pd alloy
membrane
(ii) Be considerably more active than commercial high temperature formulations
(iii) Be very stable and should not form carbonaceous residues even with low H2O/CO
ratios because carbon has a great affinity for Pd, and it rapidly destroys the membrane.

21
Furthermore, Gosiewski et al., (2010) recommended that a catalyst suitable for a
membrane reactor should be able to withstand a wide operating temperature range from
200 – 550oC while maintaining a high CO conversion in the presence of low steam/CO
ratio based on his simulation of WGS membrane reactor for gas from coal gasification.
Majority of the studies on membrane reactors have focused on improvement of
the membrane material, manufacturing methods and modelling studies. Several materials
have been used for manufacturing the membrane reactor for WGSR including silica,
zeolites, palladium and its alloys of Cu & Ag but Pd based membranes have been proven
to be better because of its high selectivity to hydrogen (Munera et al., 2003). Majority of
these studies employed commercially available catalysts (Fe/Cr and Cu/Zn/Al2O3) and
artificial feeds that do not represent an industrial scenario (Bi et al., 2009). For instance,
Basile et al. (1996) studied several membrane preparation methods using commercial
low temperature catalyst. Also, Tosti et al. (2000) used a commercial catalyst to study
the effect of membrane preparation method and membrane composition on the water gas
shift reaction. In a similar study, Criscuoli et al. (2000) studied the effect of feed
composition (amongst which was reformate gas from methane steam reforming) when
using ceramic mesoporous membrane as compared to a palladium membrane. Basile et
al. (2001) and Arstad et al. (2006) used commercial low temperature shift catalysts and
focused on preparation method and membrane properties. Conversely, Iyoha et al. (2007)
studied the feasibility of performing the WGSR in Pd based membrane without
additional heterogeneous catalysts at a very high temperature of 1173K (900oC),
although they obtained high conversion due to the combination of temperature, catalytic
membrane surface and high rate of H2 permeation, they observed pinholes after

22
prolonged usage which they related to the extreme temperatures used and recommended
the use of additional catalyst particles.
There are only a few literature reports on catalyst development for WGS in a
membrane reactor. In some cases, the catalyst developed is only tested in a traditional
fixed bed reactor under potential membrane conditions. For instance, Khan et al. (2008)
developed modified nano-crystalline ferrites catalyst of the form Fe1.82M0.18O3 for the
high temperature WGS membrane reactor using either first row transition metals atoms
(M = Cr, Mn, Co, Ni, Cu), the non transition atom (M = Zn), or the inner-transition atom
(M = Ce) prepared by coprecipitation method. Characterization techniques such as XRD,
TPR, N2 physisorption were performed. The activity tests were performed at atmospheric
pressure in a fixed bed reactor at 350 – 550oC with steam/CO ratios in the range of 1 – 7.
They observed that there was no carbide nor methane formation with all the dopants
except in Fe-Mn. Fe-Ce was reported to be the most promising for a membrane reactor
application which was attributed to the improved oxygen storage capacity, reducibility
and redox charge transfer between Fe III Fe II and Ce IV Ce III. In a follow up
study by the same group, Tang et al. (2010) tested the Fe-Ce catalyst in a zeolite
membrane reactor with a feed inlet pressure close to atmospheric (1.5 atm) and observed
an improved conversion of 81.7% which was well over the equilibrium conversion in a
packed bed reactor. However, they proposed that an improvement in the membrane
material and a higher pressure will improve the permeability and hence the conversion.
Flytzani-Stephanopoulos et al. (2004) used Cu-Ce (30%La)-Ox in a 10μm Pd-Cu
membrane at 350oC and obtained a conversion of 94% which exceeded the equilibrium
conversion of 93%. This catalyst may not be suitable to withstand higher temperature

23
since there is no additive such as Zr that will give it thermal stability in addition to the
presence of only Cu as the active metal which will deactivate at higher temperature. Bi et
al. (2009) reported that CO inhibits H2 transport through Pd and Pd alloy membranes
below 350oC, and thus, it is more efficient to carry out the WGS reaction at higher
temperatures in Pd membrane reactors. They used Pt/CeO2-ZrO2 (similar to Xue et al.,
1996 mentioned earlier) and attained a CO conversion above 70% but H2 recovery
decreased significantly upon increasing the feed rate. Thus, they concluded that, in
addition to high temperature, there is need to develop a catalyst with faster kinetics
because at a high temperature in the range of 327 -477oC, the reaction rate is the limiting
factor rather than the permeance of the Pd membrane. The authors also suggested that in
order to optimise the WGSR in a membrane reactor, it is more beneficial to improve the
catalyst rather than focusing on the state of the art Pd membrane material. They used
feed composition typical of reformate from autothermal reforming of natural gas (1.1%
CH4, 45.3% H2, 11.8% CO, and 7.4% CO2) and a total pressure of 1.2MPa (11.8 atm). In
2010, Abdollahi et al. (2010) used a commercial sulfur tolerant Co/Mo/Al2O3 catalyst for
the WGSR using typical coal gasification off gas composition containing 39.5% H2,
15.2% CO, 32.4% CO2, 12.2% CH4 and 0.7% H2S in a carbon molecular sieve
membrane. They obtained stable conversion and permeance at 250 – 300oC over a period
of 1 month which was better than their packed bed experiments. Cornaglia et al. (2011)
developed an active, non-carbon forming and stable catalyst for the WGSR (Rh/La2O3-
SiO2) suitable for use in a membrane reactor; however, their activity test was performed
in a fixed bed tubular reactor (non-membrane) and pure CO gas was used as feed.

24
In some other cases, catalytic membrane materials are used in which the
membrane itself catalyses the water gas shift reaction without separate catalyst particles.
Still, in other cases, the membrane is wash coated with the catalytic material to prevent
direct contamination of the membrane (Romero and Wilhite, 2012). An example of a
catalytic membrane material is found in the work by Li et al. (2009), in which they
prepared NiO–SrCeO3-δ mechanical support for a membrane made from SrCe0.9Eu0.1O3-δ
where NiO also served as a WGS catalyst. They obtained a H2 yield of 92% with
recovery of 32% and an increase in conversion by 46% as compared to the conventional
system using a steam/CO ratio of 1 - 2. These researchers suggested that the catalytic
membrane material can be used at high temperatures > 640oC which is a cheaper
alternative to palladium membrane. This is similar to the findings by Hwang et al. (2011)
who proposed that Ni modified with potassium (K) is more active and selective for the
WGSR with no carbon deposition over a period of 20 hours at 350oC and that this could
be applied as a catalytic membrane material, although they performed their activity tests
in a packed bed reactor. Garcia-Garcia et al. (2010) prepared a Pd catalytic hollow fibre
membrane reactor impregnated with 30%CuO/CeO2 catalyst and attributed the observed
high conversion and hydrogen yield to a greater availability of catalyst surface area to
volume ratio, improved heat and mass transfer as well as mixing of the gases, which was
not the case in the absence of the membrane.
It can be seen that there is a need to develop highly stable and active catalyst for
the water gas shift reaction (WGSR) that can withstand high temperatures and can be
used in the presence of other components which typically make up reformate gas (from
dry reforming of biogas methane or from gasification) such as CO2, CH4 and H2. In this

25
study, a novel catalyst was developed that can withstand the conditions required in a Pd-
based membrane reactor operating at high temperature and pressure. Characterization
techniques were performed using several techniques in order to understand the
relationship between the inherent physico-chemical properties of the catalyst and its
performance.
2.4 High Pressure Water Gas Shift Reaction
The water gas shift reaction has equal number of moles of reactants and products
according to stoichiometry so that its equilibrium and hence the composition of the
product gas is not affected greatly by an increase in pressure except when a system that
removes one of the products is employed. As a result, majority of the studies and even
commercial operations are performed at atmospheric pressure. However, several studies
have shown that the rate of the water gas shift reaction increases with pressure to some
extent (Atwood et al., 1950).
Padovani and Lotteri (1937) reported an increase in catalyst activity with
increasing pressure up to 20 atmospheres using a commercial high temperature shift
catalyst; however, further increase in the pressure caused a decrease in the activity.
Atwood et al. (1950) investigated the effect of pressure on the WGSR within the range of
1 – 30 atm and 346 - 4040C using a steam/gas ratio of 1.02 – 1.13. They observed that
the activity of the catalyst doubled, up to a pressure of 10 atm. A further increase in
pressure caused only a slight increase in activity. They used a feed composition of
25%CO and balance of H2. Similarly, Chinchen et al. (1984), using a feed composition
of 10%CO, 10%CO2 and 80%H2, reported a linear dependence of WGS reaction rate on

26
total pressure up to 30 bar (30 atm) but becomes independent of pressure beyond this
point. Fott (1979) and Zhao (1999) also observed similar trends with WGS reaction rate
increasing with total pressure following a downward convex curve. On the other hand,
Bohlbro (1962) and Rhodes and Hutchings (2003) observed a totally linear dependence
of the rate on reaction total pressure. Conversely, Bustamante et al. (2005) reported a
negligible effect of high pressure (15.8 atm) condition on the WGS reaction rate as
compared to the low pressure condition (1 atm).
More recently, Hla et al. (2009) reported a linear relationship between total
pressure (1 – 11atm) and the CO conversion rate using a sour shift catalyst, Co-Mo and
Fe-Cr with a simulated coal derived syngas as feed with very high CO amount of 65%.
In the current work being reported, high pressures were applied to the WGSR in a
packed bed system without a membrane so as to compare the catalyst activity at high
pressures in similar conditions in the presence and absence of a membrane.
2.5 Kinetic Studies on Water gas shift Reaction
Several studies have been carried out on the kinetics of the WGSR. In this section
more focus will be directed to studies on high temperature kinetics. The study of the
WGS reaction kinetics is important so as to appropriately design a reforming process, in
particular, the water gas shift reactor, and optimise the operating conditions. Previous
studies on kinetics of WGSR resulted in different kinetic parameters owing to the
different catalysts and reaction conditions used. Thus, it is necessary to determine the
kinetics for the novel catalyst developed in the current study. This will not only help in
reactor design, but will also help in understanding the characteristics of the catalyst in

27
terms of the possible reaction mechanisms, nature of deactivation and its active sites
(Kumar et al., 2008).
There are basically two reaction mechanisms that have been proposed in the
literature namely; regenerative redox mechanism and associative mechanism. The redox
mechanism is such that water molecules dissociate on the active site of the catalyst
releasing hydrogen and simultaneously creating an oxidised surface which is then
reduced by the absorption of carbon monoxide, thus producing carbon dioxide. In the
associative mechanism, an intermediate is formed, typically formate, surface carbonates
and carboxyl species, as a result of the reaction between CO and H2O, which then
dissociates to form the products, H2 and CO2 (Lin et al., 2011). Several researchers have
studied the presence and type of intermediate formed using several techniques including
differential reflectance infrared fourier transform spectroscopy (DRIFTS) isotope
labeling, fourier transform infrared spectroscopy (FTIR), and steady state isotopic
transient kinetic analysis (SSITKA) (Phatak et al., 2007; Olympiou et al., 2007). Based
on the regenerative and associative mechanisms, rate expressions have been developed
based on the Langmuir-Hinshelwood (LH) and Eley-Rideal mechanism. A simple
empirical power law rate model which is not representative of any particular mechanism
has also been used for the high temperature shift kinetic studies by several authors
(Bustamante et al., 2005; Kumar et al., 2008).
In 1981, Grenoble et al. (1981) studied the pressure dependency of the WGS
reactants on several alumina supported catalysts using Cu, Re, Co, Ru, Ni, Pt, Os, Au,
Fe, Pd, Rh and Ir at 300oC and fitted the kinetic data using the power law expression.
They observed that the reaction order over CO for most of the metals was close to zero

28
while that with respect to H2O was about 0.5. In particular, for the Ni and Cu catalysts,
the orders were -0.14 and 0.30 for CO and 0.62 and 0.38 for H2O respectively. They also
proposed a mechanism including formic acid as an intermediate. They reported
activation energies to be in the range of 47.3 – 98.8 kJ/mol and pre-exponential factor in
the range of 9.46 x 10² – 7.38 x 10
7 moles/sec/metal site. Chinchen et al. (1984) obtained
activation energy of 129.4 kJ/mol over a Fe-Cr catalyst at a total pressure of 31.6atm and
temperature of 350oC.
Campbell et al. (1992) studied the kinetics and mechanism of the WGSR over
cesium (Cs) promoted copper catalysts and proposed the redox mechanism as the
underlying reaction pathway. An activation energy of 46.05 kJ/mol for the Cs/Cu was
reported which was slightly higher than the 41.9 kJ/mol for the non-promoted Cu, with
an order of 0.5 in CO and zero-order for H2O, however at a higher partial pressure of CO
> 100 Torr (0.13 atm), the order changed such that CO approached zero order while that
of H2O became 0.5 for the Cs/Cu at 250oC. In support of the redox mechanism, Li et al.
(2000) used a power law model that depended only on the partial pressures of CO and
H2O, to study the kinetics of Ni/Ce-La over a temperature range of 250 – 300oC and
obtained an activation energy of 38.2 kJ/mol. Ma and Lund (2003) developed a
microkinetic model also supporting the redox mechanism for the high temperature
WGSR on ferrochrome (Fe-Cr) catalyst within a temperature range of 327 – 477oC, this
kinetic model was further used to simulate the performance of a Pd based membrane
reactor. They obtained a pre-exponential factor of 106atm
-1s
-1 and activation energy of
72.5 kJ/mol.

29
Previously, most kinetic studies were performed on pure CO and H2O without
considering the effect of the products, CO2 and H2 which are usually present in the feed
under realistic reforming conditions. In line with this observation, Koryabkina et al.
(2003) studied the effect of CO2 and H2 on the rate of WGSR and reported that the
presence of the products in the feed material tends to inhibit the forward reaction with
orders of 0.8, 0.8, -0.7, -0.8 with respect to CO, H2O, CO2 and H2 respectively using a
feed composition of 7%CO, 8.5%CO2, 22%H2O, 37% H2 on Cu based catalysts with
ceria and alumina as supports. They reported activation energies in the range of 32 – 79
kJ/mol. In 2005, Bustamante et al., studied the kinetics of WGSR at high temperature
(797 – 861oC) and both low (1 atm) and high pressure (15.8 atm) conditions using a
reactor composed of a catalytic (Ni-Cr) wall. They reported a chain reaction mechanism
and employed the power law model which was characterized by orders of 0.5 and 1 for
CO and H2O respectively and activation energy of 288.3 kJ/mol and pre-exponential
factor of 7.4 x 10¹¹
at high pressure condition which was quite different from the results
at atmospheric pressure. Azzam et al. (2008) studied the reaction mechanism of the
WGSR using transient kinetic studies and in situ FTIR spectroscopy. They proposed an
associative formate mechanism coupled with regenerative redox route over a Pt-Re/TiO2
catalyst. Using the power law model, they reported activation energy of 31 kJ/mol and
observed that the rate of the reaction was independent of CO (especially at high CO
concentrations) and CO2 but had a first order dependence on H2O and -0.5 order with
respect to H2.
For ceria based catalyst with Pt as the active metal, Meunier et al. (2008) studied
the kinetics of the WGSR and observed that increasing the partial pressure of CO caused

30
a decrease in the reaction rate leading to a negative order with respect to CO which they
explained to result from the competitive adsorption between reactant molecules during
the reaction. Similarly, Yablonsky et al. (2010) reported an increase in activation energy
with increasing partial pressure of CO at low temperatures < 300oC and atmospheric
pressure. Kumar et al. (2008) studied the kinetics of the WGSR at high temperatures in
the range of 400 – 600oC, testing four models based on Langmuir Hinshelwood (LH) and
redox mechanisms as well as the power law rate expression. The LH model gave the best
prediction amongst the mechanistic models of their experimental rates supporting the
associative formate mechanism, however the power law model gave a better fitting of the
experimental data with an activation energy of 48.2kJ/mol and a pre-exponential factor
of 3.9 x 10⁴. The orders with respect to CO, H2O, CO2 and H2 were reported as 0.34,
0.39, -0.09 and -0.25 respectively.
In a bid to determine the effect of high pressure on high temperature WGSR, Hla
et al. (2009) reported that the reaction order obtained from a power law expression at
atmospheric pressure can be used at high pressures up to 11 atm over a Fe-Cr and Co-Mo
catalyst using coal gasification off gas as feed at 450oC. Similarly, Abdollahi et al.
(2010) used the power law model for the reaction at 1 – 5 atm at 300oC for similar
catalyst and feed but including CH4 in both packed bed and membrane reactors, and
obtained pre-exponential factor of 16.63 and activation energy of 33.28 kJ/mol. For
membrane reactor modelling, both the Langmuir Hinshelwood (Cornaglia et al., 2013)
and power law model have been used. Also, Osa et al. (2011) compared 3 LH models
based on associative and redox mechanisms to describe the kinetics of the WGSR at 350
– 500oC and pressure at 19 atm using coal derived syngas and Co-Mo catalyst in a

31
packed bed reactor. The redox mechanism was found to best describe the kinetic data
giving activation energy of 84.7kJ/mol and pre-exponential factor of 452.6 mmolg-1
s-
1bar
-1. Using Ce-Cu-Ni and Ce-Cu-Fe, Shinde and Madras (2012) obtained activation
energy of 32 and 37 kJ/mol respectively supporting the redox mechanism in a fixed bed
tubular reactor. Gokaliler et al. (2013) used Au-CeO2 catalyst at 280 – 325oC to perform
kinetic studies on WGSR proposing the power law rate expression with activation energy
of 29.4 kJ/mol and order of 0.75, 2.0, -0.34 and -0.6 with respect to CO, H2O, CO2 and
H2 partial pressures respectively. As can be seen, different kinetic parameters are
obtained with different catalysts and operating conditions and various mechanisms can
be proposed based on the type of kinetic data obtained.
In this work however, we set to determine the activation energy and the
dependency of the reaction rate on the partial pressures/moles of CO that are obtained
from the novel catalyst under different operating conditions for the WGSR.

32
CHAPTER 3
EXPERIMENTAL SECTION
In this section, the chemicals, gases and instruments used in the course of this research
are reported. The details of experimental methods employed in preparing the catalysts,
activity evaluation tests, performance evaluation parameters, characterization techniques
as well as safety precautions observed in the lab are also given.
3.1 SAFETY PRECAUTIONS
1. Personal Protective Equipment comprising lab coat, safety goggles, hand gloves
and suitable shoes were always employed during experimental runs in the lab.
2. Liquid chemicals such as ammonium hydroxide were handled in the fume hood to
prevent diffusion of toxic fumes.
3. Flammable chemicals were stored in appropriate cabinets for flammable materials.
4. Gas cylinders were properly clamped to sturdy supports and were transported in
suitable carts when being replaced.
5. Chemical wastes were properly contained, labelled and disposed using standard
procedures.
6. Gas monitor installed for CO detection was regularly checked to ensure the
permissible limit was not exceeded.
7. Good housekeeping of the lab apparatus was ensured and spills properly cleaned
up.

33
3.2 CATALYST PREPARATION
3.2.1 Chemicals used for catalyst preparation
1. Nickel (II) nitrate hexahydrate, Ni(NO3)2.6H2O, 99.99%; Aldrich
2. Copper (II) nitrate hydrate, Cu(NO3)2.xH2O, 99.99%; Aldrich
3. Cerium (III) nitrate hexahydrate, Ce(NO3)2.6H2O, 99%; Aldrich
4. Zirconium (IV) oxynitrate hydrate, ZrO(NO3)2.xH2O, 99.99%; Aldrich
5. Calcium (II) nitrate tetrahydrate, Ca(NO3)2.4H2O, 99%; Aldrich
6. Gadolinium (III) nitrate hydrate, Gd(NO3)3.xH2O, 99.99%: Alfa Aesar
7. Lanthanum (III) nitrate hexahydrate, La(NO3)3.6H2O, 99.99%: Aldrich
8. Magnesium nitrate, Mg(NO3)2.6H2O, 98%: Sigma
9. Yttrium (III) nitrate hexahydrate, Y(NO3)3.6H2O, 99.99%: Aldrich
10. Ammonium hydroxide reagent ACS-Pure: Fisher (30 volume %)
11. Hexadecyltrimethylammonium bromide (CTAB), C19H42NBr: Sigma
3.2.2 Equipment used for catalyst preparation
1. Isotemp Muffle furnace, Model 550-126, Fisher Scientific Company
2. Hydraulic Press, model 3912, Carver
3. Magnetic Stirrer hot plate, Gyratherm IIa, VWR Scientific Inc.
4. Rotary Evaporator, Buchi Corporation
5. U.S.A standard test sieve, ASTM, E-11 specification, Fisher Scientific
6. Weighing Balance

34
3.2.3 Preparation of Ternary Oxide Support
Ternary oxide supports with a composition of Ce0.5Zr0.33M0.17 were prepared
using CTAB as the surfactant under basic conditions, where M is a promoter element
and is either a transition metal, non-transition metal or inner transition metal. This
procedure is similar to previous studies in our group (Sengupta, 2011; Sukonket et al.,
2011). In this study, the promoter elements used were Ca, Mg, Y, Gd and La which were
obtained from their nitrate precursors. The molar ratio of [CTAB]/[Ce+Zr+M] was kept
constant at 1.25. Typically, pre-determined amounts of the nitrate precursors were each
dissolved in 500ml of deionised water. The surfactant - cetyltrimethyl ammonium
bromide (CTAB) was also dissolved in 1000 ml of deionized water and added to the
previous solution. Ammonium hydroxide was then slowly added to the above solution
over a period of 120 min until the pH was increased to 12 while stirring. The pH was
confirmed by use of standard pH paper. This caused the precipitation of a gelatinous
yellow-brown slurry. After precipitation, the slurry was then sealed in pyrex glass bottles
and aged hydrothermally in an oven maintained at 900C for 5 days. The mixture was then
cooled to room temperature and the precipitate filtered and washed with warm deionised
water to remove the free surfactant not incorporated within the oxide. The resulting
residue was dried overnight at 1200C, crushed and calcined at 650
0C for 3hours in the
muffle furnace to remove the surfactant and obtain oxides. In order to optimise the
catalyst preparation method, the surfactant to metal ratio was varied between 0, 0.2, 0.5
and 1.25. For the surfactant to metal ratio of zero, the Ce0.5Zr0.33M0.17 with support M=Ca
was prepared by co-precipitation route. In this method, no surfactant was added and the
amount of aqueous ammonium hydroxide required to precipitate the solution of nitrates

35
was less than in the surfactant route. The subsequent ageing, washing, filtration, drying
and calcination steps were similar to the previous method.
3.2.4 Preparation of Binary Oxide Support
The binary oxide supported catalyst was used as a benchmark to show the effect
of the promoter element in the ternary oxide supported catalyst. The catalyst support was
prepared using surfactant-assisted route and comprised of two metal oxides (CeO2/ZrO2)
having a composition of 50wt% each, similar to previous report by our group (Kumar
and Idem, 2007). Certain amounts of Ce(NO3)3.6H2O and ZrOCl3.XH2O were each
dissolved in 500 ml of deionised water. The surfactant (CTAB) was also dissolved in
1000 ml of deionized water and mixed with the previous solution (molar ratio of CTAB/
Ce+Zr = 1.25) under rigorous stirring. Aqueous NH4OH was then slowly added until the
pH was increased to 12. The resulting colloidal slurry was then sealed in glass vessels
and aged in an oven maintained at 900C for 5 days under autogenous pressure. The
mixture was then cooled to room temperature and the precipitate filtered and washed
with warm deionised water to remove the free surfactant not incorporated within the
oxide. The resulting residue was dried overnight at 90oC, crushed and calcined at 450
oC
for 4 hours to remove the surfactant and obtain oxides.
3.2.5 Preparation of Supported Bimetallic Catalysts
The ternary oxide supports were simultaneously impregnated with both Nickel
(3wt%) and Copper (5wt%) using their nitrate precursors through the wet impregnation
method. These compositions were selected based on a previous study by Kumar and
Idem (2007). In a typical run, 4.6g of oxide support was immersed in 25.55ml of 0.1M

36
Ni(NO3)2.6H2O and 39.31ml of 0.1M Cu(NO3)2.xH2O solutions and slowly dried via two
routes. The first method involved continuous stirring of the solution in a hot silicon oil
bath (850C) exposed to the atmosphere while the second method which yielded better
impregnation/metal dispersion involved the use of a vacuum controlled rotary evaporator
comprising of a hot water bath (85oC). In both cases, the resultant dry powders were
calcined at 6500C for 3 hours. Afterwards, the calcined catalyst powders were pressed
into tablets using the hydraulic press and sieved into sizes of 0.8mm for use in the
reactor. The calcination temperature was later varied between 650 and 4250C to optimise
the catalyst preparation method. All the catalysts used in the present work were prepared
by similar procedures to allow for direct comparison of their performance and properties.

37
Table 3.1 Portfolio of catalysts prepared
Types of Impregnation Name of the Catalysts
(CTAB=1.25)
Wet Impregnation (3Ni-5Cu)
Ni-Cu/CeO2-ZrO2
Ni-Cu/CeO2-ZrO2-GdOx
Ni-Cu/CeO2-ZrO2-MgOx
Ni-Cu/CeO2-ZrO2-CaOx
Ni-Cu/CeO2-ZrO2-YOx
Ni-Cu/CeO2-ZrO2-LaOx

38
3.3 CATALYST CHARACTERIZATION
The prepared catalysts and supports were characterized using several
bulk/surface techniques to identify the inherent properties of the materials that are
responsible for the catalytic activity observed. Both fresh and used catalysts were
characterized by the following methods which can be classified according to bulk
(>3nm) or surface (<3nm) techniques depending on the sampling depth from catalyst
surface employed during characterization. This classification is shown in Table 3.2 and
the details described below.
3.3.1 Instruments used for characterization
1. Micromeritics ASAP 2010 : N2 physisorption and H2 chemisorption
2. Shimadzu TGA-50: TGA and TPO
3. ChemBET 3000 Quantachrome: TPR
4. Bruker Discover Diffractometer: XRD

39
Table 3.2 Classification of catalyst characterization techniques
Bulk Technique Surface Technique
X-ray diffraction (XRD) H2 chemisorption
N2 physisorption Temperature programmed reduction (TPR)
Thermo-gravimetric Analysis (TGA)
Inductively coupled plasma-mass spectrometry
(ICP-MS)
Temperature Programmed Oxidation (TPO)

40
3.3.2 N2 Physisorption
The catalysts and supports were analysed for their BET surface area, pore
volume, pore size and pore size distribution by N2 physisorption. The analysis was
conducted at liquid N2 temperature using a Micromeritics ASAP 2010 apparatus. Before
the actual analysis, all the samples were evacuated for 4 hours at 180 C under vacuum.
The desorption branch of the N2-isotherm were used to analyze the pore size distribution
and average pore volume.
3.3.3 H2 chemisorption
H2 chemisorption was used to determine the metallic surface area and dispersion
of the active metal phase (Ni-Cu) in the catalyst samples. The analysis was performed at
35 C using a Micromeritics ASAP 2010 instrument. The catalyst samples were first
dried at 120 C and then reduced in situ in flowing H2 gas (UHP grade) at 500-650 C
for 3h. This was done so as to mimic the reduced state of the catalyst as in the case of a
typical run. Thereafter the catalyst was evacuated at 500-650 C for 1 h and then cooled
down to 35 C before performing actual measurements. In a typical volumetric H2
chemisorption measurement, known amounts of hydrogen are dosed and subsequently
adsorbed at different partial pressures, resulting in a chemisorption isotherm. The weakly
adsorbed hydrogen molecules are then removed in an evacuation step and the isothermal
measurement repeated. The difference between the two isotherms is used to calculate the
active metal surface area and represents the chemically bonded reactive gas. A
combination of this information with information on metal loading is then used to
calculate the metal dispersion. The metallic surface area (SNi) was calculated by

41
considering the adsorption stoichiometry as 2 surface nickel and copper atoms per
hydrogen molecule. The metal dispersion (D %) was then calculated as the percentage of
surface metal atoms with respect to total metal atoms in the catalysts.
3.3.4 X-ray Diffraction (XRD) Measurements
Powder XRD measurements of the catalysts and supports were performed in
order to verify the chemical components present and also determine the degree of
crystallinity. The XRD patterns were recorded on a Bruker Discover diffractometer using
Ni-filtered Cu Kα (0.154056 nm) as the radiation source. The intensity data were
collected over a 2θ range of 100 - 90
0 with a step size of 0.02
0 using a counting time of 1
s per point and crystalline phases were identified. For reference puposes, pure NiO and
CuO were also analysed so as to determine the position of their peaks and identify their
presence in a catalyst sample.
3.3.5 Thermo-gravimetric Analysis (TGA)
The calcination temperature was determined by the use of TGA instrument
(Shimadzu TGA-50) which records the weight loss of a fresh uncalcined powder catalyst
sample (23mg) with increasing temperature up to 8000C at 10
0C/min while flowing an
inert gas (ultrapure nitrogen) through the sample. This temperature is held for 30 minutes
before the sample is cooled down to room temperature.
3.3.6 Temperature Programmed Reduction (TPR)
TPR enables us determine the reducibility of a catalyst material and an
appropriate temperature suitable for activation. Consequently, the TPR technique was

42
used to analyse the nature of the species in the catalysts and the supports. A
Quantachrome ChemBET 3000 unit equipped with a thermal conductivity detector
(TCD) was employed. For a typical run, 50mg of the sample was degassed at 1800C for
2hours in a pure nitrogen atmosphere. Afterwards, the sample was transferred to the
analysis port and heated up to 10500C at a heating rate of 15
0C/min in the presence of a
typical reducing gas mixture (5%H2/balance N2) with a flow rate of 75sccm. The H2
uptake was measured as a function of TCD response and was plotted against temperature
to give a TPR profile. Tmax values were recorded and used to determine the reducibility
of the sample, that is, 1/Tmax.
3.3.7 Temperature Programmed Oxidation (TPO)
The TPO technique enables us determine the carbon propensity factor (CPF) of a
catalyst. The CPF of a catalyst is a measure of the potential of carbon formation in a
catalyst and is defined as the amount of carbon formed (mg) per gram catalyst per hour.
The CPF was measured using the Shimadzu TGA-50 using equal amounts of used
catalyst samples. In a typical run, 150mg of used catalyst was heated up from ambient
temperature to 10500C at a heating rate of 15
0C/min using 5%O2/balance N2 as the
reactive gas at a flow rate of 30ml/min. The O2 burned off the carbon from the used
catalyst which was recorded as a weight loss in the sample by the TGA unit. This weight
loss was recorded as the amount of carbon and then used to determine the carbon
propensity factor.
43
3.3.8 Inductively Coupled Plasma-Mass Spectrometry (ICP-MS)
ICP-MS was used to determine the elemental composition of the catalysts in
terms of the amount of Ni and Cu present. The ICP-MS allows the detection of metals by
ionizing a sample with plasma at very high temperature (9727oC) and then using a mass
spectrometer to separate and quantify the ions. Typically, a sample to be analysed is
digested by mixing it with a mixture of acids and then the sample is pumped into a
nebulizer which converts it into a fine aerosol with argon gas. As a droplet of the sample
enters the plasma region, it evaporates and any dissolved solids present are broken down
into atoms and at the prevailing temperatures in the plasma, the atoms are ionized. The
ions are then sent to the mass spectrometer which separates them based on the mass to
charge ratio and measures the concentration. The analysis was conducted at the Trace
Analysis Facility (TAF), University of Regina.
3.4 CATALYST ACTIVITY EVALUATION – PBTR
The catalysts were evaluated for their activity by performing the water gas shift
reaction in a conventional packed bed tubular reactor (PBTR) made of Inconel 625 with
½”I.D placed vertically in an electrical furnace. The rationale of using the packed bed
reactor is to screen the portfolio of catalysts prepared, then optimize the preparation
method and eventually use this optimum catalyst in the membrane reactor, to improve
the recovery of pure hydrogen. The gases used for activity evaluation include
30%CO/balance N2 and simulated reformate gas from biogas dry reforming comprising
of 46% CO, 38% H2, 9% CH4, 7% CO2 (Praxair). The flow rates of the gases were
44
regulated using a mass flow controller (Aalborg Instruments). A high performance liquid
chromatography (Alltech) pump was used to supply water at the desired flow rate, while
a sliding thermocouple was used to measure the reaction temperature inside the catalyst
bed. The schematic diagram of the experimental setup is shown in Figure 3.1.

45
Figure 3.1 Schematic diagram of experimental setup for water gas shift reaction using
PBTR
1. 5%H2/N2 gas cylinder
2. 30%CO/bal. N2 or reformate cylinder
3. Gas Valve
4. Mass flow controller
5. Check valve
6. Thermocouple
7. Electric furnace
8. Catalyst bed
9. Reactor
10. Personal Computer (PC)
11. Condenser
12. HPLC pump
13. Gas chromatograph
14. Drain valve
15. PC controlled apparatus

46
In a typical run, 0.25g of 0.8mm sized (Dp) catalyst particles was mixed with
about 15g of α-Al2O3 (Sasol GmbH, Germany) used as a diluent and of similar particle
size to form a bed height (L) of about 9cm in the reactor. This helped to ensure that plug
flow conditions were met because the values of L/Dp and D/Dp were 112.5 and 15.875
respectively which were greater than the minimum requirement of 50 and 10 respectively
in the reactor (Froment and Bischoff, 1990). This also helped to minimize back mixing
and channelling. Prior to the actual reaction, the catalyst was activated in situ by flowing
5%H2/balance N2 through the catalyst bed flowing at 161sccm for 2 hours. The purpose
of activating the catalyst was to reduce the metal oxides, NiO and CuO to the active
metal form, Ni and Cu respectively. The reduction temperature used was 6500C but for
optimization purposes and based on the maximum temperature (Tmax) obtained for Cu
from TPR runs, the reduction temperature was later reduced to 500oC to prevent
sintering of the catalyst. The water at a flow rate of 0.1ml/min and gas mixture flowing
at 161 sccm was then fed into the reactor and maintained at the desired reaction
temperature of 500oC for the duration of the reaction, typically 6 hours. The catalyst
screening and parametric studies were done at atmospheric pressure. Subsequently, as
part of the parametric studies in the PBTR, the reaction was carried out at high pressure
ranging from 150 – 250 psi (10.2 – 17 atm). Other parameters varied in this study to
understand their effects on the WGSR include reaction temperature, steam/CO ratio,
catalyst calcination temperature and amount of surfactant used in catalyst preparation.
The product stream exiting the reactor was then passed through a condenser to remove
water and separate the gaseous product which was sent to the online gas chromatography

47
(Agilent 6890 N) for analysis equipped with Hayesep Q and Molecular Sieve A columns
coupled with a thermal conductivity detector (TCD) and helium as the carrier gas.
3.5 MEMBRANE REACTOR STUDIES
The goal of these experiments was to show the effect of using a membrane
reactor on the water gas shift reaction. The membrane reactor was first characterized to
determine the rate of permeation of hydrogen and its dependence on temperature and
partial pressure. Thereafter, the catalyst performance was evaluated in the membrane
reactor. This section gives details of these experiments.
Figure 3.2 shows the cross sectional view of the membrane reactor. The
membrane reactor (REB Research & Consulting, USA) consists of an Inconel reactor
shell 0.5”I.D enclosing a single tubular Pd-Ag membrane 0.125”O.D and 6.5” effective
length. There are two outlet tubes from the reactor; the raffinate/retentate stream and the
pure H2 stream. The catalyst is fed into the annular space between the reactor shell and
membrane tube. A sliding three point thermocouple is also inserted into the reactor for
temperature measurement. The reactor is placed vertically in an electrical furnace (REB
Research & Consulting, USA). The experimental setup used is shown in Figure 3.3 and
was similar to that of Figure 3.1.
The differences between both setups include; the presence of a back pressure
regulator (TESCOM Corporation) and gauge, a membrane reactor as shown in Figure
3.2, a pressure gauge (Cole Parmer) upstream of the reactor through which the feed gas
inlet pressure is measured and a cooler for the permeated pure H2 stream.

48
Figure 3.2 Schematic diagram of membrane reactor
Reactor shell
Membrane reactor
Catalyst

49
Figure 3.3 Schematic diagram of membrane reactor experimental setup
1. Reformate gas cylinder 2. 5%H2/N2 gas cylinder 3. UHP N2 gas cylinder 4. Two stage regulator 5. 3-way valve 6. Pressure gauge 7. HPLC pump 8. Membrane reactor 9. Electrical furnace 10. Pure H2 stream cooler 11. Pure H2 12. Retentate/raffinate 13. Condensate 14. Gas/liquid separator 15. Permanent gas 16. Downstream pressure gauge 17. Back pressure regulator 18. Gas to GC for analysis

50
3.5.1 Membrane Characterization
According to Sieverts’ law, the amount of hydrogen permeating through a
membrane is linearly dependent on the difference of the square root of the H2 partial
pressure on both sides of the membrane (Morreale et al., 2003).
.................................. (3.1)
The Sieverts’ law is represented as equation 3.1 where NH2 is the H2 molar flux
(mol/m2s), Pe the permeance (mol/m
2s.kPa
0.5), PH2ret the partial pressure of hydrogen on
the retentate side (kPa) and PH2perm the partial pressure of hydrogen on permeate side.
The hydrogen permeance represents the permeability per unit thickness of the
membrane, this permeability depends on temperature according to Arrhenius law:
....................................................... (3.2)
Combining equations 3.1 and 3.2 gives equation 3.3;
........................ (3.3)
Where Pe* is permeability and P’ is the pre-exponential factor both having units of
mol.m/m2s.kPa
0.5, x is membrane thickness, E is the activation energy (J/mol), R is the
universal gas constant and T is the temperature (Kelvin).
Membrane characterization studies were therefore carried out to show the relationship
between hydrogen flux and pressure as well as temperature and to determine the
permeance of hydrogen through the membrane. The experiments were performed using
30%H2/balance N2 40%H2/balance N2 and 50%H2/balance N2 gas mixtures within a

51
temperature range of 300 – 500oC and pressure range of 150 – 250psi (10.2 – 17 atm).
Prior to the test, the reactor was filled with α-Al2O3 particles of 0.8mm to ensure even
distribution of heat and mass transfer and to mimic an actual catalytic run. The
temperature was raised to the desired value in the presence of UHP N2 and then the gas
switched to the desired H2/N2 mix. The pressure on the retentate side was then increased
gradually from atmospheric pressure to the desired pressure by means of the upstream
gas regulator on the cylinder and the back pressure regulator (TESCOM Corporation)
downstream of the reactor, keeping the inlet gas flow (275sccm) hence residence time
constant for all pressures. The permeate side of the reactor was operated at atmospheric
pressure thereby creating a trans-membrane pressure differential acting as a driving force
to allow for the permeation of hydrogen. The retentate and pure H2 stream were sent to
the online GC for analysis and the outlet flow rates of each stream was recorded so as to
determine the hydrogen recovery (RH2) defined according to equation 3.4.
................................. (3.4)
Where H2perm is the amount of hydrogen that permeated through the membrane and H2ret
is the amount of hydrogen left in the retentate section. Hydrogen recovery (RH2) is a
measure of the amount of hydrogen that can be recovered on the permeate side as
compared to the original amount fed to the reactor.

52
3.5.2 Catalyst Evaluation in Membrane Reactor
The catalyst with the best performance from the catalyst screening in the packed
bed tubular reactor was selected for the WGSR in the membrane reactor in order to
determine its suitability for membrane reactor conditions. Reformate gas from biogas
dry reforming comprising of 46% CO, 38% H2, 9% CH4, 7% CO2 (Praxair) was used.
The flow rates of the gases were measured using a mass flow controller (Aalborg
Instruments) downstream of the setup. The pressure of the gases was controlled using the
upstream and downstream pressure regulators. The downstream back pressure regulator
was used to build the pressure as well as regulate the flow to the desired rate. A HPLC
(Alltech) pump supplied water at the desired flow rate, while a three-point thermocouple
was used to measure the reaction temperature inside the catalyst bed. The thermocouple
(REB Research & Consulting) was designed to measure temperatures at the bottom,
middle and top of the reactor. This is important in placing the catalyst bed at the point of
optimum heat transfer.
In a typical run, about 15g of α-Al2O3 is poured into the reactor to create an
elevated bed for the actual catalyst mix to sit on, such that the catalyst bed is positioned
at a point close to the middle of the reactor were optimum heat transfer occurs. 0.25g of
0.8mm sized (Dp) catalyst particles was then mixed with another 15g of α-Al2O3 (Sasol
GmbH, Germany) used as a diluent thus forming a catalyst bed height (L) of about 9cm
in the reactor. The catalyst weight, size, bed height, temperature and steam/CO ratio
were maintained at similar values to the experiments performed in the packed bed
reactor for the purpose of comparison. Plug flow conditions (zero radial velocity and
temperature gradient profiles) were met by ensuring the values of L/Dp and D/Dp were

53
greater than the minimum requirement of 50 and 10 respectively in the reactor (Froment
and Bischoff, 1990). Prior to the actual reaction, the catalyst was activated at
atmospheric pressure and 500oC in situ by flowing 5%H2/balance N2 through the catalyst
bed for 2 hours. Water at a flow rate of 0.26ml/min and gas mixture flowing at 275 sccm
was fed into the reactor by means of a HPLC pump (Alltech) and maintained at the
desired reaction temperature of 500oC for the duration of the reaction, typically 6 hours.
The two product streams – raffinate and pure H2 - exiting the reactor were passed
through a condenser/gas-liquid separator and cooler respectively to condense the water
in the raffinate stream thus leaving the gaseous phase and reduce the temperature of the
pure H2 stream which was sent to the GC.

54
3.6 PERFORMANCE EVALUATION CRITERIA
The water gas shift reaction is shown in the following equation:
CO + H2O H2 + CO2 .............. (1.6)
The criteria used to evaluate the performance of the reaction are shown below.
CO Conversion (XCO) = –
............................. (3.4)
H2 Yield (YH2) =
............................. (3.5)
H2 Selectivity (SH2) =
................................................... (3.6)
Turnover frequency based on CO molecules reacting is defined as follows;
TOF =
……. (3.7)

55
3.7 KINETIC EXPERIMENTS
The catalyst selected for the kinetic study exhibited good activity and stability for
an extended time on stream of 12 hours. The kinetic studies were carried out using
reformate gas at reaction temperatures of 400, 450 and 5000C. The catalyst weight time
(W/FA0) was varied between 1.1, 1.6 and 2.7 g-cat.hr/mol by keeping the weight of the
catalyst constant at 0.5g while changing the feed flow rate between 161, 275 and
389sccm. These conditions were selected such that equilibrium conversion was avoided
(Amphlett et al., 1991) while keeping the catalyst bed height and feed composition
constant. The kinetic reactions were carried out in the PBTR at atmospheric pressure and
elevated pressure of 200 psi (13.6atm) as well as in the membrane reactor, making a total
of 27 runs. Table 3.2 shows the experimental matrix for the kinetic studies.

56
Table 3.3 Design of kinetic experiments
PBTR – Atmospheric pressure
W/FA,0 (gcatalyst*hr/mol) 1.1 1.6 2.7
Temperature (0C)
400
Run 1 Run 2 Run 3
450
Run 4 Run 5 Run 6
500
Run 7 Run 8 Run 9
PBTR – High pressure (200psi)
W/FA,0 (gcatalyst*hr/mol) 1.1 1.6 2.7
Temperature (0C)
400
Run 10 Run 11 Run 12
450
Run 13 Run 14 Run 15
500
Run 16 Run 17 Run 18
Membrane reactor (200psi)
W/FA,0 (gcatalyst*hr/mol) 1.1 1.6 2.7
Temperature (0C)
400
Run 19 Run 20 Run 21
450
Run 22 Run 23 Run 24
500
Run 25 Run 26 Run 27

57
CHAPTER 4
RESULTS AND DISCUSSION
4.1 CATALYST CHARACTERIZATION
4.1.1 Catalysts
The catalysts prepared for the studies were characterized to elucidate the
relationship between the structural properties of the catalysts and the observed
performance. This is important in order to design catalysts with improved performance.
The portfolio of ternary oxide supports and their corresponding catalysts as shown in
Table 3.1 were considered for this characterization study. They were designated as 3Ni-
5Cu/CeZrM were M is La, Gd, Ca, Mg and Y. The results obtained are presented in the
following sub-sections. Binary oxide catalyst with formulation of 3Ni5Cu/CeZr was also
characterized and used as a benchmark for comparison.
4.1.2 N2 Physisorption
The BET surface area, pore volume and pore size of the supports and the
complete catalysts were measured using N2 Physisorption. The isotherms obtained for
the supports and catalysts are shown in Figure 4.1a and 4.1b, respectively revealing the
variation of volume of N2 adsorbed versus relative pressure (P/Po) were P is equilibrium
pressure and Po is the saturated vapor pressure of liquid N2 which is 1 atm. As seen in
the figures, the shapes of the isotherms correspond to the ‘Type IV’ category, which is
typical of materials with a mesoporous structure and a strong affinity for adsorption.
Each exhibits a hysteresis between the adsorption and desorption arms. The hysteresis
loop for Ca and La are of type H2 indicating the interconnectivity of the pores while that
of Mg, Y and Gd correspond to type H3 hysteresis which shows the absence of a limiting

58
adsorption at high relative pressure and is characteristic of materials with slit shaped
pores or containing aggregates of plate-like particles with no well defined mesoporous
structure (IUPAC Recommendations, 1994; Thommes, 2010). Table 4.1 shows the
measurements of surface area, pore volume, average pore diameter and pore volume to
surface area ratio for the catalysts and their supports. The effect of varying the amount of
surfactant and calcination temperature on their textural properties is also shown. The
average pore diameter was in the range of 44 - 122 A0
which is within the mesoporous
range (20-500 A0). High surface area catalysts with mesopores are highly desired in
heterogeneous catalysis because the pores provide accessibility for diffusion of the
reactant molecules to the active sites on which the reactions take place, while a high
surface area provides a large number of active sites on the catalyst surface (Levenspiel,
2009).
The catalysts and supports prepared by surfactant assisted route exhibited high
surface areas >112m2/g unlike the catalyst/support prepared by co-precipitation method.
The high surface areas with the catalysts and supports prepared by surfactant route is
attributed to the controlled precipitation of the support in the presence of the surfactant
involving the exchange of the surface ternary hydroxyl protons [CeZrM(O--H
+)4] with
the surfactant, cetyltrimethylammonium cation [(C16H33)N+(CH3)3] to form a nuclei of
high surface area (Sukonket et al., 2011). This also results in a reduced surface tension of
water in the pores of the support and, coupled with the duration (days) of ageing, gives
rise to porous materials capable of withstanding the conditions of drying and calcination
without shrinking or collapsing of the pores.

59
Figure 4.1 (a) N2 isotherms of CeZrM supports
CeZrY
CeZrLa
CeZrMg CeZrGd
CeZrCa

60
Figure 4.1 (b) N2 isotherms of 3Ni5Cu/CeZrM catalysts
3Ni5Cu/CeZrCa 3Ni5Cu/CeZrMg
3Ni5Cu/CeZrY
3Ni5Cu/CeZrGd
3Ni5Cu/CeZrLa

61
Table 4.1 N2 Physisorption Results
Catalyst BET Surface
Area
(m2/g)
Pore Volume
(cm3/g)
Pore Size
(A0)
Pore V. / S.
Area
(10-9
m)
Catalyst: 3Ni5Cu/CeZrM, Surfactant/Metal = 1.25
La 143 0.32 68 2.24
Mg 119 0.38 99 3.19
Y 165 0.42 76.6 2.55
Ca (normal)
Ca (vacuum)
119
109
0.29
0.28
74.4
77.8
2.46
2.57
Gd 138 0.48 115 3.48
M=0(Binary) 182 0.30
50.6
1.62
Support: CZM, Surfactant/Metal = 1.25
La 133 0.32 75 2.41
Mg 152 0.50 104 3.29
Y 187 0.28 44.7 1.50
Ca 122 0.38 99 3.11
Gd 201 0.73 122 3.63
Catalyst: 3Ni5Cu/CeZrCa, Various Surfactant to Metal Ratio (S/M)
S/M = 0 110 0.17 46 1.55
S/M = 0.2 143 0.24 49 1.68
S/M = 0.5 122 0.27 64 2.21
S/M = 1.25 119 0.32 92 2.69

62
Support: CeZrCa, Various Surfactant to Metal Ratios
(S/M)
S/M=0
S/M=0.2
S/M=0.5
S/M=1.25
112
167
141
121
0.16
0.32
0.27
0.33
57
78
77
110
1.43
1.92
1.91
2.73
Catalyst: 3Ni5Cu/CeZrCa, Various calcination temperatures
T=5000C 109 0.32 92 2.94
T=5750C 109 0.33 91 3.03
T=6500C
109 0.28 78 2.57

63
It is observed that the surface area and pore volume decreased upon impregnation
of the active metals on the support with the exception of La. This is because of the
penetration of the dispersed nickel and copper oxides into the pores of the support
thereby narrowing the pore diameter. The same theory holds for the reduced surface area
observed for the ternary catalysts compared to the binary supported catalyst.
Furthermore, two methods of impregnation were employed for the catalysts: under
atmospheric and vacuum conditions. These were characterized to evaluate the effect of
impregnation conditions on the performance and structural characteristics. The results
reveal that the BET surface area and pore volume is lower in the vacuum prepared
catalyst relative to that prepared under atmospheric pressure owing to the deep
penetration of the active metal particles into the inner pores of the support under vacuum
conditions. A similar trend was reported by Zhou et al. (2011) for a Co/SiO2 catalyst.
The pore volume to surface area ratio is a measure of the porosity of the materials;
supports and corresponding catalysts possessing high PV/SA are expected to exhibit
good activity. It is also observed that increasing the amount of surfactant increases the
pore volume, average pore diameter and PV/SA as shown in Table 4.1 and Figure 4.2 (a)
but has a negligible effect on the surface area. The effect of reducing the calcination
temperature has negligible effect on the surface area of the catalysts; however, it can be
observed that at higher calcination temperatures, the pore diameter and volume slightly
decrease as shown in Figure 4.2 (b). This can be attributed to sintering of the catalyst at
higher temperatures and should be avoided.

64
Figure 4.2(a) Variation of PV/SA with surfactant/metal ratio
Figure 4.2 (b) Variation of pore size with calcination temperatures
0
0.5
1
1.5
2
2.5
3
0 0.2 0.4 0.6 0.8 1 1.2 1.4
Po
re V
olu
me
/Su
rfac
e a
rea
(nm
)
Surfactant/Metal ratio
NCCZCa
50
55
60
65
70
75
80
85
90
95
100
500 550 600 650 700
Po
re S
ize
(A
)
Calcination temperature (C)
NCCZCa

65
4.1.3 H2-Chemisorption and ICP-MS
The metallic surface area and metal dispersion of the active components (Ni and
Cu) were determined by means of the H2 chemisorption technique. All catalysts were
prepared by wet impregnation method and loaded with the same amount of nickel and
copper, i.e. 3%Ni and 5%Cu. However the actual composition in terms of weight
fraction, of Ni and Cu loaded on the catalyst was determined using Inductively Coupled
Plasma-Mass Spectrometry technique (ICP-MS). From the ICP-MS findings, it is then
possible to make appropriate corrections to the metallic surface area and metal dispersion
measurements. Table 4.2 shows the metal dispersion and metallic surface area alongside
the ICP-MS elemental composition results.
It can be seen that the catalyst with the highest metal dispersion is
3Ni5Cu/CeZrCa, which should translate into better catalytic activity. Higher Ni and Cu
dispersions are required for proper distribution of active sites over the catalyst surface,
rather than agglomerates which are more prone to coking and show less catalytic
activity. Also, the catalyst calcined at 500oC has the highest metal dispersion of 4.1%,
which means that the use of higher temperatures for thermal treatment tends to cause
agglomeration of Ni and Cu particles thus reducing the dispersion of the active metals
and reducing the catalytic activity. It is also observed that the metal dispersions for the
catalysts prepared with surfactant are higher than that prepared without surfactant. An
increase in metal loading (ICP-MS) beyond the theoretical amount results in low
dispersion of metals on the support.

66
Table 4.2 H2-Chemisorption and ICP-MS results
Catalyst
Metal Surface
Area
(m2/g sample)
Metal
Dispersion
(%)
Ni Mass
fraction
(ICP-MS)
(%)
Cu Mass
fraction
(ICP-MS)
(%)
Catalyst: 3Ni5Cu/CeZrM, Surfactant/Metal = 1.25
La 1.12 2.2 2.9 5.0
Mg 0.83 1.5 3.3 5.3
Y 1.21 2.3 2.3 3.6
Ca 0.99 2.4 2.4 3.8
Gd 1.11 2.0 3.2 5.3
Catalyst: 3Ni5Cu/CeZrCa, Various calcination temperature
T=500oC 1.63 4.1 2.5 4.8
T=575oC 0.85 1.9 2.4 4.3
T=650oC 0.99 2.4 2.4 3.8
Catalyst: 3Ni5Cu/CeZrCa, Various Surfactant to Metal Ratio (S/M)
S/M = 0 1.98 3.0 2.6 4.3
S/M = 0.2 2.90 5.6 1.9 3.2
S/M = 0.5 2.28 4.4 4.1 6.7
S/M = 1.25 1.63 4.1 2.5 4.8

67
4.1.4 Temperature Programmed Reduction (TPR)
The TPR patterns of the ternary oxide supports and their corresponding Ni-Cu
impregnated catalysts are represented in Figure 4.3. The thermal conductivity detector
(TCD) signal output on the graphs represents the H2 consumption of the sample during
the analysis and the occurrence of peaks indicates reduction of the oxides. The TPR
profiles of the Gd, Y, La and Mg supports reveal two peaks representing the reduction of
surface and bulk oxygen species in the Ceria lattice. As in the case of La, the surface
oxygen is reduced at 646oC whilst the bulk oxygen is reduced at 837
oC. This is because
the high mobility of the surface oxygen ions allows for ease of removal during reduction
while the bulk oxygen ions needs to be diffuse to the surface before it can be reduced,
thus the higher temperature required for bulk reduction. ZrO2 is not reduced within this
temperature range due to its refractory nature. On the other hand, the Ca support presents
a broad peak over the range of 300 – 900oC which is as a result of the formation of a
solid solution. Furthermore, the profiles of the bimetallic catalysts show increased
hydrogen consumption in the lower temperature region representing the reduction of
Cu2+
species to Cu0 at about 300
oC as indicated on the profiles while the reduction of
Ni2+
to Ni0
occurs at temperatures close to 400oC.
The temperature at which reduction of CuO occurs is taken as Tmax to determine
the reducibility (1/Tmax) of the catalysts whereby a lower value of Tmax implies a more
reducible catalyst. From Figure 4.3, the catalyst with Ca as the promoter element
exhibited the least Tmax of 262oC which translates to higher reducibility while Gd had the
highest Tmax of 3480C. This shows the varying effects of different promoter elements on
the reducibility of the catalysts.

68
The profiles that appear to have a single peak at a temperature lower than 500oC
are as a result of the superimposition of the Cu and Ni peaks.

69
Figure 4.3 TPR profiles for CeZrM supports and 3Ni5Cu/CeZrM catalysts
-10
0
10
20
30
40
50
0 500 1000
Sign
al (
a.u
)
Temperature(C)
Ca
CZCa
-10
0
10
20
30
40
50
60
70
0 500 1000
Sign
al (
a.u
)
Temperature(C)
Gd CZGd
NCCZGd
-10
0
10
20
30
40
0 500 1000
Sign
al (
a.u
)
Temperature(C)
La
CZLa
NCCZLa
-5
0
5
10
15
20
25
30
35
40
0 500 1000
Sign
al (
a.u
)
Temperature(C)
Mg
CZMg
NCCZMg
-10
0
10
20
30
40
0 500 1000
Sign
al (
a.u
)
Temperature(C)
Y
CZY
NCCZY
26
20 C
34
80 C
33
2.8
0 C
32
50 C
33
3.3
0 C

70
4.1.5 Thermogravimetric Analysis (TGA)
Thermo gravimetric analysis was carried out on uncalcined catalyst samples with
La and Ca promoter elements to determine the variation of the catalyst weight with
increasing temperature thereby aiding in the selection of a more suitable calcination
temperature for the catalysts. The resulting TGA curves are shown in Figure 4.4.
Two stages of weight loss can be observed in both curves; the first stage occurs
between room temperature and 200oC while the second stage occurs between 280
oC and
500oC. The first stage of weight loss can be attributed to removal of moisture from the
catalyst pores and hydrated salts of Ni(NO3)2.6H2O and Cu(NO3)2.xH2O that were
impregnated on the support, while the second stage is the removal of the nitrates (NO3-).
A somewhat third stage is observed in the case of Ca catalyst at 720oC which is
ascribable to possible sintering of the catalyst which occurs at very high temperatures
causing a reduction of pore size and further deactivation of catalyst. Based on these
results, a calcination temperature higher than 500oC would be unnecessary and could
damage the catalyst. Therefore, a lower temperature of 500oC was chosen as the
optimum calcination temperature for subsequent tests.

71
Figure 4.4 TGA pattern for 3Ni5Cu/CeZrM, M=La and Ca
17
20
23
0 100 200 300 400 500 600 700 800
we
igh
t lo
ss (
mg)
Temperature (C)
NiCu/CZLa
12
13
14
15
16
17
0 100 200 300 400 500 600 700 800 900
we
igh
t lo
ss (
mg)
Temperature (C)
NiCu/CZCa

72
4.1.6 Temperature Programmed Oxidation (TPO)
The used catalysts obtained after undergoing the WGS reaction were analysed for
the amount of carbon deposited on the catalyst under certain operating conditions over a
period of testing (time on stream - TOS) using the TPO technique. The TPO technique
used was similar to the TGA method and was based on the weight difference in the
catalyst before and after the analysis which is carried out in an oxygen atmosphere.
Oxygen burns off any carbon present while the time on stream to which the catalyst was
exposed during the reaction (5 – 6 hours) was also used to determine the carbon
propensity factor. The results are shown in Table 4.3.
The CPF depends on several factors such as the feed formulation, catalyst
composition, operating conditions and duration of reaction. The results show a generally
low CPF value for all the catalysts less than 40 mg C/g catalyst.hr as compared to data
reported in literature for similar support composition (Sengupta, 2011). This is because
of the catalyst composition of ceria-zirconia mixed oxides, which are known to reduce
coke formation, in addition to the promoter elements selected. The ternary oxide
catalysts show a CPF lower than the binary oxide catalyst which reveals the effect of
adding a promoter element to reduce the coking affinity of the catalyst; the only
exception is La with a higher CPF value. Catalysts with Mg and Gd promoter elements
exhibited more tolerance to coking. The effect of increasing the amount of surfactant
used in catalyst preparation on the coking tolerance of the catalyst with Ca as the
promoter element was also investigated. The results show that the CPF reduced with a
higher amount of surfactant thus re-emphasizing the benefit of using the surfactant
assisted route as a preparation method.

73
Table 4.3 Carbon Propensity factors for 3Ni5Cu/CeZrM catalysts
Catalyst
(3Ni5Cu/CeZrM)
Carbon Propensity
Factor
(mg C/g catalyst.hr)
La 23.8
Mg 9.6
Y 12.1
Ca (Tcalc = 650oC) 12.7
Gd 6.4
Binary (M=0) 13.5
Effect of S/M ratio on CPF for
3Ni5Cu/CeZrCa
S/M = 0 20.8
S/M = 0.2 18.1
S/M = 0.5 17.7
S/M = 1.25
(Tcalc = 500oC)
15.3

74
4.1.7 X-Ray Diffraction (XRD)
XRD measurements were carried out to determine the crystallinity and
composition of the catalysts and their support. The XRD pattern for the various catalysts
and supports prepared by surfactant assisted route alongside pristine NiO and CuO are
shown in Figures 4.5 (a) – (b). The pristine NiO and CuO were used to identify the
presence or absence of crystalline phases of the active metals on the impregnated
support. Figure 4.5 (c) shows the XRD spectra for the Ca catalyst prepared by co
precipitation route without any surfactant.
Based on the figures, the XRD patterns are representative of a true mixed oxide
phase having a cubic fluorite structure. There is no other phase present or phase
segregation in the diffraction patterns. Also, the varying promoter elements have no
effect on the nature of the spectra. It can be observed that in the case of all the catalysts
prepared by surfactant route, the diffraction peaks of the supports are identical to those
of the catalysts with no indication of any crystalline NiO and CuO phases present which
establishes the presence of a highly dispersive monolayer of the active metals provided
by the use of surfactant method in preparing the catalysts. In the case of the Ca catalyst
produced by co precipitation with no surfactant, the peaks of Ni and Cu can be identified
as shown in Figure 4.5(c) indicating the presence of bulk crystalline phases of NiO and
CuO. The presence of bulk crystalline phases of the active metal is detrimental to the
water gas shift reaction as it could catalyze coke forming reactions. This finding
corresponds with the results of H2 chemisorption in which catalyst produced with
surfactant exhibit higher metal dispersion than that prepared without surfactant.

75
Figure 4.5 (a) XRD pattern for 3Ni5Cu/CeZrM, M= Gd and Mg
-100
0
100
200
300
400
500
600
0 10 20 30 40 50 60 70 80 90 100
Inte
nsi
ty
2
Gd CZGd NiCu/CZGd NiO CuO
-100
0
100
200
300
400
500
600
0 20 40 60 80 100
Inte
nsi
ty
2
Mg CZMg
NiCu/CZMg
NiO
CuO
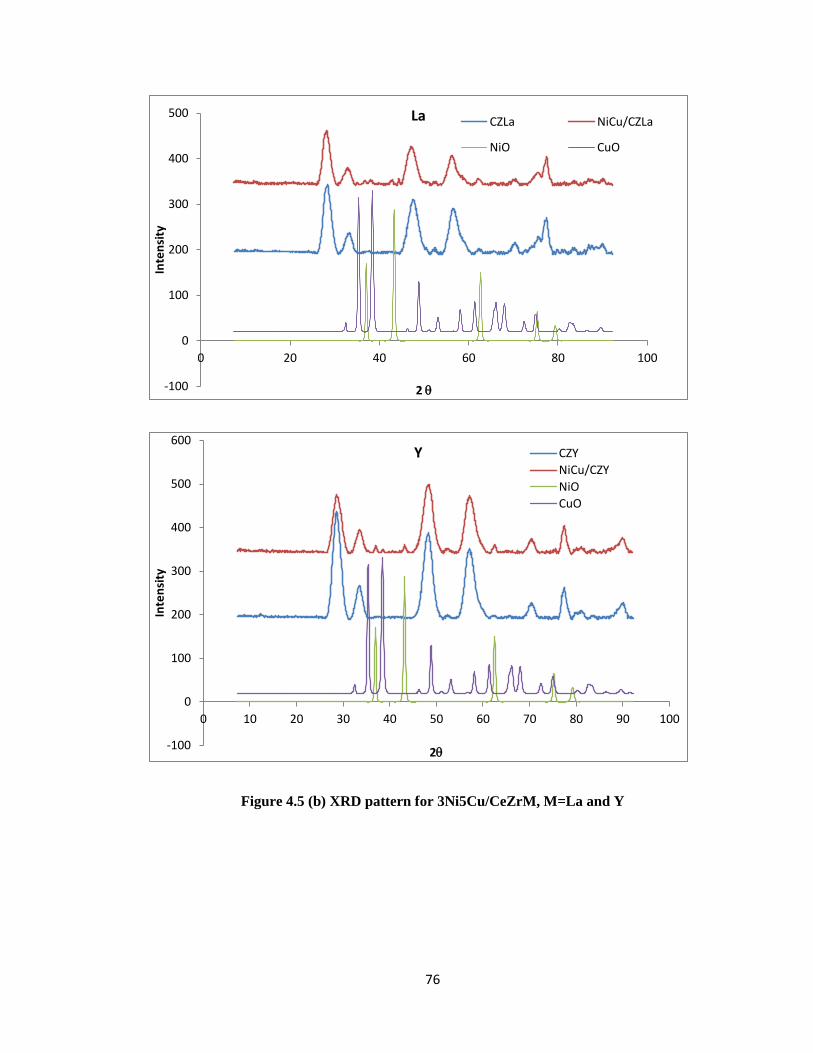
76
Figure 4.5 (b) XRD pattern for 3Ni5Cu/CeZrM, M=La and Y
-100
0
100
200
300
400
500
0 20 40 60 80 100
Inte
nsi
ty
2
La CZLa NiCu/CZLa
NiO CuO
-100
0
100
200
300
400
500
600
0 10 20 30 40 50 60 70 80 90 100
Inte
nsi
ty
2
Y CZY
NiCu/CZY
NiO
CuO

77
Figure 4.5 (c) XRD pattern for 3Ni5Cu/CeZrM, M=Ca for S/M = 1.25 and 0
-100
0
100
200
300
400
500
0 10 20 30 40 50 60 70 80 90 100
Inte
nsi
ty
2
Ca (S/M = 1.25) CZCa 1.25 NCCZCa 1.25 NiO CuO
-100
0
100
200
300
400
500
600
700
0 20 40 60 80 100
Inte
nsi
ty
2
Ca (S/M=0) CZCa NiCu/CZCa 0CTAB
NiO
CuO
78
4.2 CATALYTIC ACTIVITY EVALUATION
4.2.1 CATALYST SCREENING
The activities of the developed ternary oxide catalysts 3Ni5Cu/CeZrM (M = Ca,
Mg, La, Y, Gd) were tested for the water gas shift reaction under identical operating
conditions using 30%CO/balance N2 in a packed bed tubular reactor at atmospheric
pressure and 500oC. A binary oxide catalyst 3Ni5Cu/CeZr previously developed in-
house was also tested to serve as a benchmark for evaluating the effect of adding a
promoter element to the support on the activity of the catalyst in the water gas shift
reaction. At this stage, the catalyst supports were prepared with surfactant/metal ratio of
1.25 and the corresponding results are shown in Figures 4.6 (a) and (b). The
impregnation of the active metals for the catalysts presented in Figure 4.6 (a) was
performed at atmospheric pressure while those presented in Figure 4.6 (b) were
impregnated under vacuum conditions in a rotary evaporator; in both cases the
impregnated catalysts were calcined at 650oC. From the results, it is evident that the only
ternary oxide catalyst with a higher activity in terms of CO conversion and H2 yield than
the binary catalyst is the one with Ca as the promoter. All the other ternary systems have
lower conversions and H2 yields than the binary catalyst. It is also observed that the
catalysts prepared under vacuum conditions gave better results than those prepared under
atmospheric conditions. The order of the activity exhibited by the ternary catalysts is as
follows; Ca > Gd > Mg > La > Y, with Ca giving a CO conversion of 47% and 58% in
Figure 4.6 (a) and (b) respectively while Y with the least activity gave a CO conversion
of 17% and 21% for atmospheric and vacuum impregnated catalysts, respectively.

79
The activity of the Ca catalyst and the binary catalyst appeared stable but in the
case of Mg, Y, La and Gd, the conversion tends to decrease steadily, this is more evident
in the catalysts prepared under normal atmospheric conditions. The better performance
of the catalysts prepared under vacuum conditions can be attributed to the strong
interaction between the Ni and Cu particles with the support. This interaction occurs
during impregnation under vacuum whereby the active metal particles penetrate deeply
into the inner pores of the CeZrM support causing a uniform dispersion of the active
metal and thereby preventing the agglomeration of the particles. Under vacuum
conditions, a pressure gradient is formed between the support and the external
surroundings which improve the rate of diffusion of the active metal particles into the
pores of the support (Zhou et al., 2011). This is further evidenced in Table 4.1 where the
physisorption results for 3Ni-5Cu/CeZrCa catalyst in which the BET surface area and
pore volume is lower when prepared under vacuum compared to that prepared by normal
conditions. Also, the chemisorption results for the binary catalyst, 3Ni5Cu/CeZr further
supports this trend as the vacuum prepared sample yields a metal dispersion of 3.2%
while the sample prepared under atmospheric pressure yields a lower metal dispersion of
2.2%. Thus, the vacuum impregnation method was employed for other catalyst samples
used for subsequent studies. The H2 selectivity of all the catalysts was greater than 90%
showing the suitability of the catalyst for hydrogen production by the water gas shift
reaction. An important observation was the non-existence of methane in the product
stream and minimal coke deposition on the used catalyst as evidenced in the GC analysis
and TPO measurements.

80
The ternary oxide catalyst with Ca was thus selected as the best catalyst and was
used for further tests in the rest of the study in order to optimize its preparation method
and operating conditions as well as to test its stability and activity in the presence of
reformate gas and other reactor conditions.

81
0
10
20
30
40
50
60
70
0 1 2 3 4 5
Co
nve
rsio
n (
%)
TOS (hr)
CO Conversion 3Ni5Cu/CZ
3Ni5Cu/CZLa
3Ni5Cu/CZCa
3Ni5Cu/CZY
3Ni5Cu/CZMg
3Ni5Cu/CZGd
0
20
40
60
80
0 1 2 3 4 5
H2 Y
ield
(%
)
TOS (hr)
Hydrogen yield
3Ni5Cu/CZ
3Ni5Cu/CZLa
3Ni5Cu/CZCa
3Ni5Cu/CZY
3Ni5Cu/CZMg
3Ni5Cu/CZGd
0
20
40
60
80
100
0 1 2 3 4 5
H2
Sele
ctiv
ity(
%)
TOS(hr)
Hydrogen Selectivity 3Ni5Cu/CZ
3Ni5Cu/CZCa
3Ni5Cu/CZY
3Ni5Cu/CZGd
3Ni5Cu/CZLa
3Ni5Cu/CZMg
Figure (4.6a) Performance evaluation of 3Ni5Cu/CeZrM catalysts (normal atmospheric
impregnation) for water gas shift reaction using 30%CO/balance N2 at 5000C in PBTR at
atmospheric pressure.

82
0
20
40
60
80
100
0 1 2 3 4 5
CO
Co
nve
rsio
n (
mo
l %)
TOS (hr)
CO Conversion 3Ni5Cu/CZY-rotavap
3Ni5Cu/CZ-rotavap
3Ni5Cu/CZGd-rotavap
3Ni5Cu/CZCa-rotavap
3Ni5Cu/CZMg-rotavap
3Ni5Cu/CZLa-rotavap
0
20
40
60
80
0 1 2 3 4 5
H2
Yie
ld (
%)
TOS (hr)
Hydrogen yield
3Ni5Cu/CZ-rotavap
3Ni5Cu/CZCa-rotavap
3Ni5Cu/CZGd-rotavap
3Ni5Cu/CZY - rotavap
3Ni5Cu/CZMg-rotavap
3Ni5Cu/CZLa-rotavap
0
20
40
60
80
100
0 1 2 3 4 5
Sele
ctiv
ity(
%)
TOS(hr)
Hydrogen Selectivity
3Ni5Cu/CZ-rotavap
3Ni5Cu/CZCa-rotavap
3Ni5Cu/CZY-rotavap
3Ni5Cu/CZGd-rotavap
3Ni5Cu/CZLa-rotavap
3Ni5Cu/CZMg-rotavap
Figure (4.6b) Performance evaluation of 3Ni5Cu/CeZrM catalysts (vacuum impregnation) for water
gas shift reaction using 30%CO/balance N2 at 161sccm and 5000C in PBTR at atmospheric pressure.

83
Figure (4.6c) Turnover frequency of 3Ni5Cu/CeZrM catalysts
0
0.1
0.2
0.3
0.4
0 1 2 3 4 5 6
TOF
(1
/s)
TOS (hr)
Turnover frequency
Gd
Mg
Y
La
Ca
Binary

84
4.2.2 PARAMETRIC STUDY
Several operating parameters were varied in order to optimize the catalyst
preparation method of the best catalyst selected, 3Ni5Cu/CeZrCa, based on activity
screening. The parameters varied include calcination temperature, surfactant/metal ratio,
reaction temperature, feed composition, total pressure and time on stream. The results of
the parametric studies are discussed in the sub-sections below.
4.2.2.1 Effect of Calcination Temperature
Initially, the catalysts screened for the WGSR were calcined at 650oC after
impregnation of the active metals Ni and Cu. However, results from the TGA
characterization as shown in Figure 4.4 reveal that such a high calcination temperature is
unnecessary and could promote sintering of the catalyst and a subsequent reduction in
the activity. Based on this finding, the calcination temperature of 3Ni5Cu/CeZrCa
catalyst was varied between 425 – 650oC to evaluate the effect of thermal treatment on
the activity of the resulting catalyst. The activation of the catalyst was performed at the
corresponding calcination temperature and the reaction was carried out at 500oC with
30% CO/balance N2 in the packed bed reactor at atmospheric pressure. The result shown
in Figure 4.7 illustrates this effect. The catalyst calcined at 425oC and 500
oC gave almost
similar CO conversion of 61.9% and 62.6% with H2 yield of 56.2% and 58.9%,
respectively. In contrast, the catalysts calcined at 575oC and 650
oC resulted in lower CO
conversions and yields. The H2 selectivity was not strongly influenced by the varying
calcination temperature. It can be deduced from the result that the optimum temperature
for calcination of the catalyst is 500oC whereas employing higher temperatures such as

85
575oC or 650
oC is detrimental to the catalytic activity. This can be attributed to a loss in
metallic surface area and porosity as the temperature increases; this is illustrated in the
characterization results in Table 4.1 and 4.2. Higher calcination temperature also causes
agglomeration of the active metal particles leading to non-uniform dispersion and
reduced activity.

86
50
55
60
65
70
425 500 575 650
Co
nve
rsio
n (
mo
l%)
Calcination Temperature (0C)
CO Conversion
40
45
50
55
60
425 500 575 650 725
H2 y
ield
(%)
Calcination temperature (0C)
Hydrogen yield
60
80
100
425 500 575 650 725
H2 s
ele
ctiv
ity(
%)
Calcination temperature (0C)
Hydrogen selectivity
0.08
0.16
0.24
0.32
425 525 625 725
TOF
(1/s
)
Calcination Temp(oC)
TOF
Figure (4.7) Effect of variation of calcination temperatures on activity of 3Ni5Cu/CeZrCa
catalyst using 30%CO/balance N2 at 5000C in PBTR at atmospheric pressure.

87
4.2.2.2 Effect of Surfactant/Metal Ratio
The amount of surfactant used in the preparation of the catalyst support was
varied so as to determine the effect on the catalytic activity. The ratio of surfactant/metal
employed were 0.2, 0.5 and 1.25 in addition to the co-precipitated catalyst prepared
without surfactant (S/M = 0), and the results obtained thereof are presented in Figure 4.8.
It is evident that the use of surfactant in the preparation of the support causes an increase
in the CO conversion and H2 yield. However, increasing the surfactant/metal ratio
beyond S/M = 0.5 causes no further improvement in catalyst activity. If the use of
surfactant can be limited to S/M ratio of 0.5, it would translate into a reduced cost in
terms of amount of surfactant utilized and cost of disposal of waste that results during
catalyst making. The improvement in catalyst activity observed with increasing
surfactant amount can be ascribed to the improved textural characteristics of the resulting
catalyst as evidenced in the TPO, XRD, chemisorption and Physisorption results
discussed previously in section 4.1. The catalyst prepared with surfactant provides a
homogenous dispersion of the active metals and prevents the formation of Ni and Cu
crystallites which would otherwise promote coke formation if present. This is supported
by the TPO measurement of the carbon propensity factor in Table 4.3 which steadily
reduced with increasing surfactant/metal ratio. To further support this observation, the
results show that the metal dispersion, and surface area, pore volume and pore diameter
were improved upon addition of surfactant. This shows that the amount of surfactant
utilized in the catalyst preparation plays an important role in the catalyst structure and
resultant activity. From this analysis, it is clear that the optimum surfactant/metal ratio is
0.5 and going forward, this ratio was applied to catalysts used for subsequent studies.

88
20
40
60
80
0 0.25 0.5 0.75 1 1.25
Co
nve
rsio
n (
mo
l%)
Surfactant/Metal Ratio
CO Conversion
0
20
40
60
80
100
0 0.25 0.5 0.75 1 1.25
H2 Y
ield
(m
ol%
)
Surfactant/Metal Ratio
H2 yield
0
20
40
60
80
100
0 0.25 0.5 0.75 1 1.25
H2 s
ele
ctiv
ty (
mo
l%)
Surfactant/Metal Ratio
H2 Selectivity
-0.2
1E-15
0.2
0.4
0.6
0 0.5 1 1.5
TOF
(1/s
)
Surfactant/Metal Ratio
Effect of surfactant on
turnover frequency
Figure (4.8) Effect of surfactant/metal ratio on activity of 3Ni5Cu/CeZrCa catalyst using
30%CO/balance N2 at 5000C in PBTR at atmospheric pressure.

89
4.2.2.3 Effect of Reaction Temperature
The water gas shift reaction is a reversible and slightly exothermic reaction; this
implies that, a lower temperature would be thermodynamically beneficial for the forward
reaction but kinetically unfavourable for the reaction. In order to study the influence of
reaction temperature on the dynamics of the WGSR on the developed Ca catalyst,
various temperatures ranging between 450oC and 550
oC were employed for performance
evaluation, and the results are presented in Figure 4.9. From the graphs, at 450oC, the CO
conversion obtained was 38% with a H2 yield of 37% whereas at 500oC and 550
oC, CO
conversion of 65% and 62% and H2 yield of 60% and 57% were obtained, respectively.
This result indicates that the catalytic activity for the WGSR increases with increasing
temperature from 450oC up to 500
oC because of the kinetic limitation experienced at a
lower temperature of 450oC which limits the rate of the forward water gas shift reaction
whereas with any further increase in temperature beyond 500oC, the reaction becomes
controlled by thermodynamics thus reducing the observed activity. This indicates an
optimum reaction temperature of 500oC. On the other hand, the H2 selectivity at a lower
temperature of 450oC appears to be slightly favoured than at high temperatures whereas
there is no significant difference between the H2 selectivity at 500oC and 550
oC. This is
because the rate of increase of CO conversion is faster than the rate of increase of H2
yield between 450oC and 500
oC leading to formation of more CO2 than H2 as shown in
Figure 4.9b. A similar trend was reported by Osa et al. (2012).

90
0
20
40
60
80
400 450 500 550 600
Co
nve
rsio
n (
%)
Temperature (C)
CO Conversion
0
20
40
60
80
400 450 500 550 600
H2 Y
ield
(%
)
Temperature (C)
H2 Yield
0
20
40
60
80
100
400 450 500 550 600
H2 S
ele
ctiv
ity
(%)
Temperature (C)
H2 Selectivity
Figure (4.9a) Effect of reaction temperature on activity of 3Ni5Cu/CeZrCa catalyst using
30%CO/balance N2 in PBTR at atmospheric pressure.

91
Figure (4.9b) Effect of reaction temperature on product distribution of 3Ni5Cu/CeZrCa
catalyst using 30%CO/balance N2 in PBTR at atmospheric pressure.
0
10
20
30
40
50
400 450 500 550 600
Pro
du
ct d
istr
ibu
tio
n (
mo
l%)
Temperature (oC)
Product distribution variation with temperature
CO2
CO
H2

92
4.2.2.4 Effect of Feed Composition
A very important part of this study is to apply the developed catalyst to reformate
gas feed containing a higher amount of CO (46.2 %) in addition to 8.5% CH4, 7.2% CO2
and 38.1 % H2 to determine the efficiency of the catalyst on WGSR under real industrial
conditions of reformate gas obtained from biogas dry reforming process. The results are
presented in Figures 4.10 and 4.11. A constant feed gas flow rate of 161 ml/min (sccm)
and H2O of 0.1 ml/min (sccm) giving a steam/CO ratio of 1.7 for reformate gas and 2.7
for 30%CO mixture was utilized for both catalysts. Figure 4.10a and 4.10b compares the
performance of the binary and ternary oxide catalysts using reformate gas; it is clear that
the Ca catalyst yields a higher and more stable CO conversion of 22% compared to the
binary catalyst which exhibits a declining conversion. Although the fresh binary catalyst
3Ni5Cu/CeZr started with a conversion of 17 %, the performance began to deteriorate
with prolonged time on stream due to coke deposition. This is quite different from the
results obtained using pure CO because of the higher carbon content in the reformate
gas.
The better performance of the ternary oxide catalyst indicating higher activity
and stability within 5 hours time on stream can be attributed to the presence of a
promoter element (Ca). In addition, the GC analysis (Appendix A) of the product stream
reveals negligible conversion of the CH4 present in the feed and no additional methane
formation. This shows the superior performance of the catalyst since it does not promote
undesired methanation side reaction. A non-catalytic run was also performed to show the
influence of using a catalyst for the WGSR at a temperature of 500oC.

93
Under similar gas and liquid flow rate, the ternary catalyst exhibited higher CO
conversion with a lower CO content as a result of the reduced steam/CO ratio for the
reformate gas compared to the 30% CO mix as shown in Figure 4.11a. This implies that
higher steam ratios are desired for better conversions, as discussed in section 4.2.2.5.

94
Figure (4.10a) Comparison of 3Ni5Cu/CeZrCa and 3Ni5Cu/CeZr catalysts using reformate
gas at 5000C in PBTR at atmospheric pressure.
Figure (4.10b) Product distribution comparison of 3Ni5Cu/CeZrCa and 3Ni5Cu/CeZr
catalysts using reformate gas at 5000C in PBTR at atmospheric pressure.
0
5
10
15
20
25
0 1 2 3 4 5
Co
nve
rsio
n (
%)
TOS(hr)
Binary versus Ternary
Conversion 3Ni5Cu/CZ
non catalytic
3Ni5Cu/CZCa
0
0.04
0.08
0.12
0.16
0 2 4 6
TOF(
1/s
)
TOS (hr)
Binary versus Ternary
catalyst effect on TOF
Binary
Ternary
0
10
20
30
40
50
0 2 4 6
Pro
du
ct d
istr
ibu
tio
n (
mo
l%)
TOS (hr)
Product distribution - reformate
feed & binary catalyst
H2 CO2
CO CH4
0
10
20
30
40
50
60
0 2 4 6
Pro
du
ct D
istr
ibu
tio
n (
mo
l%)
TOS (hr)
Product distribution - reformate
feed & ternary catalyst(Ca)
H2 CO2
CO CH4

95
Figure (4.11) Comparison of reformate and 30%CO/balance N2 feed using 3Ni5Cu/CeZrCa
catalyst at 5000C in PBTR at atmospheric pressure.
0
20
40
60
80
100
0 1 2 3 4 5 6
Co
nve
rsio
n (
%)
TOS (hr)
46.2% CO
30% CO

96
4.2.2.5 Effect of Steam/CO Ratio
The stoichiometry of the WGSR requires an equimolar ratio of steam to carbon
monoxide in order to proceed. However, ratios higher than 1 are usually employed to
prevent the occurrence of side reactions such as methanation and CO disproportionation
thereby pushing the reaction in the forward direction. Methanation reaction is undesired
because it utilizes some of the H2 produced to form methane thereby causing a reduction
in H2 yield; meanwhile the exothermic nature of the methanation reaction could cause
thermal shock. Furthermore, the CO disproportionation reaction leads to carbon
deposition on the catalyst thereby causing catalyst deactivation.
In order to evaluate the effect of increasing the ratio of steam/CO on the catalytic
activity of 3Ni5Cu/CeZrCa, a set of runs varying the amount of steam/CO between 1.7,
2.7 and 3.7 were performed. CO conversion and H2 yield results were obtained based on
different reformate flow rates with a constant H2O flow rate of 0.1 ml/min. The results
are presented in Figure 4.12a. An average conversion of 33% and H2 yield of 32% was
obtained at steam/CO ratio of 1.7, which increased to 48% conversion and 58% H2 yield
upon increasing the amount of steam to a ratio of 2.7. Further increase in the ratio of
steam/CO to 3.7 had no significant change on the CO conversion, thus an optimum
steam/CO ratio of 2.7 can be employed whilst saving cost of steam utilization. Methane
formation was found to be negligible for all steam/CO ratios employed.
The observed increase in CO conversion between 1.7 and 2.7 ratios is due to the
oxidation of coke deposited on the catalyst surface thereby minimizing catalyst
deactivation and the prevention of other side reactions from occurring. Although no
further increase was observed in the CO conversion at steam/CO of 3.7, a clear

97
increment is exhibited in the H2 yield as a result of using excess steam. This indicates
that under the given conditions, the water gas shift reaction becomes stabilized whilst the
excess steam oxidizes any carbon present to form more H2 and CO2 thereby increasing
the H2 yield drastically. This observation was further confirmed by the H2/CO2 ratio in
the product distribution which was greater than 1. The use of excess steam tends to
increase the catalyst surface coverage with oxygen thereby partly oxidizing the surface
atoms of the active metals, Ni and Cu, and reducing the accessibility to active Ni and Cu
atoms. This results in an insignificant change in CO conversion.

98
Figure (4.12) Effect of steam/CO ratio using reformate gas as feed with 3Ni5Cu/CeZrCa
catalyst at 5000C in PBTR at atmospheric pressure.
0
20
40
60
80
100
0 1 2 3 4 5 6 7
Co
nve
rsio
n (
mo
l%)
TOS (hr)
Effect of S/CO (reformate)
S/CO=1.7
S/CO=2.7
S/CO=3.7
0
20
40
60
80
100
0 1 2 3 4 5 6 7
H2 Y
ield
(%
)
TOS (hr)
H2 Yield
S/CO=1.7 S/CO=2.7 S/CO=3.7
0
10
20
30
40
50
60
1.5 2 2.5 3 3.5 4
Pro
du
ct d
istr
ibu
tio
n (
mo
l%)
S/CO
Product distribution variation with Steam/CO ratio
CO2
CO
H2
CH4

99
4.2.2.6 Effect of Pressure in PBTR
The water gas shift reaction can be applied to several processes ranging from
biomass/coal gasification to reforming reactions in order to either improve the yield of
H2 or to shift the CO/H2 ratio in syngas for use in gas-to-liquid applications. In a typical
gasification process, high pressure conditions can be expected. Majority of studies have
focused on performing the WGSR at atmospheric pressures with minimal work done at
high pressures. In this section, the effect of operating at high pressure in a conventional
packed bed reactor was investigated and the results are presented in Figure 4.13. It is
known that the WGSR is an equimolar reaction and would not be affected by a change in
pressure. Interestingly, the results of this study show a different trend. The conversion is
observed to increase threefold from 9% to 28% when the pressure is increased from
atmospheric to 200 psi (13.6atm). However, a further increase in pressure beyond 200
psi (13.6atm) yields no additional increase in conversion; instead, a slight decrease is
observed. Similar trends in which the relationship between WGSR activity and
increasing pressure either follows a downward convex curve or stabilises according to a
Langmuir isotherm curve have been reported by Padovani and Lotteri (1937), Atwood et
al. (1950) and Chinchen et al. (1984). The observed increase of activity with pressure is
as a result of the longer contact time created and increased reactant concentration
allowing more reactant molecules to convert to products. The observed decrease in
activity with further increase in pressure reported by Padovani and Lotteri (1937) was
attributed to the formation of methane at pressures greater than 20 bar (20 atm), they had
observed an increase in activity up to a maximum of 10 – 20 bar (atm).

100
Atwood et al. (1950) reported a two fold increase in activity up to 10 atm and
only a slight increase in activity with further increase in pressure. Other authors such as
Rhodes and Hutchings (2003) and Bohlbro (1962) reported a linear relationship over the
range of pressures used. In this study, a slight decline was observed upon increasing the
pressure beyond 200 psi (13.6atm). There was also no observation of methane formation
and the amount of decline was far smaller than Padovani’s work (1937); it is therefore
safe to infer that the pattern observed in this study followed the Langmuir isotherm
curve. An optimum pressure of 200 psi (13.6atm) was thus selected for further kinetic
studies as discussed in subsequent sections.

101
Figure (4.13) Effect of pressure on WGSR using reformate gas at 275sccm gas with
steam/CO ratio of 2.7 and 3Ni5Cu/CeZrCa catalyst at 5000C in PBTR
0
10
20
30
40
0 1 2 3 4 5 6 7
Co
nve
rsio
n (
%)
TOS (hr)
atm P
150psi
200psi
250psi
0
10
20
30
40
0 1 2 3 4 5 6 7
H2
yie
ld (
%)
TOS (hr)
150psi
200psi
250psi
0
20
40
60
80
100
0 1 2 3 4 5 6 7
H2
Sele
ctiv
ity
(%)
TOS (hr)
150psi
200psi
250psi

102
4.2.2.7 Statistical Analysis of Operating Parameters affecting Catalyst Activity
Statistical analysis was performed on the various parameters studied in this section using
the Analysis of Variance (ANOVA) technique to investigate their effect on activity, in
terms of conversion. Minitab statistical software was employed for this purpose. In this
study, the general linear model was utilized to fit the experimental data available. The
results of the analysis are shown in Figures 4.14 and 4.15 with the detailed test results in
Appendix B. The main effects plot in Figure 4.14 reveal that the major factors
contributing to the reactant conversion are feed gas composition, steam ratio, promoter
element (M) and reaction temperature and pressure based on their distance from the
mean line. The interaction plots (Figure 4.15) show the interacting effects of two or more
parameters on the conversion selected from the 4 major effects. The interaction of high
temperature (500oC), moderate steam/CO ratio (2.7) and gas composition using Ca
catalyst results in a higher effect on the overall conversion of reactants. The quantitative
contribution of each parameter is represented in the pareto plot of Figure 4.16 which
reveals that the gas composition and steam ratio are the major contributors to the
observed conversion which is similar to the results of the main effect plot. A normal
probability plot of the two level factorial used to obtain the pareto plot is also shown in
Figure 4.17 and is based on the design of experiment (DOE) statistical analysis method.

103
1.250.500.00
30
15
0
650575500 550500450
3.72.71.7
30
15
0
17.013.610.21.0 MgGdC a
reformatepure C O
30
15
0
S/MM
ea
nTcalc Trxn
S/C O Prxn M
Gas comp
Main Effects Plot for ConversionFitted Means
Figure 4.14 Main Effects ANOVA plot for parameters affecting catalyst activity
3.72.71.7 MgGdCa reformatepure CO
60
40
20
60
40
2060
40
20
Trxn
S/CO
M
Gas comp
450
500
550
Trxn
1.7
2.7
3.7
S/CO
Ca
Gd
Mg
M
Interaction Plot for Conversion (Main Effects)Data Means
Figure 4.15 Interaction Effects plot for parameters affecting catalyst

104
A
B
F
C
E
D
G
43210
Te
rm
Standardized Effect
A S/M
B Tcalc
C Trxn
D S/C O
E Prxn
F M
G Gas comp
Factor Name
Pareto Chart of the Standardized Effects(response is Conversion, Alpha = 0.05)
Figure 4.16 Pareto plot for parameters affecting catalyst activity
20100-10-20
99
95
90
80
70
60
50
40
30
20
10
5
1
Residual
Pe
rce
nt
Normal Probability Plot(response is Conversion)
Figure 4.17 Normal Probability Plot of effect of operating parameters on conversion

105
4.2.2.8 Extended TOS stability test
The stability of the 3Ni5Cu/CeZrCa catalyst for the WGSR using reformate feed
was tested in a PBTR for an extended time on stream of 12 hours and the results are
presented in Figure 4.18. It is evident that the catalyst delivered steady catalytic activity
with an average CO conversion of 21% and H2 yield of 30% under the prevailing
conditions. This shows there was no deactivation due to coking and no formation or
utilization of methane present in the reformate gas.

106
Figure (4.18) Extended TOS stability test using reformate gas with steam/CO ratio of 1.7
and 3Ni5Cu/CeZrCa catalyst at 5000C in PBTR at atmospheric pressure.
0
20
40
60
0 1 2 3 4 5 6 7 8 9 10 11 12 13
Co
nve
rsio
n (
mo
l%)
TOS (hr)
CO conversion
0
20
40
60
80
100
0 2 4 6 8 10 12 14
H2 y
ield
(%)
TOS(hr)
H2 yield

107
4.3 STRUCTURE ACTIVITY RELATIONSHIP (SAR)
The inherent structural and textural characteristics of the 3Ni5Cu/CeZrCa
catalyst such as the pore size, surface area, reducibility, basicity, metal dispersion and
carbon propensity factor contribute to the activity of the catalyst and can be tailored to
fine-tune the water gas shift reaction. It is therefore imperative to establish any possible
relationships between these surface/bulk characteristics and the resulting activity through
structure-activity relationships (SAR). SARs aid in determining the contribution of a
given characteristic to the unique performance of a catalyst in a given reaction based on
its structure and provide a better understanding of the thermodynamic, catalytic and mass
transfer phenomena in the water gas shift reaction. In this study, the structural properties
were determined using bulk/surface characterization techniques such as N2
physisorption, H2 chemisorption, TPR and TPO while the activity was determined from
the average CO conversion over the operating time on stream of 5 hours and plotted
against the corresponding characterization data as shown in Figures 4.19 (a) and (b). The
structural traits studied were the pore volume/surface area ratio obtained by
Physisorption, metal dispersion obtained by chemisorption, carbon propensity factor
from TPO, reducibility from TPR and the basicity. The reducibility was obtained from
the correlation, 1/Tmax where Tmax represents the reduction of CuO to Cu as reported by
(Khan and Smirniotis, 2008; Sengupta et al., 2012).
Figure 4.19 (a)-I represents the correlation between activity and pore
volume/surface area, it is evident that the Ca, Mg and Gd catalysts which gave high
conversion possess high pore volume/surface area. This implies that the pore
volume/surface area which is a measure of the catalyst porosity plays a critical role in the

108
catalyst performance. Figure 4.19 (a)-II illustrates the relationship between metal
dispersion and conversion with the Ca catalyst having the highest metal dispersion which
translates into the high activity exhibited because a high metal dispersion improves the
density of the active sites on the catalyst surface. The metal dispersion of the other
catalysts does not show any particular trend or influence on their activity. In Figure 4.19
(a)-III, the effect of the carbon propensity factor on catalytic activity is evaluated; the
results show that the catalysts (Ca, Mg, Gd) which exhibited better conversion have
lower CPF values. In Figure 4.19 (a)-IV, the reducibility of the catalysts is correlated
with its activity, it is clear that the Ca catalyst exhibits the highest reducibility which
translates into the highest activity observed. This is because of the ease with which
activation of the catalyst can be performed at lower temperatures.
In Figure 4.19 (b)-I, the activity of the catalysts is correlated with the Hammett
basicity function (H-) obtained from literature (Suguman et al., 1995; Idem et al., 2012).
The Hammett basicity function is a measure of the number of basic sites whose basic
strength is represented by the H-value. From the correlation, a more basic catalyst yields
higher activity for the WGSR with Ca exhibiting the highest basicity of 25 and a
corresponding conversion of 47% whereas Y displayed the lowest conversion of 18.8%
with a lower basicity of 6. The order of the basicity directly relates with the order of the
activity observed. This can be explained in terms of the formate-associative mechanism
typical of the WGSR in which carbon monoxide is adsorbed on the catalyst surface as
carbonyl specie and interacts with the hydroxyl groups from the H2O on Ni-Cu/CeZrM
interface to produce formate intermediates which is decomposed into the products, CO2
and H2 (Lee et al., 2013). The number of basic sites possessed by the catalyst thus

109
controls the rate of the reaction and the observed activity hence the observed high
activity of Ca catalyst having a high number of basic sites. Figure 4.19 (b)-II relates the
basicity with the reducibility indicating that a highly basic catalyst reduces the activation
temperature required therefore making the catalyst easily reducible. From the SARs, it
can be inferred that a combination of metal dispersion, porosity, reducibility, basicity
and carbon propensity factor contribute to some degree in the overall activity of the
catalyst and the absence of any desired trait could lead to poor catalyst performance.

110
Figure (4.19a) Structure activity relationship for 3Ni5Cu/CeZrM catalyst in WGSR; (I)
Activity versus Pore volume/surface area (II) Metal dispersion (III) Carbon Propensity
Factor (IV) Reducibility
La
Ca
Y Mg Gd
0
10
20
30
40
50
1 2 3 4
CO
co
nve
rsio
n (
%)
Pore Volume/Surface Area (X 10-9m)
Activity vs. PV/SA
(I)
La
Ca
Y Mg Gd
0
10
20
30
40
50
1.5 2 2.5
CO
co
nve
rsio
n(%
)
Metal Dispersion (%)
Activity vs. Metal Dispersion
(II)
La
Ca
Y Mg Gd
0
10
20
30
40
50
5 10 15 20 25
CO
co
nve
rsio
n (
%)
CPF (mg C/g catalyst.hr)
Activity vs. CPF (III)
Gd Y La Mg
Ca
15
25
35
45
55
2.88E-03 3.00E-03 3.82E-03
CO
co
nve
rsio
n (
%)
Reducibility (1/C)
Conversion versus Reducibility
(IV)

111
Figure (4.19b) Structure activity relationship for 3Ni5Cu/CeZrM catalyst in WGSR; (I)
Activity versus Hammett Basicity (II) Basicity versus Reducibility
Ca Mg
La
Y
0
5
10
15
20
25
30
Ham
me
tt B
asic
ity
Fun
ctio
n (
H-)
Reducibility (1/C)
Basicity versus Reducibility
(II)
Ca
Mg La
Y
0
10
20
30
40
50
5 15 25 35
CO
Co
nve
rsio
n(%
)
Hammett Basicity Function (H-)
Activity vs. Hammett Basicity
(I)

112
4.3.1 Statistical Analysis for Structure Activity Relationship
Several statistical analyses were performed on the experimental data obtained from the
characterization techniques and activity evaluation. The analysis carried out include (i)
Analysis of Variance (ANOVA) to determine the main effects and interaction effects of
the explanatory variables (catalyst structure) on the response variable (catalyst activity)
(ii) Pareto Quality analysis tool to determine the quantitative contribution of each
variable to the overall performance of the system. These analyses were performed using
Minitab statistical software.
The SAR data was analysed using the Fully Nested ANOVA technique based on its
suitability for the experimental data available and the results are given in the Appendix
B. The main effects plot of the structural characteristics on the catalyst activity
represented in Figure 4.20 (I) reveals that each of the measured catalyst characteristic
contributes to the observed activity. However it does not give a distinct difference on the
contribution of each property as all the characteristics have equal distance from the mean
line. However, Figure 4.20 (II) shows that basicity, reducibility and dispersion have
greater effects than pore volume/surface area. Another approach was thus employed
using a two level factorial analysis to obtain a pareto chart (Figure 4.21) which shows
that the reducibility and basicity are the key contributing factors to the observed catalytic
activity. This trend was further confirmed by obtaining a radar chart, Figure 4.22. The
interaction plot in Figure 4.20 (III) shows the interacting effects of the choice of
promoter element and the measured structural characteristics on the conversion
observed. The plot indicates that the Ca catalyst with the highest mean conversion
possesses a high basicity, reducibility and dispersion and intermediate pore
113
volume/surface area. Reducibility is also observed to increase with basicity. The other
relationships do not have a strong relationship but each contribute to some degree in the
overall effect of the catalyst as observed in the pareto plot.
Regression analysis was also performed to derive a correlation between the conversion
and structural characteristics of the catalyst. The resulting equation is shown below:
Conversion = -42.9887 + 117.18 reducibility – 28.5524 PV/SA – 86.7063 dispersion –
2.9163 basicity .................................... (4.1)
From the expression, the largest positive coefficient belongs to reducibility which
implies that reducibility plays a major effect in the subsequent outcome of the catalyst
activity. This result corresponds to that of the pareto plot. Figure 4.23 shows the parity
plot of the predicted conversion obtained from equation 4.1 against the experimental
conversion. A good fit with coefficient of variance (r2) of 1 was obtained.

114
3.8183.0803.0053.0002.878
50
40
30
20
3.483.192.552.462.24 2.42.32.22.01.5
27261260
50
40
30
20
YMgLaGdCa
reducibility
Me
an
PV Dispersion
basicity Promoter
Main Effects Plot for conversionData Means
3.8182.878
50
40
30
20
3.482.24
2.41.5
50
40
30
20
270
reducibility
Me
an
PV
Dispersion basicity
Main Effects Plot for conversionData Means
3.483.192.552.462.24 2.42.32.22.01.5 27261260 YMgLaGdCa
40
30
20
40
30
20
40
30
20
40
30
20
reducibility
PV
Dispersion
basicity
Promoter
2.878
3.000
3.005
3.080
3.818
reducibility
2.24
2.46
2.55
3.19
3.48
PV
1.5
2.0
2.2
2.3
2.4
Dispersion
0
6
12
26
27
basicity
Interaction Plot for conversionData Means
Figure 4.20 Analysis of Variance plots for structure activity relationship; (I)- (II) Main
Effects Plot (III) Interaction Plot *PV represents PV/SA
(III)
(I) (II)

115
B
C
D
A
120100806040200
Te
rm
Effect
A reducibility
B PV
C Dispersion
D basicity
Factor Name
Pareto Chart of the Effects(response is conversion2, Alpha = 0.05)
Lenth's PSE = 117.582
Figure 4.21 Pareto Plot showing the contribution of each structural characteristic to the
catalytic activity *PV represents PV/SA
Figure 4.22 Radar Plot showing the contribution of each structural characteristic to the
catalytic activity
0
10
20
30 reducibility
PV/SA
Dispersion
basicity
Radar Chart for SAR
Ca
Mg
La
Y
Gd

116
Figure 4.23 Parity plot of experimental versus predicted conversion
R² = 1
15
20
25
30
35
40
45
50
18 28 38 48 58
Exp
eri
me
nta
l co
nve
rsio
n (
%)
Predicted Conversion (%)

117
4.4 MEMBRANE CHARACTERIZATION RESULTS
The membrane reactor used in this study was characterized using different H2
mixtures first to verify the perm-selectivity of the membrane to pure H2 under varying
operating conditions of temperature and pressure and then to determine the relationship
between the rate of permeation of H2 and the difference in partial pressure and
temperature. The results of the characterization tests are presented in Figure 4.24 (a) and
(b) in terms of H2 recovery and flux. In all cases, pure H2 (from GC analysis) was
obtained on the permeate side indicating the 100% H2 selectivity of the membrane. As
mentioned earlier in equation 3.4, H2 recovery is defined as the molar ratio of H2 that
permeated through the membrane to the total amount of H2 supplied to the membrane.
On the other hand, the H2 flux is a measure of the number of moles of H2 permeating per
unit surface area per unit time. Both parameters relay information on the ease of
permeation of H2 through the membrane.
In Figure 4.24 (a)-I, the variation of the amount of H2 recovered is correlated with
the temperature and total pressure employed using 30% H2/balance N2 while Figure 4.24
(a)-II relates the influence of gas composition and total pressure to the H2 recovery. It is
important to note that the pressure on the permeate side is at atmospheric conditions in
all runs with no sweep gas employed, thus creating a trans-membrane pressure
differential allowing the permeation of hydrogen. The results show a linear increase in
the H2 recovery with increasing temperature and pressure. In Figure 4.24 (a)-II, the
increasing gas composition from 30% to 50% H2 translates to an increase in partial
pressure thereby increasing the recovery even at a constant temperature of 300oC. This
observation is in consonance with Sievert’s law in equation 3.1 which relates the flux of

118
H2 through a Pd membrane to the difference in partial pressure with an exponent of 0.5,
while the temperature dependence of the H2 recovery is described by Arrhenius law
relating the H2 permeability to the temperature as shown in equation 3.2.
.................................. (3.1)
....................................................... (3.2)
Combining equations 3.1 and 3.2 gives equation 3.3;
........................ (3.3)
................................. (3.4)
The Sievert’s law is in agreement with the dissociative adsorption, diffusion,
recombination and desorption mechanism of hydrogen on the surface of a Pd membrane.
Based on Sievert’s law, a plot of hydrogen flux against partial pressure difference was
obtained as illustrated in Figures 4.24 (b)-I and II. The hydrogen flux was computed
using the molar flow rate of hydrogen on the permeate side and known dimensions of the
membrane which gives a surface area of 1.65 x 10⁻³
m2. The equations describing the
linear relationship between flux and partial pressure difference is indicated in the plots
whereby the slope represents the permeance of hydrogen.
From Figures 4.24 (b)-I and II, it is evident that the permeance increases from 5 x
10-4
to 3.3 x 10⁻³
mol/m2s.kPa
0.5 when the H2 composition of the gas increases at
constant temperature while an increase from 5 x 10⁻⁴
to 1.7 x 10⁻³
mol/m2s.kPa
0.5 was
observed with increasing temperature from 300 – 500oC at a constant gas composition

119
and increasing total pressure. Knowing the membrane thickness of 76 µm, the flux data
was regressed with the temperature data yielding an activation energy of 22.7 kJ/mol,
and a pre-exponential factor of 4.56 x 10⁻⁶
mol.m/m2.s.kPa
0.5. The activation energy
obtained in this work is slightly higher than those reported in literature. Itoh et al. (1992)
obtained activation energy of 18.45kJ/mol with a Pd membrane of 200 µm thickness and
pre-exponential factor of 1.02 x 10⁻⁵
mol.m/m2.s.kPa
0.5 at a temperature of 200
oC and ∆P
of 1 bar (101.3 kPa). Augustine et al. (2011) reported activation energy of 16.6kJ/mol for
a Pd-Ag/Inconel membrane of 7 µm thickness at temperature of 300 – 500oC and ∆P of
14 bar (1,418.2kPa). The higher activation energy obtained in the current study can be
attributed to negligible mass transfer resistance across the membrane which results in
higher flux, unlike the lower activation energy reported in literature which indicates that
the bulk diffusion and/or surface process is the rate limiting step (Hwang et al., 2012).

120
Figure 4.24 (a) Membrane Characterization Results in terms of H2 Recovery
0
5
10
15
20
25
30
35
40
45
50 100 150 200 250 300 350
H2 r
eco
very
(m
ol%
)
Pressure (psig)
I. 30%H2/Bal. N2
300C
400C
500C
0
10
20
30
40
50
60
70
50 100 150 200 250 300
H2
reco
very
(m
ol%
)
Pressure (psig)
II. H2 Recovery - 3000C
30%H2
40%H2
50%H2

121
Figure 4.24 (b) Membrane Characterization results showing Sievert’s law
y = 0.0005x
y = 0.0022x
y = 0.0033x
0.00E+00
3.00E-02
6.00E-02
9.00E-02
0 5 10 15 20 25
Flu
x (m
ol/
m2.s
)
∆P^0.5 (kPa^0.5)
I. Hydrogen Flux at 300C
30%H2 mix
40%H2 mix
50%H2 mix
y = 0.0005x
y = 0.0011x y = 0.0017x
0.00E+00
5.00E-03
1.00E-02
1.50E-02
2.00E-02
2.50E-02
0 2 4 6 8 10 12 14 16
Flu
x (m
ol/
m2.s
)
∆P^0.5 (kPa^0.5)
II. Hydrogen Flux for 30%H2 mix at 300 - 500C
300C
400C
500C

122
4.5 WGSR IN MEMBRANE REACTOR
The water gas shift reaction was performed in the membrane reactor varying the
pressure between 150 – 250 psi (10.2 – 17 atm) at 500oC using reformate gas with a flow
rate of 275 sccm and steam/CO ratio of 2.7. It is observed that unlike the case of
operating at atmospheric pressure, operations using the membrane reactor require about
2 hours to stabilize. The results are shown in Figures 4.25 (a) and (b) in terms of CO
conversion, H2 yield, H2 selectivity and H2 recovery. The result indicates an
improvement in CO conversion from 70% to 80% when the pressure is increased from
150psi to 200psi (10.2 – 13.6 atm). Increasing the pressure further to 250psi (17 atm)
yields no significant effect on the CO conversion. When compared to similar conditions
of feed composition and temperature at atmospheric pressure, the use of a membrane
reactor is advantageous due to the continuous removal of H2 through the permeate side,
thus promoting the forward reaction.
At atmospheric pressure, the membrane reactor operates as a conventional
packed bed tubular reactor due to the absence of a pressure differential driving force.
Operating at high pressures in the packed bed tubular reactor as presented in section
4.2.2.6 also yields lower conversions than the case of the membrane reactor; this is
because of the absence of a membrane which allows for withdrawal of one of the
products. On the other hand, the H2 yield is independent of the pressure increase while
H2 selectivity tends to decrease with increasing pressure. This implies that more CO is
converted to CO2 than H2. In all cases, there is negligible conversion of CH4 present in
the reformate gas; appendix A shows the GC chart for the product stream from the
reactor. Although, the composition of CH4 shows 15%, this does not imply formation of

123
CH4 but results from the H2 permeating through the membrane thus increasing the
fraction of the CH4 in the raffinate stream per unit volume. It is also clear from Figure
4.25 (b) that the H2 recovery increases linearly from 6% to 16% with increasing pressure
from 150 psi to 250 psi (10.2 – 17 atm) despite the independence of CO conversion and
H2 yield on pressure above 200 psi (13.6 atm). This is in accordance with the Sievert’s
law such that the increasing partial pressure improves the driving force across the
membrane, hence the continuous increase in H2 recovery. However, it is pertinent to note
that the H2 recovery obtained during the WGSR is lower than that obtained from the
permeation tests were H2/N2 mixtures were used. This is because the rate of H2
permeation is influenced by external gas phase mass transfer limitations such as the
presence of other species, in this case, CO, CO2 and CH4, which tend to compete with
hydrogen molecules for adsorption on the membrane surface, thereby reducing the
amount of hydrogen permeating through the membrane as reported by Abdollahi (2011)
and Liguori et al. (2012). An optimum operating pressure is therefore chosen based on a
balance of CO conversion, H2 yield, selectivity and recovery; in this case, 200 psi (13.6
atm) was selected for subsequent parametric and kinetic studies.

124
Figure (4.25a) WGSR performance in membrane reactor in terms of CO conversion and H2
yield using reformate gas at 275sccm gas with steam/CO ratio of 2.7 and 3Ni5Cu/CeZrCa
catalyst at 5000C in PBTR
0
20
40
60
80
100
0 1 2 3 4 5 6 7
CO
co
nve
rsio
n (
%)
TOS (hr)
CO conversion in MR
150psi
200psi
atm. pressure
250psi
0
10
20
30
40
50
60
70
80
90
0 1 2 3 4 5 6 7
Yie
ld (
mo
l%)
TOS (hr)
Hydrogen Yield
150psi
200psi
250psi

125
Figure (4.25b) WGSR performance in membrane reactor in terms of H2 selectivity and
recovery using reformate gas at 275sccm gas with steam/CO ratio of 2.7 and
3Ni5Cu/CeZrCa catalyst at 5000C in PBTR
0
20
40
60
80
100
0 1 2 3 4 5 6 7
Sele
ctiv
ity
(mo
l%)
TOS (hr)
Hydrogen Selectivity
150psi
200psi
250psi
0
2
4
6
8
10
12
14
16
18
0 1 2 3 4 5 6 7
H2 R
eco
very
(%
)
TOS (hr)
Hydrogen Recovery
150psi
200psi
250psi

126
4.6 PARAMETRIC STUDY IN MEMBRANE REACTOR
In this section, several parameters were varied to determine the effect on the
performance of the WGSR in a membrane reactor. The parameters varied include (i)
catalyst weight, (ii) feed flow rate, and (iii) steam/CO ratio. The results obtained thereof
are presented in Figures 4.26 and 4.27.
4.6.1 Effect of Catalyst Weight and Feed Flowrate in Membrane Reactor
The effect of varying the weight of catalyst was investigated using 0.25 g, 0.5 g
and 1.0 g of 3Ni5Cu/CeZrCa catalyst under similar conditions of 500oC, 200 psi and
steam/CO ratio of 2.7. The flow rate of reformate gas feed was also varied between 161
and 275 sccm keeping the steam/CO ratio constant to evaluate the influence of feed flow
rate on the WGSR. Figure 4.26 (a) and (b) illustrates the results in terms of CO
conversion, H2 yield, selectivity and recovery. It is observed that increasing the weight of
catalyst from 0.25 g to 0.5 g causes an increase in CO conversion from 79% to 90%
when the reformate flow rate is 275 sccm and only a slight increase from 90% to 93%
for reformate flow rate of 161sccm. Increasing the catalyst weight beyond 1.0 g has a
negligible effect on the resulting CO conversion for both flow rates. At both flow rates,
the equilibrium conversion of 90.7% (indicated by the dashed line) under the prevailing
conditions is surpassed with 0.5g – 1g of catalyst, which is one of the advantages of
using a membrane reactor. CO conversion of 84% was obtained at 161 sccm which is
slightly higher than the 81% conversion obtained at 275 sccm using a catalyst weight of
0.25 g. This is as a result of a higher residence time attained at lower flow rate allowing
more CO molecules to be converted to products. A similar trend is also observed for the
H2 yield, selectivity and recovery with a more significant improvement in performance at

127
a lower flow rate. For instance, at 0.25 g, the average H2 yield, selectivity and recovery
obtained at 161 sccm was 71%, 84% and 23%, respectively whereas lower values of
59%, 73% and 12% were obtained at 275 sccm feed flow rate. On the other hand, it is
observed that H2 yield and selectivity reduced slightly when the catalyst weight was
increased from 0.25 g to 0.5 g and no significant change was observed between 0.5 g and
1.0 g while the hydrogen recovery is found to be independent of the catalyst weight
change. This implies that, although increasing the amount of catalyst may be beneficial
for improving the CO conversion, this variation does not necessarily improve the amount
of hydrogen obtained. Using 1.0 g of catalyst, however, tends to quickly stabilise the H2
yield and selectivity for the duration of the run. Again, in this case negligible CH4
conversion was observed.

128
Figure (4.26a) Effect of catalyst weight and flow rate on WGSR performance in membrane
reactor in terms of CO conversion and H2 yield using reformate gas steam/CO ratio of 2.7
and 3Ni5Cu/CeZrCa catalyst at 5000C at 200psi.
0
20
40
60
80
100
0 2 4 6
CO
co
nve
rsio
n (
mo
l%)
TOS (hr)
CO Conversion
T=500C, P=200psi, FA0=275sccm
0.25g 0.50g 1.0g
0
20
40
60
80
100
0 1 2 3 4 5 6 CO
co
nve
rsio
n (
mo
l%)
TOS (hr)
CO Conversion
T=500C, P=200psi, FA0 = 161sccm
0.25g 0.50g
1.0g
0
20
40
60
80
100
0 2 4 6
Hyd
roge
n y
ield
(m
ol%
)
TOS (hr)
Hydrogen Yield 275sccm
0.25g 0.50g 1.0g
0
20
40
60
80
100
0 2 4 6
Hyd
roge
n y
ield
(m
ol%
)
TOS (hr)
Hydrogen Yield 161sccm
0.25g 0.50g 1.0g
---- Xeq

129
Figure (4.26b) Effect of catalyst weight and flow rate on WGSR performance in membrane
reactor in terms of H2 selectivity and H2 recovery using reformate gas steam/CO ratio of
2.7 and 3Ni5Cu/CeZrCa catalyst at 5000C at 200psi
0
20
40
60
80
100
0 2 4 6
Hyd
roge
n s
ele
ctiv
ity
(mo
l%)
TOS (hr)
Hydrogen Selectivity 275sccm
0.25g 0.50g
1.0g
0
20
40
60
80
100
0 2 4 6
Hyd
roge
n s
ele
ctiv
ity
(mo
l%)
TOS (hr)
Hydrogen Selectivity 161sccm
0.25g 0.50g 1.0g
0
20
40
60
0 2 4 6 8
Hyd
roge
n r
eco
very
(m
ol%
)
TOS (hr)
Hydrogen Recovery 275sccm
0.25g
0.5g
1.0g
0
20
40
60
80
100
0 2 4 6 8 Hyd
roge
n r
eco
very
(m
ol%
)
TOS (hr)
Hydrogen Recovery 161sccm
0.25g
0.5g
1.0g

130
4.6.2 Effect of Steam/CO Ratio in Membrane Reactor
The effect of steam/CO ratio in the range of 1.7, 2.7 and 3.7 was studied for the
WGSR in the membrane reactor using reformate gas at a high pressure of 200 psi (13.6
atm) and 500oC and the results are presented in Figure 4.27. The plots reveal a drastic
increase in CO conversion from 34% to 90% and H2 yield from 22% to 52% upon
increasing the steam/CO ratio from 1.7 to 2.7. A further increase in the steam/CO ratio to
3.7 yielded no additional improvement in conversion but a gain in H2 yield from 52% to
100%. This trend is similar to the results obtained from varying the steam/CO ratio in the
PBTR at atmospheric pressure as discussed in section 4.2.2.6. In this case, the gain in
hydrogen yield can be attributed to the steam reforming of methane present in the
reformate feed according to equation 4.2.
CH4 + H2O CO + 3H2............................. (4.2)
This is apparent in the product distribution of the product stream in which the
amount of methane in the product stream is significantly lower than that in the feed
composition. It is evident that a higher amount of steam would be required in the PBTR
to attain a similar performance to that achieved in the membrane reactor.
The overall performance of the membrane reactor with various steam/CO ratios
is therefore better than that of the PBTR using the 3Ni5Cu/CeZrCa catalyst. This
indicates that the efficiency of the WGSR can be improved by the incorporation of a
membrane reactor along with a highly active and stable catalyst, such as the one
developed in this study while utilizing a low steam/CO ratio of 2.7, thereby saving the

131
amount of steam which would otherwise be required in a conventional reactor to attain
the same performance.

132
Figure (4.27) Effect of steam/CO on WGSR performance in membrane reactor using
reformate gas and 3Ni5Cu/CeZrCa catalyst at 5000C at 200psi
0
20
40
60
80
100
0 1 2 3 4 5 6 7
Co
nve
rsio
n(%
)
TOS(hr)
S/CO=1.7
S/CO=2.7
S/CO=3.7
0
20
40
60
80
100
0 1 2 3 4 5 6 7
H2
Yie
ld(%
)
TOS(hr)
S/CO=1.7
S/CO=2.7
S/CO=3.7
0
20
40
60
80
1.5 2 2.5 3 3.5 4
Pro
du
ct d
istr
ibu
tio
n (
mo
l%)
S/CO
Product distribution variation with steam/CO in MR
CO
H2
CO2
CH4

133
4.7 RESULTS OF KINETIC EXPERIMENTS
The reaction kinetics for the WGSR using reformate gas over 3Ni5Cu/CeZrCa
was studied in three different systems; (i) Membrane Reactor at 200 psi (13.6 atm), (ii)
High Pressure Packed Bed Reactor at 200 psi (13.6 atm), and (iii) Packed Bed Reactor at
atmospheric pressure. The catalyst particle size used for all the reactors was .0.8mm..
Two parameters were varied, namely, (i) feed flow rate and (ii) reaction temperature.
This was achieved by changing the flow rate between 161 – 389 sccm using a constant
catalyst weight of 0.5 g and water flow rate between 0.16 – 0.37 ml/min to maintain a
H2O/CO ratio of 2.7 at reaction temperatures of 400, 450 and 500oC (673, 723, 773K).
This resulted in a variation of W/FA0 (catalyst weight time) between 1.1 and 2.67 g-
cat.hr/mol representing the residence time for the reaction. All the operating conditions
used were to ensure that mass transfer and heat transfer limitations that could affect the
kinetic data were eliminated. The following section describes the criteria used to
investigate the absence of heat and mass transfer limitations.
4.7.1 INVESTIGATION OF HEAT AND MASS TRANSFER LIMITATIONS
In the kinetic study of any reaction, data collection can only be considered intrinsic in the
absence of heat and mass transfer resistance. In this section, the interparticle and
intraparticle mass and heat transfer resistances and the effects on the rate of the reaction
will be investigated at 773K; the highest temperature used for the kinetic studies.
4.7.1.1 Heat Transport Effects
According to the Prater analysis, the internal pore heat transfer resistance is given by:
(4.3)

134
Were; ∆Tmax = upper limit to the temperature difference between the pellet centre and
surface (K)
effective diffusivity, m
2/s
DAB = bulk diffusivity of component A (CO) in B (oxygen), m2/s
ε = void fraction, dimensionless
τ = tortuosity factor, dimensionless
CAS = Concentration at pellet surface, mol/dm3
CAC = Concentration at pellet centre, mol/dm3
∆HR = Heat of reaction, KJ/mol
λeff = Effective thermal Conductivity, KJ/m.s.K
The value of DAB was found to be 1.16 x 10⁻⁴
m2/s at a temperature of 773K using the
Brokaw equation. The effective diffusivity Deff obtained was 1.01 x 10⁻⁵
m2/s. The void
fraction, ε estimated as the ratio of volume occupied by voids to the total bed volume
was 0.5 calculated using the equation =0.38+0.073[1+((d/dp −2)2/(d/dp)
2)]
(Geankoplis, 2003) were d and dp are the internal reactor diameter and particle diameter
respectively. The tortuosity factor was taken as 8 (Kumar and Idem, 2007). The effective
thermal conductivity λeff was obtained from /λ=5.5+0.05NRe (Walas, 1990). A value
of 5.47 x 10⁻⁵kW/m/K for λ which is the thermal conductivity was gotten from the
Wassiljewa correlation (Perry and Green 1997). The effective thermal conductivity λeff
calculated was 8.096 x 10⁻⁴
kW/m/K. Substituting these values in equation 4.3 resulted in
a value of 0.1K for ∆Tmax which shows the uniform temperature in a catalyst pellet.

135
To determine the heat transfer limitation across the gas film, the following correlation
adopted from Kumar and Idem (2007) was employed;
……………………….. (4.4)
Where,
is the upper limit of temperature difference between the gas bulk and the
pellet surface,
Lc is the characteristic length,
is the observed rate of reaction,
h is the heat transfer coefficient (estimated from the correlation
, where JH is the heat transfer J factor,
, is the
molecular thermal conductivity, cp is the heat capacity). JD factors is given by the
following correlations:
(Geankoplis, 2003);
. kc is
the mass transfer coefficient obtained to be 0.183m/s. The heat transfer coefficient, h
obtained was 0.106 kJ/m2.s.K and a value of 5.3K resulted for
Furthermore, a more rigorous criterion developed by Mears (1971) for determining heat
transport limitation during reaction was employed to further confirm the negligible
resistance offered by heat transfer on the rate of the reaction.
………………………………. (4.5)

136
Upon substituting the required terms on the left hand side of the equation, a value of 0.8
x 10-4
was obtained which is far less than 0.15. Therefore, based on this result, the
interparticle heat transfer resistance is considered to be absent. A detailed computation is
given in Appendix D.
4.7.1.2 Mass Transport Effects
The Weisz Prater criterion was used to determine the internal pore mass transfer
resistance as follows;
…………………………….. (4.6)
Where, is the Weisz–Prater criterion for internal pore diffusion, the pellet
density, Rc catalyst radius. The value estimated was 0.982 which is slightly less
than 1 indicating the potential for mass transfer limitation within the catalyst pores.
However to further prove that the mass transfer limitation has no significant effect on the
rate of reaction, the following ratio was employed:
…………………. (4.7)
This ratio obtained was 4.7 x 10⁻²
indicating that the observed rate is far less than the rate
if external resistance was controlling. Thus the resistance to external mass transfer does
not affect the reaction rate. A more rigorous criterion developed by Mears was also
applied to determine the onset of film mass transfer limitation.
;……………………………………….. (4.8)

137
The value obtained from the LHS was 0.08 which is far less than 0.15 implying that
there was no mass limitation in the film.
4.7.2 KINETIC RATE MODEL
4.7.2.1 Power Law Model
The power law model is a simple empirical rate expression that does not consider
any particular reaction mechanism and has been widely applied in kinetic studies. The
overall reaction used for the development of the kinetic model for water gas shift
reaction is given as;
CO + H2O CO2 + H2; ----------------------------------------- (1.6)
;
An empirical, reversible power law rate model can be written as:
(1-) -------------------------------------------------------- (4.9)
------------------------------------------------------------------------- (4.10)
------------------------------------------------------------------- (4.11)
Here, A = CO; B = H2O; C = H2; D = CO2;
rA’ = rate of reaction with respect to CO, mol/g-cat.hr
A = pre exponential factor

138
E = activation energy, kJ/mol
T = reaction temperature, K
R = molar gas constant, 8.314 J/mol/K
Ni = molar flow rate of A, B, C, D, mol/hr
m = order of reaction with respect to A
n = order of reaction with respect to B
o = order of reaction with respect to C
p = order of reaction with respect to D
= degree of reversibility of reaction
Keq = reaction equilibrium constant
However in this study, the ratio of H2 to CO2 was not varied and the ratio of H2O/CO
was constant at 2.7. Consequently, it was necessary to drop the ‘b, c, d’ terms because
the species for which they are exponents are not linearly independent thereby leaving the
power law expression as follows:
---------------------------------------------------------------- (4.12)
Were k=
is the reaction rate constant.
4.7.2.2 Experimental Rates of Reaction
The results of each set of operating conditions are presented in Figure 4.28. From
the results, it can be seen that in all three systems, increasing the W/FA0 generally results
in an increase of CO conversion. However, the increase in conversion tends to slow

139
down beyond 1.6 g-cat.hr/mol, because of thermodynamic limits imposed on the reaction
under the prevailing conditions.
It is also evident that increasing the temperature at a particular W/FA0 results in an
increase in CO conversion; however, the degree of increase in CO conversion between
450 – 500oC is higher than that between 400-450
oC. At 450
oC, the increase in conversion
with respect to catalyst weight time is slower than at other temperatures. This
observation is further revealed in the reaction rates represented in Table 4.4. More
importantly, the results in Figure 4.28 show that the CO conversions obtained from the
membrane reactor are higher than those of the packed bed reactor operating at high
pressure and atmospheric pressure.

140
Figure 4.28 Conversion versus W/FA0 for all three systems using reformate gas and 0.5g of
3Ni5Cu/CeZrCa catalyst
0
20
40
60
80
100
0 0.5 1 1.5 2 2.5 3
Co
nve
rsio
n (
%)
W/Fa0 (g cat.hr/mol)
Conversion vs W/Fa0 for MR
400C
450C
500C
0
10
20
30
40
50
0 0.5 1 1.5 2 2.5 3
Co
nve
rsio
n (
%)
W/Fa0 (g cat.hr/mol)
High Pressure PBTR (200psi)
400C
450C
500C
0
10
20
30
40
50
60
0 0.5 1 1.5 2 2.5 3
Co
nve
rsio
n (
%)
W/Fa0 (g cat.hr/mol)
Atmospheric Pressure in PBTR
400C
450C
500C

141
To find out the rate of the water gas shift reaction experimentally by integral
(plug flow) reactor, the differential method of analysis was used. Details of this method
of analysis can be found in Levenspiel (1999), in chapters 3 and 18. For integral (plug
flow) reactor, differential analysis gave us the following equation:
; --------------------------------------------------------------- (4.13)
From equation 4.13, we can see that the slope of XCO vs. W/FA,0 will give us the
experimental reaction rate (mol/gcat-hr) at a W/FA,0. The XCO vs. W/FA,0 graphs were
drawn for all the temperatures and reactor systems resulting in Figure 4.28. Now, the
experimental rates of the reaction were obtained from Figure 4.20 as the derivatives of
the CO conversion vs. W/FA,0 curves after fitting with MATLAB. Here, NA, NB, NC, and
ND were calculated using the following equations:
; ------------------------------------------------------------------------ (4.14)
; ---------------------------------------------------------------------- (4.15)
; --------------------------------------------------------------------- (4.16)
; --------------------------------------------------------------------- (4.17)
Were, NA,0 = initial molar flow rate of CO (A), mol/ hr; NB,0 = initial molar flow rate of
H2O(B), kmol/s; XA = CO conversion, from experimental data. The partial pressures PA
in Table 4.4 were calculated using the mole fractions of each component and the total
pressure as follows;
---------------------------------------------------------------------------------- (4.18)

142
Where yi = mole fraction of component i and PT is the total pressure.
The partial pressure of CO was computed in order to evaluate the relationship between
reaction rate and partial pressure at atmospheric pressure and high operating pressure of
200psi (13.6atm). The results of this correlation are given in Figure 4.29.

143
Table 4.4: Experimental kinetic data
Run T rA TOF NA
(x10-5
) PA
NB
(x10-4
)
NC
(x10-5
)
ND
(x10-5
)
Keq 1-
K mol/
(gcat*hr)
(1/s) mol/s kPa mol/s mol/s mol/s
Packed Bed Tubular Reactor – Atmospheric Pressure
1 673 0.619 0.001145 5.6 19.9 1.6 1.1 5.3 11.85 0.994
2 673 0.618 0.001144 6.9 20.0 1.9 1.4 6.4 11.85 0.994
3 673 0.618 0.001144 8.6 20.0 2.3 1.7 7.8 11.85 0.994
4 673 0.619 0.001145 12 20.1 3.2 2.2 11 11.85 0.995
5 673 0.619 0.001145 23 20.2 6.2 4.4 20 11.85 0.995
6 723 0.717 0.001327 5.0 17.2 1.5 1.9 6.1 7.40 0.979
7 723 1.52 0.002813 5.8 17.3 1.8 2.2 7.2 7.40 0.979
8 723 4.7 0.008697 7.2 17.4 2.2 2.8 8.9 7.40 0.980
9 723 14.8 0.027385 8.6 17.8 2.5 3.1 9.7 7.40 0.982
10 723 20.7 0.038302 12 19.1 3.3 3.1 12 7.40 0.988
11 773 6.28 0.01162 2.8 10.6 1.1 3.3 6.9 4.91 0.844
12 773 12.1 0.022389 3.6 11.5 1.5 3.9 8.6 4.91 0.873
13 773 24 0.044408 5.6 13.2 2.0 4.4 11 4.91 0.915
14 773 42.8 0.079194 7.8 15.3 2.6 4.4 12 4.91 0.947
15 773 51 0.094367 11 17.6 3.2 3.9 13 4.91 0.972
Packed Bed Tubular Reactor – High Pressure
16 673 4.81 0.0089 4.7 255.3 1.4 0.56 5.0 11.85 0.991
17 673 4.8 0.008882 5.6 260.4 1.6 0.56 5.6 11.85 0.992
18 673 4.8 0.008882 6.9 265.2 1.9 0.28 6.7 11.85 0.993
19 673 4.81 0.0089 8.3 269.6 2.3 0.28 7.8 11.85 0.994
20 673 4.81 0.0089 12 276.1 3.3 0.28 11 11.85 0.995
21 723 0.916 0.001695 4.2 226.9 1.3 1.1 5.6 7.40 0.975
22 723 0.927 0.001715 4.7 227.8 1.5 1.1 6.1 7.40 0.975
23 723 0.913 0.001689 5.8 228.9 1.8 1.4 7.5 7.40 0.976

144
24 723 0.906 0.001676 7.2 229.7 2.2 1.7 8.9 7.40 0.976
25 723 0.92 0.001702 10 230.9 3.2 2.2 13 7.40 0.977
26 773 1.85 0.003423 3.3 156.4 1.4 2.8 8.1 4.91 0.872
27 773 3.42 0.006328 4.4 159.5 1.7 3.3 9.7 4.91 0.878
28 773 14.7 0.0272 5.0 162.6 2.0 3.6 11 4.91 0.884
29 773 39 0.072163 6.4 178.3 2.4 3.6 12 4.91 0.911
30 773 49.3 0.091221 9.7 218.2 3.1 2.8 14 4.91 0.956
Membrane Reactor
31 673 1.61 0.002979 3.6 194.2 1.3 2.5 6.1 11.85 0.971
32 673 3.18 0.005884 4.4 192.0 1.6 3.1 7.8 11.85 0.972
33 673 9.45 0.017486 6.1 201.1 2.1 3.9 10 11.85 0.975
34 673 20.4 0.037747 8.3 215.4 2.6 4.2 12 11.85 0.981
35 673 25 0.046258 10 229.7 3.2 4.4 13 11.85 0.985
36 723 5.09 0.009418 3.1 160.9 1.2 3.1 6.7 7.40 0.921
37 723 5.08 0.0094 3.6 166.0 1.4 3.6 7.8 7.40 0.927
38 723 5.09 0.009418 4.4 171.0 1.7 3.9 8.9 7.40 0.933
39 723 5.1 0.009437 5.6 175.8 2.0 4.7 11 7.40 0.938
40 723 5.09 0.009418 8.3 183.1 3.0 6.7 15 7.40 0.946
41 773 34.1 0.063096 6.4 123.9 3.1 10 20 4.91 0.779
42 773 41.7 0.077159 8.3 142.4 3.6 11 22 4.91 0.838
43 773 48.3 0.089371 13 169.6 4.9 12 26 4.91 0.897
44 773 52.6 0.097328 23 198.6 7.8 15 37 4.91 0.937
45 773 54.7 0.101213 53 222.4 16 25 70 4.91 0.959

145
4.7.2.3 Effect of Pressure on Reaction Rate
The kinetic studies were carried out at different total pressures; atmospheric
pressure and high pressure of 200 psi (1379kPa) in a packed bed tubular reactor and a
membrane reactor. The rates determined from the conversion versus W/FA0 graphs are
represented as a function of CO partial pressures at a constant temperature of 500oC and
are given in Figure 4.29.
It is clear that the increasing partial pressure of CO in any particular reaction
system causes a corresponding increase in the reaction rate, although at high total
pressure as in the membrane reactor and PBTR-HP, the increase in rate slows down
between 170 – 180 kPa (1.7 – 1.8atm), whereas at low atmospheric pressure, the rate of
reaction continues to increase linearly with partial pressure. This observation
corresponds to studies by Atwood et al. (1950) and Chinchen et al. (1984).

146
Figure 4.29 Rate-Pressure relationships of all three systems
0
10
20
30
40
50
60
10.0 15.0 20.0
Rat
e (
mo
l/g-
cat.
hr)
PA (kPa)
PBTR - 1 atm
0
10
20
30
40
50
60
150.0 170.0 190.0 210.0
Rat
e (
mo
l/g-
cat.
hr)
PA (kPa)
PBTR - HP
0
10
20
30
40
50
60
120.0 140.0 160.0 180.0 200.0 220.0
Rat
e (
mo
l/g-
cat.
hr)
PA (kPa)
Membrane Reactor

147
4.7.2.4 Estimation of Parameters of Rate Model
The power law model parameters were estimated using a multi-nonlinear
regression software (NLREG), which is based on the minimization of the sum of residual
squares of the reaction rates according to Gauss-Newton and Levenberg-Marquardt
algorithm. The values obtained for the parameters are presented in Table 4.5. To validate
the models, the percentage average absolute deviation (AAD%) between the predicted
rate from the power law model and experimentally obtained rate was determined.
The AAD is calculated as follows:
;----------------------------- (4.19)
A parity plot as shown in Figure 4.30 is also used to depict how well the power law
model fits the data.
From the parity plot, the rates determined using the power law model matches the
experimentally determined rate. Thus, the final power law rate expressions for the three
systems are given as follows:
For the membrane reactor;
For the high pressure packed bed tubular reactor;

148
Table 4.5: Estimation of the values of the parameters of the models
Parameter MR PBTR-HP PBTR-atm
A (s-1
)
3.66 x 10⁶
1.17 x 10¹⁹
1.79 x 10¹³
E (kJ/mol) 99.95 190.3 136.9
m 0.23 1.78 1.27
AAD (%) 7.39 6.97 5.33
Figure 4.30 Parity plot for the reaction rates of all three systems
0
0.05
0.1
0.15
0.2
0 0.05 0.1 0.15 0.2
Pre
dic
ted
TO
F (s
^-1
)
Experimental TOF (s^-1)
Parity Plot
atm
HP
MR

149
For the atmospheric pressure packed bed tubular reactor;
The results show an increase with activation energy from 137.2kJ/mol to
190.3kJ/mol when the operating pressure is increased from atmospheric to high pressure
of 200 psi (13.6 atm) and a corresponding increase in the pre-exponential factor. This is
probably because with higher partial pressures of CO in the feed mixture, more energy is
required to initiate the WGSR. Moreover, at similar high pressure of 200 psi (13.6 atm),
the activation energy required for the membrane reactor is 99.95kJ/mol which is lower
than the packed bed reactor; this re-emphasizes the benefits of using a membrane reactor.
The rate constants based on the evaluated parameters are also given in Table 4.5 and in a
similar fashion; the rate constant increases with pressure but is lowest in the membrane
reactor. This shows the resistance posed by the system and reveals that such resistance is
lowest in the membrane reactor. The order of the reaction with respect to CO varies
amongst the different systems with the membrane system giving the lowest order of 0.23
and the high pressure PBTR system having the highest order of 1.78 showing a stronger
dependence of the reaction rate on the concentration of CO. The reaction order for the
atmospheric PBTR is 1.27 which is similar to other studies in literature which show a
first order dependence of WGSR reaction rate on CO. The activation energies obtained is
observed to be in agreement with some studies in literature. Mars (1961) reported
activation energy of 134kJ/mol operating at atmospheric pressure, Chinchen et al. (1984)
reported 129.4kJ/mol, Bustamante et al. (2005) obtained 288.3kJ/mol and Hla et al.
(2009) reported 111kJ/mol.

150
Other studies have reported lower activation energies; for instance, Lei et al.
(2005) reported 60kJ/mol and Koryabkina et al. (2003) obtained 79 kJ/mol. The low
activation energies obtained from such studies could either be as a result of the low
concentrations or pure CO employed as the reactant without considering the presence of
other components in the feed material such as CH4, CO2 and H2 which give a typical
composition of a real reformate gas. According to Chinchen et al. (1984), another reason
for the low activation energies reported in the literature for the WGSR is due to the
inadequacy of pore diffusion. Few studies, however, have considered the effect of these
components, particularly for reformate from coal gasification (Abdollahi et al., 2011; Hla
et al., 2011). To the best of our knowledge, detailed kinetic studies on WGSR have not
been performed on reformate gas from biogas dry reforming in different systems
including a membrane reactor and on the 3Ni5Cu/CeZrCa catalyst, thus making this
work the first of its kind.

151
CHAPTER 5
CONCLUSIONS AND RECOMMENDATIONS
5.1 CONCLUSIONS
A group of ceria based ternary oxide catalysts having a formulation of 3Ni-
5Cu/CeZrM (M=La,Y, Gd, Ca, Mg) were developed and screened for the high
temperature water gas shift reaction using H2O/CO ratio of 2.7 at 500oC. Amongst the
tested catalysts, 3Ni5Cu/CeZrCa showed the best performance giving a CO conversion
of 58% and H2 yield and selectivity of 60% and 90% respectively; thus was selected for
further parametric studies. Amongst the parameters studied were: impregnation method
(vacuum and atmospheric), calcination temperature (425 – 6500C) and surfactant/metal
ratio (0 – 1.25) to optimise the catalyst preparation method; also, reaction temperature
(450 – 5500C), steam/CO ratio (1.7 – 3.7), feed composition (pure CO/N2 and reformate)
and pressure (atmospheric – 250psi) were varied to evaluate optimum operating
conditions.
The catalysts impregnated under vacuum conditions yielded better results than
those impregnated under normal atmospheric condition. In addition, catalysts calcined at
500oC showed better performance than catalysts calcined at other temperatures. An
optimum surfactant/metal ratio of 0.5 was determined which gave similar performance to
catalysts prepared with a ratio of 1.25, thus minimizing the quantity and cost of
surfactant used in catalyst preparation. An optimum reaction temperature of 500oC was
obtained revealing the kinetic and thermodynamic limitations of operating at a lower
temperature of 450oC and a higher range of 550
oC. Increasing the steam/CO ratio from

152
1.7 to 2.7 resulted in a drastic increase in CO conversion from 33% to 48% but further
increase of the steam/CO ratio had negligible change in the CO conversion. For
reformate gas having a composition of 46.2%CO, 8.5% CH4, 7.2% CO2 and 38.1 % H2
which is typical for reformate from biogas dry reforming the results showed the superior
performance of the ternary oxide catalyst over its binary oxide counterpart, as no
deactivation was observed in the ternary catalyst. For comparative studies to the
membrane reactor, the total pressure in a packed bed tubular reactor was varied, it was
found that increasing the reaction pressure resulted in a fourfold increase in the CO
conversion from 7% to 28% up to a pressure of 200 psi (13.6 atm); beyond which
additional pressure increase yielded no substantial change in conversion. Extended TOS
stability test carried out on the 3Ni5Cu/CeZrCa catalyst for duration of 12 hours revealed
a highly stable catalyst with no evidence of deactivation. Analysis of Variance
(ANOVA) and two level factorial design of experiment (DOE) analysis of the parametric
study revealed that the reaction temperature, gas composition and steam ratio were the
major operating conditions affecting the CO conversion.
In order to evaluate the performance of the catalysts based on their
physicochemical structure, several characterization techniques were employed ranging
from X-Ray Diffraction (XRD), N2 Physisorption, H2 Chemisorption, Temperature
Programmed Reduction (TPR) and Oxidation (TPO), ICP-MS. The results of these
characterizations were then related to the activity observed in the catalysts through
Structure Activity Relationships (SAR). The results revealed that a homogeneously
dispersed catalyst having high pore volume/surface area, metal dispersion, reducibility
and basicity in addition to low carbon propensity factor gives high performance as in the

153
case of the Ca catalyst. From the statistical analysis performed, the pareto chart resulting
from the two level factorial design of experiment analysis reveals that the reducibility,
basicity and dispersion are the major contributing factors in the catalyst activity.
In order to evaluate the potential to minimize the number of process units utilized
in an industrial hydrogen production process, a membrane reactor was incorporated into
the current study. Membrane characterization was performed to evaluate the selectivity
of the membrane to H2 and then derive a correlation between the amount of H2
permeated and temperature as well as partial pressure. The results showed an increase in
H2 recovery and flux with increasing partial pressure from 100psi to 300 psi (6.8 – 20.4
atm) and temperature ranging from 300oC to 500
oC. The studies also resulted in H2
permeation activation energy of 4.4kJ/mol. Furthermore, the membrane reactor was then
applied to the water gas shift reaction using the 3Ni5Cu/CeZrCa catalyst on reformate
gas at 500oC varying the pressure between 150 – 250 psi (10.2 – 17 atm). An increase in
CO conversion was observed with increasing pressure from 150 psi (10.2 atm) to 200 psi
(13.6 atm), however upon increasing the pressure beyond 200 psi (13.6 atm), there was
no significant increase in performance. An optimum pressure of 200 psi (13.6 atm) was
therefore selected for use in parametric and kinetic studies. Meanwhile, upon comparing
the performance of the membrane reactor to the packed bed tubular reactor operating at
high pressure and atmospheric conditions, a superior performance was revealed in the
membrane reactor.
Parametric studies were also performed on the membrane reactor varying the
catalyst weight between 0.25 – 1.0 g, flow rate between 161 – 275 sccm and steam/CO
ratio of 1.7 – 3.7. It was observed that increasing the catalyst weight resulted in an

154
increase in CO conversion up to 0.5 g, beyond which no significant change was
observed, while reducing the flow rate resulted in an increase in the amount of hydrogen
recovered while slightly improving the CO conversion. Varying the steam/CO ratio gave
similar results to the packed bed tubular reactor.
Finally, the kinetics of the water gas shift reaction using reformate gas was
studied in a packed bed reactor at atmospheric and high pressure as well as in a
membrane reactor. Activation energies of 137.2kJ/mol, 190.3kJ/mol and 99.8kJ/mol
were obtained from the power law model with acceptable AAD% and parity plot. To the
best of our knowledge, the current study is the first of its kind on water gas shift reaction
for reformate gas from biogas dry reforming on 3Ni5Cu/CeZrCa catalyst.
5.2 RECOMMENDATIONS
The following recommendations for future research can be made based on the scope of
the current work;
The reaction mechanism should be determined using a mechanistic approach
either based on Langmuir Hinshelwood-Hougen Watson or Eley-Rideal
formulations.
The ratio of H2/CO2 and H2O/CO should be varied in the kinetic experiments to
determine the rate dependence on concentration of CO2, H2 and H2O.
Reactor modelling and simulation studies using software like COMSOL, should
be performed for suitable reactor design.

155
The catalyst developed in this work should be tested in the feed flexible hydrogen
production pilot plant for further demonstration of its performance.
The pure hydrogen produced from the membrane reactor should be tested on a
fuel cell to determine the energy efficiency of the process.

156
REFERENCES
1. Abdollahi, M. (2011). An Integrated ‘One Box’ Process for Hydrogen
Production (Doctoral Dissertation). Retrieved from Proquest Dissertations and
Theses database.
2. Abdollahi, M., Jiang Yu, Paul K.T. Liu, Richard Ciora, Muhammad Sahimi,
Theodore T. Tsotsis. (2010) Hydrogen Production From Coal-Derived Syngas
Using A Catalytic Membrane Reactor Based Process. J. Mem. Sci. (363) 160–
169.
3. Amphlett, J.C, Mann, R.F., Peppley, B.A. and D.M. Stokes. (1991). Some
design considerations for a catalytic methanol steam reformer for a PEM fuel
cell power generating system. Proceedings of the 26th
(3) Intersoc. Energy
Convers. Eng. Conf. 642 – 649.
4. Andreeva, A., Margarita, K., Ivan, I., Lyuba, I., Janusz, W.S., Wojciech, L.
(2010) Gold Supported On Ceria Doped By Me3+ (Me =Al And Sm) for Water
Gas Shift Reaction: Influence of Dopant and Preparation Method. Catal. Today
(158) 69–77
5. Arstad, B., H. Venvik, H. Klette, J.C. Walmsley, W.M. Tucho, R. Holmestad, A.
Holmen, R. Bredesen. (2006) Studies Of Self-Supported 1.6 Mm Pd/23 Wt.%
Ag Membranes During and after Hydrogen Production in a Catalytic Membrane
Reactor. Catal. Today (118) 63–72.
6. Atwood, K., Arnold, M.R., Appel, E.G. (1950). Water Gas Shift Reaction: Effect
of Pressure on rate over an iron-oxide chromium oxide catalyst. Ind. Eng. Chem.
(42) 8, 1600 – 1602.
7. Augustine, A.S., Ma, Y.H., Kazantzis, N.K. (2011). High pressure palladium
membrane reactor for the high temperature water-gas shift reaction. Int. J.
Hydrogen Energy (36) 5350 – 5360.
8. Azzam, K.G., Babich, I.V., Seshan, K., Lefferts, L. (2007) A Bifunctional
Catalyst for the Single-Stage Water–Gas Shift Reaction in Fuel Cell
Applications. Part 2. Roles of the Support and Promoter on Catalyst Activity and
Stability. J. Catal. (251) 163–171

157
9. Barbieri, G., Brunetti, A., G. Tricoli, E. Drioli. (2008). An Innovative
Configuration of a Pd-Based Membrane Reactor for the Production of Pure
Hydrogen: Experimental Analysis of Water Gas Shift. J. Power Sources, 182 (1)
160-7
10. Basile, A., Giampiero, C., Silvano, T., Vittorio, V. (2001) Experimental and
Simulation of both Pd and Pd/Ag for A Water Gas Shift Membrane Reactor.
Sep. Purif. Technol. 25 (1 - 3) 549 – 71
11. Basile, A., Drioli, A.E., Santella, F., Violante, V., Capannelli, G. and Vitulli,
G.( 1996) a Study on Catalytic Membrane Reactors for Water Gas Shift
Reaction. Gas. Sep. Purif: (10) 1, 53-61.
12. Basinska, A., Florian, D. (1999). The Effect of Lanthanides on the Ru/Fe2O3
Catalysts For Water-Gas Shift Reaction. Appl. Catal. A: Gen. (179) 241 – 246
13. Bharadwaj, S.S., Schmidt, L.D. (1995). Catalytic Partial Oxidation of Natural
gas to syngas. Fuel Process. Technol. (42), 2-3, 109 – 127.
14. Bi, Y., Hengyong, X., Wenzhao, L., Andreas G. (2009) Water–Gas Shift
Reaction in a Pd Membrane Reactor over Pt/Ce0.6Zr0.4O2 Catalyst. Int. J.
Hydrogen Energy. (34) 2965 – 2971.
15. Bohlbro, H. (1962). Acta Chem. Scand. 16, 431.
16. Bolt, P.H, Habraken, F.H.P.M., Geus, J.W. (1995). On the Role of a NiAl2O4
Intermediate Layer in the Sintering Behaviour of Ni/Α-Al2O3. J. Catal. (151), 2,
Pages 300-306.
17. Bracht, M., Bos, A., Pex, P.P.A.C., Van Veen, H.M. and Alderleisten, P.T.
(1996) Proceedings of Third Workshop on Catalytic Membranes, Italy.
18. Brunetti A., G. Barbieri, E. Drioli, K.-H. Lee, B. Sea, D.-W. Lee. (2007). WGS
Reaction in a Membrane Reactor Using a Porous Stainless Steel Supported
Silica Membrane. Chem. Eng. Proc: Proc. Intens. (46) 119–126.
19. Bunluesin T, Gorte RJ, Graham GW. (1998) Studies of Water-Gas Shift
Reaction on Ceria-Supported Pt, Pd, and Rh: Implications for Oxygen-Storage
Properties. App.Catal. B: Env.(15) 107–14
20. Bustamante, F., Enick, R.M., Killmeyer, R.P., Howard, Rothenberger K.S.,
Cugini, A.V., Morreale B.D., Ciocco, M.V. (2005). Uncatalyzed and Wall-

158
catalyzed forward water gas shift reaction kinetics. AIChE J., 51: 1440 – 1454,
doi: 10.1002/aic.10396.
21. Campbell, J.M. Nakamura, J., Campbell, C.T. (1992). Model studies of cesium
promoters in water gas shift catalysts: Cs/Cu. J. Catal. (136), 24 – 42.
22. Cheekatamarla, P.K., Finnerty, C.M. (2008). Synthesis gas production via
catalytic partial oxidation reforming of liquid fuels. Int. J. Hydrogen Energy (33)
19, 5012 – 5019.
23. Chinchen, G.C., Logan, R.H., and Spencer, M.S. (1984). Water gas shift reaction
over an iron oxide/chromium oxide catalyst. III. Kinetics of reaction. Appl.
Catal. (12), 97 – 103.
24. Choudhary, T.; Banerjee, S.; Choudhary, V. (2002). Catalyst for Combustion of
Methane and Lower Alkanes. Appl. Catal. A: Gen. 234, 1– 23.
25. Ciocco, M.V., Morreale, B.D., K.S. Rothenberger, B.H. Howard, R.P.
Killmeyer, R.M. Enick, and Bustamante, F. (2003). WGS Membrane Reactor
Studies. United States Department National Energy Technology Cochrans Mill
Proceedings. Www.Netl.Doe.Gov
26. Cornaglia A.C., John F. Munera, and Eduardo A. Lombardo (2011). Kinetic
Study of A Novel Active and Stable Catalyst for the Water Gas Shift Reaction.
Ind. Eng. Chem. Res. 50, 4381–4389
27. Cornaglia, A.C., Adrover, E.M. Munera, J.F., Pedernena, M.N., Borio, D.O.,
Lombardo, E.A. (2013). Production of ultrapure hydrogen in a Pd-Ag membrane
reactor using noble metals supported on La-Si oxides. Heterogeneous modelling
for the water gas shift reaction. Int. J. Hydrogen Energy (38), 10485 – 10493.
28. Criscuoli, A., A. Basile, B, Drioli, E. (2000). An Analysis of the Performance of
Membrane Reactors for the Water–Gas Shift Reaction Using Gas Feed Mixtures.
Catal. Today (56) 53–64.
29. Elghawi, U., Theinnoi, K., Sitshebo, S., Tsolakis, A., Wyszynski, M.L., Xu,
H.M., Cracknell, R.F., Clark, R.H., Mayouf, A. (2008). GC-MS Determination
of Low Hydrocarbon Species (C1–C6) from a Diesel Partial Oxidation
Reformer. Int. J. Hydrogen Energy 33, 7074 – 7083.

159
30. Enick, R. Morreale, B., Hill, J., Rothenberger, K., Cugini, A., Siriwardane, R.,
Poston, J., Balachandran, U., Lee, T., Dorris, S., Graham, W., Howard, B.,
(2002) Evaluation And Modeling of a High Temperature, High Pressure,
Hydrogen Separation Membrane for Enhanced Hydrogen Production from the
Water-Gas Shift Reaction. Adv. Hydrogen Energy (10), 93 - 110.
31. Enrico, D., Giuseppe, B. (2011) Membrane Engineering For The Treatment Of
Gases: Volume 2: Gas-Separation Problems Combined With Membrane
Reactors. RSC Publishing.
32. Erdohelyi, A., Fodor, K., Suru, G. (1996) Reaction Of Carbon Monoxide With
Water On Supported Iridium Catalysts. App. Cat. A: Gen. (139) 131 - 147.
33. Flytzani-Stephanopoulos, M, Qi, X, Kronewitter, S. (2004) Water–Gas Shift
With Integrated Hydrogen Separation Process. Final Report to DOE, Grant #
DEFG2600-NT40819, 1–38.
34. Fott, P., Vosolsobe, J., Glasser, V. (1979). Coll. Czech. Chem. Commun. 44,
652.
35. Froment, G.F., Bischoff, K.B., (1990). Chemical Reactor Analysis and Design.
2nd
ed. Wiley, New York.
36. Galletti, C., P. Djinovi´Ca, S. Specchia, J. Batista, J. Levec, A. Pintar, V.
Specchia (2011). Influence of the Preparation Method on the Performance of Rh
Catalysts on CeO2 For WGS Reaction. Catal. Today (176) 336– 339.
37. Galvita, V., Kai, S. (2007) Cyclic Water Gas Shift Reactor (CWGS) For Carbon
Monoxide Removal from Hydrogen Feed Gas For PEM Fuel Cells. Chem. Eng.
J. (134) 168–174.
38. García-García, F.R., Rahman, M.A., Kingsbury, B.F.K., K. Li. (2010) A Novel
Catalytic Membrane Microreactor for Cox Free H2 Production. Catal. comm.
(12) 161–164.
39. Gawade, P., Burcu, M., Bing, Tan, Umit, S.O. (2010) Cr-Free Fe-Based Water-
Gas Shift Catalysts Prepared Through Propylene Oxide-Assisted Sol–Gel
Technique. J. Mol. Catal. A: Chem. 321 61–70.
40. Geankoplis, C.H., (2003). Transport Processes and Separation Process
Principles. fourth ed. Wiley, New York.

160
41. Gokaliler, F., Ilsen, O.Z, Aksoylu, A.E. (2013). Power law type rate expression
for WGS reaction over Au-Re/CeO2 catalyst under realistic fuel processor
conditions. Catal. comm. (39) 70 – 73.
42. Gorte, R.J., S. Zhao. (2005) Studies of the Water-Gas-Shift Reaction with
Ceria-Supported Precious Metals. Catal. Today (104) 18–24
43. Gosiewski, K., Krzysztof, W., Marek, T. (2010) Mathematical Simulation of
WGS Membrane Reactor for Gas from Coal Gasification. Catal. Today (156)
229–236.
44. Gottschalk, F.M., R.G. Copperthwaite, M. Van Der Riet and G.J. Hutchings.
Cobalt/Manganese Oxide Water Gas Shift Catalysts I. Competition between
Carbon Monoxide Hydrogenation and Water Gas Shift Activity. App. Catal., 38
(1988) 103-108.
45. Grenoble, D.C., and Estadt, M.M., (1981). The chemistry and catalysis of the
water gas shift reaction 1. The kinetics over supported metal catalysts. J. Catal.
67, 90 -102.
46. Haryanto, A., Sandun, D.F., Filip S. D., Steele, P.H., Lester, P., and Sushil, A.
(2009). Hydrogen Production through the Water-Gas Shift Reaction:
Thermodynamic Equilibrium versus Experimental Results over Supported Ni
Catalysts. Energy Fuel, 23, 3097–3102
47. Hilaire, S., X. Wanga, T. Luo, R.J. Gorte , J. Wagner. (2004) A Comparative
Study Of Water-Gas-Shift Reaction Over Ceria Supported Metallic Catalysts.
Appl. Catal. A: Gen (258), 2, 271–276.
48. Hla, S.S., G.J. Duffy, L.D. Morpeth, A. Cousins, D.G. Roberts, J.H. Edwards
(2011). Investigation Into The Performance Of A Co-Mo Based Sour Shift
Catalyst Using Simulated Coal-Derived Syngases. Int. J. Hydrogen Energy(36)
6638-6645
49. Hla, S.S., Duffy, G.J., Morpeth, L.D., Cousins, A., Roberts, D.G., Edwards, J.H.
(2009). Investigation of the effect of total pressure on performance of the
catalytic water gas shift reaction using simulated coal derived syngases. Catal.
comm. (11), 272 – 275.

161
50. Hua, N., Haitao, W., Yukou, D., Ming, S., Ping, Y. (2005) Ultrafine Ru and C-
Fe2O3 Particles Supported on MgAl2O4 spinel For Water-Gas Shift Reaction.
Catal. comm. (6) 491–496.
51. Huang, T., Tien-Chun, Y., and Shih-Yao, J. (2006) Weighting Variation Of
Water-Gas Shift In Steam Reforming Of Methane Over Supported Ni And Ni-
Cu Catalysts. Ind. Eng. Chem. Res., 45, 150-156.
52. Hwang, K., Chun-Boo, L., Jong-Soo, Pa. (2011) Advanced Nickel Metal
Catalyst for Water–Gas Shift Reaction. J. Power Sources (196) 1349–1352
53. Hwang, K., Jong-Soo, P., Son-Ki, I. (2011) Si-Modified Pt/CeO2 Catalyst for a
Single-Stage Water-Gas Shift Reaction. Int. J. Hydrogen Energy(36) 9685-9693
54. Idem, R. O., Kumar, P., Sun, Y. (2010) Catalysts for Hydrogen Production, U.S.
Patent US7824656 B2.
55. Idem, R., Khan, A.M., Saha, B. (2012) Sulphur Tolerant Catalysts for Hydrogen
Production by carbon dioxide reforming of methane rich gas, WIPO
2012/167351 A1.
56. Itoh, N., Xu, W., Haraya, K. (1992) Basic experimental study on palladium
membrane reactors. J. Mem. Sci. (66), 149 – 155.
57. IUPAC Recommendations, (1994). Pure Appl. Chem. 66, 1739.
58. Iwamoto, M., Takaki, H., Hiroshi, F., Shuichi, K. (1983). Water Gas Shift
Reaction Catalyzed By Metal Ion-Exchanged Zeolites. J. Catal. (79), 291-297.
59. Iyoha, O.U. (2007). H2
Production in Palladium & Palladium–Copper
Membrane Reactors At 1173K In The Presence Of H2S (Phd. Thesis). Retrieved
from Proquest Database.
60. Karpenko, A., R. Leppelt, V. Plzak, R.J. Behm. (2007). the Role of Cationic
Au3+
and Nonionic Au0 Species In The Low-Temperature Water–Gas Shift
Reaction On Au/CeO2 Catalysts. J. Catal. (252) 231–242.
61. Khan A., Sukonket T., Saha B., and Idem R. (2012). Catalytic Activity of
Various 5wt% Ni/Ce0.5Zr0.33M0.17O2-δ Catalysts for the CO2 Reforming of CH4
in the Presence and Absence of Steam. Energy Fuels, 26, 365–379.

162
62. Khan, A., Panagiotis G. Smirniotis. (2008) Relationship between Temperature-
Programmed Reduction Profile and Activity of Modified Ferrite-Based Catalysts
for WGS Reaction. J. Mol. Cat. A: Chem. (280) 43–51.
63. Khan, A., P.P. Boolchand, P.G. Smirniotis. (2008) Modified Nano-Crystalline
Ferrites for High-Temperature WGS Membrane Reactor Applications. J. Catal.
(253) 91–104.
64. Kikuchi, E., S. Uemiya, N. Sato, H. Inoue, K. Ando and T Matsuda (1989).
Chem. Lett. 489.
65. Kim, A.R., Balsang, L., Myung, J.P., Dong, J.M., Jong, W.B. (2012). Catalytic
Performance on CuO–Cr2O3–Ga2O3 Mixed Oxides for Water Gas Shift
Reaction: Effects of Ga/Cr Molar Ratio. Catal. comm. (19) 66–69.
66. Koryabkina N.A., Phatak, A.A., Ruettinger W.F., Farrauto R.J., Ribeiro F.H.
(2003). Determination of kinetic parameters for the water gas shift reaction on
copper catalysts under realistic conditions for fuel cell applications. J. Catal.
(217) 233 - 239.
67. Kumar, P., and Idem, R., (2007) A Comparative Study Of Copper-Promoted
Water-Gas-Shift (WGS) Catalysts. Energy Fuels, 21, 522-529.
68. Kumar, P., Akpan, E., Ibrahim, H., Aboudheir, A., Idem, R. (2008). Kinetics and
reactor modelling of a high temperature water gas shift reaction (WGSR) for
hydrogen production in a packed bed tubular reactor. Ind. Eng. Chem. Res. (47),
4086 4097.
69. Łaniecki M., M. Małecka-Grycz, F. Domka. (2000) Water–Gas Shift Reaction
over Sulfided Molybdenum Catalysts I. Alumina, Titania and Zirconia-
Supported Catalysts. Appl. Catal. A: Gen (196) 293–303.
70. Lee J.Y., Dae-Won L., Myung SL., Kwan-Young L. (2011) Cs-Promoted Ni/Fe
Catalyst as A Cr-Free, High Temperature Shift Catalyst for Steam Methane
Reformate Without Additional Supply of Steam. Catal. comm. (15) 37–40.
71. Lee, D.W., Lee, M.S., Lee, J.Y., Kim, S., Eom, H.J., Moon, D.J., Lee, K.Y.,
(2013). The review of Cr free Fe-based catalysts for the high temperature water
gas shift reactions. Catal. Today (210) 2 – 9.

163
72. Lenite, B.A., Camilla, G., Stefania, S. (2011). Studies on Au Catalysts for Water
Gas Shift Reaction. Int. J. Hydrogen Energy. (36) 7750-7758
73. Levenspiel, O., (1999), Chemical Reaction Engineering (3rdedition), Wiley,
New York.
74. Levin, D.B., Lawrence Pitt, Murray Love (2004). Biohydrogen Production:
prospects and limitations to practical application. Int. J. Hydrogen Energy29
(2):173 – 185.
75. Li, Y., Fu, Q., Flytzani-Stephanopoulus, M., (2000). Low-temperature water gas
shift reaction over Cu and Ni loaded cerium oxide catalysts. App. Catal. B: Env.
27, 179 – 191.
76. Li J., Heesung Y., Tak-Keun O., Wachsman E., (2009). High Temperature
SrCe0.9Eu0.1O3-Δ Proton Conducting Membrane Reactor for H2 Production Using
the Water Gas Shift Reaction. App. Catal. B: Env. 92, 234 - 239
77. Liguori, S., Pinacci, P., Seelam, P.K., Keiski, R., Drago, F., Calabro, V., Basile,
A., Ilulianelli, A. (2012) Catal. Today. doi:10.1016/j.cattod.2012.02.005
78. Lilong, J., Ye, B.,Wei, K. (2008).Effects Of CeO2 On Structure And Properties
Of Ni-Mn-K/Bauxite Catalysts For Water-Gas Shift Reaction. J. Rare Earths,
(26), 3, 352
79. Liu, X., Wolfgang, R., Xiaoming, X., Robert F. (2005). Deactivation of Pt/CeO2
Water-Gas Shift Catalysts Due To Shutdown/Startup Modes for Fuel Cell
Applications. App. Catal. B: Env.(56) 69–75
80. Luengnaruemitchai, A., Somchai, O.A., Erdogan, G. (2003) Comparative
Studies of Low-Temperature Water–Gas Shift Reaction over Pt/CeO2, Au/CeO2,
and Au/Fe2O3 Catalysts. Catal. comm. (4) 215–221.
81. Ma, D., and Lund, R.F.C, (2003). Assessing High temperature Water Gas Shift
Membrane Reactors. Ind. Eng. Chem. Res. (42), 711 – 717.
82. Marcello, D.F. (2011). Membrane Reactors Modelling. Membrane Reactors For
Hydrogen Production Processes, 79-102. Springer-Verlag London Limited.
83. Mars, P. (1961) Factors governing the behaviour of the adiabatic water-gas shift
reactor. Chem. Eng. Sci.(14)1, 375 - 384.

164
84. Mears, D.E., (1971). Tests for transport limitations in experimental catalytic
reactors. Industrial & Engineering Chemistry Process Design and Development
10, 541–547.
85. Mellor, J.R, R.G. Copperthwaite, N.J.Coville. (1997) The Selective Influence Of
Sulfur on the Performance of Novel Cobalt-Based Water Gas Shift Catalysts.
Appl. Catal. A: Gen(164) 69 – 79
86. Mendes, D., Vania, C., Ju-Meng, Z., Silvano, T., Fabio, B., Adelio, M., Luis,
M.M. (2010). Enhancing the Production of Hydrogen via Water gas Shift
Reaction Using Pd-Based Membrane Reactors. Int. J. Hydrogen Energy.35,
12596 - 12608.
87. Meunier, F.C., Yablonsky, G., Reid, D., Shekhtman, S.O., Hardacre, C., Burch,
R., Lazman, M. (2008). Negative Apparent kinetic order in steady state kinetics
of the water gas shift reaction over a Pt-CeO2 catalyst Catal. Today. (138), 216 -
221.
88. Morreale, B.D., Ciocco, M.V., Enick, R.M., Morsi, B.I., Howard, B.H., Cugini,
A.V., Rothenberger, K.S. (2003). The permeability of hydrogen in bulk
palladium at elevated temperatures and pressures. J. Mem. Sci (212) 87 – 97.
89. Múnera, J., S. Irusta, L. Cornaglia, E. Lombardo. (2003). CO2 Reforming Of
Methane As A Source Of Hydrogen Using A Membrane Reactor. App.
Catal.245, 383 395.
90. Naidja, C.R. Krishna, T. Butcher, D. Mahajan.( 2003) Cool flame partial
oxidation and its role in combustion and reforming of fuels for fuel cell systems.
Prog. Energy Combust. Sci. 29 (2) 155-191.
91. Nauman, S.T., Myren, C. (1995) Fuel Processing Of Biogas for Small Fuel Cell
Power Plants. J. Power Sources; 56:45–9.
92. Newsome, D. S. (1980). The Water-Gas Shift Reaction. Catal Rev: Sci Eng,
21(2), 275-318.
93. Nickolov, A.R.N., Rumeana, M.E.B., Vladimir, J.K.B., Dimitrinka, A.N.B.,
Neli, B.S.A, Dimitar, R.M. (2000) Effect Of The Order Of Potassium

165
Introduction On The Texture and Activity of Mo/Al2O3 Catalysts in Water Gas
Shift Reaction. Appl. Catal. A: Gen (190) 191–196.
94. Olympiou, G.G., Kalamaras, C.M., Yazdi, C.D.Z, Efstathiou, A.M. Mechanistic
aspects of the water gas shift reaction on alumina supported noble metal
catalysts: In situ DRIFTS and SSITKA mass spectrometry studies. Catal. Today,
127, 304 – 318.
95. Osa, A., Lucas, A., Valverde, J.L., Romero, A., Monteagudo, I., Sanchez, P.
(2011). Performance Of A Sulfur-Resistant Commercial WGS Catalyst
Employing Industrial Coal-Derived Syngas Feed. Int. J. Hydrogen Energy (36)
44 - 51.
96. Osa, A., Lucas, A., Romero, A., Casero, P., Valverde, J.L., Sanchez, P. (2012).
High Pressure Water gas shift performance over a commercial non-sulfide
CoMo catalyst using industrial coal-derived syngas. Fuel 97, 428 – 434.
97. Osa, A., Lucas, A., Romero, A., Valverde, J.L., Sanchez, P. (2011) Kinetic
models discrimination for the high pressure WGS reaction over a commercial
CoMo catalyst. Int. J. Hydrogen Energy. (36) 9673 – 9684.
98. Padovani, C., and Lotteri, A. (1937). J. Soc. Chem. Ind. (56), 311.
99. Park, J.N., Jae-Hyun, K., and Ho-In, L. (2000). A Study on the Sulfur-Resistant
Catalysts for Water Gas Shift Reaction III. Modification of Mo/G-Al2O3
Catalyst with Iron Group Metals. Bull. Korean Chem. Soc., (21), 12, 1233-1238
100. Pastore, A., and Mastorakos, E. (2010). Rich n-heptane and diesel
combustion in Porous Media. Exp. Therm. Fluid Sci. 34(3) 359 - 365.
101. Pati, R.K., Ivan, C.L., Sicong, H., Osifo, A., Karen, J.G., Qi, W., Anatoly,
I.F., Deryn, C., Lourdes G.S., and Sheryl H.E. (2009). Flame Synthesis of
Nanosized Cu-Ce-O, Ni-Ce-O, and Fe-Ce-O Catalysts for the Water-Gas Shift
(WGS) Reaction. App. Mater. Interfaces (1), 11, 2624–2635.
102. Perry, R.H., Green, D.W., (1997). Perry’s Chemical Engineer’s
Handbook. seventh ed. McGraw-Hill, New York.
103. Phatak, A.A., Koryabkina, N., Rai, S., Ratts, J.L., Ruettinger, W., Farrauto, R.J.,
BLau, G.E., Delglass, W.N., Ribeiro, F.H. (2007). Kinetics of the water gas shift

166
reaction on Pt catalysts supported on alumina and ceria. Catal. Today (123) 224
– 234.
104. Rhodes, C., and Hutchings, G.J., (2003). Studies of the role of the copper
promoter in the iron oxide/chromia high temperature water gas shift catalyst.
Phys. Chem. Chem. Phys. (5), 2719 – 2723.
105. Romero, E.L., Wilhite, B.A. (2012).Composite Catalytic-Permselective
Membranes: Modeling Analysis for H2 Purification Assisted by Water-Gas-Shift
Reaction. Chem. Eng. J. (207 208), 552 – 563.
106. Saha, B. (2011). Sulphur Tolerant Catalysts for Hydrogen Production by the
Reforming of Biogas (Master's Thesis). University Of Regina, Canada.
107. Sengupta, P., Khan, A., Zahid, M.A., Ibrahim, H., and Idem, R. (2012).
Evaluation of the Catalytic Activity Of Various 5Ni/Ce0.5Zr0.33M0.17O2-Δ Catalysts
For Hydrogen Production By The Steam Reforming Of A Mixture Of
Oxygenated Hydrocarbons. Energy Fuel, (26), 816−828.
108. Sengupta, P. (2011). Catalysts for hydrogen production by the steam reforming of
mixtures of oxygenated hydrocarbons (Master’s Thesis). University of Regina,
Canada.
109. Seok, D.R. And Hwang, S.T. (1990). Studies in Surface Science and Catalysts:
“Future Opportunities In Catalytic and Separation Technology (Eds Misono. M.,
Moro-Oka. Y. and Kimura, S.). Elsevier 248-267
110. Shinde, M.V. and Madras, G. (2012). Water gas shift reaction over multi-
component ceria catalysts. App. Catal. B: Env. (123 – 124), 367 378.
111. Stevens, R.W., Shamsi A., Carpenter S., Siriwardene R., (2010). Sorption
Enhanced Water Gas Shift Reaction by sodium promoted calcium oxides. Fuel
(89) 6, 1280 – 1286.
112. Storch, H.H. and I. I. Pinkel (1937). Preparation of an Active Cobalt-Copper
Catalyst for the Water-Gas Shift Reaction. Ind. Eng Chem. 715.
113. Suguman, S., Devika, G.R., Unnikrishnan, P.A. (1995). Surface acidity/basicity
of yttria and its mixed oxides with alumina catalysts. Indian J. Eng. Mater. Sci.
(2) 245 – 246.

167
114. Sukonket, T., Khan, A., Saha, B., Ibrahim, H., Tantanayon, S., Kumar, P., Idem,
R. (2011). Influence of the catalyst preparation method, surfactant amount, and
steam on CO2 reforming of CH4 over 5Ni/CeZrO catalysts. Energy Fuel, 25, (864
– 877).
115. Tabakova, T. V. Idakiev, J. Papavasiliou, G. Avgouropoulos , T. Ioannides.
(2007) Effect of Additives on the WGS activity Of Combustion Synthesized
CuO/CeO2 Catalysts. Catal. comm. (8), 1, 101–106.
116. Tang, Z., Seok, J.K., Gunugunuri, K.R., Junhang, D., Panagiotis, S. (2010)
Modified Zeolite Membrane Reactor for High Temperature Water Gas Shift
Reaction. J. Mem. Sci (354) 114–122.
117. Thommes, M. (2010). Physical Adsorption Characterization of Nanoporous
Materials. Chem. Ing. Tech. (82), 7, 1059 - 1073
118. Thormann, J., Pfeifer, P., Schubert, K., Kunz, U. (2008) Reforming Of Diesel
Fuel in a Micro Reactor for APU Systems. Chem. Eng. J. (135) 74–81.
119. Tosti, S., Violante, V., Basile, A., Chiappetta, G., Castelli, S., Francesco, M.,
Scaglione, S., Sarto, F., (2000). Catalytic Membrane Reactors for Tritium
Recovery from Tritiated Water in the ITER Fuel Cycle. Fusion Eng. Des. (49–50)
953.
120. Wade, A.A. (2004). Biological Water-Gas Shift Conversion of Carbon Monoxide
to Hydrogen; Milestone Completion Report. National Renewable Energy
Laboratory. Http://Purl.Access.Gpo.Gov/GPO/LPS92934.
121. Walas, S.M., (1990). Chemical Process Equipment—Selection and Design.
Butterworth-Heinemann, Newton, MA.
122. Watanabe, A.K., Toshihiro, M.B., Kazutoshi, H.B., Hisao, Y.B., Masahiro, W.B.
(2009). High Temperature Water–Gas Shift Reaction over Hollow Ni–Fe–Al
Oxide Nano-Composite Catalysts Prepared By the Solution-Spray Plasma
Technique. Catal. comm. (10) 1952–1955.
123. Xue, E., Keeffe, M.O., Ross, J.R.H. (1996) Water-Gas Shift Conversion Using a
Feed with a Low Steam to Carbon Monoxide Ratio and Containing Sulphur.
Catal. Today (30) 107-118.

168
124. Yablonsky, G.S., Pilasombat, R., Breen, J.P., Burch, R., Hengrasmee S. (2010).
Cycles across an equilibrium: a kinetic investigation of the reverse and forward
WGS reaction over a 2%Pt/CeO2 catalyst (Experimental Data and Qualitative
Interpretation). Chem.Eng. Sci. (65), 2325 – 2332.
125. Yixin, L., Huifang, W., Quanxing Z., Weiping F., Yiquan Y. (2009) Effect of
Mg/Al Atom Ratio of Support on Catalytic Performance of Co-Mo/Mgo-Al2O3
Catalyst For Water Gas Shift Reaction. J. Nat. Gas Chem. (18) 2, 161-166.
126. Yusheng, S., Lei L., Yingying, Z., Xingyi L., Qi, Z.,Kemei, W. (2009) Effect of
Yttrium Addition on Water-Gas Shift Reaction over CuO/CeO2 Catalysts. J. Rare
Earths (27), 3, 411–417.
127. Zerva, C., Philippopoulos, C.J., (2006). Ceria catalysts for water gas shift
reaction: Influence of preparation method on their activity. App. Catal. B:
Env.(67) 1 – 2, 105 – 112.
128. Zhao, H., Hu, Y., Li, J., (1999). J. Mol. Catal. A: Chem (149), 141.
129. Zhou, X., Chen, Q., Tao, Y., Weng, H. (2011). Effect of vacuum impregnation on
the performance of Co/SiO2 Fischer Tropsch catalyst. J. Nat. Gas Chem. (20) 350
– 355.
130. Zou, J., Jin, H., and Winston, W.S.H. (2007) CO2-Selective Water Gas Shift
Membrane Reactor for Fuel Cell Hydrogen Processing. Ind. Eng. Chem. Res. 46,
(8) 2272 - 2279.

169
APPENDICES
APPENDIX A: Representative GC Datasheets for experiment
Membrane Characterization result showing pure hydrogen permeate.

170
Result of WGSR on 30%CO/balance N2 gas using 3Ni5Cu/CeZrCa catalyst at 5000C
reaction temperature.

171
Reformate gas composition before start of reaction in membrane reactor at 200psi.

172
Results of product composition after performing WGSR in PBTR at atmospheric
pressure.

173
Results of product composition after performing WGSR in PBTR at high pressure.

174
Results of product composition after performing WGSR in membrane reactor at
atmospheric pressure.

175
APPENDIX B: Results for SAR statistical analysis using Minitab
General Linear Model: Conversion versus S/M, Tcalc, ... Factor Type Levels Values
S/M fixed 3 0.00, 0.50, 1.25
Tcalc fixed 3 500, 575, 650
Trxn fixed 3 450, 500, 550
S/CO fixed 3 1.7, 2.7, 3.7
Prxn fixed 4 1.0, 10.2, 13.6, 17.0
M fixed 3 Ca, Gd, Mg
Gas comp fixed 2 pure CO, reformate
Analysis of Variance for Conversion, using Adjusted SS for Tests
Source DF Seq SS Adj SS Adj MS F P
S/M 2 663.95 57.20 28.60 212.92 0.000
Tcalc 2 466.56 38.31 19.15 142.58 0.000
Trxn 2 494.46 559.20 279.60 2081.39 0.000
S/CO 2 823.19 729.00 364.50 2713.40 0.000
Prxn 3 3226.35 818.66 272.89 2031.41 0.000
M 2 640.51 640.51 320.26 2384.03 0.000
Gas comp 1 217.60 217.60 217.60 1619.86 0.000
Error 5 0.67 0.67 0.13
Total 19 6533.29
S = 0.366515 R-Sq = 99.99% R-Sq(adj) = 99.96%
Nested ANOVA: conversion, reducibility, PV, Dispersion, basicity
Nested ANOVA: conversion versus Promoter Analysis of Variance for conversion
Source DF SS MS F P
Promoter 4 594.7341 148.6835
Total 4 594.7341
Variance Components
Source Var Comp. % of Total StDev
Promoter 148.684 100.00 12.194
Total 148.684 12.194
Expected Mean Squares
1 Promoter 1.00(1)
Nested ANOVA: reducibility versus Promoter Analysis of Variance for reducibility
Source DF SS MS F P
Promoter 4 0.5684 0.1421

176
Total 4 0.5684
Variance Components
Source Var Comp. % of Total StDev
Promoter 0.142 100.00 0.377
Total 0.142 0.377
Expected Mean Squares
1 Promoter 1.00(1)
Nested ANOVA: PV versus Promoter Analysis of Variance for PV
Source DF SS MS F P
Promoter 4 1.1049 0.2762
Total 4 1.1049
Variance Components
Source Var Comp. % of Total StDev
Promoter 0.276 100.00 0.526
Total 0.276 0.526
Expected Mean Squares
1 Promoter 1.00(1)
Nested ANOVA: Dispersion versus Promoter Analysis of Variance for Dispersion
Source DF SS MS F P
Promoter 4 0.5080 0.1270
Total 4 0.5080
Variance Components
Source Var Comp. % of Total StDev
Promoter 0.127 100.00 0.356
Total 0.127 0.356
Expected Mean Squares
1 Promoter 1.00(1)
Nested ANOVA: basicity versus Promoter Analysis of Variance for basicity
Source DF SS MS F P

177
Promoter 4 576.8000 144.2000
Total 4 576.8000
Variance Components
Source Var Comp. % of Total StDev
Promoter 144.200 100.00 12.008
Total 144.200 12.008
Expected Mean Squares
1 Promoter 1.00(1)
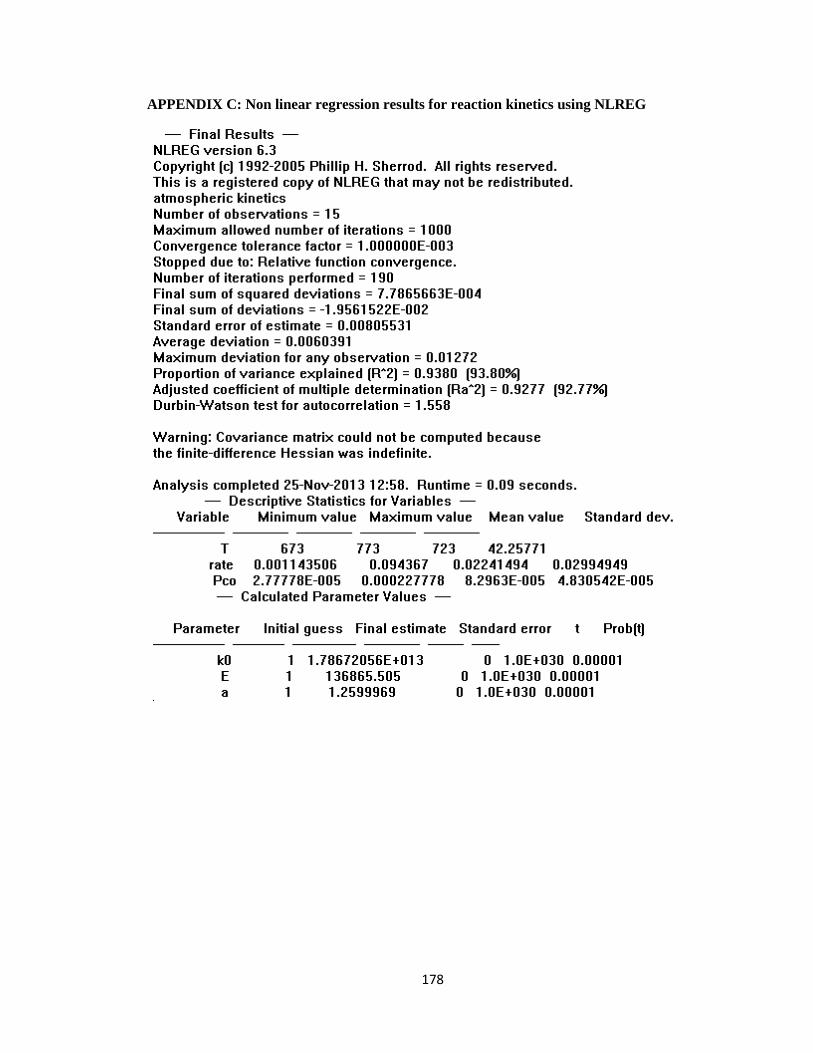
178
APPENDIX C: Non linear regression results for reaction kinetics using NLREG

179

180

181
APPENDIX D: Heat & Mass transfer Resistance determination
Heat Transport Effects
Prater analysis:
Deff = effective diffusivity, m2/s =
……..(D1)
Were; T is the temperature of study = 773K
MAB = the average molecular weight of the gas mixture
MAB = (D2) (Geankoplis, 2003)
MA = molecular weight of component A, CO = 28g/mol
MB = molecular weight of component B, water = 18g/mol
Xi= mol fraction
P = total pressure
σAB = characteristic length or average collision diameter, Ao
σAB = (σA + σB)/2 (D3)
ΩD = Diffusion collision integral, dimensionless
(D4)
T* is given by kT/εAB (D5)
εAB = (εA εB)1/2
(D6)
εi/k = 0.75 Tc (D7)

182
εi is the characteristic Lennard Jones energy,
k =Boltzmann constant, Tc is the critical temperature
σi = 0.841Vc1/3
, (D8)
Vc is the specific volume at critical temperature
Let A be CO and B is Water
From Chemsep version 6.90 pure component database (2012);
Tc (CO) = 133K Tc (Water) = 647K
Vc (CO) = 93.1cm3/mol Vc (Water) = 55.9 cm
3/mol
MA (CO) = 28 kg/kmol MA (Water) = 18kg/kmol
From equation (D7);
εA/k = 99.7K
εB/k = 485.3K
Replace in equation (D6)
εAB = 3.036 x 10⁻²¹
Substitute in equation (D5)
T* = 3.5
Substitute in equation (D4)
ΩD = (44.54 (3.5)-4.909
+ 1.911 (3.5)-1.575
)0.10
= 0.9
From equation (D3);
σB = 0.841(55.9 x 10⁻³
)1/3
= 3.22Ao
σA = 0.841(93.1 x 10⁻³
)1/3
= 3.81Ao

183
Substitute in equation (D3);
σAB = 3.517A0
From equation (D2);
2.7mol of H2O is fed with 1 mol of CO, therefore mol fraction xCO=0.27, xH2O=0.73
MAB = 20.7g/mol
Substitute in equation (D1);
= 1.61 x 10
-4m
2/s
According to Geankoplis, void fraction
(D9)
From this work, d/dp of 15.9 was used according to Froment, Bischoff and Rase criteria
for d/dp >=10, thus from equation (11) this yields a void fraction . Tortuosity
factor, τ is taken as 8 (Fogler, 1999).
Thus
To compute effective thermal conductivity, λeff, the correlation according to Walas, 1990
is as follows:
(D10)
NRe = ρfvdp/μ (1-ε) (D11)
Were ρf is density of fluid mixture, kg/m3
v is average fluid velocity for the mixture, m/s
dp is the particle size = 0.8mm
μ is the fluid viscosity for the mixture, Pa.s

184
From Felder and Rousseau (1986), density of a mixture is given by
From Buddenberg & Wilke (F.J. Krieger, 1951), viscosity of mixture is given by
μ
μ
μ
of water, xi is mole of fraction of CO
If i = CO and j = water,
From Chemsep database for pure compounds,
ρCO = 1.165kg/m3
ρH2O = 0.804kg/m3
Inserting the above values in equation (D12) therefore yields:
ρ
Also, from Chemsep database for pure compounds, vapour viscosity was obtained as
follows;
μCO (273K) = 23.5 x 10⁻⁵
Pa.s μH2O = 2.8 x 10⁻⁵
Pa.s
To calculate for fluid velocity for gas mixture, the following correlation was used
(Cussler, 1985);
Vavg = y1v1 + y2v2 (D14) were yi is mole fraction, vi is velocity of individual
component
From the experimental data, velocity, v, can be obtained from the volumetric flow rates
(V*i) and area of the reactor (A) using the following equation:
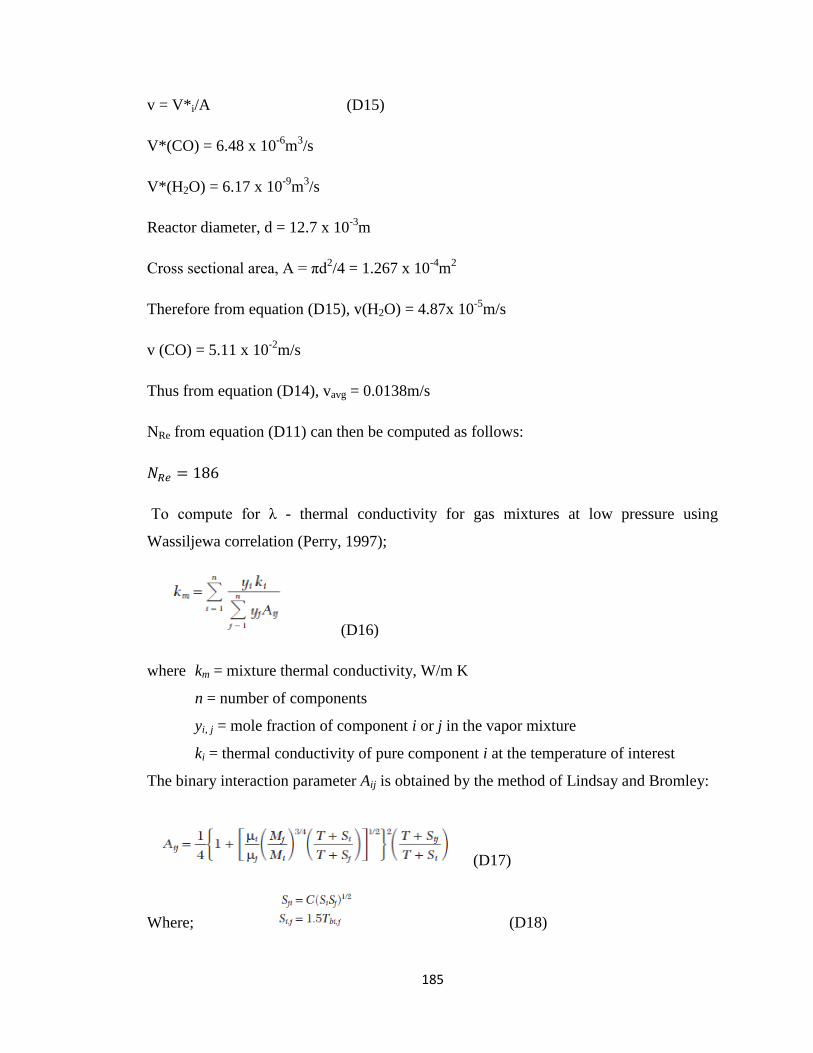
185
v = V*i/A (D15)
V*(CO) = 6.48 x 10⁻⁶
m3/s
V*(H2O) = 6.17 x 10⁻⁹
m3/s
Reactor diameter, d = 12.7 x 10⁻³
m
Cross sectional area, A = πd2/4 = 1.267 x 10
-4m
2
Therefore from equation (D15), v(H2O) = 4.87x 10⁻⁵
m/s
v (CO) = 5.11 x 10⁻²
m/s
Thus from equation (D14), vavg = 0.0138m/s
NRe from equation (D11) can then be computed as follows:
To compute for λ - thermal conductivity for gas mixtures at low pressure using
Wassiljewa correlation (Perry, 1997);
(D16)
where km = mixture thermal conductivity, W/m K
n = number of components
yi, j = mole fraction of component i or j in the vapor mixture
ki = thermal conductivity of pure component i at the temperature of interest
The binary interaction parameter Aij is obtained by the method of Lindsay and Bromley:
(D17)
Where; (D18)

186
μi, j = vapor viscosity of pure component i or j at the temperature
T of interest and low pressure, Pa·s
Mi, j = molecular weight of pure component i or j
T = temperature, K
C = 1.0
Tbi, j = normal boiling temperature of pure component i or j, K
The normal boiling point and thermal conductivity for each of the components were
obtained from Chemsep v6.9 as follows;
k (CO) = 0.05W/m.K
k (H2O) = 0.06W/m.K
Tb (CO) = 82K
Tb (H2O) = 373K
Thus S CO = 123
S H2O = 560
Sji = 262.3
Substituting in equation (D17),
A11 = A22 = 1
Insert in equation (D16) gives
km = λ=5.47 x 10⁻⁵
KJ/m.s.K
Computing λeff with equation (D10)
λeff =8.096 x 10⁻⁴
KJ/m.s.K
To compute CAS from experimental data, Run 15

187
CAC is assumed to be zero as suggested by Levenspiel, 1999
∆Hrxn = -41kJ/mol
Eventually
To determine the heat transfer limitation across the gas film, the following correlation
is used;
ρ
To compute for characteristic length, L = Hydraulic diameter = D, were D = diameter of
the reactor. Thus, L = 12.7mm (diameter of reactor).
Also, to obtain rA,obs, I took run 15 as my base case at temperature of 773K and molar
ratio of H2O/CO = 2.7. Thus rA,obs = 1.4 x 10⁻²
kmol/kgcat.s. Writing the rate in terms of
kmol/m3s and taking a basis of 1s for the volume flow rate, rA,obs = 1.08kmol/m
3.s
Computing for Schmidt number,

188
According to Massoud Kaviani (1995), to compute for cp for a mixture of gases, cpij =
yicpi + yicpj
yi = mole fraction, cpi is specific heat capacity for each component.
From Chemsep, cp(CO) at 773K = 1.13KJ/kg.K
cp(H2O) = 2.13KJ/kg.K
Therefore cp for the mixture = 1.86KJ/kg.K
Computing for Prandtl number,
To compute for JD factor, NRe = 186;
= 0.108
From
h = 0.106KJ/m2s.K
Mears correlation is used as follows;
ρ
ρ
From experimental data, ρ
ρ
E = 137.2KJ/mol
Substituting gives 0.8 x 10⁻⁴
Thus the heat transport limitation is negligible.