hydrogen sulfide exposure among oil refinery...
TRANSCRIPT

Hydrogen Sulfide Exposure among Oil Refinery Workers during Loading Operations at
Marathon Petroleum Company in Canton, Ohio
Christine A. Beil
Project report submitted to the College of Engineering and Mineral Resources at West Virginia University in partial
fulfillment of the requirements for the degree of
Master of Science in
Industrial Hygiene
Steven Guffey, Ph.D., Chair,
Warren Myers, Ph.D., Michael Klishis, Ph.D.
Department of Industrial Management and Systems Engineering
Morgantown, West Virginia 2012
Keywords: Industrial Hygiene; Air Sampling; Hydrogen Sulfide; Oil Refinery

ABSTRACT
Hydrogen Sulfide Exposure among Oil Refinery Workers during Loading Operations at Marathon
Petroleum Company in Canton, Ohio
Christine A. Beil
Air monitoring surveys were conducted during loading operations at three locations inside of Marathon Petroleum Company’s Canton, Ohio oil refinery. These three locations—the sulfur truck loading rack, the asphalt rail car loading rack, and the asphalt truck loading rack—represent all loading locations inside the refinery where hydrogen sulfide (H2S) exposure is a risk to operators.
Personal and area air monitoring was conducted at each of the three locations. In total, 73 personal and area samples were collected. Personal sampling results indicate that operators were not being overexposed to H2S at any of the locations during this survey. The maximum instantaneous concentration values were all less than 2.2 ppm and all time-weighted averages were below 1.0 ppm. Thus, for both peak and 8-hour time-weighted concentrations, personal exposures were all below OSHA, ACGIH and company exposure limits.
As a result of these findings, it is recommended that operators no longer be required to routinely wear supplied air respirators at the sulfur loading rack or the asphalt loading racks. However, operators should be equipped with escape respirators with at least 5 minutes of Grade D breathing air. The devices do not need to be donned, except in an emergency situation.
While personal sampling indicated no overexposure, area sampling showed higher concentrations close to the source. The highest area H2S concentrations at each location were 10.4 ppm (sulfur truck loading rack), 24.1 ppm (asphalt rail car loading rack), and 78.4 ppm (asphalt truck loading rack).
As a result of these findings, several recommendations were made to ensure that concentrations remain low, provided standard operating procedures remain the same.

iii
Table of Contents Abstract ...........................................................................................................................................ii
Introduction ..................................................................................................................................... 1
The Oil Refining Process and H2S Exposure .............................................................................. 1
Locations with the Greatest Potential for H2S Exposures in Canton, Ohio ................................ 2
Toxicity of H2S ........................................................................................................................... 4
Allowable Exposure Levels for H2S ........................................................................................... 5
Study Objective ............................................................................................................................... 6
Background ..................................................................................................................................... 6
Sulfur Truck Loading .................................................................................................................. 7
Asphalt Rail Car Loading ......................................................................................................... 11
Asphalt Truck Loading ............................................................................................................. 14
Literature Review.......................................................................................................................... 16
Sampling Equipment ..................................................................................................................... 19
Industrial Scientific MX4 ......................................................................................................... 19
Industrial Scientific MX6 ......................................................................................................... 23
Methods......................................................................................................................................... 25
Air Sampling at the Sulfur Truck Loading Rack ...................................................................... 25
Air Sampling at the Asphalt Rail Car Loading Rack ................................................................ 26
Air Sampling at the Asphalt Truck Loading Rack.................................................................... 28
Data Transfer ............................................................................................................................ 29
Analysis of Data ........................................................................................................................ 30
Results ........................................................................................................................................... 30
Sulfur Truck Loading ................................................................................................................ 30
Asphalt Rail Car Loading ......................................................................................................... 31
Asphalt Truck Loading ............................................................................................................. 34
Discussion ..................................................................................................................................... 36
Sulfur Truck Loading Rack ...................................................................................................... 36
Asphalt Rail Car Loading Rack ................................................................................................ 39
Asphalt Truck Loading Rack .................................................................................................... 42
Asphalt Blends .......................................................................................................................... 48

iv
Compliance with OELs ............................................................................................................. 49
Respiratory Protection .............................................................................................................. 50
Controlling H2S Exposures ....................................................................................................... 51
Incident Prevention ................................................................................................................... 54
Personal Air Monitoring ........................................................................................................... 55
Conclusions ................................................................................................................................... 56
Recommendations ......................................................................................................................... 57
Ventilation................................................................................................................................. 57
Illumination ............................................................................................................................... 57
Respiratory Protection .............................................................................................................. 57
Air Monitoring .......................................................................................................................... 58
References ..................................................................................................................................... 59
Appendix A: Instrument Calibrations and Sample Locations ...................................................... 61
Industrial Scientific MX4 iQuad Multi-Gas Monitors.............................................................. 61
Industrial Scientific MX6 iBrid Multi-Gas Monitor ................................................................. 62
Appendix B: Description of Equipment ....................................................................................... 63
Industrial Scientific MX4 iQuad Multi-Gas Monitor ............................................................... 63
Industrial Scientific MX6 iBrid Multi-Gas Monitor ................................................................. 65
Alnor Thermoanemometer ........................................................................................................ 67
Appendix C: Sulfur Truck Loading Graphs.................................................................................. 68
Appendix D: Asphalt Rail Car Loading Rack Graphs .................................................................. 73
Appendix E: Graphs of Asphalt Truck Loading Rack Data ......................................................... 76

v
Table of Figures
Figure 1 – Marathon Petroleum Company: Canton, Ohio Refinery. .............................................. 3
Figure 2 – The Loading Arm Is Shown In The Man Way Hole Of A Transport Vehicle. ............. 4
Figure 3 – The Sulfur Truck Loading Rack During Active Sulfur Loading. ................................. 9
Figure 4 – Sulfur Truck Loading Rack ......................................................................................... 10
Figure 5 – Asphalt Rail Car Loading Rack ................................................................................... 12
Figure 6 – Close up of the Asphalt Rail Car Loading Rack ......................................................... 13
Figure 7 – Asphalt Truck Loading Rack....................................................................................... 15
Figure 8 – Asphalt Truck Loading Rack....................................................................................... 16
Figure 9 – The Industrial Scientific MX4 ..................................................................................... 20
Figure 10 – The MX4 DS2 Docking Station. ............................................................................... 22
Figure 11 – The Industrial Scientific MX6 ................................................................................... 23
Figure 12 – The MX6 DS2 Docking Station. ............................................................................... 24
Figure 13 – Layout of the Sulfur Truck Loading Rack ................................................................ 26
Figure 14 - Layout of the Asphalt Rail Car Loading Rack ........................................................... 27
Figure 15 - Layout of the Asphalt Truck Loading Rack ............................................................... 29
Figure 16 – Graph of H2S Concentrations at the Sulfur Controls Area ........................................ 36
Figure 17 – Graph of H2S Concentrations for the Man Way Hole Area ...................................... 38
Figure 18 – H2S Concentrations at 6-Spot on Sampling Day 3 .................................................... 41
Figure 19 – Graph of Asphalt Trucks 1 and 2 .............................................................................. 44
Figure 20 – Area concentrations from Asphalt Trucks 12 and 13 ................................................ 45
Figure 21 - Area concentrations from Asphalt Trucks 6, 8, and 9................................................ 46
Figure 22 - Area concentrations from Asphalt Trucks 3, 4, 5, 7, 11, and 16................................ 46
Figure 23 – Personal and area sampling results for Asphalt Truck 10 ......................................... 47

vi
Table of Tables
Table 1 – Average Flow of Air Movers at Asphalt Rail Car Loading Stations ............................ 14
Table 2 – Air Sampling Results for the Sulfur Loading Rack Survey .......................................... 31
Table 3 – Sampling Day 1 Air Monitoring Results from the Asphalt Rail Car Loading Rack Survey ........................................................................................................................................... 32
Table 4 – Sampling Day 2 Air Monitoring Results from the Asphalt Rail Car Loading Rack Survey ........................................................................................................................................... 32
Table 5 – Sampling Day 3 Air Monitoring Results from the Asphalt Rail Car Loading Rack Survey ........................................................................................................................................... 33
Table 6 – Air Monitoring Results for the Asphalt Truck Loading Survey ................................... 34
Table 7 – Air Monitoring Results from Inside of the Man Way Hole at the Asphalt Truck Loading Rack ................................................................................................................................ 35
Table 8 – Calibration Dates and Sample Locations for the MX4s Used at the Sulfur Loading Rack .............................................................................................................................................. 61
Table 9 – Calibration Dates and Sample Locations for the MX4s Used at the Asphalt Rail Car Loading Rack ................................................................................................................................ 61
Table 10 – Calibration Dates and Sample Locations for the MX4s Used at the Asphalt Rail Car Loading Rack ................................................................................................................................ 62
Table 11 – Calibration Dates and Sample Locations for the MX4s Used at the Asphalt Rail Car Loading Rack ................................................................................................................................ 62

1
Introduction
Marathon Petroleum Company (MPC) is an oil and gas company with more than 25,000
employees. Previously a subsidiary of Marathon Oil Corporation, MPC is now an independent
company that focuses on refining, marketing and transportation operations. MPC is the fifth
largest petroleum refiner in the United States with refineries in Garyville, Louisiana;
Catlettsburg, Kentucky; Robinson, Illinois; Detroit, Michigan; Canton, Ohio; and Texas City,
Texas. Combined, these six refineries have a crude oil processing capacity of approximately 1.2
million barrels per day (bpd).
The Oil Refining Process and H2S Exposure
A combination of domestic and international “sweet” and “sour” crude oil is
manufactured into an array of products at each of these six locations. Crude oil is considered
“sweet” if it contains less than 0.5% sulfur. Sweet crude oil is highly desirable due to its ability
to produce higher quality gasoline and diesel fuels. Sour crude oil contains greater than 0.5%
sulfur. It is lower in quality and costs more to refine. Although each refinery possesses its own
product slate, all refineries at the very least produce gasoline, diesel, propane, asphalt, and sulfur.
After processing, these products are transported via pipeline, rail car or truck to their commercial
destinations.
Both sweet and sour crude oil arrives at refineries laden with impurities, including
oxygen and nitrogen compounds, metallic elements and organic sulfur compounds, which must
be removed before the products can meet industry standards. Sour crude oil has more sulfur
impurities than sweet crude. It is imperative to remove as much sulfur as possible from
petroleum products for two reasons. First, sulfur adversely affects the catalytic reforming
process, a process that is used to create higher octane gasoline. If sulfur is present at this stage, it

2
will bond to the metallic catalyst, rendering the process ineffective. Second, sulfur must be
removed to meet regulatory standards. The Environmental Protection Agency (EPA) sets
standards on the amount of sulfur compounds that may be present in fuels and the amount of
sulfur dioxide (SO2) that may be emitted during combustion of these fuels.
In order to purify the crude oil, it is first distilled or fractionated based on hydrocarbon
chain length before it may be sent to the different processing units. Lighter chains of 5 – 12
carbons are sent directly to the desulfurization units, while heavier chains must be further broken
down before being processed. In the desulfurization units, hydrogen is added to the fractioned
streams, along with a metallic catalyst, in order to strip the sulfur from the oil. This reaction
yields a pure hydrocarbon chain and hydrogen sulfide (H2S) gas. Crude oil with a higher sulfur
content will produce more H2S, which is why H2S is a greater concern with sour crude oil. The
H2S gas is removed from streams of hydrocarbons through amine gas treating. The free gas is
then sent to the Claus reactor. H2S is then combined with oxygen in the Claus reactor to produce
elemental sulfur, water, and a small amount of SO2. The elemental sulfur is stored on-site in a
heated sulfur pit while awaiting transportation. Most of the sulfur compounds and H2S gas are
removed from the crude oil in this manner, although some invariably remain. H2S exposure is a
constant concern at MPC because it can be found throughout their oil refineries in petroleum
product pipelines. However, the greatest risk of exposure occurs not in the closed circuits of
pipelines but at the rare locations where gases can escape.
Locations with the Greatest Potential for H2S Exposures in Canton, Ohio
At MPC’s Canton, Ohio oil refinery, some of the locations where workers have an
increased risk of H2S exposure are at the “loading racks”, specifically at the sulfur and asphalt
loading racks. Figure 1 shows the location these loading racks inside of the refinery.

3
Figure 1 – Marathon Petroleum Company: Canton, Ohio Refinery. Box 1 indicates the location of sulfur truck loading. Box 2 indicates the location of asphalt rail car loading. Box 3 indicates the location of asphalt truck loading.
At each of the loading racks loading is manual, with an employee placing the product
loading arm into the “man way hole” of an open transport vehicle. The man way hole on all of
these vehicles is an approximately 3-foot hatched opening that is secured by large screws. This
configuration can be seen in Figure 2. H2S gas tends to escape during the loading of open
vehicles.
N
11
33 22

4
Figure 2 – The loading arm is shown in the man way hole of a transport vehicle.
Toxicity of H2S
H2S is highly hazardous. It is a colorless gas that can be identified at low concentrations
by its characteristic rotten-egg odor. However, prolonged exposure to H2S or exposure to
concentrations of 100 parts per million (ppm) or greater will desensitize the exposed person’s
sense of smell. H2S is denser than air, which means that it is less likely to disperse and more
likely to accumulate in low-lying areas.
At very low concentrations, the human body naturally converts H2S gas into the harmless
compound sulfate, which the body can tolerate indefinitely. Although, at higher concentrations,
the body cannot convert all of the gas and the H2S binds to iron-containing proteins, which
inhibits cellular respiration. Chronic exposures to H2S can affect the eyes, lungs, upper

5
respiratory tract and the central nervous system, while acute exposures can result in eye
irritation, upper respiratory tract irritation, coughing, loss of consciousness and possibly death.
Allowable Exposure Levels for H2S
The Occupational Safety and Health Administration (OSHA) currently has no 8-hour
time-weighted averaged (TWA) permissible exposure limit (PEL) for H2S, the rationale being
that H2S is an acute acting substance with minimal chronic exposure symptoms. OSHA instead
enforces a ceiling limit of 20 ppm and a peak concentration of 50 ppm. The PEL concentration
is defined as the maximum concentration that a healthy individual may be exposed to for an 8-
hour day, five days per week. H2S peak concentrations – any value above the ceiling value of 20
ppm – are not permitted if the TWA exposure is close to this ceiling. If the worker is exposed to
no other measureable concentrations throughout the day, one 10-minute exposure to
concentrations no greater than 50 ppm is not considered hazardous to his health.
In 1989, OSHA set a PEL of 10 ppm and a short-term exposure limit (STEL) of 15 ppm
for H2S, as well as more restrictive PELs for numerous other substances. In 1992, however, the
11th Circuit Court of Appeals vacated these PELs on the grounds that there was insufficient
evidence to necessitate the more restrictive guidelines. Therefore, the 10 ppm PEL and 15 ppm
STEL for H2S were rescinded and replaced with OSHA’s previous 1971 guidelines of a 20 ppm
ceiling and a 50 ppm peak. Ten ppm is now considered the acceptable concentration to avoid
irritation to mucosal membranes.
In 2010, the American Conference of Governmental Industrial Hygienists (ACGIH)
lowered their 8-hour TWA threshold limit value (TLV) from 10 ppm to 1.0 ppm and their 15-
minute STEL from 15 ppm to 5.0 ppm. The National Institute for Occupational Safety and
Health (NIOSH) recommends a ceiling value of 10 ppm.

6
MPC chooses to utilize OSHA’s 1989 vacated PEL (10 ppm) and STEL (15 ppm) as their
exposure guidelines. MPC also employs OSHA’s peak value of 50 ppm. H2S air sampling
results in this study were compared to MPC’s exposure guidelines, as well as OSHA regulations.
Study Objective
The objective of this study was to characterize H2S concentrations during loading
procedures at the sulfur truck loading rack, the asphalt rail car loading rack, and the asphalt truck
loading rack; and to quantify and compare personal exposures to MPC exposure guidelines.
Background
The Canton refinery is one of MPC’s smaller refineries. Canton’s crude capacity is
78,000 bpd and produces gasoline, diesel, asphalt, heavy fuel oil, propane, and elemental sulfur.
The Canton refinery has approximately 350 company employees and operates 24 hours per day
in three shifts. Less than 20 employees are involved in sulfur or asphalt loading; these
employees can be divided into three job titles, the Gas Oil Hydrotreater (GHT)/Claus 34
Operator, who is responsible for sulfur loading operations; the Asphalt Rail Car Loader, who is
responsible for asphalt rail car loading operations; and the Asphalt Truck Loader, who is
responsible for asphalt truck loading operations.
Sulfur and asphalt loading are governed the same procedures and policies. In each
location, the loader must place a supply hose into the man way hole of the receiving vehicle,
either a truck or rail car. A nearby valve is opened to allow for the movement of product into the
receiving vehicle. Once loading is complete, the loader must remove the supply hose, close the
hatched lid, and tighten it. Eductor and/or air movers constitute the ventilation systems at each
of the three loading racks and are required to be in use during all loading procedures. All
processes are performed outside in fresh air.

7
Marathon documents ROP-1143-CN, “HES&S – Claus 34 Unit Health and Safety Guide”
and ROP-1052-CN, “H&S – Asphalt Plant Health and Safety Guide” require that employees
must wear a self-contained breathing apparatus (SCBA) or a supplied air respirator if airborne
H2S concentrations are unknown or are 10 ppm or higher.
The hazards of H2S are further emphasized in MPC’s Hydrogen Sulfide Safety Practice
Instruction (SPI) document. This document summarizes the minimum acceptable standards
allowable at MPC as gathered from regulatory and industry standards. The SPI warns of the
dangers of H2S and includes all allowable concentrations as set by OSHA, as well as those
recommended by ACGIH and NIOSH. Sources of exposure, symptoms, hazard communication
and training requirements are outlined by this document. MPC employees are required to
undergo annual safety training, including H2S safety. All employees who have the potential to
be exposed to airborne contaminants are also required to have annual respirator fit tests and
respiratory protection training.
Because H2S is a major concern throughout the refinery, MPC requires all employees to
wear personal alarm devices. These devices monitor the concentrations of H2S in the air and
alarm if they detect a concentration above 10 ppm. The device emits a 95 dB signal and flashes
a red light. All alarm incidents must be reported by the wearer and are investigated to determine
the cause and to support recommendations intended to prevent future exceedances. Personal
alarm monitors must be worn at all times inside refinery limits, except while wearing either an
SCBA or a supplied air respirator.
Sulfur Truck Loading
Prior to this study, the H2S concentrations in the area surrounding the sulfur truck loading
rack were unknown. Previous sampling, taken in and around the elemental sulfur storage pit,
8
raised concerns that H2S concentrations had the potential to reach levels greater than 100 ppm.
There was concern that truck loading operations could also reach concentrations greater than 100
ppm. To address these concerns, workers in the area were required to wear supplied air
respirators during active sulfur loading.
During the night shift, sulfur trucks are loaded many times per week, with approximately
1-4 trucks being loaded per loading night. Sulfur levels are gauged visually by the loader
(GHT/Claus 34 Operator), which requires that the loader be in close proximity to the exposure
source. The loader must stand directly over the man way hole during active loading to determine
how much liquid elemental sulfur has been transferred into the truck. Several notches are on the
inside wall of the sulfur truck. The sulfur truck driver informs the sulfur truck loader as to which
notch he would like the sulfur levels to be loaded to. As sulfur loading takes place at night and
the lighting into the man way hole is dim, it can be difficult for the operator to see these notches
even when flashlights are used. It is likely that gauging in low light conditions increases the
amount of time spent at the source of potential exposure.
Because of the concerns that air concentrations could rise to unsafe levels, the loader has
been required to wear a supplied air respirator. The supplied air respirator is connected via an air
hose to a “12-PAK” of Grade D breathing air. The 12-PAK is a grouping of 12 interconnected
air cylinders that are used to provide air for supplied air respirators. As stated in Appendix E of
MPC’s Corporate Respiratory Protection Program, MPC requires that 12-PAKs be operated by a
minimum of three employees: a respirator user, a standby, and a bottle watch. The respirator
user must be in supplied air for the duration of the potential exposure. The loader using the
supplied air respirator must also be equipped with a 5-minute emergency egress bottle. The
standby is equipped with an SCBA, but does not don it unless an emergency arises. The bottle-
9
watch ensures that the supplied air user and the standby have adequate amounts of fresh air in
reserve. While sulfur loading is the Gas Oil Hydrotreater Operator’s job, two other employees
must leave their designated units to assist with loading.
While three employees are required, Canton only utilized two operators for sulfur
loading: the loader/respirator user and a combined standby/bottle watch. A miscommunication
between the safety department and the operations team led the operations team to believe that
only two operators were needed for sulfur truck loading. The standby/bottle watch was present
with supplied air equipped before loading began.
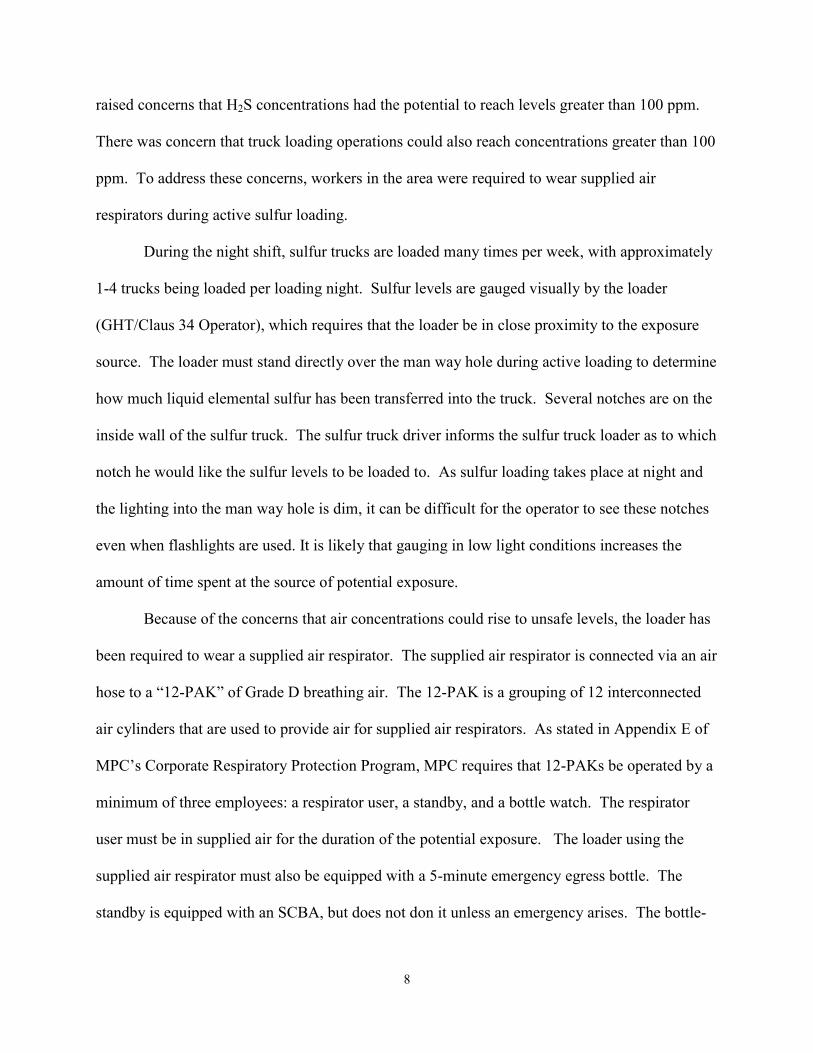
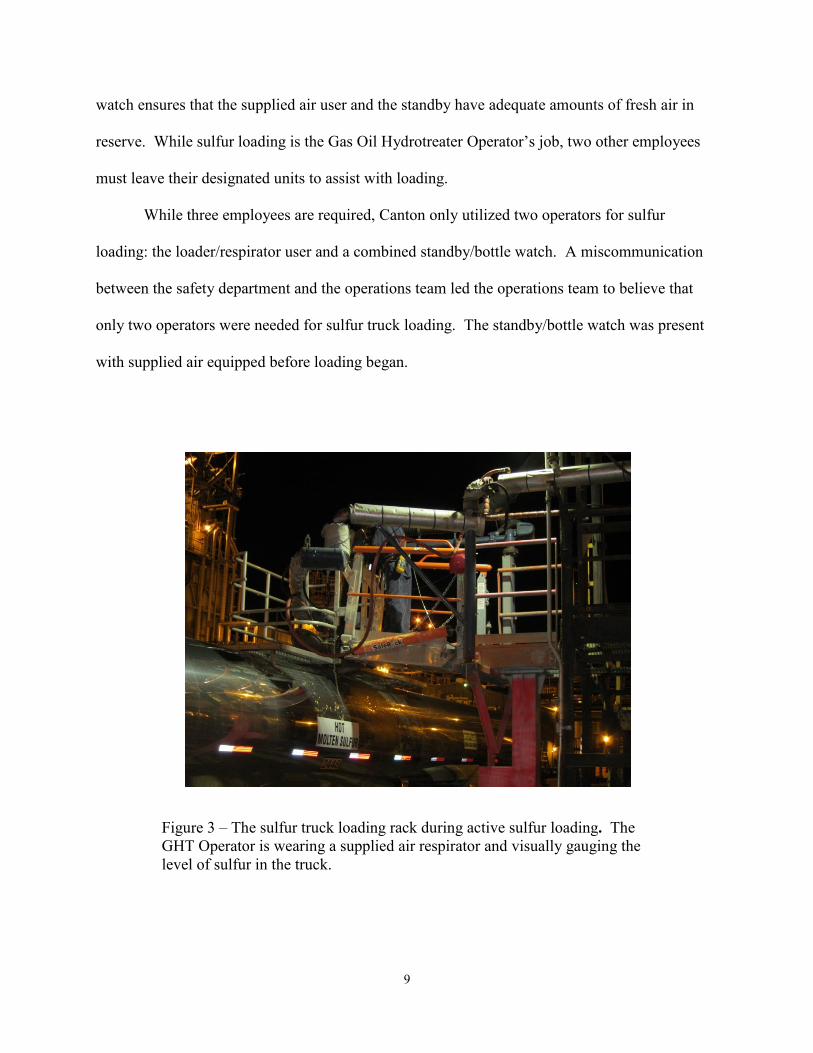
Figure 3 – The sulfur truck loading rack during active sulfur loading. The GHT Operator is wearing a supplied air respirator and visually gauging the level of sulfur in the truck.

10
After the sulfur truck is positioned and the lid is opened, the loader dons the supplied air
respirator and a venturi eductor is placed into the man way hole of the truck to remove any H2S
gas that has accumulated during loading. The gases are vented overhead into the atmosphere,
approximately 20 feet above the sulfur truck loading rack. Placing the exhaust eductor hose into
the man way hole must be the first action taken, while taking it out must be the last, to ensure
minimal exposure to the loader. The volumetric flow of the eductor was measured using an
Alnor thermoanemometer and found to be 1750 cubic feet per minute (cfm).
Figure 4 – Sulfur Truck Loading Rack. The black hose leading from the left side of the loading rack to above the pipe rack is the Venturi ventilation. The silver pipe to the right of the loading rack is the sulfur loading arm. The yellow pack of gas cylinders is the 12-PAK of supplied air where the combined back-up/bottle watch stands.

11
The supplied air respirator is donned while gauging sulfur levels and while the sulfur
loading arm is being removed. The loader is permitted to remove his supplied air respirator
when he is not directly over the man way hole. The loader typically removes his respirator when
he is by the sulfur loading controls on the operating platform. This platform is approximately 10
feet west of the man way hole.
Personal alarm monitors are not worn during loading procedure due to the assumption
that they are not needed when a supplied air respirator is worn.
Asphalt Rail Car Loading
Concentrations of H2S have been measured at the asphalt rail car loading rack in the past
and were believed to be below the 10 ppm threshold that requires supplied air. However,
personal alarm monitors have occasionally indicated that where H2S concentrations were at or
above 10 ppm in certain situations. Operators were typically unaware of personal alarms and
therefore the activities which caused the alarm are unclear.
Asphalt has the potential to contain high concentrations of H2S due to its composition of
hydrocarbons, hydrogen and sulfur. Also, asphalt is often stored at temperatures above 300° F to
prevent setting. Temperatures this high promote the chemical reactions of the remaining organic
sulfur compounds that create H2S gas.
The Canton refinery produces two blends of asphalt: the 150/200 blend and the 64/22
blend. The 150/200 asphalt blend contains 33% roofing flux, which is a softer, more pliable
material that has a lower sulfur content. The 64/22 blend contains no roofing flux and therefore
has a higher sulfur content and, consequently, the potential for higher H2S concentrations. Both
blends are loaded at the asphalt rail car loading rack.

12
The Canton asphalt rail loading rack has the capacity to load up to three rail cars during
one shift. The locations of the rail cars are referred to as “4 Spot”, “5 Spot” and “6 Spot”, with 4
Spot being the eastern-most rail car, 6 Spot being the western-most rail car, and 5 Spot in the
middle.
Figure 5 – Asphalt Rail Car Loading Rack.
At the start of his shift, the asphalt rail car loader inspects each rail car for leaks and other
potential hazards. Once the car passes inspection, the asphalt loading arm is positioned into the
man way hole and asphalt loading begins. This process typically lasts between 45 minutes and
2.5 hours, with multiple rail cars loaded concurrently. The asphalt rail car loader is only
obligated to be near the active loading site during the last 30 minutes of loading for visual

13
gauging of the amount of asphalt in the rail car. For the majority of the loading operations, the
asphalt rail car loader is permitted to be away from the source of potential exposure.
Figure 6 – Close up of the Asphalt Rail Car Loading Rack. The air mover is located at the right of the photograph.
To mitigate potential exposures to H2S, each rail car loading station is equipped with “air
movers”. The air movers are conical pipes that direct pressurized air over the source of potential
contaminants. The air mover in use at the asphalt rail car loading rack may be seen on the right
side of Figure 5. Air movers are turned on immediately following the start of loading and run
until loading is complete. The air movers push air across the opening of the man way hole at
approximately 340 – 720 cubic feet per minute (cfm). The volumetric flow of each air mover
was obtained using an Alnor thermoanemometer. Table 1 shows the average volumetric air flow
for each air mover at every loading location.

14
Table 1 – Average Flow of Air Movers at Asphalt Rail Car Loading Stations Location Air Flow
4 Spot 3300 cfm 5 Spot 3500 cfm 6 Spot Small 6900 cfm 6 Spot Large 2200 cfm
Asphalt Truck Loading
As with the asphalt rail car loading rack, concentrations of H2S had been measured in the
past, and were believed to be below the 10 ppm threshold that requires supplied air. However,
personal monitors have sometimes alarmed, indicating an exposure of concentrations at or above
10 ppm.
Asphalt trucks are loaded by Marathon operators on the western loading platform. Both
blends of asphalt – 64/22 and 150/200 – are loaded here. Some asphalt and all roofing flux and
heavy oil trucks are loaded by third-party truck drivers. Only Marathon employees loading
asphalt were included in this survey.
Asphalt trucks are positioned at the loading station by the truck drivers. The truck drivers
relay the desired amount of asphalt to the loader before loading begins. The asphalt truck loader
opens the man way hole and places the loading arm in. The amount of asphalt loaded is gauged
automatically and controlled by a computer located approximately 15 feet from the exposure
source. Once the truck is filled with the predetermined amount of asphalt, the flow is stopped by
the computer before the loader approaches the source. The loading arm is removed and excess
asphalt is allowed to drip off of the loading arm before the man way hole is closed. Loading
lasts approximately 10 to 15 minutes per truck. The asphalt truck loader is required to be near
the source of potential exposure only during the insertion and removal of the loading arm
procedures. During the actual loading, he is permitted to be in an adjoining enclosure.

15
Figure 7 – Asphalt Truck Loading Rack.
To mitigate potential exposures to H2S, the asphalt truck loading stations are equipped
with exhaust eductor hoses that run continuously. The eductor hoses are attached to a metal
plate that rests on top of the man way hole, which helps to ensure that all gases are drawn
upward through the ventilation system and not outward towards the loader. The airflow through
the exhaust hose used during this survey measured at 1270 cfm. An air mover is also located at
this asphalt truck loading station, but it is rarely used. The volumetric flow of this air mover is
1000 cfm when it operates.

16
Figure 8 – Asphalt Truck Loading Rack. The orange exhaust eductor hose is attached to a metal plate that sits over the asphalt loading arm.
Literature Review
Exposures to H2S have been documented in many industrial settings, including waste-
water treatment, chemical manufacturing and petroleum refining. H2S gas is denser than air,
which causes it to accumulate in man ways and other low-lying areas. The specific gravity of
H2S is 1.2, while air has a specific gravity of 1.0. H2S is the second leading cause of workplace
fatalities due to toxin inhalation. Only carbon monoxide produces more deaths per year (Nam et
al, 2004; Policastro and Otten, 2007). Hendrickson et al. (2004) conducted a retrospective
review of all H2S-related deaths in the United States over a seven-year period spanning 1993 to
1999. Fifty-two deaths were attributed to 42 events of H2S exposure. Eighteen percent of these
fatalities occurred in the petroleum and natural gas industries (Hendrickson et al., 2004). Of all
petrochemical and coal production fatalities, 67% were due to sulfur or sulfur compounds

17
(Policastro and Otten, 2007). Frequently, “knockdowns” or “knockbacks” are reported from H2S
exposures. A knockdown is a sudden loss of consciousness brought on by a high concentration
of H2S gas. A knockdown may be followed by death from the toxic effects of H2S and it also
can lead to other fatal accidents. Knockdowns have been cited as the cause of several deaths of
individuals attempting rescue (Hendrickson et al, 2004).
OSHA and NIOSH consider concentrations in excess of 100 ppm to be immediately
dangerous to life and health (IDLH). Although immediate death does not occur at concentrations
of 100 ppm, a loss of the sense of smell does occur within 2 – 15 minutes of being in this
atmosphere (OSHA, 1995). Drowsiness sets in after approximately 15 minutes. These
symptoms may lead an exposed person to believe that he is no longer in danger. Several hours
of exposure to concentrations of 100 ppm may result in death over the following 48 hours.
Few epidemiological studies exist detailing the effects of H2S exposure on workers.
Most information comes from case studies on one individual or on a small number of individuals
that have been acutely exposed to H2S. Exposures to H2S can be divided into three categories:
acute, sub-acute, and chronic. Acute exposures to H2S occur at concentrations of 500 – 1000
ppm (Policastro and Otten, 2007; Hendrickson et al, 2004; Kemper, 1966). These cases require
immediate medical attention. Several case studies examined workers that were exposed to large
amounts of H2S due to accidental releases, pipe leaks and causes of unknown origin (Kemper,
1966; Kilburn et al, 2010; Hirsch et al, 2002). Acute exposures in these studies, as well as
others, have been reported to affect physical and psychological functions. Physical symptoms of
acute exposure include persistent headache, loss of balance, dizziness, fatigue, convulsions,
asphyxia, cardiopulmonary arrest, loss of consciousness and death (Hendrickson et al, 2004;
Nam et al, 2004; Hessel et al, 1997; Policastro and Otten, 2007; Kilburn et al, 2010, Nam et al,

18
2004). Psychological symptoms of acute H2S exposure have been reported to include anxiety,
agitation, mood swings, memory loss, amnesia, and general cognitive impairment (Policastro and
Otten, 2007; Kilburn et al, 2010; Hessel et al, 1997). Exposures to concentrations of 500 – 700
ppm have the potential to lead to a loss of consciousness and possible death within 30 to 60
minutes. Exposures to concentrations of 700 to 1000 ppm can lead to rapid unconsciousness,
rapid cessation of respiration and eventual death (OSHA, 1995). Exposure to concentrations
greater than 1000 ppm will result in immediate unconsciousness and death.
Sub-acute exposures occur at concentrations of 100 – 500 ppm and chronic exposures at
concentrations below 100 ppm (Policastro and Otten, 2007). Sub-acute and chronic exposures
are marked by mucous membrane irritation of the eyes and respiratory tract, headaches, and
dizziness (Policastro and Otten, 2007; Kilburn et al, 2010). Sub-acute and chronic exposures
rarely result in loss of consciousness. It is most likely this reason that sub-acute and chronic
exposures are not as abundantly documented or studied. Hessel et al (1997) conducted a cross-
sectional study of 175 petrochemical workers in Alberta, Canada. This province in Canada is
well-known for having very sour crude oil and, as a result, high amounts of H2S gas, when the
crude oil is refined. Hessel et al.’s study was not conducted due to a catastrophic H2S event. It
was originally identified as a comparison group for an alternate study. Employees answered
survey questions to assess previous exposures and underwent medical evaluation. Eight percent
of those surveyed reported having experienced a knockdown at some point during their career in
petrochemicals. The study discovered that sub-acute and chronic exposures did not permanently
affect the pulmonary function in these workers. Acute exposures, as with those who suffered
from knockdowns, did lead to an increased prevalence of permanent respiratory problems,
including shortness of breath, wheezing and chest tightness (Hessel et al, 1997).

19
The petrochemical industry has made great strides over the last decade in controlling H2S
exposures. Many oil refineries and petrochemical companies now require employees to wear
personal alarm devices that alert the wearer if concentrations exceed a preset amount. The
personal alarm devices alert the wearer to higher concentrations of gas in order to prevent acute
exposures. Area alarm monitors, preset to alarm certain concentrations, are also present in many
refineries. It has been suggested that the majority of H2S in the past might have been prevented
had the workers been wearing or near a similar device (Policastro and Otten, 2007).
Sampling Equipment
All sampling equipment and procedures used in this study were consistent with those
used by MPC.
Industrial Scientific MX4
The Industrial Scientific MX4 iQuad Multi-Gas Monitor was used to sample personal and
area concentrations at all of the loading racks. The MX4 is a direct read, real-time instrument
that utilizes an electrochemical sensor specific to H2S. For this sensor, the atmospheric air enters
the sensor through a porous membrane where the air undergoes an electrochemical reaction. The
gases in the air are oxidized at the sensing electrode and are reduced at the counter electrode.
This reaction causes a change in the electrical output of the sensor and the difference in the
electrical output is proportional to the amount of H2S present in the air. In typical sensors, each
molecule of H2S that is oxidized corresponds to an electrical output of 0.7 micro amps µA. An
H2S concentration of 10 ppm corresponds to 7.0 µA, while a concentration of 100 ppm
corresponds to an electrical output of 70.0 µA (Henderson, 2011). Electrochemical H2S sensors
demonstrate linearity and are therefore reliable to measure concentrations over a range of values.
H2S electrochemical sensors have a typical lifespan of 2 years.

20
The MX4 has a detection range of 0-500 ppm, an accuracy of ± 5% and a resolution of
0.1 ppm. The limit of detection with reliable accuracy is 0.2 ppm, which is 2% of MPC’s 8-hour
TWA exposure limit (10 ppm). The MX4 operates at 0.5 liters per minute and is capable of
continuous data-logging at 10-second intervals. Figure 9 shows the MX4.
Figure 9 – The Industrial Scientific MX4. This piece of equipment was used to measure personal and area concentrations at the sulfur truck loading rack, the asphalt rail car loading rack and the asphalt truck loading rack.
MX4s are the preferred method of H2S sampling at MPC for several reasons. MX4s
allow for instantaneous monitoring of current sulfur levels. They also provide immediate
feedback concerning TWA exposure, STEL exposure and peak exposure. Aside from the MX4,
many other sampling methods exist for H2S. OSHA suggests several methods, including the use
of detector tubes or sampling filters (OSHA Method 1008). H2S detector tubes have a wide

21
range of uncertainty varying from 8% uncertainty, to 25% uncertainty, or unknown. OSHA
Method 1008 utilizes a multi-staged glass fiber and silica gel sampling tube that is connected via
sampling train to a personal sampling pump. Method 1008 has a standard error of 5.1%.
Similarly, NIOSH recommends using a filter and solid sorbent tube with a personal sampling
pump (NIOSH Method 6013). This method has an overall accuracy of ±11.8%. The MX4
accuracy is ±5%. Both the OSHA and NIOSH methods require a bulky sampling train that is
connected to a cumbersome sampling pump. The MX4 eliminates the extra tubing and weight,
as all components are encased in a 4 inch by 2.5 inch piece of equipment that weighs only 6
ounces. And, unlike the OSHA and NIOSH methods, MX4 samples are not required to be sent
to a lab for analysis, which saves time and money.
Calibrations for MX4s are recommended once per calendar month, as per the Industrial
Scientific’s manual. As a general rule, MPC follows all manufacturer guidelines. All MX4s
were calibrated before the commencement of each portion of this study. Prior to each sampling
session, the MX4s were “bump” tested. A bump test is a test of functionality where the
instruments are exposed to a known concentration of gas for verification of sensor and alarm
operation. Pre- and post-calibrations and bump tests were carried out using an Industrial
Scientific MX4 DS2 Docking Station that was equipped with Industrial Scientific calibration
gas. The MX4 DS2 Docking station used had a serial number of 0911178-050. The MX4 DS2
can be seen in Figure 10.

22
Figure 10 – The MX4 DS2 Docking Station.
The calibration gas was manufactured by Industrial Scientific, had a part number of
1810-2187 and had an expiration date of November 2012. Its composition is as follows:
Hydrogen Sulfide 25 ppm
Carbon Monoxide 100 ppm
Pentane 25% LEL (0.35% vol.)
Oxygen 19.0%
Nitrogen Balance

23
Industrial Scientific MX6
The Industrial Scientific MX6 iBrid Multi-Gas Monitor was used to take area
measurements. The MX6 is a direct read instrument that can be equipped with an extending
wand that allows for the detection of gases in normally inaccessible spaces. The extending wand
allows for the measurement of H2S gases inside of the man way holes at the asphalt rail car
loading rack and the asphalt truck loading rack.
The H2S sensor in the MX6 is identical to the one used in the MX4. It has a range of 0 to
500 ppm and detects concentrations in increments of 0.1 ppm. The MX6 operates at 0.5 liters
per minute and has an error rate of up to 20%. Figure 11 shows the MX6.
Figure 11 – The Industrial Scientific MX6. This piece of equipment was used to measure concentrations inside of the man way hole at the asphalt rail car and the asphalt truck loading racks.

24
Because of the MX6’s size, 5.5 inches by 3 inches, and weight, 14.5 ounces, the MX6 is
not used for personal sampling. The MX6 is also equipped with several additional sensors,
which adds to its size. The extending wand, however, makes this instrument ideal for measuring
concentrations in areas that are difficult to access.
The MX6 was calibrated prior to the day’s sampling using Industrial Scientific’s MX6
DS2 Docking Station. The MX6 DS2 Docking station used had a part number of 18106724-
ABC. The calibration gas was manufactured by Industrial Scientific, had a part number of 1810-
2187, which is identical to the gas used for the MX4 DS2. The MX6 DS2 Docking Station can
be seen in Figure 12.
Figure 12 – The MX6 DS2 Docking Station.
25
Information on the calibration dates and instrument placement is listed in Appendix A. A
detailed description of all sampling equipment may be found in Appendix B.
Methods
All sampling conducted for this study was completed using standard sampling procedures
as set by MPC.
Air Sampling at the Sulfur Truck Loading Rack
Personal and area samples were taken for H2S concentrations during the loading of nine
sulfur trucks. One personal and two area samples were taken for each truck to characterize the
potential exposure based on location. The personal samples were obtained by affixing an MX4
to the loader’s collar. Area samples were obtained by placing one MX4 near the man way hole
of the truck, approximately 12 inches west of the source, and another MX4 at the sulfur loading
controls. The latter is where the loader typically removed his supplied air respirator,
approximately 10 feet west of the source. Figure 13 shows the layout of the sulfur truck loading
rack with the two area sampling locations marked.
The MX4s sampled continuously for the duration of the loading, which lasted
approximately 15 to 20 minutes per truck. The investigator recorded the loader’s actions, such
as beginning and finishing loading, and checking the sulfur levels, for comparison with the data-
logged results. In all, nine trucks were monitored for a total of 27 samples (9 personal and 18
area samples). Four operators were included in this study.

26
Figure 13 – Layout of the Sulfur Truck Loading Rack. Area sampling locations are marked with a red “x”. The “x” on the east side of the loading rack is the “Sulfur Controls Area Sample”. The “x” on the west side of the sulfur loading rack is the “Man Way Hole Area Sample”. Worker location varied, but was confined to the area between the red x’s.
Air Sampling at the Asphalt Rail Car Loading Rack
Eight area samples and two personal samples were gathered over three days at the asphalt
rail car loading rack. Personal samples were gathered by affixing one MX4 on the collar of the
asphalt rail car loader. Area samples were obtained by placing an MX4 approximately 6 inches
east of the man way hole. On days that two area samples were collected, one MX4 was placed
on the east side of the man way hole, approximately 6 inches from the source, while the second
MX4 was placed approximately one foot west and one foot higher than the source. The various
locations helped to characterize the atmospheric concentrations of H2S based on location and
proximity to the source.
Source

27
On the first day of asphalt rail car sampling, one personal sample was collected, as were
two area samples: one at 4 Spot and one at 5 Spot. Two area samples at 6 Spot were collected on
the second day. Due to an operator shift-change during sampling time, no personal sample could
be collected on that day. One personal sample and 4 area samples— two at 5 Spot and two at 6
Spot—were collected on the third day. Figure 14 shows the layout of the asphalt rail car loading
rack and the locations of the area samplers.
Figure 14 - Layout of the Asphalt Rail Car Loading Rack. Single area sampling locations are located on the east side of the man way hole and are marked with a red “x”. The second area sampling location is on the west side of the man way hole and is marked with a blue “x”. Worker location varied. Worker was not confined to this area.
The two area samples at 6 Spot were collected on day three to serve as a “worst-case
scenario,” in which the air movers were not engaged for the first hour of loading. One air mover
was turned on after one hour to allow the loader to safely gauge asphalt levels.
The MX4s sampled continuously for the duration of the loading, which lasted between 45
minutes and 2.5 hours. Start and stop times were recorded. In all, ten samples were collected
Source Source Source

28
using the MX4s at the asphalt rail car loading rack: two personal and eight area samples. One
operator was included in this study.
At the asphalt rail car loading rack an MX6 was used to measure H2S concentrations
inside of the man way hole. The MX6’s extending wand was placed into the opening
approximately 6 – 8 inches below the top of the rail car. The instrument remained inside the
man way hole until a steady concentration was displayed for a minimum of 10 seconds. Care
was taken not to submerge the sampler in asphalt. This sample was taken at 5-Spot while
150/200 blend asphalt was loaded.
Air Sampling at the Asphalt Truck Loading Rack
Personal and area air samples were taken to measure for H2S concentrations at the west
station of the asphalt truck loading rack. Sixteen personal and 16 area samples were gathered
over three days. One personal and one area sample were collected for each of sixteen trucks
sampled. The personal sampler was placed on the loader’s collar. The area samplers were
placed as close to the man way hole as possible, which was approximately 6 inches north of the
loading arm.
The MX4s sampled continuously for the 10- to 15-minute duration of the loading. Start
and stop times were recorded for each truck. Figure 15 shows the layout of the asphalt truck
loading rack and the location of the area samplers. One operator was included in this study.

29
Figure 15 - Layout of the Asphalt Truck Loading Rack. The area sampling location is located on the north side of the man way hole and is marked with a red “x”. Worker location varied, but worker was confined to this loading platform during active loading.
Three additional samples were taken at the asphalt truck loading rack. An MX6,
equipped with an extending wand, was used to sample inside of the man way hole during
loading. The tip of the wand was approximately 6 – 8 inches below the top of the truck. The
instrument remained inside of the truck until concentration fluctuations ceased. Three trucks
were sampled in this manner. Two trucks were loaded with 64/22 blend asphalt and one truck
was loaded with 150/200 blend.
Data Transfer
After each sampling day, the MX4s were docked on the DS2 for post-calibrations/bump-
tests and data download. The data were examined using the Docking Station Server Admin
Console (DSSAC), which is complementary software for the DS2.
Source

30
The data were exported to Microsoft Office Excel 2007 from the DSSAC to graph the
logged information. From this information, the highest concentration values were determined by
the investigator and recorded. For the purposes of this study, any value above baseline was
considered a peak. The average concentration for the duration of the sample was calculated and
recorded.
Analysis of Data
The 15-minute computed averages for the sulfur truck loading rack data and the asphalt
truck loading rack data were compared to the STEL for H2S (15 ppm). The asphalt rail car data
were converted to averages based on the duration of the loading activity, which varied between
45 minutes and 2.5 hours. An 8-hour TWA was calculated with the assumption that no further
H2S exposure occurred for the remainder of the shifts. This is likely, as the asphalt rail car
loader does not have any other responsibilities that require him to be near a potential point of
H2S exposure. The 8-hour TWA was compared to the PEL for H2S (10 ppm).
The results of the MX6 sampling were used to determine how high H2S concentrations
could reach at the asphalt rail car and asphalt truck loading racks. These data also helped to
describe the role that location has in the extent of the potential exposure.
Results
Sulfur Truck Loading
Nine trucks were sampled over a three day period at the sulfur truck loading rack. Table
2 shows the highest peaks and calculated 15-minute TWA personal exposure and area sample
concentrations for samples taken near each of the sampled trucks.

31
Table 2 – Air Sampling Results for the Sulfur Loading Rack Survey
Personal Sulfur Control Area Man Way Hole Area
Sampling Day
Sample ID
Highest Value (ppm)
TWA (ppm)
Percent of
STEL
Highest Peak
(ppm) TWA (ppm)
Percent of
STEL
Highest Peak
(ppm) TWA (ppm)
Percent of
STEL
Day 1 Truck 1 0.0 0.0 0.0% 0.6 0.0063 0.0% 0.0 0.0 0.0% Truck 2 0.0 0.0 0.0% 0.6 0.1156 0.8% 0.0 0.0 0.0%
Day 2
Truck 3 0.0 0.0 0.0% 0.0 0.0 0.0% 0.0 0.0 0.0% Truck 4 0.0 0.0 0.0% 0.0 0.0 0.0% 0.7 0.0064 0.0% Truck 5 0.0 0.0 0.0% 0.7 0.0062 0.0% 5.9 0.0713 0.5%
Day 3
Truck 6 0.0 0.0 0.0% 0.0 0.0 0.0% 0.0 0.0 0.0% Truck 7 0.1 0.0009 0.0% 0.0 0.0 0.0% 0.0 0.0 0.0% Truck 8 0.0 0.0 0.0% 0.0 0.0 0.0% 1.4 0.0165 0.1%
Day 4 Truck 9 0.0 0.0 0.0% 0.0 0.0 0.0% 10.4 0.1559 1.0%
The concentrations found from personal sampling at the sulfur truck loading rack were
nearly all below the instrument’s limit of reliable detection (0.2 ppm). The sampled
concentrations at the sulfur control area were slightly higher, with maximum values reaching 0.7
ppm and 15-minute TWAs nearing 0.12 ppm. The man way hole area had the highest recorded
concentrations, with a maximum peak value of 10.4 ppm and a maximum 15-minute TWA of
0.16 ppm. For this group and all others, all recorded values were lower than all MPC and OSHA
occupational exposure limits (OEL) (15 ppm STEL, 20 ppm Ceiling).
Asphalt Rail Car Loading
A total of ten samples were collected over a three-day period at the asphalt rail car
loading rack. Tables 3 through 5 show the highest peaks and the TWAs. TWAs were calculated
based on sampling time. An 8-hour TWA was calculated with the assumption that the operator
would not be further exposed to H2S. The percentage of the 8-hour TWA (10 ppm) that each
exposure represents was also calculated. Samples marked with the letter “a” represent those that
were taken at the sampling point closest to the source (6 inches away). Samples marked with the

32
letter “b” represent those that were taken at the farther sampling point, approximately one foot
from the source.
Table 3 – Sampling Day 1 Air Monitoring Results from the Asphalt Rail Car Loading Rack Survey
Sampling Day 1
Location
Highest Value (ppm)
TWA (ppm)
8-hr TWA* (ppm)
Percent of 8-hr TWA
Sample Time
Personal 0.8 0.006 0.002 0.02% 195 min 4 Spot 6.3 0.54 0.08 0.80% 77 min 5 Spot (a) 2.6 0.48 0.13 1.30% 195 min 5 Spot (b) - - - - - 6 Spot (a) - - - - - 6 Spot (b) - - - - - *8-hr TWA, assuming no further exposure after sampling stopped
Table 4 – Sampling Day 2 Air Monitoring Results from the Asphalt Rail Car Loading Rack Survey
Sampling Day 2
Location
Highest Value (ppm)
TWA (ppm)
8-hr TWA* (ppm)
Percent of 8-hr TWA
Sample Time
Personal - - - - - 4 Spot - - - - - 5 Spot (a) - - - - - 5 Spot (b) - - - - - 6 Spot (a) 10.2 1.26 0.14 1.40% 55 min 6 Spot (b) 1.4 0.06 0.01 0.10% 55 min *8-hr TWA, assuming no further exposure after sampling stopped

33
Table 5 – Sampling Day 3 Air Monitoring Results from the Asphalt Rail Car Loading Rack Survey
Sampling Day 3
Location
Highest Value (ppm)
TWA (ppm)
8-hr TWA* (ppm)
Percent of 8-hr TWA
Sample Time
Personal 2.2 0.003 0.002 0.02% 173 min 4 Spot - - - - - 5 Spot (a) 3.5 0.13 0.05 0.05% 173 min 5 Spot (b) 1.6 0.02 0.01 0.10% 173 min 6 Spot (a)** 24.1 1.83 0.38 3.80% 100 min 6 Spot (b)** 13.4 0.81 0.17 1.70% 100 min *8-hr TWA, assuming no further exposure after sampling stopped **Day 3 – 6 Spot, gathered under contrived conditions
During this survey, the loader was exposed to a peak concentration of 2.2 ppm H2S. The
highest personal TWA was 0.006 ppm. Both personal samples had 8-hour TWAs of 0.002 ppm
H2S. Area samples were slightly higher. Their peaks ranged from 1.4 ppm to 10.2 ppm for all
samples not obtained under the contrived “worst-case” conditions. TWAs at these locations,
under non-contrived conditions, ranged from 0.06 ppm to 1.26 ppm, with the 8-hour TWAs
ranging from 0.01 ppm to 0.13 ppm.
The 6-Spot area samples, obtained on Sampling Day 3, were collected as “worst-case
scenario” samples. The air mover in this location was not engaged for the first half of sampling
(approximately one hour) in order to simulate conditions that might produce very high
concentrations. The H2S concentrations peaked at 24.1 ppm for the sample closer to the source
and 13.4 ppm at the sample slightly farther away. The maximum value of 24.1 ppm occurred
during one 10-second interval. Although this concentration does exceed OSHA’s ceiling value
of 20 ppm, the TWA obtained at that location was considerably lower than 20 ppm, which means
that OSHA would not have grounds to issue a citation for this sample. However, peaks greater

34
than 10 ppm are to be avoided at the refinery per MPC guidelines, so it is important to note that
this sample was collected under non-typical conditions.
Results from the MX6 sampling, showed an H2S concentration of 158 ppm inside of the
man way hole.
Asphalt Truck Loading
Sixteen asphalt trucks were sampled over a three-day period. Table 6 shows the highest
personal and area peaks recorded for each truck, as well as a calculated 15-minute TWA and the
percentage of the STEL (15 ppm) that each TWA represents.
Table 6 – Air Monitoring Results for the Asphalt Truck Loading Survey
Personal Area
Sampling Day
Sample ID
Highest Peak (ppm)
TWA (ppm)
Percent of STEL
Highest Peak (ppm)
TWA (ppm)
Percent of STEL
Day 1
Truck 1 0 0 0.0% 2.7 0.05 0.3% Truck 2 0.1 0.0013 0.0% 3.7 0.06 0.4% Truck 3 0 0 0.0% 6.5 0.37 2.5% Truck 4 0 0 0.0% 22.6 0.92 6.1% Truck 5 0 0 0.0% 10.0 0.39 2.6% Truck 6 0.2 0.0026 0.0% 1.2 0.06 0.4%
Day 2
Truck 7 0 0 0.0% 8.2 0.41 2.7% Truck 8 0 0 0.0% 9.7 0.20 1.3% Truck 9 0.1 0.0011 0.0% 6.7 0.18 1.2% Truck 10 0 0 0.0% 78.4 13.75 91.7% Truck 11 0 0 0.0% 5.4 0.22 1.5% Truck 12 0 0 0.0% 0.8 0.02 0.1%
Day 3
Truck 13 0.8 0.0297 0.2% 6.1 0.13 0.9% Truck 14 0.4 0.0139 0.1% 0 0 0.0% Truck 15 0.5 0.0612 0.4% 0 0 0.0% Truck 16 0.3 0.0177 0.1% 3.3 0.16 1.1%
The personal sampling results showed low concentrations of H2S, most with maximum
peaks below the instrument’s limit of reliable detection. Of the 16 personal samples, one sample
35
met this limit (0.2 ppm) and four samples surpassed it. Detectable concentrations ranged from
0.2 ppm to 0.8 ppm and detectable 15-minute TWAs ranged from 0.001 ppm to 0.16 ppm.
Higher concentrations were recorded for the area sampling, with two samples in the non-
detectable range. Detectable area concentrations ranged from 0.8 ppm to 78.4 ppm. Two peak
values exceeded OSHA’s ceiling limit (20 ppm), while one value exceeded OSHA’s peak value
(50 ppm). The sample taken near asphalt truck 4 had a value of 22.4 ppm which is greater than
the 20 ppm ceiling; however, because the TWA is so much lower than this value, this area
sample would not be considered to be in violation of the standards. Asphalt truck 10 exceeded
both the ceiling and peak limits with a maximum concentration of 78.4 ppm. Peak
concentrations above 20 ppm but less than 50 ppm are allowed, provided that additional
exposures are minimal. Because operators have the potential to be in this area, a peak value this
high is not tolerable. Had the loader been in this area, he would have been in violation of MPC
and OSHA standards.
Detectable 15-minute area TWAs ranged from 0.02 ppm to 13.75 ppm. No area TWAs
exceeded the OSHA STEL of 15 ppm.
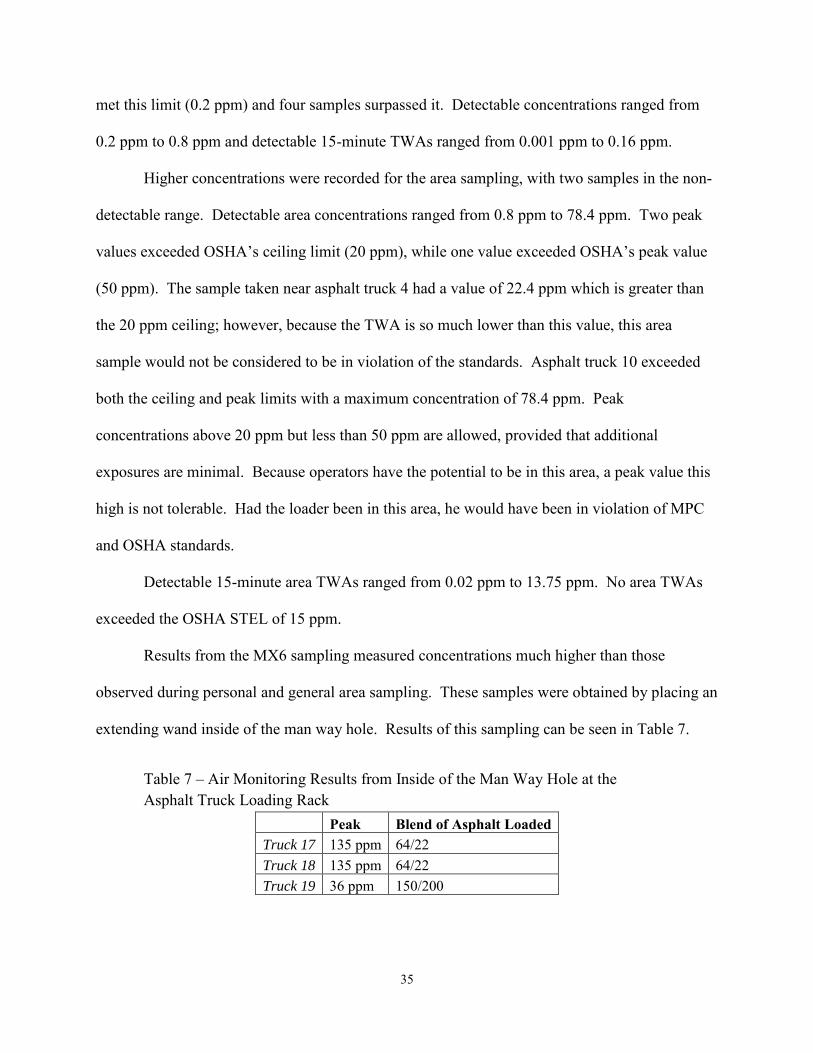
Results from the MX6 sampling measured concentrations much higher than those
observed during personal and general area sampling. These samples were obtained by placing an
extending wand inside of the man way hole. Results of this sampling can be seen in Table 7.
Table 7 – Air Monitoring Results from Inside of the Man Way Hole at the Asphalt Truck Loading Rack
Peak Blend of Asphalt Loaded Truck 17 135 ppm 64/22 Truck 18 135 ppm 64/22 Truck 19 36 ppm 150/200

36
Discussion
Sulfur Truck Loading Rack
It is evident that inconsistencies exist between sample locations and sampling days. H2S
is denser than air, making it less likely to quickly diffuse into the surrounding air and more likely
to remain closer to its origination point. Because of this, the man way hole area was expected to
have the highest concentrations of H2S, followed by the personal samples, with the sulfur control
area having the lowest concentrations.
Sulfur Trucks 1 and 2, which were the only trucks sampled on Day 1, recorded
measureable 15-minute TWAs and maximum peak concentrations only at the sulfur control area
sampling location. Concentrations were non-detectable for the personal sampling and for the
man way hole area sampling. Figure 16 shows the graphed results for Sulfur Trucks 1 and 2.
Figure 16 – Graph of H2S Concentrations at the Sulfur Controls Area.
0
0.2
0.4
0.6
0.8
1
Sulfur Truck 2
0
0.2
0.4
0.6
0.8
1
Co
nce
ntr
atio
n (
pp
m)
Start of Loading End of Loading
H2S Concentrations for the Sulfur Controls Area
Sulfur Truck 1

37
The results for sulfur trucks 1 and 2 may be attributed to the nearby sulfur storage pit
located approximately 20 feet west-southwest. In the storage pit, elemental sulfur is stored at
temperatures above 250° F to ensure that it remains in liquid form. The sulfur storage pit, which
was not sampled in this study, has been reported by MPC employees to have concentrations as
high as 100 ppm. The storage pit is believed to be the source of H2S gas responsible for
exposures in this area of the refinery. On the night the samples were taken, the wind had been
blowing in a general eastward direction. Furthermore, this was the first night that sulfur had
been removed from the storage site for a number of days, meaning that the levels inside of the
sulfur pit were at their highest during the duration of this survey. It is possible that the sampler
at the sulfur control area detected the H2S gas emitted from the elemental sulfur storage pit and
not the sulfur truck loading. This would account for the erratic concentration values seen in
Figure 16.
Sulfur Trucks 4, 5, 8, and 9 appeared to follow a more predictable trend. When these
trucks were sampled on days 2 through 4, man way hole area concentrations spiked at the times
that the sulfur truck loader either inserted or removed the sulfur loading arm and/or the exhaust
eductor hose. This trend can be seen in Figure 17. The maximum H2S peaks for these trucks
ranged from 0.7 ppm to 10.4 ppm. No measureable personal concentrations of H2S were
recorded for any of these trucks, despite the fact that the loader’s breathing zone was probably
directly above the man way hole. Sulfur Trucks 4, 5, and 9 showed spikes in concentrations near
the end of loading, which corresponds to the times during which the loader would have removed
the loading arm or eductor hose. Sampling near sulfur trucks 8 and 9 both showed high peaks
near the start of loading. These peaks may be attributed to any number of causes, including

38
environmental conditions (wind or atmospheric pressure), residual sulfur gases from the truck, or
worker habits (ventilation placement or timing).
Figure 17 – Graph of H2S Concentrations for the Man Way Hole Area. Highest recorded values are seen at the beginning and ending of loading for trucks 4, 5, 8, and 9.
Again, no measureable concentrations were recorded for personal sampling, possibly due
to its high density. The H2S gas remained at its original elevation. The man way hole samples
were at the same height as the source. The personal samples were taken approximately 5.5 feet
higher than the man way hole samples, while the sulfur control area samples were taken
approximately 4 feet higher than the man way hole samples. Aside from Sulfur Trucks 1 and 2,
the sulfur control area samples showed only one other instance of measureable concentrations, a
peak of 0.7 ppm that occurred during the loading of Sulfur Truck 5.
0
2
4
6
8
10
12
Sulfur Truck 5
0
2
4
6
8
10
12
Sulfur Truck 8
0
2
4
6
8
10
12
Sulfur Truck 9
0
2
4
6
8
10
12
Co
nce
ntr
atio
n (
pp
m)
Start of Loading End of Loading
H2S Concentrations for the Man Way Hole Area
Sulfur Truck 4

39
Sulfur Trucks 3 and 6 had non-detectable results for all personal, sulfur control area, and
man way hole area sampling. Sulfur truck 7 had a slight peak of approximately 0.1 ppm for the
personal sample, but no measureable concentrations for either area sample. This peak may be an
instrument error, as the concentrations were below the instrument’s limit of reliable detection.
Neither the sulfur control nor the man way hole area samples recorded any measureable
concentrations.
Graphs of all data obtained from the sulfur truck loading rack survey can be found in
Appendix C. Samples were graphed based on truck number.
Asphalt Rail Car Loading Rack
The average 8-hour adjusted area TWA for the asphalt rail car loading rack was 0.12 ±
0.12 ppm, with a geometric mean of 0.068 ppm and a geometric standard deviation of 3.75.
Values were log transformed using the formula ln(x). The high variability may be attributed to
the inclusion both the closer and farther sampling locations in this calculation. If the areas are
calculated separately, the geometric mean is 0.12 ppm with a geometric standard deviation of 2.1
for the samples obtained at the closer sampling location. For the samples obtained from the
farther sampling location, the geometric mean was calculated to be 0.03 ppm with a geometric
standard deviation of 5.13. The farther sampling location had a larger variability due to the
inclusion of the samples that were collected with no ventilation.
Concentrations at the asphalt rail car loading rack were higher than those at the sulfur
truck loading rack. This is most likely due to the fact that the asphalt rail car loading rack has no
exhaust hose to draw air away from the area, relying on air movers, instead. Air movers only
push air across the man way hole opening. Eddy currents, wind speed and direction, or blocking

40
the air mover can all lead to H2S being trapped in and around the man way hole, resulting in
higher H2S concentrations.
When reviewing the paired samples taken at Day 2’s 5-Spot and Day 3’s 5-Spot and 6-
Spot, it appears that H2S concentrations declined dramatically with distance from the source.
Figure 18 shows the graphical representation of the data collected by the two area samplers at 6-
Spot on sampling day three, which served as the “worst-case scenario” sample. This graph
illustrates two important aspects concerning this day’s sampling results. First, there is a marked
difference in the levels of H2S gathered by these samples, especially during the first hour of
sampling. The blue line in Figure 18 represents the concentrations obtained by the sampler that
was approximately 6 inches from the source. The red line represents the concentrations obtained
from the sampler that was approximately one foot west of the source. At times, the closer
sampler recorded concentrations 20 ppm higher than the farther sampler. Secondly, this graph
demonstrates the disparity in concentrations between the sampling done without ventilation and
with ventilation. The red dotted lines indicate the time at which no ventilation was engaged at
this location. At 9:25 AM the air mover was shut off and at 10:10 AM the air mover at 6-Spot was
turned back on. Beginning at approximately 10:15 AM, the H2S concentrations declined
drastically from levels above 20 ppm to levels below 2 ppm. This indicates the air mover
effectively reduced H2S concentrations to levels below occupation exposure limit standards.

41
Figure 18 – H2S Concentrations at 6-Spot on Sampling Day 3 at the Asphalt Rail Car Loading Rack.
More graphs of the asphalt rail car loading rack data are shown in Appendix D, where the
relationship between location and concentration can be seen further.
Results from the MX6 sampling at the asphalt rail car loading rack showed an H2S
concentration of 158 ppm inside of the man way hole. This measurement was over 6 times the
concentration of the highest recorded MX4area reading at the asphalt rail car loading rack.
There are several reasons why the levels may have been so much higher. First, the location of
the MX6 was closer to the source than the MX4 area samplers and much closer than the personal
sampler. It has already been demonstrated by the previously discussed area samples that
proximity strongly affects the area concentrations of H2S. Secondly, it is possible that due to its
high density, H2S remains inside of the rail car, unable to rise and disperse in the surrounding air.
This may cause a pocket of H2S to accumulate around the source, just below the opening of the
man way hole. Thirdly, the air movers could not blow area into the man way hole.
0
5
10
15
20
25
30
9:0
8
9:1
5
9:2
3
9:3
0
9:3
8
9:4
5
9:5
3
10
:00
10
:08
10
:15
10
:23
10
:30
10
:38
10
:45
Co
nce
ntr
atio
n (
pp
m)
Time of Day
Day 3 H2S Concentrations: 6-Spot*
6-Spot (closer) Area Concentrations
6-Spot (farther) Area Concentrations
No Ventilation
*Samples gathered under contrived “worst-case scenario” conditions

42
This sample was taken during the loading of the 150/200 blend asphalt, which is
considered to have a lower potential concentration of H2S than the 64/22 blend that is also loaded
at the asphalt rail car loading rack. Although no sample was taken for the 64/22 blend, it is
likely that for this blend, H2S concentrations are even higher inside of the man way hole.
It is important to note that while concentrations have the potential to reach IDLH levels
inside of the man way hole, this area is not readily accessible to workers and should therefore not
be considered in violation of OSHA standards. All personal exposures obtained in this survey
were well below MPC and OSHA OELs. All area samples obtained in this survey should also be
considered to be in compliance with OELs.
Asphalt Truck Loading Rack
Detectable 15-minute area TWAs ranged from 0.02 ppm to 13.75 ppm, with an area
geometric mean of 1.39 ppm and a geometric standard deviation of 1.91. Data were log-
transformed using the formula ln(x+1), due to the presence of zero values. The sample taken
during the loading of asphalt Truck 10 is considered to be an extreme outlier (13.75 ppm TWA),
but has been included in the statistical calculations.
Statistical calculations were performed on the TWA area data to predict future exposure
levels at the asphalt truck loading rack. This study was calculated to have a 99.87% probability
that a future TWA measurement will be below the OSHA PEL of 10 ppm. An upper tolerance
limit (95%, 95%) was also estimated to be 7.22 ppm, which suggests with 95% confidence that
95% of the TWAs obtained from this area will be below 7.22 ppm. The probability of future
overexposures at the asphalt truck loading rack is statistically unlikely, although as demonstrated
by the area sample from asphalt truck 10, the possibility remains.

43
Statistical calculations were also performed on area peak data. All data- logged values
(concentrations taken at 10-second intervals) were included in the calculations and were log-
transformed using the formula ln(x+1). This data had a geometric mean calculated to be 1.21
ppm, and a geometric standard deviation of 1.95. An exceedance fraction was calculated to
determine the probability of obtaining a concentration above the OSHA ceiling limit of 20 ppm
and the peak limit of 50 ppm. The probability that a future exposure measurement from the
asphalt truck loading rack would exceed either of these OELs is less than 0.1%. However, from
a sample size of 1383, as with this study, this translates to approximately two values above the
ceiling.
The area maximum peak concentrations varied considerably, but concentrations typically
followed one of three patterns. Area sampling showed that concentrations near the man way
hole spiked at the start of loading, at the end of loading, or both. These peaks correspond with a
visual observation of gases and vapors escaping from the man way hole immediately after the
start of loading and when the loading arm/ventilation plate was lifted. This gas and vapor cloud
lasted between 30 and 60 seconds before dissipating.
Samples from asphalt trucks 1 and 2 show the first pattern and can be seen in Figure 19.
These trucks had concentrations that peaked at the beginning of sampling. The sample from
asphalt truck 1 had a peak concentration of 2.7 ppm, while the sample from asphalt truck 2 had a
peak concentration of 3.7 ppm. The maximum values for these trucks occurred approximately
30 seconds into loading. These peaks correspond to the time that the asphalt first entered the
truck. This action most likely agitated any residual H2S gases and pushed them out of the truck.
This, coupled with the H2S gas from the asphalt, caused higher concentrations at the beginning
of loading.

44
Figure 19 – Graph of Asphalt Trucks 1 and 2 show peaks at the beginning of
area sampling data.
Samples from asphalt trucks 12 and 13 demonstrate the second pattern: lone peaks
towards the end of loading. The sample from asphalt truck 12 had a maximum concentration of
0.8 ppm and the sample from asphalt truck 13 had a maximum value of 6.1 ppm. The data from
these trucks can be seen in Figure 20. Once automated loading finished, the asphalt truck loader
removed the loading arm and ventilation plate from the man way hole and excess asphalt dripped
off of the loading arm. During this time, a cloud of gases and vapors could be seen rising from
the man way hole, contributing to the increased concentrations of H2S found at the end of
loading.
0
0.5
1
1.5
2
2.5
3
3.5
4
Asphalt Truck 2
0
0.5
1
1.5
2
2.5
3
3.5
4
Co
nce
ntr
atio
n (
pp
m)
Start of Loading End of Loading
H2S Area Concentrations
Asphalt Truck 1

45
Figure 20 – Area concentrations from Asphalt Trucks 12 and 13 show peak
concentrations at the end of loading.
Area sampling of asphalt trucks 3 through 9, and 11 showed both high starting and high
ending peaks. The samples from asphalt trucks 6, 8, and 9 had higher peak concentrations near
the start of loading, while asphalt trucks 3, 4, 5, 7, and 11 had higher peaks towards the end of
loading. The causes of these peaks are the same as mentioned previously. In some instances the
difference between the peak values was great, while in other instances they were quite similar.
Figures 21 and 22 show these trends.
0
1
2
3
4
5
6
7
Co
nce
ntr
atio
n (
pp
m)
Start of Loading End of Loading
H2S Area Concentrations
Asphalt Truck 13
0
1
2
3
4
5
6
7
Asphalt Truck 12

46
Figure 21 - Area concentrations from Asphalt Trucks 6, 8, and 9 show peak
concentrations at the beginning and end of loading.
Figure 22 - Area concentrations from Asphalt Trucks 3, 4, 5, 7, 11, and 16
show peak concentrations at the beginning and ending of loading.
0
1
2
3
4
5
6
7
8
9
10
Asphalt Truck 8
0
1
2
3
4
5
6
7
8
9
10
Co
nce
ntr
atio
n (
pp
m)
Start of Loading End of Loading
H2S Area Concentrations
Asphalt Truck 9
0
1
2
3
4
5
6
7
8
9
10
Asphalt Truck 6
0
5
10
15
20
25
Co
nce
ntr
atio
n (
pp
m)
Start of Loading End of Loading
H2S Area Concentrations
Asphalt Truck 3
0
5
10
15
20
25
Asphalt Truck 4
0
5
10
15
20
25
Asphalt Truck 5
0
5
10
15
20
25
Asphalt Truck 7
0
5
10
15
20
25
Asphalt Truck 11
0
5
10
15
20
25
Asphalt Truck 16

47
Some trucks did not follow any of these three trends. Area sampling for trucks 14 and 15
detected no measureable amount of H2S, while personal sampling for these trucks detected a
small amount. Personal sampling concentrations were the highest for asphalt trucks 13 through
16. All four of these trucks were sampled on a day three.
Area sampling for truck 10 showed the highest concentrations of all survey sampling.
H2S concentrations were regularly over 20 ppm with a maximum peak of 78.4 ppm. It was
noted during sampling that this truck, in particular, had a very poor seal between the man way
hole and the ventilation plate. Approximately 6 inches of open space remained between the
ventilation plate and the edge of the man way hole, allowing vapors and gases to pour out during
filling. With the sampler only 6 inches away from the source, it recorded consistently high
concentrations, as can be seen in Figure 23. Personal sampling showed that the high
concentrations of H2S near the truck did not reach the asphalt loader.
Figure 23 – Personal and area sampling results for Asphalt Truck 10.
0
10
20
30
40
50
60
70
80
90
10
:16
10
:18
10
:19
10
:20
10
:21
10
:22
10
:23
10
:25
10
:26
10
:27
10
:28
10
:29
10
:30
Co
nce
ntr
atio
n (
pp
m)
Time of Day
H2S Concentrations for Asphalt Truck 10
Area Concentrations
Personal Concentrations

48
Graphs of all data obtained in the asphalt truck loading rack survey can be found in
Appendix E.
MX6 samples were obtained during the loading of both blends of asphalt. Asphalt trucks
17 and 18 were both being loaded with the 64/22 blend of asphalt, which contains more sulfur
and than the 150/200 blend. Truck 19 was loaded with the 150/200 blend. As expected, samples
from trucks 17 and 18 measured higher concentrations of H2S than the sample obtained during
the loading of truck 19. Although the ventilation system was operational during the MX6
sampling for trucks 17 and 18, the concentrations of H2S were still very high for these trucks.
Concentrations of 135 ppm were measured for both trucks 17 and 18, while a concentration of 36
ppm was measured for asphalt truck 19. If these samples are representative of the greatest
possible potential exposure to H2S in the asphalt truck rack, then it can be said that individuals in
the asphalt truck rack have the potential to be exposed to 135 ppm of H2S.
Asphalt Blends
Because the 150/200 blend of asphalt contains 33% roofing flux and 67% 64/22 blend, it
may be expected that the concentration of H2S in the 150/200 blend would be 67% of the
concentration of the 64/22 blend, but this was not the case. The concentration measured during
truck 19 was only 27% of the concentration measured during trucks 17 and 18.
Comparing the H2S concentrations obtained during the loading of 150/200 asphalt at the
asphalt rail car loading rack and the asphalt truck rack, there is a significant difference in the
concentrations of H2S measured. Concentrations at the asphalt rail car loading rack reached 158
ppm while the concentration of H2S in the same asphalt blend reached only reached 36 ppm at
the asphalt truck loading rack. There are several possible reasons for this disparity. While all
attempts were made to insert the wand to the same depth, there may have been inconsistencies in

49
sampling location. More likely, however, is the difference that the ventilation system has on H2S
gas. The asphalt truck loading rack is equipped with an exhaust eductor hose that draws air away
from the man way hole at a volume of 1270 cfm, while the air mover pushed air across the
asphalt rail car at a significantly lower rate. Not only is the eductor moving air at a much higher
volume, it is actually removing the air from the area, instead of pushing it across. The eductor
hose is also made to lie directly above the man way hole, which increases the likelihood that the
gases from inside the truck will be removed from the area.
While concentrations have the potential to reach IDLH levels inside of the man way hole,
this area is not readily accessible to workers and should therefore not be considered in violation
of OSHA standards. All personal exposures obtained in this survey were below MPC and OSHA
OELs. All area samples obtained in this survey, with the exception of the extreme outlier of
asphalt truck 10 (78.4 ppm peak) should also be considered to be in compliance with MPC
standards.
Compliance with OELs
TWAs for both personal and area sampling were below OSHA and MPC exposure limits.
All personal and all but one of the area samples were found to be below the supposedly
“unattainably low” AGGIH TLV of 1.0 ppm and STEL of 5.0 ppm. The one sample found to be
above these more restrictive limits was obtained during the loading of asphalt truck 10 and was
due to atypical truck positioning and poor ventilation. MPC should strive to be consistently
below ACGIH guidelines. While OSHA limits are law, MPC is still held liable to follow the
recognized safety limits of ACGIH.
Based on these results, for loading procedures at MPC, TWA personal exposures were
very low, indicating that they should not be the primary concern. However, peak concentrations

50
at specific locations should remain a concern. Some peak area concentrations at the loading
stations were measured at levels above the OSHA ceiling limit (20 ppm), and OSHA’s and
MPC’s peak limit (50 ppm) for personal exposure samples. Although the TWAs were low, the
possibility still exists for workers to become exposed to an unnecessary amount of H2S by way
of instantaneous peaks. Anecdotal evidence indicated that the elemental sulfur storage pit had
the potential to measure concentrations nearing 100 ppm. Air monitoring inside of an asphalt
rail revealed the potential for H2S concentrations to reach over 150 ppm, and air monitoring
inside of an asphalt truck showed the potential for concentrations to reach over 130 ppm.
Because the areas of highest concentration are not inaccessible to workers, it is not out of the
realm of possibility that these workers have the potential to be exposed to IDLH atmospheres in
their respective loading zones.
Respiratory Protection
While area sampling at all locations revealed at least one peak concentration above
MPC’s 10 ppm threshold that requires the use of supplied air, personal sampling measured no
concentrations above 2.2 ppm. Even with the error rate of 5%, the measured concentration
would not exceed 2.5 ppm. At present, supplied air respirators are only required to be worn at
the sulfur truck loading rack. This survey indicates that it is not necessary for the sulfur loader to
be in supplied air, provided that the eductor is in working condition.
The supplied air respirators in use by the sulfur truck loaders at MPC are not SCBA. The
loader’s full face masks are fed fresh air via an air hose connected to a 12-PAK of Grade D
supplied air. The air hose connected to the face mask provides limited mobility and may hinder
escape in situations of refinery emergency. The face mask may also inhibit visibility, which
plays a crucial role in sulfur truck loading.

51
The elimination of the supplied air respirators would also eliminate the need for extra
employees at the sulfur truck loading rack. If supplied air is not needed, a back-up and bottle-
watch would also not be needed. The removal of this requirement would increase efficiency in
the surrounding units whose operators were absent from them for prolonged periods of time.
If the requirement for supplied air respirators is eliminated, operators should be equipped
with emergency egress respirators with a minimum of 5 minutes of Grade D. Devices may be
worn on their person, but not donned, unless in case of emergency. It may be also prudent to
install a fixed H2S monitor near the sulfur loading rack, so that operators are aware of any rising
H2S concentrations. Fixed H2S monitors may also be considered at the other loading racks.
Many fixed monitors are already in use throughout the refinery and one could be easily installed
at each location.
Controlling H2S Exposures
Ventilation systems are the major source of mitigation for H2S exposures. Preferably, all
loading stations would have a ventilation system similar to the one used at the asphalt truck
loading rack. However, this may not be feasible due to the limitations of the sulfur truck and
asphalt rail car loading procedures. If manual gauging could be engineered out and replaced
with automatic monitoring of levels, not only would the necessity of close proximity to the
source be eliminated, but automation would also allow for a ventilation design similar to the one
in use at the asphalt truck loading rack. This would be most beneficial at the asphalt rail car
loading rack, where the least effective ventilation system is in use.
If alterations cannot be made to any ventilation system, a modification of worker habits
may increase effectiveness of each loading rack’s system. At the sulfur truck loading rack, it is
imperative that moving the exhaust eductor hose to the man way hole is the first action, before

52
the man way hole is opened. Immediately after opening, the eductor hose must be placed into
the man way hole. Once loading is finished and the sulfur loading arm is removed, the exhaust
ventilation hose must be lifted only as far out of the man way hole as is necessary to shut the lid.
Currently, the hose is removed and placed back in its original position before the man way lid is
closed. If the eductor remains near the opening, it has the opportunity to remove any residual
hazardous gases that may remain once the lid is closed. This will prevent exposure from
lingering gases while the employee is securing the lid.
A relocation of the air movers at the asphalt rail car loading rack may also be considered.
Currently, all air movers are located on the west side of the safety racks. Each loader was
consistently observed standing in front of the air movers each time he gauged the asphalt levels
inside the rail car. This habitual action occurs because the west side of the rack is more easily
accessible due to the loading arm and a more restrictive safety rail being on the east side, and
because the gauging lines are typically located on the east side inside of the rail car, which
necessitates standing on the west. With the air mover directly behind the operator, not only is
the air flow blocked, but contaminated air from the rail car can create a wake zone, which traps
contaminants in the loader’s breathing zone, increasing exposure. If the air movers were
relocated to the east side of the safety rack, the air would cross the loader at a 90° angle allowing
the air to move directly across the man way hole, taking any H2S with it.
For the ventilation system to work at maximum efficiency at the asphalt truck loading
rack, the ventilation plate must properly be aligned with the man way hole. While there is
flexibility of the loading/ventilation arm positioning, if the truck is outside of this optimal zone, a
gap will exist between the ventilation plate and the man way hole and allow gases to escape. It is
recommended that the time is taken to reposition any truck that is located outside of this optimal

53
zone. A tight fit over the man way hole will ensure that any H2S gas will be drawn into the
eductor hose and taken away from the loading station. If a tight fit cannot be made between the
ventilation plate and the truck, the air mover should be used to eliminate stagnant concentrations
surrounding the man way hole. Furthermore, it may be beneficial to engage the air mover for the
entirety of the loading process. As mentioned previously, there is typically a peak of H2S gas
immediately after the start and immediately after the end of loading. Engaging the air movers at
these times may induce greater mixing and dispersion of the H2S, reducing the risk of exposure
for the loader.
Proper maintenance is paramount to fully operational ventilation systems. Currently,
maintenance is only performed on the loading rack ventilation systems on an “as needed” basis,
that is, once a concern arises. Problems with the ventilation are detected either by personal
monitor alarms or by an intense odor. Questioning of the employees revealed a lack of routine
inspection of the ventilation systems. Ventilation systems are assumed to be in a fully
operational state. In addition to the lack of inspection, the air flow of the ventilation systems are
examined only once per year, if that often. Therefore, it is possible that operators believe that the
ventilation systems are working optimally, the effectiveness has actually diminished.
Lighting may also affect H2S exposures at the sulfur truck loading rack. Low lighting
may cause operators to linger over the man way hole during visual gauging. Illumination
surveys at MPC are only conducted at the request of operators, oftentimes with many years
between surveys at certain locations. The American Petroleum Institute, an organization specific
to the oil and gas industry, sets guidelines for illumination requirements at locations inside of oil
refineries. Due to the open piping and exposed products, the sulfur truck loading rack is required
to have, at the minimum, 25 foot-candles (fc) of luminance. During the sulfur truck loading rack

54
survey, illumination levels were recorded to be over 40 fc, which surpassed the minimum
requirement. Illumination levels should be assessed frequently to ensure that these levels do not
drop below the requisite levels.
Incident Prevention
The greatest risk of exposure is not associated with standard operating procedures, but
with accidents and other uncommon events. Spills and accidental releases can be a major source
of exposure in a refinery. While incidents are uncommon, an accidental overflow of a nearby
truck was observed during this study. The third-party truck driver mistyped the desired amount
of product into the automated loading station’s computer, which caused the overflow. This truck
was not part of the survey and the truck was not carrying a product that had the potential for
hazardous materials exposure. However, it did serve as a reminder that incidents can and do
occur.
A similar overflow incident may not be likely at the sulfur truck loading rack or the
asphalt rail car loading rack due to the requirement that the loader stay near the receiving vehicle
for visual gauging of the product, but it has the potential to occur at the asphalt truck loading
rack. Third-party truck drivers are responsible for relaying the desired amount of product to the
asphalt truck loader. If the driver has the wrong amount or the loader mistypes the numbers, an
overflow may occur. Each truck has a maximum capacity, measured in gallons that the truck
cannot exceed. A safeguard should be implemented to ensure that trucks are not loaded past
capacity. A barcode or identification number assigned to each specific vehicle could have the
maximum capacity embedded in it. If the loader were required to scan this number into the
computer, the computer could limit the number of gallons loaded so that it does not exceed

55
capacity. Because trucks are owned by third-party companies, this design may not be
immediately feasible.
Similarly, sensors may be placed on the loading arm of each station. While overflows
due to computer mistakes are not possible at all of the loading racks, overflows may occur due to
inattention. Sensors can be connected to an alarm system at the sulfur truck loading rack and the
asphalt rail car loading rack to alert the loader that levels are rising past average truck capacity.
At the asphalt truck loading rack, a sensor could be wired into the computer system that could
automatically cease loading.
Spills at any of these locations could have the potential to release high concentrations of
H2S. Incidents are typically the instances where acute exposures occur. High enough
concentrations can lead to knockdowns, loss of consciousness and death. Incident prevention
through positive, proactive measures and appropriate training of personnel can reduce the risk of
IDLH atmospheres.
Personal Air Monitoring
It is important that workers are monitored for H2S concentrations constantly, during
normal operations and during times of emergency. IDLH concentrations have the potential to
prompt knockdowns and cause unconsciousness. Because of the olfactory desensitization, it is
possible for individuals to be unaware that they are surrounded by high concentrations of H2S.
MPC and other refineries have adopted practices that allow for this monitoring. As mentioned
earlier, all employees inside of the refinery boundaries must wear a personal alarm monitor
within 10 inches of their breathing zone, unless they are wearing a supplied air respirator. This
device monitors the concentrations of H2S in the air and alerts the wearer if concentrations
exceed 10 ppm. Once concentrations exceed 10 ppm, an alarm sounds; a separate, more intense

56
alarm sounds at 15 ppm. If an employee’s personal alarm monitor alarms, the incident must be
reported and investigated to determine cause.
Ideally, all alarm instances would be reported. However, each month numerous
unreported events are found during device calibrations or bump-tests. Alarm events go
unreported for two reasons: (1) the employee is hesitant to initially report the alarm and forgets
about it, or (2) the employee is unaware that his alarm activated. Most unreported cases fall
under the second reason. The personal alarm monitors do not have latching alarms – that is, they
alarm for a given period of time and stop. Oftentimes, the noise level in the refinery is so great
that the 95 decibel alarm goes undetected. The device also signals high concentrations with a
flashing red light, but this proves ineffective when the employee is wearing his monitor on his
hardhat or on his collar and is unable to see the light.
MPC may consider either purchasing new personal devices that have a latching alarm,
which ensures that the wearer is eventually made aware that an alarm-generating event has
occurred, or MPC may consider changing their policy about where on the person these personal
alarm devices may be worn. It is imperative that employees know when they are being exposed
to concentrations that are higher than expected in order to recognize the task or circumstances
that caused the exposure.
Conclusions
Personal sampling of the sulfur truck loading rack, the asphalt rail car loading rack and
the asphalt truck loading rack showed no overexposures of MPC personnel during the duration of
this survey. All personal sampling showed concentrations below all OSHA, ACGIH and MPC
guidelines.
57
Area concentrations were slightly higher but did not exceed MPC guidelines (10 ppm 8-
hour TWA, 15 ppm 15-minute STEL). At times area concentrations very close to the source
exceeded OSHA Ceiling (20 ppm) and Peak (50 ppm) values, demonstrating the potential for
overexposure of loading operators.
Recommendations
Ventilation
(1) Air movers at the asphalt rail car loading rack should be relocated to the eastern side
of the safety rack.
(2) A daily visual inspection of the exhaust eductor hoses should be conducted for any
signs deterioration or accumulation of residue inside.
(3) Air flow at each loading station should be measured once per quarter, at a minimum,
to ensure that no obstruction of air flow is present. Preventative maintenance, i.e.,
cleaning the ventilation systems, particularly the eductor hoses should occur at
regular intervals.
Illumination
(1) Illumination surveys should be regularly conducted at the sulfur truck loading rack to
ensure proper lighting levels.
Respiratory Protection
(1) Operators at these loading racks should not be required to wear supplied air
respirators.
(2) Operators should carry a respirator equipped with a minimum of 5-minutes of Grade
D breathing air for escape purposes.
(3) SCBAs should be nearby in case of emergency.

58
Air Monitoring
(1) MPC should conduct subsequent air monitoring surveys. Air monitoring at each of
these locations is suggested at least once per season to determine what effect, if any,
seasonal changes have on the results.
(2) Air monitoring should also be conducted if any process changes occur that may affect
the amounts of H2S released into the air.

59
References
ACGIH. (2010). “Hydrogen Sulfide: TLV Chemical Substances 7th Edition Documentation.” Cincinnati, OH.
Henderson R. “New TLV exposure limit: Measuring hydrogen sulfide.” [Online].
http://www.ishn.com/articles/91070-new-tlv-exposure-limit-measuring-hydrogen-sulfide – Available at; Accessed March 15.
Hendrickson RG, Chang A, Hamilton RJ. (2004). “Co-Worker Fatalities from Hydrogen
Sulfide.” American Journal of Industrial Medicine 45(4): 346-350. Hessel PA, Herbert FA, Melenka LS, Yoshida K, Mahashiro N. (1997). “Lung Health in
Relation to Hydrogen Sulfide Exposure in Oil and Gas Workers in Alberta, Canada.” American Journal of Industrial Medicine 31(5): 554-557.
Hirsch AR. (2002). “Hydrogen sulfide exposure without loss of consciousness: chronic effects in
four cases.” Toxicology and Industrial Health 18(2): 51-61. Industrial Scientific. (2009). “MX4 iQuad Multi-Gas Monitor Operation Guide.” [Online].
http://www.indsci.com/mx4/ --Available at; Accessed March 15. Industrial Scientific. (2011). “MX6 iBrid Multi-Gas Monitor Operation Guide.” [Online].
http://www.indsci.com/mx6/ --Available at; Accessed March 15. Kemper FD. (1966). “A Near-Fatal Case of Hydrogen Sulfide Poisoning.” Canadian Medical
Association Journal 94(21): 1130-1131. Kilburn KH, Thrasher JD, Gray MR. (2010). “Low-level hydrogen sulfide and central nervous
system dysfunction.” Toxicology and Industrial Health 26(7): 387-405. Micucci L. (2005). “Optimize Claus Operations.” Hydrocarbon Processing 84(12): 78-80. Nam B, Kim H, Choi Y, Lee H, Hong ES, Park JK, Lee KM, Kim Y. (2004). “Neurologic
Sequela of Hydrogen Sulfide Poisoning.” Industrial Health 42: 83-87. NIOSH. (2010). “Hydrogen Sulfide.” [Online]. http://www.cdc.gov/niosh/npg/npgd0337.html –
Available at; Accessed January 11. OSHA. (1995). “Standard Interpretations: 1910.1000.” [Online].

60
http://www.osha.gov/pls/oshaweb/owadisp.show_document?p_table=INTERPRETATIONS&p_id=21955– Available at; Accessed March 15.
OSHA. (2012). “Chemical Sampling Information: Hydrogen Sulfide.” [Online]. http://www.osha.gov/dts/chemicalsampling/data/CH_246800.html – Available at; Accessed January 11.
Policastro MA, Otten EJ. (2007). “Case Files of the University of Cincinnati Fellowship in
Medical Toxicology: Two Patients with Acute Lethal Occupational Exposure to Hydrogen Sulfide.” Journal of Medical Toxicology 3(6): 73-81.
Reiffenstein RJ, Hulbert WC, Roth SH. (1992). “Toxicology of Hydrogen Sulfide.” Annual
Review of Pharmacology and Toxicology 32(1): 109-134.

61
Appendix A: Instrument Calibrations and Sample Locations
Industrial Scientific MX4 iQuad Multi-Gas Monitors
Table 8 – Calibration Dates and Sample Locations for the MX4s Used at the Sulfur Loading Rack
Dates Used and Location
Serial Number Type Cal. Date 10/10/2011 10/11/2011 10/12/2011 10/13/2011 09083BS-236 MX4 10/7/2011 - - Personal Sulfur Controls 09083BS-237 MX4 10/10/2011 - Man Way Hole - Man Way Hole 09083BS-238 MX4 10/7/2011 Personal - - - 09083BS-240 MX4 10/7/2011 Sulfur Controls - - - 09120LG-170 MX4 10/10/2011 Man Way Hole Personal Sulfur Controls - 09120LG-171 MX4 10/10/2011 - - - Personal 09120LG-172 MX4 10/7/2011 - Sulfur Controls Man Way Hole -
*All instruments passed a bump-test prior to being used in the field.
Table 9 – Calibration Dates and Sample Locations for the MX4s Used at the Asphalt Rail Car Loading Rack
Dates Used and Location
Serial Number Type Cal. Date 11/10/2011 11/11/2011 11/14/2011 09083BS-236 MX4 11/10/2011 5 Spot - - 09083BS-237 MX4 11/4/2011 Personal 6 Spot 6 Spot 09083BS-239 MX4 11/4/2011 - - 5 Spot 09083BS-240 MX4 11/11/2011 - 6 Spot 6 Spot 09120LG-170 MX4 11/10/2011 4 Spot - 5 Spot 09120LG-172 MX4 11/4/2011 - - Personal *All instruments passed a bump-test prior to being used in the field.

62
Table 10 – Calibration Dates and Sample Locations for the MX4s Used at the Asphalt Rail Car Loading Rack
Dates Used and Location
Serial Number Type Cal. Date 11/17/2011 11/18/2011 11/22/2011 09083BS-236 MX4 11/18/2011 - Area - 09083BS-239 MX4 11/17/2011 Personal Area - 09083BS-240 MX4 11/22/2011 - - Personal 09120LG-171 MX4 11/17/2011 Area - - 09120LG-172 MX4 11/17/2011 Personal Personal Area *All instruments passed a bump-test prior to being used in the field.
Industrial Scientific MX6 iBrid Multi-Gas Monitor
Table 11 – Calibration Dates and Sample Locations for the MX4s Used at the Asphalt Rail Car Loading Rack
Locations Used
Serial Number Type Cal. Date Asphalt Rail Car Asphalt Truck
070509K-024 MX6 12/8/2011 5-Spot Truck 17 070509K-024 MX6 12/8/2011 - Truck 18 070509K-024 MX6 12/8/2011 - Truck 19

63
Appendix B: Description of Equipment
Industrial Scientific MX4 iQuad Multi-Gas Monitor
This instrument was used to obtain personal and area samples at the sulfur truck loading
rack, the asphalt rail car loading rack and the asphalt truck loading rack. The MX4s were
calibrated before each survey and bump tested prior to each day’s sampling. The pump of the
MX4 runs at approximately 0.5 liters per minute.

64
The MX4s were calibrated and bump tested on an Industrial Scientific DS2 Docking
Station. The MX4 DS2 Docking station used had a serial number of 0911178-050. The
calibration gas was manufactured by Industrial Scientific, had a part number of 1810-2187 and
had an expiration date of November 2012. Its composition is as follows:
Hydrogen Sulfide 25 ppm
Carbon Monoxide 100 ppm
Pentane 25% LEL (0.35% vol.)
Oxygen 19.0%
Nitrogen Balance

65
Industrial Scientific MX6 iBrid Multi-Gas Monitor
This instrument was used to obtain area samples inside of the man way holes at the
asphalt rail car loading rack and the asphalt truck loading rack. The MX6 was calibrated before
the day’s sampling. The pump of the MX6 runs at approximately 0.5 liters per minute.

66
The MX6 was calibrated an Industrial Scientific DS2 Docking Station. The MX6 DS2
Docking station used had a part number of 18106724-ABC. The calibration gas was
manufactured by Industrial Scientific, had a part number of 1810-2187 and had an expiration
date of April 2013. Its composition is as follows:
Hydrogen Sulfide 25 ppm
Carbon Monoxide 100 ppm
Pentane 25% LEL (0.35% vol.)
Oxygen 19.0%
Nitrogen Balance

67
Alnor Thermoanemometer
An Alnor thermoanemometer was used to take volumetric measurements of air flow at
the sulfur loading rack, the asphalt rail car loading rack and the asphalt truck loading rack. The
instrument’s serial number was 98117004. Its last calibration date was October 10, 2011 and
was factory calibrated by TSI Incorporated.

68
Appendix C: Sulfur Truck Loading Graphs
0 0.1 0.2 0.3 0.4 0.5 0.6 0.7 0.8 0.9
1
23
:45
23
:47
23
:49
23
:51
23
:53
23
:55
23
:58
0:0
0
0:0
2
0:0
4
0:0
6
0:0
8
0:1
1
0:1
3
Co
nce
ntr
atio
n (
pp
m)
Time of Day
H2S Concentrations for Sulfur Truck 1
Sulfur Control Area Concentrations
Man Way Hole Area Concentrations
Personal Concentrations
0 0.1 0.2 0.3 0.4 0.5 0.6 0.7 0.8 0.9
1
1:4
6
1:4
7
1:4
9
1:5
0
1:5
2
1:5
3
1:5
5
1:5
6
1:5
8
1:5
9
2:0
1
2:0
2
2:0
4
2:0
5
Co
nce
ntr
atio
n (
pp
m)
Time of Day
H2S Concentrations for Sulfur Truck 2
Sulfur Control Area Concentrations
Man Way Hole Area Concentrations
Personal Concentrations

69
0 0.1 0.2 0.3 0.4 0.5 0.6 0.7 0.8 0.9
1
20
:11
20
:12
20
:14
20
:15
20
:17
20
:18
20
:20
20
:21
20
:23
20
:24
20
:26
20
:27
20
:29
20
:30
Co
nce
ntr
atio
n (
pp
m)
Time of Day
H2S Concentrations for Sulfur Truck 3
Sulfur Control Area Concentrations
Man Way Hole Area Concentrations
Personal Concentrations
0 0.1 0.2 0.3 0.4 0.5 0.6 0.7 0.8 0.9
1
21
:11
21
:12
21
:14
21
:15
21
:17
21
:18
21
:20
21
:21
21
:23
21
:24
21
:26
21
:27
21
:29
Co
nce
ntr
atio
n (
pp
m)
Time of Day
H2S Concentrations for Sulfur Truck 4
Sulfur Control Area Concentrations
Man Way Hole Area Concentrations
Personal Concentrations

70
0
1
2
3
4
5
6
7
2:1
6
2:1
7
2:1
9
2:2
0
2:2
2
2:2
3
2:2
5
2:2
6
2:2
8
2:2
9
2:3
1
2:3
2
2:3
4
2:3
5
Co
nce
ntr
atio
n (
pp
m)
Time of Day
H2S Concentrations for Sulfur Truck 5
Sulfur Control Area Concentrations
Man Way Hole Area Concentrations
Personal Concentrations
0 0.1 0.2 0.3 0.4 0.5 0.6 0.7 0.8 0.9
1
23
:43
23
:44
23
:46
23
:48
23
:49
23
:51
23
:53
23
:54
23
:56
23
:58
23
:59
0:0
1
0:0
3
0:0
4
Co
nce
ntr
atio
n (
pp
m)
Time of Day
H2S Concentrations for Sulfur Truck 6
Sulfur Control Area Concentrations
Man Way Hole Area Concentrations
Personal Concentrations

71
0 0.1 0.2 0.3 0.4 0.5 0.6 0.7 0.8 0.9
1
0:1
8
0:1
9
0:2
1
0:2
2
0:2
4
0:2
5
0:2
7
0:2
8
0:3
0
0:3
1
0:3
3
0:3
4
0:3
6
Co
nce
ntr
atio
n (
pp
m)
Time of Day
H2S Concentrations for Sulfur Truck 7
Sulfur Control Area Concentrations
Man Way Hole Area Concentrations
Personal Concentrations
0
0.2
0.4
0.6
0.8
1
1.2
1.4
1.6
1:2
9
1:3
0
1:3
2
1:3
3
1:3
5
1:3
6
1:3
8
1:3
9
1:4
1
1:4
2
1:4
4
1:4
5
1:4
7
1:4
8
Co
nce
ntr
atio
n (
pp
m)
Time of Day
H2S Concentrations for Sulfur Truck 8
Sulfur Control Area Concentrations
Man Way Hole Area Concentrations
Personal Concentrations

72
0
2
4
6
8
10
12
23
:40
23
:41
23
:42
23
:44
23
:45
23
:46
23
:48
23
:49
23
:50
23
:52
23
:53
23
:54
23
:56
23
:57
23
:58
Co
nce
ntr
atio
n (
pp
m)
Time of Day
H2S Concentrations for Sulfur Truck 9
Sulfur Control Area Concentrations
Man Way Hole Area Concentrations
Personal Concentrations

73
Appendix D: Asphalt Rail Car Loading Rack Graphs
0
1
2
3
4
5
6
7
10
:02
1
0:1
0
10
:18
1
0:2
6
10
:34
1
0:4
2
10
:50
1
0:5
8
11
:06
1
1:1
4
11
:22
1
1:3
0
11
:38
1
1:4
6
11
:54
1
2:0
2
12
:10
Co
nce
ntr
atio
n (
pp
m)
Time of Day
Day 1 H2S Concentrations at the Asphalt Rail Car Loading Rack
4-Spot Area Concentrations
5-Spot Area Concentrations
Personal Concentrations
0
2
4
6
8
10
12
8:5
8
9:0
2
9:0
6
9:1
0
9:1
4
9:1
8
9:2
2
9:2
6
9:3
0
9:3
4
9:3
8
9:4
2
9:4
6
9:5
0
Co
nce
ntr
atio
n (
pp
m)
Time of Day
Day 2 H2S Concentrations at the Asphalt Rail Car Loading Rack
6-Spot (closer) Area Concentrations
6-Spot (farther) Area Concentrations

74
0
0.5
1
1.5
2
2.5
9:0
8
9:1
9
9:3
0
9:4
1
9:5
2
10
:03
10
:14
10
:25
10
:36
10
:47
10
:58
11
:09
11
:20
11
:31
11
:42
11
:53
Co
nce
ntr
atio
n (
pp
m)
Time of Day
Day 3 Personal H2S Concentrations
Personal Concentrations
0
0.5
1
1.5
2
2.5
3
3.5
4
9:0
8
9:2
0
9:3
3
9:4
5
9:5
8
10
:10
10
:23
10
:35
10
:48
11
:00
11
:13
11
:25
11
:38
11
:50
Co
nce
ntr
atio
n (
pp
m)
Time of Day
Day 3 5-Spot H2S Concentrations
5-Spot (closer) Area Concentrations
5-Spot (farther) Area Concentrations

75
0
5
10
15
20
25
30
9:0
8
9:1
5
9:2
3
9:3
0
9:3
8
9:4
5
9:5
3
10
:00
10
:08
10
:15
10
:23
10
:30
10
:38
10
:45
Co
nce
ntr
atio
n (
pp
m)
Time of Day
Day 3 6-Spot H2S Concentrations: No Ventilation
6-Spot (closer) Area Concentrations
6-Spot (farther) Area Concentrations

76
Appendix E: Graphs of Asphalt Truck Loading Rack Data
0
0.5
1
1.5
2
2.5
3 8
:35
8:3
6
8:3
7
8:3
8
8:3
9
8:4
0
8:4
1
8:4
2
8:4
3
8:4
4
8:4
5
8:4
6
8:4
7
8:4
8
Co
nce
ntr
atio
n (
pp
m)
Time of Day
H2S Concentrations for Asphalt Truck 1
Area Concentrations
Personal Concentrations
0
0.5
1
1.5
2
2.5
3
3.5
4
8:4
9
8:5
0
8:5
1
8:5
2
8:5
3
8:5
4
8:5
5
8:5
6
8:5
7
8:5
8
8:5
9
9:0
0
9:0
1
9:0
2
Co
nce
ntr
atio
n (
pp
m)
Time of Day
H2S Concentrations for Asphalt Truck 2
Area Concentrations
Personal Concentrations

77
0
1
2
3
4
5
6
7
9:0
3
9:0
4
9:0
5
9:0
6
9:0
7
9:0
8
9:0
9
9:1
0
9:1
1
9:1
2
9:1
3
9:1
4
9:1
5
9:1
6
Co
nce
ntr
atio
n (
pp
m)
Time of Day
H2S Concentrations for Asphalt Truck 3
Area Concentrations
Personal Concentrations
0
5
10
15
20
25
9:1
8
9:1
9
9:2
0
9:2
1
9:2
2
9:2
3
9:2
4
9:2
5
9:2
6
9:2
7
9:2
8
9:2
9
9:3
0
Co
nce
ntr
atio
n (
pp
m)
Time of Day
H2S Concentrations for Asphalt Truck 4
Area Concentrations
Personal Concentrations

78
0
2
4
6
8
10
12
9:3
1
9:3
2
9:3
3
9:3
4
9:3
5
9:3
6
9:3
7
9:3
8
9:3
9
9:4
0
9:4
1
9:4
2
9:4
3
9:4
4
Co
nce
ntr
atio
n (
pp
m)
Time of Day
H2S Concentrations for Asphalt Truck 5
Area Concentrations
Personal Concentrations
0
0.2
0.4
0.6
0.8
1
1.2
1.4
9:4
6
9:4
7
9:4
8
9:4
9
9:5
0
9:5
1
9:5
2
9:5
3
9:5
4
9:5
5
9:5
6
9:5
7
9:5
8
Co
nce
ntr
atio
n (
pp
m)
Time of Day
H2S Concentrations for Asphalt Truck 6
Area Concentrations
Personal Concentrations

79
0
1
2
3
4
5
6
7
8
9
9:1
9
9:2
0
9:2
1
9:2
2
9:2
3
9:2
4
9:2
5
9:2
6
9:2
7
9:2
8
9:2
9
9:3
0
9:3
1
9:3
2
Co
nce
ntr
atio
n (
pp
m)
Time of Day
H2S Concentrations for Asphalt Truck 7
Area Concentrations
Personal Concentrations
0
2
4
6
8
10
12
9:3
5
9:3
7
9:3
8
9:3
9
9:4
1
9:4
2
9:4
3
9:4
5
9:4
6
9:4
7
9:4
9
9:5
0
9:5
1
Co
nce
ntr
atio
n (
pp
m)
Time of Day
H2S Concentrations for Asphalt Truck 8
Area Concentrations
Personal Concentrations

80
0
1
2
3
4
5
6
7
8
9:5
4
9:5
6
9:5
7
9:5
8
9:5
9
10
:00
10
:01
10
:03
10
:04
10
:05
10
:06
10
:07
10
:08
Co
nce
ntr
atio
n (
pp
m)
Time of Day
H2S Concentrations for Asphalt Truck 9
Area Concentrations
Pesonal Concentrations
0
10
20
30
40
50
60
70
80
90
10
:16
10
:18
10
:19
10
:20
10
:21
10
:22
10
:23
10
:25
10
:26
10
:27
10
:28
10
:29
10
:30
Co
nce
ntr
atio
n (
pp
m)
Time of Day
H2S Concentrations for Asphalt Truck 10
Area Concentrations
Personal Concentrations

81
0
1
2
3
4
5
6
10
:33
10
:34
10
:35
10
:36
10
:37
10
:38
10
:39
10
:40
10
:41
10
:42
10
:43
10
:44
10
:45
10
:46
10
:47
Co
nce
ntr
atio
n (
pp
m)
Time of Day
H2S Concentrations for Asphalt Truck 11
Area Concentrations
Personal Concentrations
0
0.1
0.2
0.3
0.4
0.5
0.6
0.7
0.8
0.9
10
:48
10
:50
10
:51
10
:52
10
:53
10
:54
10
:55
10
:57
10
:58
10
:59
11
:00
11
:01
11
:02
11
:04
Co
nce
ntr
atio
n (
pp
m)
Time of Day
H2S Concentrations for Asphalt Truck 12
Area Concentrations
Personal Concentrations

82
0
1
2
3
4
5
6
7
8:3
8
8:4
0
8:4
1
8:4
2
8:4
3
8:4
4
8:4
5
8:4
7
8:4
8
8:4
9
8:5
0
8:5
1
8:5
2
Co
nce
ntr
atio
n (
pp
m)
Time of Day
H2S Concentrations for Asphalt Truck 13
Area Concentrations
Personal Concentrations
0 0.1 0.2 0.3 0.4 0.5 0.6 0.7 0.8 0.9
1
9:3
2
9:3
4
9:3
5
9:3
7
9:3
8
9:4
0
9:4
1
9:4
3
9:4
4
9:4
6
9:4
7
9:4
9
9:5
0
Co
nce
ntr
atio
n (
pp
m)
Time of Day
H2S Concentrations for Asphalt Truck 14
Personal Concentrations
Area Concentrations

83
0 0.1 0.2 0.3 0.4 0.5 0.6 0.7 0.8 0.9
1
9:5
2
9:5
4
9:5
5
9:5
6
9:5
8
9:5
9
10
:00
10
:02
10
:03
10
:04
10
:06
10
:07
10
:08
Co
nce
ntr
atio
n (
pp
m)
Time of Day
H2S Concentrations for Asphalt Truck 15
Personal Concentrations
Area Concentrations
0
0.5
1
1.5
2
2.5
3
3.5
10
:30
10
:31
10
:32
10
:33
10
:34
10
:35
10
:36
10
:37
10
:38
10
:39
10
:40
10
:41
10
:42
10
:43
Co
nce
ntr
atio
n (
pp
m)
Time of Day
H2S Concentrations for Asphalt Truck 16
Area Concentrations
Personal Concentrations