hydrogeological investigation at site 5, willow grove ... cooperation with the u.s. navy...
TRANSCRIPT

In cooperation with theU.S. NAVY
Hydrogeological Investigation at Site 5,Willow Grove Naval Air Station/Joint Reserve Base,Horsham Township, Montgomery County, Pennsylvania
by Ronald A. Sloto
Water-Resources Investigations Report 01-4263
U.S. Department of the InteriorU.S. Geological Survey
New Cumberland, Pennsylvania2002

ii
U.S. DEPARTMENT OF THE INTERIORGALE A. NORTON, Secretary
U.S. GEOLOGICAL SURVEYCharles G. Groat, Director
For additional information Copies of this report may bewrite to: purchased from:
District Chief U.S. Geological SurveyU.S. Geological Survey Branch of Information Services215 Limekiln Road Box 25286, Denver Federal CenterNew Cumberland, Pennsylvania 17070-2424 Denver, Colorado 80225-0286Email: [email protected] Telephone: 1-888-ASK-USGSInternet Address: http://pa.water.usgs.gov

iii
Abstract . . . . . . . . . . . . . . . . . . . . . . . . . . . . . . . . . . . . . . . . . . . . . . . . . . . . . . . . . . . . . . . . . . . . . . . . . . . 1
Introduction . . . . . . . . . . . . . . . . . . . . . . . . . . . . . . . . . . . . . . . . . . . . . . . . . . . . . . . . . . . . . . . . . . . . . . . . 2
Purpose and scope . . . . . . . . . . . . . . . . . . . . . . . . . . . . . . . . . . . . . . . . . . . . . . . . . . . . . . . . . . . . . 2
Hydrogeologic setting . . . . . . . . . . . . . . . . . . . . . . . . . . . . . . . . . . . . . . . . . . . . . . . . . . . . . . . . . . . 2
Well-identification system. . . . . . . . . . . . . . . . . . . . . . . . . . . . . . . . . . . . . . . . . . . . . . . . . . . . . . . . . 4
Previous investigations . . . . . . . . . . . . . . . . . . . . . . . . . . . . . . . . . . . . . . . . . . . . . . . . . . . . . . . . . . 4
Acknowledgments . . . . . . . . . . . . . . . . . . . . . . . . . . . . . . . . . . . . . . . . . . . . . . . . . . . . . . . . . . . . . . 4
Borehole geophysical logs . . . . . . . . . . . . . . . . . . . . . . . . . . . . . . . . . . . . . . . . . . . . . . . . . . . . . . . . . . . . . 4
Measurement of vertical borehole flow . . . . . . . . . . . . . . . . . . . . . . . . . . . . . . . . . . . . . . . . . . . . . . 8
Borehole television surveys . . . . . . . . . . . . . . . . . . . . . . . . . . . . . . . . . . . . . . . . . . . . . . . . . . . . . . . 8
Interpretation of borehole geophysical logs . . . . . . . . . . . . . . . . . . . . . . . . . . . . . . . . . . . . . . . . . . 8
Well 05MW04I (MG-1757) . . . . . . . . . . . . . . . . . . . . . . . . . . . . . . . . . . . . . . . . . . . . . . . . . . 8
Well 05MW05I (MG-1758) . . . . . . . . . . . . . . . . . . . . . . . . . . . . . . . . . . . . . . . . . . . . . . . . . 11
Well 05MW012I (MG-1759) . . . . . . . . . . . . . . . . . . . . . . . . . . . . . . . . . . . . . . . . . . . . . . . . 13
Analysis of volatile organic compounds in the aquifer matrix . . . . . . . . . . . . . . . . . . . . . . . . . . . . . . . . . 16
Effect of pumping Horsham Water and Sewer Authority supply well 26 on water levels . . . . . . . . . . . . . 20
Water levels . . . . . . . . . . . . . . . . . . . . . . . . . . . . . . . . . . . . . . . . . . . . . . . . . . . . . . . . . . . . . . . . . . . . . . . 27
Regional potentiometric surface. . . . . . . . . . . . . . . . . . . . . . . . . . . . . . . . . . . . . . . . . . . . . . . . . . . 27
Potentiometric surface at Site 5 . . . . . . . . . . . . . . . . . . . . . . . . . . . . . . . . . . . . . . . . . . . . . . . . . . . 30
Vertical head gradients. . . . . . . . . . . . . . . . . . . . . . . . . . . . . . . . . . . . . . . . . . . . . . . . . . . . . . . . . . 34
Summary . . . . . . . . . . . . . . . . . . . . . . . . . . . . . . . . . . . . . . . . . . . . . . . . . . . . . . . . . . . . . . . . . . . . . . . . . 35
References cited . . . . . . . . . . . . . . . . . . . . . . . . . . . . . . . . . . . . . . . . . . . . . . . . . . . . . . . . . . . . . . . . . . . 37
CONTENTS
Page

iv
Figures 1-2. Maps showing:
1. Location of the Willow Grove Naval Air Station/Joint Reserve Baseand sites of possible ground-water contamination, Horsham Township,Montgomery County, Pennsylvania . . . . . . . . . . . . . . . . . . . . . . . . . . . . . . . 3
2. Locations of selected wells, Willow Grove Naval Air Station/Joint ReserveBase and vicinity . . . . . . . . . . . . . . . . . . . . . . . . . . . . . . . . . . . . . . . . . . . . . 7
3. Borehole geophysical logs for well 05MW04I (MG-1757), Willow Grove Naval AirStation/Joint Reserve Base. . . . . . . . . . . . . . . . . . . . . . . . . . . . . . . . . . . . . . . . . . . . 9
4. Image from borehole television survey showing vertical fracture at 78 feet belowland surface in well 05MW04I (MG-1757), Willow Grove Naval Air Station/Joint Reserve Base . . . . . . . . . . . . . . . . . . . . . . . . . . . . . . . . . . . . . . . . . . . . . . . . . 10
5. Borehole geophysical logs for well 05MW05I (MG-1758), Willow Grove Naval AirStation/Joint Reserve Base. . . . . . . . . . . . . . . . . . . . . . . . . . . . . . . . . . . . . . . . . . . 12
6. Image from borehole television survey showing vertical fracture at 142 feet belowland surface in well 05MW05I (MG-1758), Willow Grove Naval AirStation/Joint Reserve Base. . . . . . . . . . . . . . . . . . . . . . . . . . . . . . . . . . . . . . . . . . . 13
7. Borehole geophysical logs for well 05MW012I (MG-1759), Willow Grove Naval AirStation/Joint Reserve Base. . . . . . . . . . . . . . . . . . . . . . . . . . . . . . . . . . . . . . . . . . . 14
8. Image from borehole television survey showing vertical fracture at 36 feet belowland surface in well 05MW012I (MG-1759), Willow Grove Naval AirStation/Joint Reserve Base. . . . . . . . . . . . . . . . . . . . . . . . . . . . . . . . . . . . . . . . . . . 15
9. Photographs of sections from rock core MG-1760, Willow Grove Naval AirStation/Joint Reserve Base. . . . . . . . . . . . . . . . . . . . . . . . . . . . . . . . . . . . . . . . . . . 17
10. Sketch showing geologic log of rock core MG-1760 and depths of sampledfractures, Willow Grove Naval Air Station/Joint Reserve Base . . . . . . . . . . . . . . . . 18
11-17. Hydrographs from:
11. Horsham Water and Sewer Authority well 26 and well 02MW01I,January 14 to February 9, 2000, Willow Grove Naval Air Station/Joint Reserve Base . . . . . . . . . . . . . . . . . . . . . . . . . . . . . . . . . . . . . . . . . . 22
12. Horsham Water and Sewer Authority well 26 and well 05MW11I,January 18 to February 9, 2000, Willow Grove Naval Air Station/Joint Reserve Base . . . . . . . . . . . . . . . . . . . . . . . . . . . . . . . . . . . . . . . . . . 22
13. Wells 02MW01S, 02MW03SI, 05MW11S, and 05MW11SI,January 14 to February 7, 2000, Willow Grove Naval Air Station/Joint Reserve Base . . . . . . . . . . . . . . . . . . . . . . . . . . . . . . . . . . . . . . . . . . 23
14. Wells 02MW03I, 05MW01S, 05MW01SI, 05MW01I, 05MW03S, 05MW06S,and 05MW06I, January 14 to February 7, 2000, Willow GroveNaval Air Station/Joint Reserve Base . . . . . . . . . . . . . . . . . . . . . . . . . . . . 24
ILLUSTRATIONS
Page

v
Figures 11-17. Hydrographs from—Continued:
15. Wells 02MW04S, 03MW06SI, 03MW06I, 05MW03I, and05MW11I, January 14 to February 7, 2000, Willow Grove Naval AirStation/Joint Reserve Base . . . . . . . . . . . . . . . . . . . . . . . . . . . . . . . . . . . . 25
16. Wells 02MW04I and 03MW06S, January 14 to February 7, 2000,Willow Grove Naval Air Station/Joint Reserve Base . . . . . . . . . . . . . . . . . 26
17. Well MG-1739, January 18 to February 9, 2000, Willow GroveNaval Air Station/Joint Reserve Base . . . . . . . . . . . . . . . . . . . . . . . . . . . . 27
18. Map showing potentiometric surface and regional ground-water divide, October 7-8,1999, Willow Grove Naval Air Station/Joint Reserve Base . . . . . . . . . . . . . . . . . . 28
19. Hydrographs from wells 05MW08I, 05MW09I, and 05MW12I, February 12 toMarch 15, 2001, Willow Grove Naval Air Station/Joint Reserve Base . . . . . . . . . . 30
20-22. Maps showing:
20. Potentiometric surface defined by water levels in wells screened between5 and 44 feet below land surface, October 7, 1999, Willow GroveNaval Air Station/Joint Reserve Base . . . . . . . . . . . . . . . . . . . . . . . . . . . . 31
21. Potentiometric surface defined by water levels in wells screened between40 and 100 feet below land surface, October 7, 1999, Willow GroveNaval Air Station/Joint Reserve Base . . . . . . . . . . . . . . . . . . . . . . . . . . . . 32
22. Potentiometric surface defined by water levels in wells screened between105 and 179 feet below land surface, October 7, 1999, Willow GroveNaval Air Station/Joint Reserve Base . . . . . . . . . . . . . . . . . . . . . . . . . . . . 33
23. Hydrographs from wells 05MW11S, 05MW11SI, and 05MW11I, August 9, 1999,to January 14, 2000, Willow Grove Naval Air Station/Joint Reserve Base . . . . . . . 34
ILLUSTRATIONS—Continued
Page

vi
Table 1. Record of selected wells, Willow Grove Naval Air Station/Joint Reserve Baseand vicinity, Horsham Township, Montgomery County, Pennsylvania . . . . . . . . . . . . 5
2. Heatpulse-flowmeter measurements made in well 05MW04I (MG-1757),Willow Grove Naval Air Station/Joint Reserve Base . . . . . . . . . . . . . . . . . . . . . . . 10
3. Heatpulse-flowmeter measurements made in well 05MW05I (MG-1758),Willow Grove Naval Air Station/Joint Reserve Base . . . . . . . . . . . . . . . . . . . . . . . 11
4. Heatpulse-flowmeter measurements made in well 05MW012I (MG-1759),Willow Grove Naval Air Station/Joint Reserve Base . . . . . . . . . . . . . . . . . . . . . . . 15
5. Analytical results for volatile organic compounds in samples from rock coreMG-1760, Willow Grove Naval Air Station/Joint Reserve Base . . . . . . . . . . . . . . . 16
6. Density of rock types in rock core MG-1760, Willow Grove Naval AirStation/Joint Reserve Base . . . . . . . . . . . . . . . . . . . . . . . . . . . . . . . . . . . . . . . . . . 19
7. Change in water level in wells measured January 25-31, 2000, Willow GroveNaval Air Station/Joint Reserve Base . . . . . . . . . . . . . . . . . . . . . . . . . . . . . . . . . . 21
8. Water levels measured October 7, 1999, Willow Grove Naval Air Station/JointReserve Base . . . . . . . . . . . . . . . . . . . . . . . . . . . . . . . . . . . . . . . . . . . . . . . . . . . . . 29
TABLES
Page

vii
Multiply By To obtain
Sea level: In this report, “sea level” refers to the National Geodetic Vertical Datum of 1929—a geodeticdatum derived from a general adjustment of the first-order level nets of the United States and Canada,formerly called Sea Level Datum of 1929.
Abbreviated concentration units used in report:cm, centimeterkg/ft3, kilogram per cubic footµg, microgramµg/kg, microgram per kilogramµg/L, microgram per liter
Lengthinch (in) 2.54 centimeterfoot (ft) 0.3048 metermile (mi) 1.609 kilometer
Areaacre 0.4047 hectare
Volumegallon (gal) 3.785 litercubic foot (ft3) 0.02832 cubic meter
Flow rategallon per minute (gal/min) 0.06309 liter per secondgallon per day (gal/d) 0.003785 cubic meter per day
Masspound, avoirdupois (lb) 0.4536 kilogram
Densitypound per cubic foot (lb/ft3) 16.02 kilogram per cubic meter
CONVERSION FACTORS AND ABBREVIATIONS
1
ABSTRACT
The U.S. Geological Survey conducted boreholegeophysical logging, collected and analyzed water-level data, and sampled sections of a rock core todetermine the concentration of volatile organic com-pounds in the aquifer matrix of the Stockton Forma-tion. Borehole geophysical logs were run in threemonitor wells. At well 05MW04I, the vertical gradientwas upward at depths above 42 feet below land sur-face (ft bls), downward between 42 and 82 ft bls, andupward below 82 ft bls. At well 05MW05I, a downwardvertical gradient was present. At well 05MW12I, thevertical gradient was downward above 112 ft bls andupward below 112 ft bls.
Three water-bearing fractures in a 17-foot longrock core from 23.5 to 40.5 ft bls were identified andsampled. Three samples were analyzed from eachwater-bearing fracture—at the fracture face,2 centimeters (cm) below the fracture, and 4 cmbelow the fracture. Fifteen compounds were detected;however, concentrations of seven compounds wereless than 1 microgram per kilogram (µg/kg) whendetected. Concentrations of benzene (from 0.39 to3.3 µg/kg), 1,1-dichloroethene (1,1-DCE)(from 0.15 to 13 µg/kg), 1,1,1-trichloroethane (TCA)(from 0.17 to 22 µg/kg), and trichloroethylene (TCE)(from 0.092 to 9.6 µg/kg) were detected in all sam-ples. The highest concentrations detected were fortoluene, which was detected at a concentration of 32and 86 µg/kg in the samples from unweathered sand-stone at 2 and 4 cm below the fracture, respectively.Concentrations generally decreased with distancebelow the fracture in the mudstone samples. Concen-trations of benzene and toluene increased with dis-tance below the fractures in the unweatheredsandstone samples. Concentrations of 1,1-DCE,TCA, and TCE were higher in the mudstone samplesthan in the samples from sandstone. Toluene concen-trations were higher in unweathered sandstone thanin weathered sandstone or mudstone.
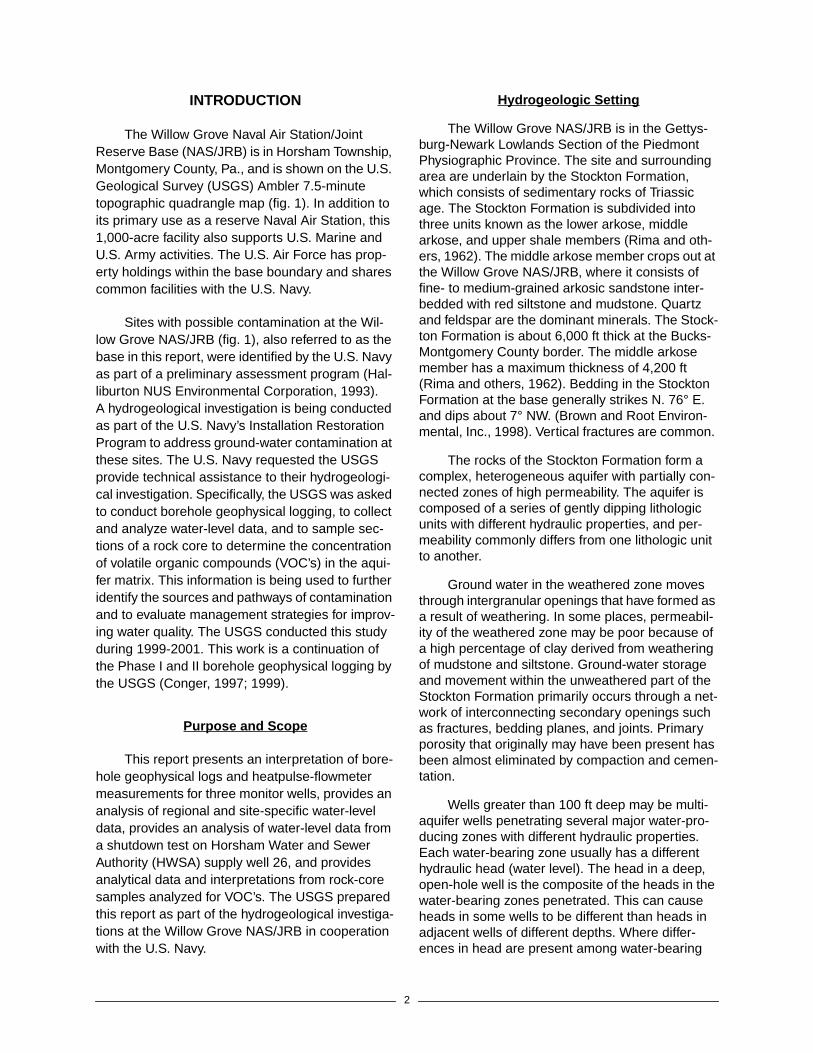
The effect of the pumping of Horsham Water andSewer Authority public supply well 26 (HWSA-26),0.2 mile southwest of the base boundary, on ground-
water levels on the base was determined by shuttingthe well down for 6 days to allow water levels torecover. Water levels in 22 nearby wells were mea-sured. The only well (02MW01I) that showed anunambiguous response to the shutdown of wellHWSA-26 is 1,350 feet directly along strike from wellHWSA-26. The recovery of well 05MW11I inresponse to the shutdown of well HWSA-26 ismasked by recharge from snowmelt but probablydoes not exceed about 0.2 feet on the basis of thewater level in well 05MW11I, which showed aresponse to the pumping of well HWSA-26 thatranged from 0.5 to 0.15 foot.
Horizontal gradients differ with depth, and therate and direction of ground-water flow and contami-nant movement is depth dependent. The potentio-metric-surface map for water levels measured in wellsscreened between 5 and 44 ft bls in the aquifer showsa ground-water mound that is the high point on aregional ground-water divide. From this divide, groundwater flows both northwest toward Park Creek andsoutheast toward Pennypack Creek. The hydraulicgradient around this mound is relatively flat to thesoutheast and particularly flat to the northwest. Thepotentiometric-surface map for water levels measuredin wells screened between 40 and 100 ft bls in theaquifer shows a very flat hydraulic gradient. Differ-ences in the elevation of the potentiometric surfaceare less than 2 feet. The potentiometric-surface mapfor water levels measured in wells screened between105 and 179 ft bls in the aquifer shows a steephydraulic gradient between Sites 5 and 2 and a rela-tively flat hydraulic gradient between Sites 5 and 3.Water levels measured on October 7, 1999, showeddownward vertical head gradients for all well clustersat Site 5. Vertical gradients ranged from 0.01 at wellcluster 05MW10 to 0.2 at cluster 05MW11. Most gra-dients were between 0.01 and 0.026. Vertical headgradients vary with time. The variability is caused by adifference in the magnitude of water-level fluctuationsbetween shallow and the deep fractures. The differ-ence in the magnitude of water-level fluctuations isbecause of differences in lithology and aquifer stora-tivity.
HYDROGEOLOGICAL INVESTIGATION AT SITE 5,
WILLOW GROVE NAVAL AIR STATION/JOINT RESERVE BASE,
HORSHAM TOWNSHIP, MONTGOMERY COUNTY, PENNSYLVANIA
by Ronald A. Sloto
2
INTRODUCTION
The Willow Grove Naval Air Station/JointReserve Base (NAS/JRB) is in Horsham Township,Montgomery County, Pa., and is shown on the U.S.Geological Survey (USGS) Ambler 7.5-minutetopographic quadrangle map (fig. 1). In addition toits primary use as a reserve Naval Air Station, this1,000-acre facility also supports U.S. Marine andU.S. Army activities. The U.S. Air Force has prop-erty holdings within the base boundary and sharescommon facilities with the U.S. Navy.
Sites with possible contamination at the Wil-low Grove NAS/JRB (fig. 1), also referred to as thebase in this report, were identified by the U.S. Navyas part of a preliminary assessment program (Hal-liburton NUS Environmental Corporation, 1993).A hydrogeological investigation is being conductedas part of the U.S. Navy’s Installation RestorationProgram to address ground-water contamination atthese sites. The U.S. Navy requested the USGSprovide technical assistance to their hydrogeologi-cal investigation. Specifically, the USGS was askedto conduct borehole geophysical logging, to collectand analyze water-level data, and to sample sec-tions of a rock core to determine the concentrationof volatile organic compounds (VOC’s) in the aqui-fer matrix. This information is being used to furtheridentify the sources and pathways of contaminationand to evaluate management strategies for improv-ing water quality. The USGS conducted this studyduring 1999-2001. This work is a continuation ofthe Phase I and II borehole geophysical logging bythe USGS (Conger, 1997; 1999).
Purpose and Scope
This report presents an interpretation of bore-hole geophysical logs and heatpulse-flowmetermeasurements for three monitor wells, provides ananalysis of regional and site-specific water-leveldata, provides an analysis of water-level data froma shutdown test on Horsham Water and SewerAuthority (HWSA) supply well 26, and providesanalytical data and interpretations from rock-coresamples analyzed for VOC’s. The USGS preparedthis report as part of the hydrogeological investiga-tions at the Willow Grove NAS/JRB in cooperationwith the U.S. Navy.
Hydr ogeologic Setting
The Willow Grove NAS/JRB is in the Gettys-burg-Newark Lowlands Section of the PiedmontPhysiographic Province. The site and surroundingarea are underlain by the Stockton Formation,which consists of sedimentary rocks of Triassicage. The Stockton Formation is subdivided intothree units known as the lower arkose, middlearkose, and upper shale members (Rima and oth-ers, 1962). The middle arkose member crops out atthe Willow Grove NAS/JRB, where it consists offine- to medium-grained arkosic sandstone inter-bedded with red siltstone and mudstone. Quartzand feldspar are the dominant minerals. The Stock-ton Formation is about 6,000 ft thick at the Bucks-Montgomery County border. The middle arkosemember has a maximum thickness of 4,200 ft(Rima and others, 1962). Bedding in the StocktonFormation at the base generally strikes N. 76° E.and dips about 7° NW. (Brown and Root Environ-mental, Inc., 1998). Vertical fractures are common.
The rocks of the Stockton Formation form acomplex, heterogeneous aquifer with partially con-nected zones of high permeability. The aquifer iscomposed of a series of gently dipping lithologicunits with different hydraulic properties, and per-meability commonly differs from one lithologic unitto another.
Ground water in the weathered zone movesthrough intergranular openings that have formed asa result of weathering. In some places, permeabil-ity of the weathered zone may be poor because ofa high percentage of clay derived from weatheringof mudstone and siltstone. Ground-water storageand movement within the unweathered part of theStockton Formation primarily occurs through a net-work of interconnecting secondary openings suchas fractures, bedding planes, and joints. Primaryporosity that originally may have been present hasbeen almost eliminated by compaction and cemen-tation.
Wells greater than 100 ft deep may be multi-aquifer wells penetrating several major water-pro-ducing zones with different hydraulic properties.Each water-bearing zone usually has a differenthydraulic head (water level). The head in a deep,open-hole well is the composite of the heads in thewater-bearing zones penetrated. This can causeheads in some wells to be different than heads inadjacent wells of different depths. Where differ-ences in head are present among water-bearing

3
Figure 1. Location of the Willow Grove Naval Air Station/Joint Reserve Base and sites of possibleground-water contamination, Horsham Township, Montgomery County, Pennsylvania.
BASE BOUNDARY
SITE 1
SITE 2
SITE 3
SITE 5
40°12′
75°09′
40°11′
40°13′
75°08′75°10′
Base from U.S. Geological Survey Ambler 1:24,000, 19660 0.25 0.5
0.75 1 KILOMETER0 0.25 0.5
0.75 1 MILE
PENNSYLVANIA
LOCATION OF MAP

4
zones, water in the well bore flows in the directionof decreasing head. Wells that connect severalwater-bearing zones may act as conduits for thetransport of contaminants (Sloto and others, 1996).
Ground water at the base originates from infil-tration of local precipitation and inflow of groundwater from upgradient areas. Ground-water levelsfluctuate with seasonal variations in recharge andalso are affected by pumping of nearby wells.Water in the upper part of the aquifer generally isunder unconfined (water-table) conditions; groundwater in the deeper part of the aquifer may be con-fined or partially confined. Local artesian condi-tions are common.
Well-Identification System
Two well-identification numbering systems areused in this report to maintain consistency withprevious studies. U.S. Navy well-identification num-bers are used for wells at the Willow GroveNAS/JRB. Navy well-identification numbers consistof a site-designation number, the letters MW, asequentially assigned well-cluster number, and adepth-interval letter (S for shallow, I for intermedi-ate). Well 05MW01S would indicate a shallow wellin well cluster 1 at Site 5. The USGS well-identifi-cation number consists of a county-abbreviationprefix followed by a sequentially assigned number.The prefix MG denotes a well in MontgomeryCounty. A cross-reference between site and USGSwell-identification numbers is given in table 1.Locations of the wells are shown on figure 2.
Previous In vestigations
The geology and hydrology of the StocktonFormation in southeastern Pennsylvania weredescribed by Rima and others (1962). Sloto andothers (1996) described the use of borehole geo-physical methods to determine the extent of aquifercross-contamination by VOC’s through open bore-holes in the Stockton Formation in adjacent Hat-boro Borough and Warminster Township. Previousstudies at the Willow Grove NAS/JRB were con-ducted by Halliburton NUS Environmental Corpo-ration (1993) and Brown and Root Environmental,Inc. (1997; 1998). USGS reports by Conger (1997;1999) describe the interpretation of borehole geo-physical logs collected at the base. Sloto, Goode,and Way (2001) presented a potentiometric-sur-face map of the Willow Grove NAS/JRB and
vicinity. Sloto, Goode, and Frasch (2002) describea hydrogeologic investigation conducted at thebase supply wells.
Ackno wledgments
Borehole geophysical logging and boreholetelevision surveys were done by Randall Congerand Philip Bird of the USGS Pennsylvania District.Water-level data for wells off the base were col-lected by Daniel Goode of the USGS PennsylvaniaDistrict and John Way of Lock Haven University.Most water-level data presented in this report wereprovided by TetraTech NUS, Inc. The use of thesedata are appreciated greatly. Daniel Goode con-ducted and collected data for the test of HWSAwell 26. The cooperation of the HWSA for shuttingdown well 26 for a hydraulic test is appreciatedgreatly. Personnel from the Philadelphia SuburbanWater Company assisted with the test. The cooper-ation of domestic well owners who allowed accessto their wells for water-level measurements grate-fully is acknowledged.
BOREHOLE GEOPHYSICAL LOGS
Caliper, natural-gamma, single-point-resis-tance, fluid-resistivity, and fluid-temperature bore-hole geophysical logs were collected in threemonitor wells during August 2000. The logs wereused to locate water-bearing fractures, determinezones of vertical borehole-water movement, anddetermine the depth to set well screens.
Caliper logs provide a continuous record ofaverage borehole diameter, which is related to frac-tures, lithology, and drilling technique. Caliper logswere used to identify fractures and possible water-bearing openings. Correlation of caliper logs withfluid-resistivity and fluid-temperature logs wasused to identify water-producing and water-receiv-ing fractures or zones. The term fracture used inassociation with the caliper-log interpretationsmight identify a change in borehole diameter thatmay not necessarily indicate a bedding-plane sep-aration, lithologic contact, or water-producing orwater-receiving zone but simply may indicate anenlargement of the borehole.
Natural-gamma logs, also called gamma-raylogs, record the natural-gamma radiation emittedfrom rocks penetrated by the borehole. Uranium-238, thorium-232, and the progeny of their decayseries and potassium-40 are the most commonemitters of natural-gamma radiation. These radio-

5
Table 1. Record of selected wells, Willow Grove Naval Air Station/Joint Reserve Base and vicinity, HorshamTownship, Montgomery County, Pennsylvania
[Well depths given are for completed monitor wells. —, no data]
Sitewell-identification
number
U.S. GeologicalSurvey
well-identificationnumber
Well depth(feet)
Casing diameter(inches)
Open interval(feet below top of casing)
02MW01S MG-1850 20 4 5-20
02MW01I MG-1598 80 2 70-80
02MW02S MG-1851 25 4 5-25
02MW03S MG-1878 20 4 5-20
02MW03SI MG-1852 55 2 40-55
02MW03I MG-1628 150 2 140-150
02MW04S MG-1593 44 2 34-44
02MW04I MG-1594 115 2 105-115
03MW01S MG-1853 32 4 12-32
03MW01SI MG-1854 80 4 60-80
03MW01I MG-1855 179 4 159-179
03MW02S MG-1856 22.5 4 4.5-22.5
03MW02SI MG-1857 65 4 55-65
03MW02I MG-1629 144 2 134-144
03MW03S MG-1858 20 4 5-20
03MW03I MG-1859 168.5 4 148.5-168.5
03MW04S MG-1860 35 4 5-35
03MW04SI MG-1861 80 4 60-80
03MW04I MG-1862 168 4 148-168
03MW05S MG-1863 37 4 17-37
03MW05I MG-1595 92 4 82-92
03MW06S MG-1596 36 2 26-36
03MW06SI MG-1877 85 2 75-85
03MW06I MG-1597 150 2 140-150
03MW07S MG-1630 44 2 34-44
05MW01S MG-1599 32 4 12-32
05MW01SI MG-1864 84.5 4 74.5-84.5
05MW01I MG-1590 135 4 124-135
05MW02S MG-1865 30 4 10-30
05MW03S MG-1866 31 4 11-31
05MW03I MG-1589 128 2 118-128
05MW04S MG-1867 30 4 10-30
05MW04I MG-1757 84.5 2 74.5-84.5
05MW05S MG-1868 40 4 20-40
05MW05I MG-1758 209.5 2 189.5-209.5
05MW06S MG-1869 37.5 4 17.5-37.5
05MW06I MG-1870 84 4 74-84
05MW07S MG-1871 26 4 6-26
05MW07I MG-1872 84 4 74-84
05MW08S MG-1585 36 2 26-36
05MW08SI MG-1873 65 2 55-65
05MW08I MG-1586 99 2 89-99
05MW09S MG-1588 32 2 27-32
05MW09SI MG-1874 74 2 59-74
05MW09I MG-1587 106 2 96-106

6
active elements may be concentrated in clays byadsorption, precipitation, and ion exchange. Fine-grained sediments, such as mudstone or siltstone,usually emit more gamma radiation than sand-stone. Geophysical logging with a gamma probecan be conducted in the fluid filled, dry, cased, oruncased parts of the borehole. However, well cas-ing reduces the gamma response. The gamma logis used to correlate lithologic units between wells(Keys, 1990).
Single-point-resistance logs record the electri-cal resistance between the borehole and an electri-cal ground at land surface. In general, resistanceincreases with grain size and decreases with bore-hole diameter, density of water-bearing fractures,and increasing dissolved-solids concentration ofborehole water (Keys, 1990). A water-filled bore-hole is required for single-point-resistance logs,and they are run only for the saturated part of theformation below the casing. The single-point-resis-tance log is used to correlate lithology betweenwells and may help identify water-bearing fracturesor zones.
Fluid-temperature logs provide a continuousrecord of the temperature of the water in the bore-hole. Fluid-temperture logs are used to identifywater-producing and water-receiving zones and todetermine intervals of vertical borehole flow.Water-producing and water-receiving zones usu-ally are identified by sharp changes in temperature,and intervals of vertical borehole flow are identifiedby little or no temperature gradient.
Fluid-resistivity logs measure the electricalresistance of water in the borehole. Resistivity isthe reciprocal of fluid conductivity, and fluid-resis-tivity logs reflect changes in the dissolved-solidsconcentration of the borehole water. Fluid-resistiv-ity logs are used to identify water-producing andwater-receiving zones and to determine intervals ofvertical borehole flow. Water-producing and water-receiving zones usually are identified by sharpchanges in resistivity. Intervals of vertical boreholeflow usually are identified by a low-resistivity grad-ient between a water-producing and a water-receiving zone.
05MW10S MG-1591 32 2 22-32
05MW10SI MG-1875 94 2 79-94
05MW10I MG-1592 126 2 116-126
05MW11S MG-1634 25 2 20-25
05MW11SI MG-1876 50 2 40-50
05MW11I MG-1635 149 2 139-149
05MW12I MG-1759 113.5 2 103.5-113.5
HWSA-26 MG-962 400 12 40-400
— MG-1739 — 6 —
rock core MG-1760 40.5 — —
Table 1. Record of selected wells, Willow Grove Naval Air Station/Joint Reserve Base and vicinity, HorshamTownship, Montgomery County, Pennsylvania—Continued
[Well depths given are for completed monitor wells. —, no data]
Sitewell-identification
number
U.S. GeologicalSurvey
well-identificationnumber
Well depth(feet)
Casing diameter(inches)
Open interval(feet below top of casing)

7
Figure 2. Locations of selected wells, Willow Grove Naval Air Station/Joint Reserve Base and vicinity, Horsham Township,Montgomery County, Pennsylvania.
40°12′75°09′30″ 75°09′ 75°08′30″
40°11′30″
Base from U.S. Geological Survey Ambler 1:24,000, 1966 0 1,000 2,000 FEET
0 250 500 METERS
02MW02S
02MW04I02MW04S
02MW03SI
02MW01I02MW01S
02MW03S
05MW04S
05MW03I05MW03S
05MW12I 05MW01S05MW01SI
05MW04I05MW02S
05MW01I
05MW05S05MW05I
05MW10S
05MW10I05MW10SI
05MW09SI05MW09I
05MW06S05MW06I
05MW08SI05MW08I
05MW011S05MW011SI
05MW07S05MW07I
03MW01SI03MW01I
03MW04S
03MW07S
03MW04I03MW04SI
03MW05S
03MW06SI03MW06S03MW05I
03MW06I
03MW05I03MW05S WELL CLUSTER AND WELL-
IDENTIFICATION NUMBERS
03MW07S WELL AND WELL- IDENTIFICATION NUMBER
MG-1740
MG-1739
HWSA-26
03MW01S
05MW09S
05MW08S
05MW011I
02MW03S
03MW02S
03MW02I03MW02SI
03MW03S03MW03I

8
Measurement of V ertical Borehole Flo w
The direction and rate of borehole-watermovement were measured with a high-resolutionheatpulse flowmeter. The heatpulse flowmeteroperates by diverting nearly all flow to the center ofthe tool where a heating grid slightly heats a thinzone of water. If vertical borehole flow is occurring,the water moves up or down the borehole to one oftwo sensitive thermistors (heat sensors). When apeak temperature is recorded by one of the ther-mistors, a measurement of direction and rate is cal-culated by the computer collecting the loggingdata. The range of flow measurement is about 0.01to 1.5 gal/min in a 2- to 10-in. diameter borehole.Heatpulse-flowmeter measurements may beaffected by poor seal integrity between the bore-hole and the flowmeter or contributions of waterfrom storage within the borehole during pumping. Ifthe seal between the borehole and the heatpulseflowmeter is not complete, some water can bypassthe flowmeter, resulting in flow measurements thatare less than the actual rate. The quantity of waterbypassing the tool is a function of borehole sizeand shape and degree of fracturing. Although theheatpulse flowmeter is a calibrated tool, the dataprimarily are used as a relative indicator of fluid-producing zones.
Borehole T elevision Sur veys
Borehole television surveys were conductedby lowering a waterproof video camera down theborehole and recording the image on video tape.The depth indicated on the video image may notcorrespond exactly to the geophysical logsbecause of minor slippage (generally up to plus orminus 1 ft) of the video cable.
Interpretation of Borehole Geoph ysical Logs
Well 05MW04I (MG-1757)
A suite of borehole geophysical logs (fig. 3)was collected in well 05MW04I by the USGS onAugust 10, 2000. The caliper log shows the well is
151 ft deep and is cased to 28 ft below land surface(bls). The caliper log shows major fractures at 40-42, 56-60, 70-82, and 100 ft bls. The fluid-tempera-ture and fluid-resistivity logs indicate borehole flowand possible water-bearing zones at about 36, 70,106, 113, 124, 133, and 140 ft bls.
Heatpulse-flowmeter measurements were madeunder nonpumping conditions at 36, 46, 66, 95,124, and 142 ft bls (table 2). The geophysical logsand heatpulse-flowmeter measurements indicatecomplex water circulation in the borehole. Waterenters the upper part of the borehole at a rate of0.93 gal/min through a horizontal fracture at 40-42 ft bls and flows upward and downward. Waterflowing upward exits the borehole through ahorizontal fracture at 32 ft bls. Additional water(0.14 gal/min) enters the borehole through avertical fracture at 56-60 ft bls and flowsdownward. Water flowing downward in the upperpart of the borehole exits through a large verticalfracture at 70-82 ft bls (fig. 4). Water enters thelower part of the borehole at a rate of 0.18 gal/minthrough a horizontal fracture at 148 ft bls and flowsupward. Water flowing upward in the lower part ofthe borehole exits the borehole through horizontalfractures at 132 (0.04 gal/min) and 114 ft bls(0.02 gal/min) and through the large verticalfracture at 70-82 ft bls. A total of 0.89 gal/min exitsthe borehole through the fracture at 70-82 ft bls.The water-bearing fractures in well 05MW04I areat 32, 40-42, 56-60, 70-82, 114, 132, and148 ft bls; the principal water-bearing fractures areat 40-42 and 70-82 ft bls. Well 05MW04I wasscreened later from 74.5 to 84.5 ft below top ofcasing (btoc) to monitor the principle water-bearingfracture at 70-82 ft bls.
The borehole geophysical logs indicateupward and downward vertical gradients arepresent in the Stockton Formation at well05MW04I. The vertical gradient is upward above42 ft bls, downward between 42 and 82 ft bls, andupward below 82 ft bls.

9
Figure 3. Borehole geophysical logs for well 05MW04I (MG-1757), Willow Grove Naval Air Station/Joint Reserve Base, Horsham Township,Montgomery County, Pennsylvania.
0.3
EXPLANATION
BOREHOLE-FLOW MEASUREMENT
Circle at depth of flow measurement.Number is measured flow in gallonsper minute
UNDER NONPUMPING CONDITIONS—
DIRECTION OF VERTICAL BOREHOLEFLOW—Upward arrow indicates upward flow;
0.3
0.63
0.77
0.12
0.14
downward arrow indicates downward flow
CALIPER LOGHOLE DIAMETER,
IN INCHES
NATURAL GAMMA,IN COUNTS PER
SECOND
FLUIDTEMPERATURE, INDEGREES CELSIUS
SINGLE POINTRESISTANCE,
IN OHMS
FLUID RESISTIVITY,IN OHM-METERS
6 97 80
160
20
40
60
80
100
120
140
DE
PT
H, I
N F
EE
T B
ELO
W L
AN
D S
UR
FA
CE
45 555011.010.0 10.50 200100 300 1,500900
0.18
FLOW INTO BOREHOLE—Arrow pointing toward caliper logindicates flow into borehole. Number is
FLOW OUT OF BOREHOLE—Arrow pointing away from caliper logindicates flow out of borehole. Number is
(0.3)
(0.14)
(0.3)
(0.14)
(0.93)
(0.89)
(0.02)
(0.04)
(0.18)
WATER LEVEL—Measured in well at thetime of geophysical logging
estimated flow into borehole in gallons per
estimated flow out of borehole in gallons perminute.
minute.

10
Table 2. Heatpulse-flowmeter measurements made in well 05MW04I (MG-1757),Willow Grove Naval Air Station/Joint Reserve Base, Horsham Township,Montgomery County, Pennsylvania
Depth(feet below land surface)
Flow(gallons per minute)
Flowdirection
36 0.30 Up
46 .63 Down
66 .77 Down
95 .12 Up
124 .14 Up
142 .18 Up
Figure 4. Image from borehole television survey showing vertical fracture at 78 feetbelow land surface in well 05MW04I (MG-1757), Willow Grove Naval Air Station/JointReserve Base, Horsham Township, Montgomery County, Pennsylvania.
FRACTURE

11
Well 05MW05I (MG-1758)
A suite of borehole geophysical logs (fig. 5)was collected in well 05MW05I by the USGS onAugust 3, 2000. The caliper log shows the well is250 ft deep and is cased to 18 ft bls. The caliperlog shows major fractures at 52-58 and 142-148 ft bls. The fluid-temperature and fluid-resistiv-ity logs indicate borehole flow and possible water-bearing zones at about 44, 68, 112, 174, and190 ft bls.
Heatpulse-flowmeter measurements weremade under nonpumping conditions at 30, 47, 65,84, 100, 108, 124, 158, 180, 212, and 234 ft bls(table 3). On the basis of the geophysical logs andheatpulse-flowmeter measurements, water entersthe upper part of the borehole through a large verti-cal fracture at 52-58 ft bls (0.1 gal/min) and flowsdownward. Water also enters the borehole through
a horizontal fracture at 72 ft bls (0.3 gal/min) and avertical fracture at 114 ft bls (0.1 gal/min) and flowsdownward. Some water exits the borehole througha large vertical fracture at 142-148 ft bls(0.2 gal/min) (fig. 6). Additional water enters theborehole through a horizontal fracture at 174 ft bls(0.2 gal/min) and flows downward. Water exits theborehole through horizontal fractures at 192 and202-205 ft bls (0.3 gal/min) and 220-223 ft bls(0.2 gal/min). The water-bearing fractures in well05WM05I are at 52-58, 72, 114, 142-148, 174,192, 202-205, and 220-223 ft bls. The boreholegeophysical logs indicate a downward vertical gra-dient is present in the Stockton Formation at well05MW05I. Well 05MW05I was screened later from189.5 to 209.5 ft btoc to monitor the water-bearingfractures at 192 and 202-205 ft bls.
Table 3. Heatpulse-flowmeter measurements made in well 05MW05I (MG-1758),Willow Grove Naval Air Station/Joint Reserve Base, Horsham Township,Montgomery County, Pennsylvania
[—, no flow]
Depth(feet below land surface)
Flow(gallons per minute)
Flowdirection
30 0 —
47 0 —
65 .1 Down
84 .4 Down
100 1.3 Down
108 1.2 Down
124 .5 Down
158 1.3 Down
180 .5 Down
212 .2 Down
234 0 —
1 Flow rate may be affected by nearby pumping.

12
0.2
EXPLANATION
BOREHOLE-FLOW MEASUREMENT
Circle at depth of flow measurement.Number is measured flow in gallonsper minute.
UNDER NONPUMPING CONDITIONS—
DIRECTION OF VERTICAL BOREHOLEFLOW—Downward arrow indicates
0
0.1
0.5
0.3
0.5
0.2
0
CALIPER LOGHOLE DIAMETER,
IN INCHES
NATURAL GAMMA,IN COUNTS PER
SECOND
FLUIDTEMPERATURE, INDEGREES CELSIUS
SINGLE POINTRESISTANCE,
IN OHMS
FLUID RESISTIVITY,IN OHM-METERS
6 107 8 90
260
20
40
60
80
100
120
140
160
180
200
220
240
DE
PT
H, I
N F
EE
T B
ELO
W L
AN
D S
UR
FA
CE
45 6050 559 111010 1,000100 1,200 2,4001,800
Figure 5. Borehole geophysical logs for well 05MW05I (MG-1758), Willow Grove Naval Air Station/Joint Reserve Base, Horsham Township,Montgomery County, Pennsylvania.
0.4
0.3
0.2
0
FLOW INTO BOREHOLE—Arrow pointing toward caliper logindicates flow into borehole. Number
FLOW OUT OF BOREHOLE—Arrow pointing away from caliper logindicates flow out of borehole. Number
(0.2)
(0.2)
(0.3)
(0.2)
(0.3)
(0.1)
(0.3)
(0.2)
is estimated flow into borehole in gallonsper minute.
is estimated flow out of borehole in gallonsper minute.
WATER LEVEL—Measured in well at thetime of geophysical logging.
(0.1)downward flow.

13
Well 05MW12I (MG-1759)
A suite of borehole geophysical logs (fig. 7)was collected in well 05MW12I by the USGS onAugust 1, 2000. The caliper log shows the well is149 ft deep and is cased to 28 ft bls. The caliperlog shows major fractures at 88-92 and 109-112 ft bls. The fluid-temperature and fluid-resistiv-ity logs indicate borehole flow and possible water-bearing zones at about 109, 120, and 129 ft bls.
Heatpulse-flowmeter measurements weremade under nonpumping conditions at 49, 72, 81,96, 100, 116, 132, 138, and 146 ft bls (table 4). Onthe basis of the geophysical logs and heatpulse-flowmeter measurements, water enters the upperpart of the borehole at a rate of 1.48 gal/minthrough a vertical fracture at 36-38 ft bls (fig. 8) andflows downward. A minor quantity (less than0.1 gal/min) of the water flowing downward exitsthe borehole, probably through fractures at 62 and76 ft bls. Water also exits the borehole through thelarge vertical fracture at 88-92 ft bls (0.23 gal/min),but most water flowing downward exits the bore-hole through the large vertical fracture at 109-112 ft bls (1.42 gal/min total outflow). Water alsoenters the borehole near the bottom of the well(0.11 gal/min) and through a horizontal fracture at140 ft bls (0.08 gal/min) and flows upward. About
half the water flowing upward exits the boreholethrough a fracture at 119-126 ft bls (0.09 gal/min)and about half exits the borehole through the frac-ture at 109-112 ft bls (0.11 gal/min). The water-bearing fractures in well 05MW12I are at 36-38,76, 88-92, 109-112, 119-123, 140, and 150 ft bls;the principal water-bearing fractures are at 109-112 and 119-123 ft bls. Well 05MW12I wasscreened later from 103.5 to 113.5 ft btoc to moni-tor the principle water-bearing fracture at 109-112 ft bls.
The borehole geophysical logs indicateupward and downward vertical gradients arepresent in the Stockton Formation at well05MW12I. The vertical gradient is downward above112 ft bls and upward below 112 ft bls.
Figure 6. Image from borehole television survey showing vertical fracture at 142 feetbelow land surface in well 05MW05I (MG-1758), Willow Grove Naval Air Station/JointReserve Base, Horsham Township, Montgomery County, Pennsylvania.
FRACTURE
FRACTURE

14
0.2
0.1
1.5
1.2
0.2
CALIPER LOGHOLE DIAMETER,
IN INCHES
NATURAL GAMMA,IN COUNTS PER
SECOND
FLUIDTEMPERATURE, INDEGREES CELSIUS
SINGLE POINTRESISTANCE,
IN OHMS
FLUID RESISTIVITY,IN OHM-METERS
6 107 8 90
160
20
40
60
80
100
120
140
DE
PT
H, I
N F
EE
T B
ELO
W L
AN
D S
UR
FA
CE
20 5030 4010 1311 120 250125 500 2,5001,500
Figure 7. Borehole geophysical logs for well 05MW012I (MG-1759), Willow Grove Naval Air Station/Joint Reserve Base, Horsham Township,Montgomery County, Pennsylvania.
1.5
1.4
1.3
0.1
0.2
EXPLANATION
BOREHOLE-FLOW MEASUREMENT
Circle at depth of flow measurement.Number is measured flow in gallonsper minute
UNDER NONPUMPING CONDITIONS—
DIRECTION OF VERTICAL BOREHOLEFLOW—Upward arrow indicates upward flow;downward arrow indicates downward flow
FLOW INTO BOREHOLE—Arrow pointing toward caliper logindicates flow into borehole. Number is estimated
FLOW OUT OF BOREHOLE—Arrow pointing away from caliper logindicates flow out of borehole. Number is estimated
(1.4)
(1.5)
(1.5)
(0.1)
(0.1)
(0.2)
(1.4)
(0.1)
(0.1)
WATER LEVEL—Measured in well at thetime of geophysical logging
flow into borehole in gallons per minute.
flow out of borehole in gallons per minute.

15
Table 4. Heatpulse-flowmeter measurements made in well 05MW12I (MG-1759),Willow Grove Naval Air Station/Joint Reserve Base, Horsham Township,Montgomery County, Pennsylvania
Depth(feet below land surface)
Flow(gallons per minute)
Flowdirection
49 1.5 Down
72 1.5 Down
81 1.4 Down
96 1.2 Down
100 1.3 Down
116 .1 Up
132 .2 Up
138 .2 Up
146 .1 Up
Figure 8. Image from borehole television survey showing vertical fracture at 36 feet belowland surface in well 05MW12I (MG-1759), Willow Grove Naval Air Station/Joint ReserveBase, Horsham Township, Montgomery County, Pennsylvania.
FRACTURE

16
ANALYSIS OF VOLATILE ORGANICCOMPOUNDS IN THE AQUIFER MATRIX
Ground water flows in fractures in theunweathered part of the Stockton Formation. If achemical contaminant is released into the subsur-face, water flowing in fractures may contain dis-solved constituents from the release. A chemicalconcentration gradient is established between thewater flowing in the fracture and immobile porewater in the aquifer matrix, causing a transfer of thecontaminants from the fracture into the aquifermatrix by molecular diffusion (Parker and others,1994; Parker and Sterling, 1999). To determine theextent of this transfer at Site 5, a rock core wasobtained and sampled for VOC’s.
On September 8, 2000, a driller contracted bythe U.S. Navy drilled a core (MG-1760) at Site 5between wells 05MW01S and 05MW01I. This isthe area where analyses of soil and ground watershowed the highest concentration of VOC’s (Brownand Root Environmental, Inc., 1998, p. 7-9). Thesoil (weathered) zone extended from land surfaceto 23.5 ft bls. A 17-ft long core was recovered from23.5 to 40.5 ft bls (fig. 9). Three water-bearing frac-tures in the core were identified by iron and man-ganese oxide staining on the fracture faces. Onefracture was in mudstone at 30.8 ft bls, one fracture
was at the contact between mudstone and weath-ered coarse-grained sandstone at 35.6 ft bls, andone fracture was in unweathered coarse-grainedsandstone at 35.9 ft bls (fig. 10).
Three samples were obtained from eachwater-bearing fracture (fig. 10)—at the fractureface, 2 cm below the fracture, and 4 cm below thefracture. The rock was crushed, and approximately5 grams of sample was placed into a 40-milliliterseptum bottle with 1 gram of sodium bisulfate as apreservative. This procedure was done as quicklyas possible to minimize volatilization. The bottlewas sealed, weighed, packed in ice, and shipped tothe USGS laboratory in Denver, Colo., for analysis.All samples were analyzed within 14 days of sam-ple collection. Laboratory results are given intable 5.
All 15 compounds listed in table 5 weredetected. However, concentrations of 1,2-dichloro-ethane; trans-1,2-dichloroethene; ethyl benzene;meta-, ortho-, and para-xylene; methylene chlo-ride; and 1,1,2-trichloroethane were less than1 µg/kg when detected. Concentrations of benzene(from 0.39 to 3.3 µg/kg), 1,1-dichloroethene(1,1-DCE) (from 0.15 to 13 µg/kg), 1,1,1-trichloro-ethane (TCA) (from 0.17 to 22 µg/kg), and trichlo-roethylene (TCE) (from 0.092 to 9.6 µg/kg) were
Table 5. Analytical results for volatile organic compounds in samples from rock core MG-1760, Willow Grove Naval AirStation/Joint Reserve Base, Horsham Township, Montgomery County, Pennsylvania
[All concentrations are given in micrograms per kilogram; cm, centimeter; <, less than; E, estimated concentration]
Compound name
Mudstone Weathered sandstone Unweathered sandstone
Fractureface
2 cmbelow
fracture
4 cmbelow
fracture
Fractureface
2 cmbelow
fracture
4 cmbelow
fracture
Fractureface
2 cmbelow
fracture
4 cmbelow
fracture
Benzene 1.5 0.43 0.39 1.5 0.93 0.80 0.65 2.4 3.3
1,1-Dichloroethane 8.2 1.7 1.0 .64 .92 .63 .60 .56 <.07
1,2-Dichloroethane .26 <.1 <.1 <.1 <.1 <.1 <.1 <.1 <.1
1,1-Dichloroethene 13 3.0 2.4 .91 1.4 1.2 1.0 1.0 .15 E
cis-1,2-dichloroethene 3.0 .64 .50 .087 E .12 E .10 E .095 E .10 E <.1
trans-1,2-dichloroethene .069 E <.053 <.053 <.053 <.053 <.053 <.053 <.053 <.053
Ethyl benzene <.08 <.08 <.08 <.08 <.08 <.08 <.08 <.08 .090 E
meta- and para-Xylene <.15 <.15 <.15 <.15 <.15 <.15 <.15 <.15 .10 E
Methylene chloride .48 <.2 <.2 <.2 <.2 .084 E <.2 <.2 <.2
ortho-Xylene <.08 <.08 <.08 .19 E <.08 <.08 <.08 .38 .74
Tetrachloroethene 1.6 .59 2.2 <.07 .092 E <.07 <.07 <.07 <.07
1,1,1-Trichloroethane 22 4.9 4.7 1.2 1.8 1.3 1.2 1.2 .17 E
1,1,2-Trichloroethane .65 .15 E .13 E <.07 <.07 <.07 <.07 <.07 <.07
Trichloroethene 9.6 2.4 5.7 .45 .77 .57 .55 .56 .092 E
Toluene <.33 <.4 .50 E 14 4.4 5.9 3.0 32 86. E

17
Figure 9. Photographs of sections from rock core MG-1760, Willow Grove Naval Air Station/Joint ReserveBase, Horsham Township, Montgomery County, Pennsylvania.
MUDSTONE
SECTION OF CORE (MUDSTONE) SAMPLEDFOR VOLATILE ORGANIC COMPOUNDS
SECTION OF CORE (WEATHERED SANDSTONE)SAMPLED FOR VOLATILE ORGANIC COMPOUNDS
SECTION OF CORE (UNWEATHEREDSANDSTONE) SAMPLED FOR VOLATILE
WEATHERED SANDSTONE
UNWEATHERED SANDSTONE
ORGANIC COMPOUNDS

18
Figure 10. Geologic log of rock core MG-1760 and depths of sampled fractures, Willow GroveNaval Air Station/Joint Reserve Base, Horsham Township, Montgomery County, Pennsylvania.
23.5
25
30
35
40.5
27.5
32.5
37.5
MUDSTONE
SILTY, FINE-GRAINED
SANDSTONE
MUDSTONE
COARSE-GRAINED
SANDSTONE
EXPLANATION
GRADATIONAL CONTACT
SAMPLED FRACTURE
SAMPLED FRACTURE AT CONTACT
DE
PT
H, I
N F
EE
T B
ELO
W L
AN
D S
UR
FAC
E
— approximate location

19
detected in all samples. The highest concentra-tions detected were for toluene, which wasdetected at a concentration of 32 and 86 µg/kg inthe samples from unweathered sandstone at 2 and4 cm below the fracture, respectively.
Concentrations of VOC’s generally decreasedwith distance below the fracture in the mudstonesamples. Concentrations of benzene and tolueneincreased with distance below the fractures in theunweathered sandstone samples. No pattern wasevident in the weathered sandstone samples. Con-centrations of 1,1-DCE, TCA, and TCE were higherin the mudstone samples than in the samples fromthe other rocks. Concentrations of toluene werehigher in unweathered sandstone than in the otherrocks. The distribution pattern may be related tothe release history, which is unknown.
The volume of each compound per cubic footof aquifer material (mudstone, weathered sand-stone, and unweathered sandstone) can be deter-mined by the following method. A representativesection of the core was obtained with a diamondsaw so that the top and bottom were parallel andwere perpendicular to the sides. The diameter andlength of each core section were measured, and
the volume was calculated. Each core section wasweighed, and its density was calculated (table 6).The mass of each compound per cubic foot ofaquifer material can be calculated by multiplyingthe concentration in table 5 by the density in table 6and then by the weight per volume of the com-pound to obtain the volume. For example, to deter-mine the volume of TCE in 1 ft3 of mudstone, thegeometric mean concentration in mudstone(5.1 µg/kg) is multiplied by the density of mudstone(75 kg/ft3) to obtain the mass of TCE, which is382.5 µg. TCE weighs 1.46 kilograms per liter;therefore, 1 ft3 of mudstone containing a mass of382.5 µg of TCE contains 3.0X10⁻⁷ liters of TCE.The VOC concentration in the aquifer material isaffected by spatial variability in concentration,matrix and fracture porosity, and partitioningbetween the free and dissolved phases.
The presence of contaminants in the aquifermatrix suggests that the contaminants cannot eas-ily or rapidly be removed by water flowing in frac-tures. They may be a continuing source of low-levelcontamination to the ground-water system.
Table 6. Density of rock types in rock core MG-1760, Willow Grove NavalAir Station/Joint Reserve Base, Horsham Township, Montgomery County,Pennsylvania
Rock typeDensity
Kilograms per cubic foot Pounds per cubic foot
Mudstone 75.0 165.3
Weathered sandstone 58.2 128.3
Unweathered sandstone 70.2 154.6
20
EFFECT OF PUMPING HORSHAM WATERAND SEWER AUTHORITY
SUPPLY WELL 26 ON WATER LEVELS
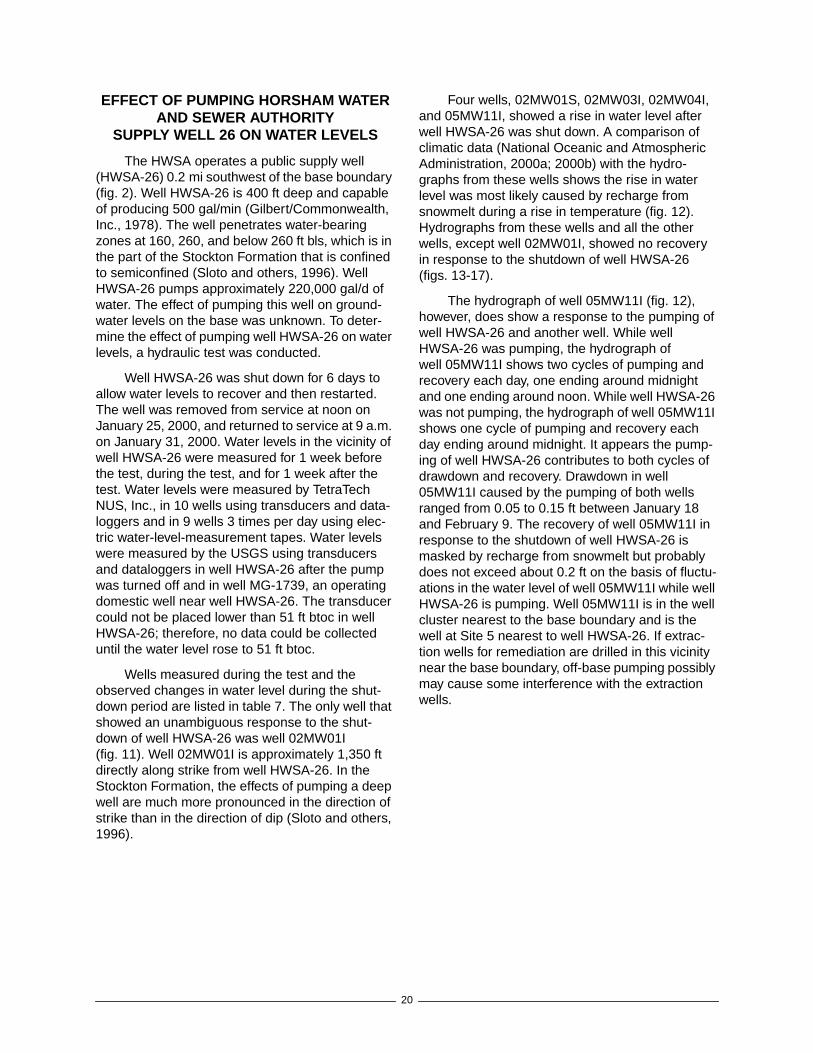
The HWSA operates a public supply well(HWSA-26) 0.2 mi southwest of the base boundary(fig. 2). Well HWSA-26 is 400 ft deep and capableof producing 500 gal/min (Gilbert/Commonwealth,Inc., 1978). The well penetrates water-bearingzones at 160, 260, and below 260 ft bls, which is inthe part of the Stockton Formation that is confinedto semiconfined (Sloto and others, 1996). WellHWSA-26 pumps approximately 220,000 gal/d ofwater. The effect of pumping this well on ground-water levels on the base was unknown. To deter-mine the effect of pumping well HWSA-26 on waterlevels, a hydraulic test was conducted.
Well HWSA-26 was shut down for 6 days toallow water levels to recover and then restarted.The well was removed from service at noon onJanuary 25, 2000, and returned to service at 9 a.m.on January 31, 2000. Water levels in the vicinity ofwell HWSA-26 were measured for 1 week beforethe test, during the test, and for 1 week after thetest. Water levels were measured by TetraTechNUS, Inc., in 10 wells using transducers and data-loggers and in 9 wells 3 times per day using elec-tric water-level-measurement tapes. Water levelswere measured by the USGS using transducersand dataloggers in well HWSA-26 after the pumpwas turned off and in well MG-1739, an operatingdomestic well near well HWSA-26. The transducercould not be placed lower than 51 ft btoc in wellHWSA-26; therefore, no data could be collecteduntil the water level rose to 51 ft btoc.
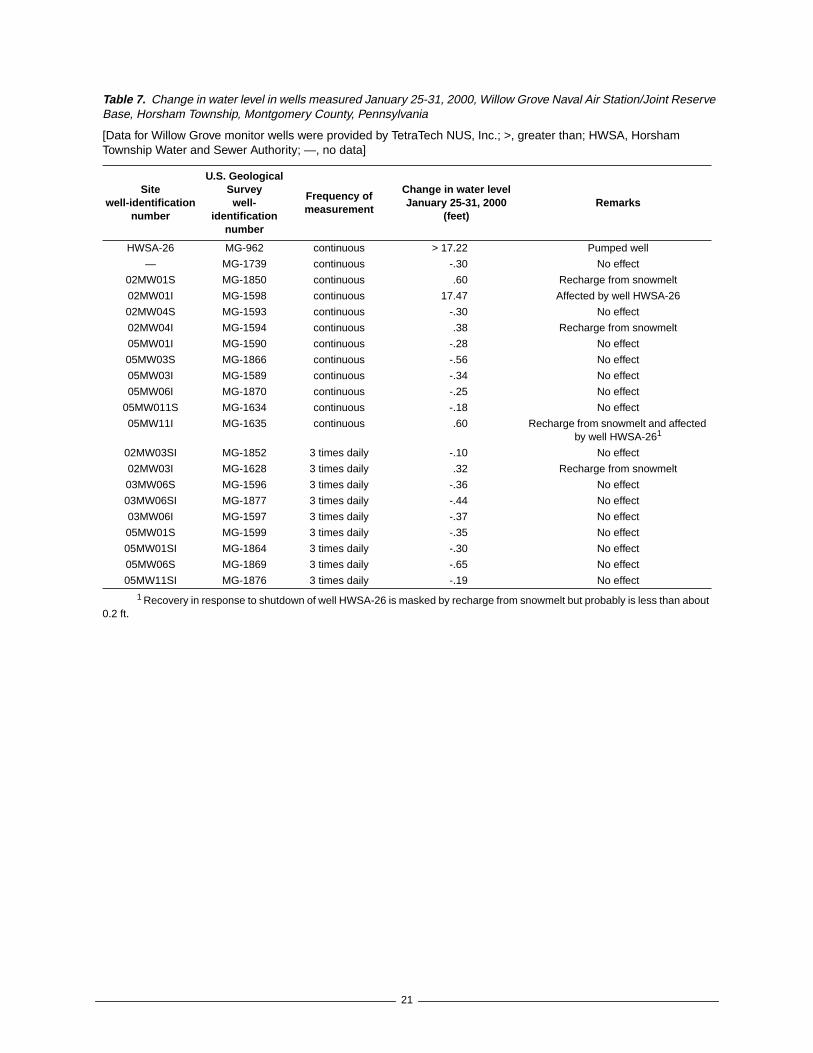
Wells measured during the test and theobserved changes in water level during the shut-down period are listed in table 7. The only well thatshowed an unambiguous response to the shut-down of well HWSA-26 was well 02MW01I(fig. 11). Well 02MW01I is approximately 1,350 ftdirectly along strike from well HWSA-26. In theStockton Formation, the effects of pumping a deepwell are much more pronounced in the direction ofstrike than in the direction of dip (Sloto and others,1996).
Four wells, 02MW01S, 02MW03I, 02MW04I,and 05MW11I, showed a rise in water level afterwell HWSA-26 was shut down. A comparison ofclimatic data (National Oceanic and AtmosphericAdministration, 2000a; 2000b) with the hydro-graphs from these wells shows the rise in waterlevel was most likely caused by recharge fromsnowmelt during a rise in temperature (fig. 12).Hydrographs from these wells and all the otherwells, except well 02MW01I, showed no recoveryin response to the shutdown of well HWSA-26(figs. 13-17).
The hydrograph of well 05MW11I (fig. 12),however, does show a response to the pumping ofwell HWSA-26 and another well. While wellHWSA-26 was pumping, the hydrograph ofwell 05MW11I shows two cycles of pumping andrecovery each day, one ending around midnightand one ending around noon. While well HWSA-26was not pumping, the hydrograph of well 05MW11Ishows one cycle of pumping and recovery eachday ending around midnight. It appears the pump-ing of well HWSA-26 contributes to both cycles ofdrawdown and recovery. Drawdown in well05MW11I caused by the pumping of both wellsranged from 0.05 to 0.15 ft between January 18and February 9. The recovery of well 05MW11I inresponse to the shutdown of well HWSA-26 ismasked by recharge from snowmelt but probablydoes not exceed about 0.2 ft on the basis of fluctu-ations in the water level of well 05MW11I while wellHWSA-26 is pumping. Well 05MW11I is in the wellcluster nearest to the base boundary and is thewell at Site 5 nearest to well HWSA-26. If extrac-tion wells for remediation are drilled in this vicinitynear the base boundary, off-base pumping possiblymay cause some interference with the extractionwells.
21
Table 7. Change in water level in wells measured January 25-31, 2000, Willow Grove Naval Air Station/Joint ReserveBase, Horsham Township, Montgomery County, Pennsylvania
[Data for Willow Grove monitor wells were provided by TetraTech NUS, Inc.; >, greater than; HWSA, HorshamTownship Water and Sewer Authority; —, no data]
Sitewell-identification
number
U.S. GeologicalSurveywell-
identificationnumber
Frequency ofmeasurement
Change in water levelJanuary 25-31, 2000
(feet)Remarks
HWSA-26 MG-962 continuous > 17.22 Pumped well
— MG-1739 continuous -.30 No effect
02MW01S MG-1850 continuous .60 Recharge from snowmelt
02MW01I MG-1598 continuous 17.47 Affected by well HWSA-26
02MW04S MG-1593 continuous -.30 No effect
02MW04I MG-1594 continuous .38 Recharge from snowmelt
05MW01I MG-1590 continuous -.28 No effect
05MW03S MG-1866 continuous -.56 No effect
05MW03I MG-1589 continuous -.34 No effect
05MW06I MG-1870 continuous -.25 No effect
05MW011S MG-1634 continuous -.18 No effect
05MW11I MG-1635 continuous .60 Recharge from snowmelt and affectedby well HWSA-261
02MW03SI MG-1852 3 times daily -.10 No effect
02MW03I MG-1628 3 times daily .32 Recharge from snowmelt
03MW06S MG-1596 3 times daily -.36 No effect
03MW06SI MG-1877 3 times daily -.44 No effect
03MW06I MG-1597 3 times daily -.37 No effect
05MW01S MG-1599 3 times daily -.35 No effect
05MW01SI MG-1864 3 times daily -.30 No effect
05MW06S MG-1869 3 times daily -.65 No effect
05MW11SI MG-1876 3 times daily -.19 No effect
1 Recovery in response to shutdown of well HWSA-26 is masked by recharge from snowmelt but probably is less than about0.2 ft.

22
Figure 11. Hydrographs from Horsham Water and Sewer Authority well 26 and well 02MW01I, January 14 toFebruary 9, 2000, Willow Grove Naval Air Station/Joint Reserve Base, Horsham Township, Montgomery County,Pennsylvania.
32
68
34
36
38
40
42
44
46
48
50
52
54
56
58
60
62
64
66
14 15 16 17 18 19 20 21 22 23 24 25 26 27 28 29 30 31 1 2 3 4 5 6 7 8 9January February
2000
32
54
34
36
38
40
42
44
46
48
50
52
WELL 02MW01I
HORSHAM WELL 26
DE
PT
H T
O W
ATE
R IN
WE
LL 0
2MW
01I,
IN F
EE
T B
ELO
W T
OP
OF
CA
SIN
G
DE
PT
H T
O W
ATE
R IN
HO
RS
HA
M W
ELL
26,
IN F
EE
T B
ELO
W T
OP
OF
CA
SIN
G
HORSHAM WELL 26NOT PUMPING
HORSHAM WELL 26PUMPING
HORSHAM WELL 26PUMPING
26.0
28.0
26.2
26.4
26.6
26.8
27.0
27.2
27.4
27.6
27.8
18 19 20 21 22 23 24 25 26 27 28 29 30 31 1 2 3 4 5 6 7 8 9January February
2000
30
56
32
34
36
38
40
42
44
46
48
50
52
54
HORSHAM WELL 26
WELL 05MW11I
DE
PT
H T
O W
ATE
R IN
WE
LL 0
5MW
11I,
IN F
EE
T B
ELO
W T
OP
OF
CA
SIN
G
DE
PT
H T
O W
ATE
R IN
HO
RS
HA
M W
ELL
26,
IN F
EE
T B
ELO
W T
OP
OF
CA
SIN
G
43MAXIMUM DAILY TEMPERATURE, IN DEGREES FAHRENHEIT
Figure 12. Hydrographs from Horsham Water and Sewer Authority well 26 and well 05MW11I, January 18 toFebruary 9, 2000, Willow Grove Naval Air Station/Joint Reserve Base, Horsham Township, MontgomeryCounty, Pennsylvania.
[Temperature data from the National Oceanic and Atmospheric Administration station at Neshaminy Falls,Pennsylvania.]
2228 35 32 22 24 30 33 35 3422 22 38 39 36 37 36 41 36 39 44 37
WATER-LEVEL RISE CAUSED BYRECHARGE FROM SNOW MELT
HORSHAM WELL 26NOT PUMPING
HORSHAM WELL 26PUMPING
HORSHAM WELL 26PUMPING

23
Figure 13. Hydrographs from wells 02MW01S, 02MW03SI, 05MW11S, and 05MW11SI,January 14 to February 7, 2000, Willow Grove Naval Air Station/Joint Reserve Base,Horsham Township, Montgomery County, Pennsylvania.
[Water-level data were provided by TetraTech NUS, Inc.]
DE
PT
H T
O W
ATE
R, I
N F
EE
T B
ELO
W T
OP
OF
CA
SIN
G
14 15 16 17 18 19 20 21 22 23 24 25 26 27 28 29 30 31 1 2 3 4 5 6 7January February
2000
9.0
14.0
9.5
10.0
10.5
11.0
11.5
12.0
12.5
13.0
13.5
WELL 02MW03SI—Circle indicates water-level measurement
WELL 05MW11SI—Circle indicates water-level measurement
WELL 05MW11S
WELL 02MW01S
HORSHAM WELL 26NOT PUMPING
EXPLANATION
HORSHAM WELL 26PUMPING
HORSHAM WELL 26PUMPING
MISSING DATA

24
Figure 14. Hydrographs from wells 02MW03I, 05MW01S, 05MW01SI, 05MW01I,05MW03S, 05MW06S, and 05MW06I, January 14 to February 7, 2000, WillowGrove Naval Air Station/Joint Reserve Base, Horsham Township, Montgomery County,Pennsylvania.
[Water-level data were provided by TetraTech NUS, Inc.]
DE
PT
H T
O W
ATE
R, I
N F
EE
T B
ELO
W T
OP
OF
CA
SIN
G
14 15 16 17 18 19 20 21 22 23 24 25 26 27 28 29 30 31 1 2 3 4 5 6 7January February
2000
18.0
26.0
18.5
19.0
19.5
20.0
20.5
21.0
21.5
22.0
22.5
23.0
23.5
24.0
24.5
25.0
25.5
WELL 05MW01SI—Circle indicates water-level measurement
WELL 05MW06S—Circle indicates water-level measurement
WELL 05MW01S—Circle indicates water-level measurement
WELL 05MW06I
WELL 05MW03S
WELL 05MW01I
WELL 02MW03I—Circle indicates water-level measurement
HORSHAM WELL 26NOT PUMPING
EXPLANATION
HORSHAM WELL 26PUMPING
HORSHAM WELL 26PUMPING

25
Figure 15. Hydrographs from wells 02MW04S, 03MW06SI, 03MW06I, 05MW03I, and05MW11I, January 14 to February 7, 2000, Willow Grove Naval Air Station/JointReserve Base, Horsham Township, Montgomery County, Pennsylvania.
[Water-level data provided were by TetraTech NUS, Inc.]
EXPLANATION
WELL 03MW06I—Circle indicates water-level measurement
WELL 03MW06SI—Circle indicates water-level measurement
WELL 05MW03I
WELL 05MW11I
WELL 02MW04S
DE
PT
H T
O W
ATE
R, I
N F
EE
T B
ELO
W T
OP
OF
CA
SIN
G
14 15 16 17 18 19 20 21 22 23 24 25 26 27 28 29 30 31 1 2 3 4 5 6 7January February
2000
26.0
31.0
26.5
27.0
27.5
28.0
28.5
29.0
29.5
30.0
30.5
HORSHAM WELL 26NOT PUMPING
HORSHAM WELL 26PUMPING
HORSHAM WELL 26PUMPING

26
Figure 16. Hydrographs from wells 02MW04I and 03MW06S, January 14 to February7, 2000, Willow Grove Naval Air Station/Joint Reserve Base, Horsham Township,Montgomery County, Pennsylvania.
[Water-level data were provided by TetraTech NUS, Inc.]
DE
PT
H T
O W
ATE
R, I
N F
EE
T B
ELO
W T
OP
OF
CA
SIN
G
14 15 16 17 18 19 20 21 22 23 24 25 26 27 28 29 30 31 1 2 3 4 5 6 7January February
2000
32.0
36.0
32.2
32.4
32.6
32.8
33.0
33.2
33.4
33.6
33.8
34.0
34.2
34.4
34.6
34.8
35.0
35.2
35.4
35.6
35.8
EXPLANATION
WELL 03MW06S—Circle indicates water-level measurement
WELL 02MW04I
HORSHAM WELL 26NOT PUMPING
HORSHAM WELL 26PUMPING
HORSHAM WELL 26PUMPING

27
WATER LEVELS
Water-level data provide important informationon the horizontal and vertical ground-water-flowdirections and gradients. Water-level data from amonitor well cluster (wells drilled in close proximity)screened at different depths provide information onvertical gradients and the direction of vertical flow.Water-level data from monitor wells screened in thesame depth interval provide information on hori-zontal gradients and the direction of horizontal flow.
Regional P otentiometric Surface
To understand how horizontal ground-waterflow at Site 5 fits into a regional perspective, it isnecessary to utilize water-level data from wellson-base and off-base. A map showing the regionalpotentiometric surface in the Stockton Formation atand in the vicinity of the Willow Grove NAS/JRBwas prepared by Sloto, Goode, and Way (2001).A part of the map, reproduced here as figure 18,shows a regional ground-water divide runningnortheast-southwest approximately through thecenter of Site 5. From this divide, ground water
flows both northwest toward Park Creek, a tributaryto Little Neshaminy Creek, and southeast towardPennypack Creek. The presence of this ground-water divide helps to explain the contaminant distri-bution patterns observed at Site 5; ground waterflows northwest and southeast from Site 5. Thelocation of this divide may shift to the northwest orthe southeast because of variations in aquiferrecharge and discharge. A shift in the divide to thenorthwest would cause more ground water atSite 5 to flow southeast. Likewise, a shift in thedivide to the southeast would cause more groundwater at Site 5 to flow northwest.
The high point on the divide (water-level ele-vations greater than 340 ft above sea level) wascentered around wells 05MW02S, 05MW03S, and05MW04S (fig. 18) during the time of water-levelmeasurements on October 7, 1999 (table 8). Fromthis high point, which appears as a ground-watermound, ground-water flow follows a radial pattern;the steepest gradients, however, are to the north-west and southeast.
Figure 17. Hydrograph from well MG-1739, January 18 to February 9, 2000,Willow Grove Naval Air Station/Joint Reserve Base, Horsham Township,Montgomery County, Pennsylvania.
DE
PT
H T
O W
ATE
R, I
N F
EE
T B
ELO
W T
OP
OF
CA
SIN
G
18 19 20 21 22 23 24 25 26 27 28 29 30 31 1 2 3 4 5 6 7 8 9January February
2000
9.0
12.0
9.5
10.0
10.5
11.0
11.5
HORSHAM WELL 26NOT PUMPING
HORSHAM WELL 26PUMPING
HORSHAM WELL 26PUMPING

28
Figure 18. Potentiometric surface and regional ground-water divide, October 7-8, 1999,Willow Grove Naval Air Station/Joint Reserve Base, Horsham Township, MontgomeryCounty, Pennsylvania. (Modified from Sloto, Goode, and Way (2001).)

29
Table 8. Water levels measured October 7, 1999, Willow Grove Naval Air Station/Joint Reserve Base, HorshamTownship, Montgomery County, Pennsylvania
Site identificationnumber
U.S. GeologicalSurveywell-
identificationnumber
Depth of wellscreen
(feet below landsurface)
Elevation of topof casing
(feet above sealevel)
Depth to water(feet below top
of casing)
Elevation of water level(feet above sea level)
02MW01S MG-1850 5-20 323.76 18.34 305.42
02MW01I MG-1598 70-80 325.28 82.27 243.01
02MW02S MG-1851 5-25 349.37 13.15 336.22
02MW03SI MG-1852 40-55 333.66 11.15 322.51
02MW03I MG-1628 140-150 333.55 19.37 314.18
02MW04S MG-1593 34-44 349.96 34.14 315.82
02MW04I MG-1594 105-115 349.54 40.45 309.09
03MW01S MG-1853 12-32 347.49 22.64 324.85
03MW01SI MG-1854 60-80 346.98 23.81 323.17
03MW01I MG-1855 159-179 346.57 10.15 336.42
03MW02S MG-1856 4.5-22.5 326.15 11.01 315.14
03MW02SI MG-1857 55-65 326.33 11.89 314.44
03MW02I MG-1629 134-144 326.38 4.40 321.98
03MW03S MG-1858 5-20 312.96 4.82 308.14
03MW03I MG-1859 148.5-168.5 314.08 -7.38 321.46
03MW04S MG-1860 5-35 324.49 2.75 321.74
03MW04SI MG-1861 60-80 323.87 12.72 311.15
03MW04I MG-1862 148-168 323.93 -8.00 331.93
03MW05S MG-1863 17-37 361.98 25.95 336.03
03MW05I MG-1595 82-92 360.93 25.34 335.59
03MW06S MG-1596 26-36 367.00 30.91 336.09
03MW06SI MG-1877 75-85 366.86 29.21 337.65
03MW06I MG-1597 140-150 366.82 30.05 336.77
03MW07S MG-1630 34-44 324.90 11.88 313.02
05MW01S MG-1599 12-32 364.11 24.87 339.24
05MW01SI MG-1694 74.5-84.5 363.99 25.33 338.66
05MW01I MG-1590 125-135 363.99 26.28 337.71
05MW02S MG-1865 10-30 365.48 25.19 340.29
05MW03S MG-1866 11-31 367.18 22.15 345.03
05MW03I MG-1589 118-128 367.35 29.12 338.23
05MW04S MG-1867 10-30 365.62 23.31 342.31
05MW05S MG-1868 20-40 359.92 21.71 338.21
05MW06S MG-1869 17.5-37.5 362.38 23.15 339.23
05MW06I MG-1870 74-84 361.08 22.98 338.10
05MW07S MG-1871 6-26 360.73 22.18 338.55
05MW07I MG-1872 74-84 360.20 22.94 337.26
05MW08S MG-1585 26-36 360.88 22.13 338.75
05MW08SI MG-1873 55-65 360.92 22.92 338.00
05MW08I MG-1586 89-99 361.02 23.07 337.95
05MW09S MG-1588 27-32 361.91 22.85 339.06
05MW09SI MG-1874 59-74 361.74 23.61 338.13
05MW09I MG-1587 96-106 362.11 24.37 337.74
05MW10S MG-1591 22-32 362.54 23.70 338.84
05MW10SI MG-1875 79-94 362.44 24.35 338.09
05MW10I MG-1592 116-126 362.48 24.84 337.64
05MW11S MG-1634 20-25 349.50 11.75 337.75
05MW11SI MG-1876 40-50 349.51 11.79 337.72
05MW11I MG-1635 139-149 348.96 30.74 318.22

30
Potentiometric Surface at Site 5
To prepare a map of the potentiometric sur-face at Site 5, it is necessary to use water-leveldata from Sites 2, 3, and 5 (fig. 1). Because of ver-tical head gradients at these sites, water-level datawere grouped into three depth ranges for contour-ing. Hydrographs from wells in the same depthrange are similar. For example, hydrographs for
wells 05MW08I (screened 89-99 ft bls), 05MW09I(screened 96-106 ft bls), and 05MW12I (screened103.5-113.5 ft bls) show identical water-level fluctu-ations (fig. 19). Horizontal gradients differ withdepth, and the rate and direction of ground-waterflow and contaminant movement is depth depen-dent.
Figure 19. Hydrographs from wells 05MW08I, 05MW09I, and 05MW12I, February 12to March 15, 2001, Willow Grove Naval Air Station/Joint Reserve Base, HorshamTownship, Montgomery County, Pennsylvania.
WAT
ER
-LE
VE
L A
LTIT
UD
E, I
N F
EE
T A
BO
VE
SE
A L
EV
EL
2001
WELL 05MW08I
WELL 05MW09I
WELL 05MW12I
15 20 25 28 5 10 15FEBRUARY MARCH
340.6
342.4
340.8
341.0
341.2
341.4
341.6
341.8
342.0
342.2
12

31
The potentiometric surface was mapped foreach of the three depth ranges of the aquifer. Thepotentiometric surface as defined by water levels inwells screened between 5 and 44 ft bls is shown onfigure 20. This interval is the shallowest of thethree intervals, and the potentiometric surface rep-resents the water table. The map shows a ground-
water mound around wells 05MW02S, 05MW03S,and 05MW04S. This represents the high point onthe regional ground-water divide. From this mound,the ground-water flow is radial. The hydraulic gradi-ent around this mound is relatively flat to the south-east and particularly to the northwest.
40°12′75°09′30″ 75°09′ 75°08′30″
40°11′30″
Base from U.S. Geological Survey Ambler 1:24,000, 1966
Figure 20. Potentiometric surface defined by water levels in wells screened between 5 and 44 feet below landsurface, October 7, 1999, Willow Grove Naval Air Station/Joint Reserve Base, Horsham Township, MontgomeryCounty, Pennsylvania.
324.85321.74
336.03
336.09
315.14
342.31
345.03
338.21338.84
338.55
337.75
339.24340.29
339.06339.23
338.75
336.22
315.82
305.42
335330
325
320
345 340
335330325
320315
310
POTENTIOMETRIC CONTOUR—Shows the315elevation of the potentiometric surface asdefined by measured water levels. Contour
338.21 WATER-LEVEL MEASUREMENT SITE—Symbol gives location of well. Number iselevation of water level measured in drilledwell in feet above sea level.
0 1,000 2,000 FEET
0 250 500 METERS
313.02
308.14 310315
interval is 5 feet. Elevation in feet abovesea level.

32
The potentiometric surface as defined bywater levels in wells screened between 40 and100 ft bls is shown on figure 21. The map shows avery flat hydraulic gradient at Site 5. Differences inthe elevation of the potentiometric surface are lessthan 2 ft. The area of flat hydraulic gradient
extends northwest to Site 3. The water level in well02MW01I (elevation of 243.01) in the southeasternpart of Site 2 is affected by the pumping of wellHWSA-26 and is lower than water levels in otherwells at Site 2.
311.15
337.65
335.59
314.44
323.17
338.09
337.26
337.72
338.66
338.13338.10
338.00
322.51
335330325
320
315
325
330
335
40°12′75°09′30″ 75°09′ 75°08′30″
40°11′30″
Base from U.S. Geological Survey Ambler 1:24,000, 1966
315
335.59
Figure 21. Potentiometric surface defined by water levels in wells screened between 40 and 100 feet below landsurface, October 7, 1999, Willow Grove Naval Air Station/Joint Reserve Base, Horsham Township, MontgomeryCounty, Pennsylvania.
243.01
0 1,000 2,000 FEET
0 250 500 METERS
POTENTIOMETRIC CONTOUR—Shows theelevation of the potentiometric surface asdefined by measured water levels. Contour
WATER-LEVEL MEASUREMENT SITE—Symbol gives location of well. Number iselevation of water level measured in drilledwell in feet above sea level.
interval is 5 feet. Elevation in feet abovesea level.

33
The potentiometric surface defined by waterlevels in wells screened between 105 and 179 ft blsis shown on figure 22. The map shows a steep
hydraulic gradient between Sites 5 and 2 and a rel-atively flat hydraulic gradient between Sites 5 and3.
336.42331.93
336.77
321.98
338.23
337.64
318.22
337.71
337.74
309.09 314.18
335330325
310
315
320325330335
40°12′75°09′30″ 75°09′ 75°08′30″
40°11′30″
Base from U.S. Geological Survey Ambler 1:24,000 1966
325
336.77
Figure 22. Potentiometric surface defined by water levels in wells screened between 105 and 179 feet below landsurface, October 7, 1999, Willow Grove Naval Air Station/Joint Reserve Base, Horsham Township, MontgomeryCounty, Pennsylvania.
0 1,000 2,000 FEET
0 250 500 METERS
321.46
POTENTIOMETRIC CONTOUR—Shows theelevation of the potentiometric surface asdefined by measured water levels. Contour
WATER-LEVEL MEASUREMENT SITE—Symbol gives location of well. Number iselevation of water level measured in drilledwell in feet above sea level.
interval is 5 feet. Elevation in feet abovesea level.

34
Vertical Head Gradients
Water-level hydrographs for well cluster05MW11 are shown on figure 23. The vertical flowgradient is downward from higher water levels(wells 05MW11S and 05MW11SI) to lower waterlevels (well 05MW11I). Wells 05MW11S (screened20-25 ft bls) and 05MW11SI (screened 40-50 ft bls) are screened in the water table, and thewater levels measured in these wells nearly areidentical.
The vertical head gradient varies with time.The variability in the vertical head gradient iscaused by a difference in the magnitude of water-level fluctuations between the shallow wells andthe deep well. The difference in water levelbetween August 9, 1999, and January 14, 2000,ranged from a difference of 27.93 ft on August 10,1999, to a difference of 17.43 ft on January 14,2000. The difference in the magnitude of water-level fluctuations is because of differences in lithol-ogy and aquifer storativity; the storativity at depth is
less than the storativity in the shallow zone. Thedifference in response to recharge from HurricaneFloyd (September 16, 1999) is shown on figure 23.The maximum water-level rise was 7.92 ft in well05MW11I and only 4.07 and 4.04 ft in wells05MW11S and 05MW11SI, respectively.
Water levels measured on October 7, 1999(table 8), showed downward vertical head gradi-ents for all well clusters at Sites 5 and 2. Thesemeasurements are consistent with most heatpulse-flowmeter measurements made by Conger (1997),which showed downward flow. The downward verti-cal gradient at Site 5 is what would be expected ina ground-water divide/recharge area. Gradientsranged from 0.01 at well cluster 05MW10 to 0.2 atcluster 05MW11. Most gradients are between 0.01and 0.026. The large downward gradient at wellcluster 02MW01 at Site 2 (62.41 ft of water-leveldifference) is attributable to the pumping of wellHWSA-26, which lowers the water level in well02MW01I.
Figure 23. Hydrographs from wells 05MW11S, 05MW11SI, and 05MW11I, August 9, 1999, to January 14,2000, Willow Grove Naval Air Station/Joint Reserve Base, Horsham Township, Montgomery County,Pennsylvania.
DE
PT
H T
O W
ATE
R, I
N F
EE
T B
ELO
W T
OP
OF
CA
SIN
G
10 15 20 25 31 5 10 15 20 25 30 5 10 15 20 25 31 5 10 15 20 25 30 5 10 15 20 25 31 5 10August September October November December January
1999 2000
8
46
10
12
14
16
18
20
22
24
26
28
30
32
34
36
38
40
42
44
WELL 05MW11I
WELL 05MW11SWELL 05MW11SI
RECHARGE FROM HURRICANE FLOYD

35
The same vertical gradient pattern wasobserved for all well clusters at Site 3 except forwell cluster 03MW06. The vertical head gradient isdownward from wells screened at shallow depths(screened 4.5 to 35 ft bls) to wells screened at anintermediate depth (55 to 80 ft bls) and upwardfrom wells with deep screens (134 to 179 ft bls) tothe intermediate and shallow screened wells. Thispattern was observed for well clusters 03MW01,03MW02, and 03MW04. At well cluster 03MW05, adownward vertical head gradient was observedfrom the shallow screened well to the intermediatedepth screened well; the well cluster lacks a deepscreened well. At well cluster 03MW03, an upwardvertical head gradient was observed from the deepscreened well to the shallow screened well; thewell cluster lacks a well screened at an intermedi-ate depth. The pattern at well cluster 03MW06,which is the well cluster in Site 3 closest to Site 5,is different than the others in Site 3. The verticalhead gradient is upward and downward from theintermediate zone, which has a higher head thaneither the shallow or deep zones.
SUMMARY
A hydrogeological investigation is being con-ducted as part of the U.S. Navy’s Installation Res-toration Program to address ground-watercontamination at the Willow Grove NAS/JRB inHorsham Township, Montgomery County, Pa. TheU.S. Navy requested the USGS provide technicalassistance. Specifically, the USGS was asked toconduct borehole geophysical logging, to collectand analyze water-level data, and to sample sec-tions of a rock core to determine the concentrationof VOC’s in the aquifer matrix. This information isbeing used to further identify the sources and path-ways of contamination and to evaluate manage-ment strategies for improving water quality.
The Willow Grove NAS/JRB and surroundingarea are underlain by the Stockton Formation,which forms a complex, heterogeneous aquiferwith partially connected zones of high permeability.The aquifer is composed of a series of gently dip-ping lithologic units with different hydraulic proper-ties, and permeability commonly differs from onelithologic unit to another.
Borehole geophysical logs were collected inthree monitor wells. Well 05MW04I was logged to adepth of 151 ft. The principal water-bearing frac-tures are at 40-42 and 70-82 ft bls. The boreholegeophysical logs indicate upward and downwardvertical gradients are present; the vertical gradient
is upward above 42 ft bls, downward between 42and 82 ft bls, and upward below 82 ft bls. Well05MW05I was logged to a depth of 250 ft. Thewater-bearing fractures in well 05WM05I are at 52-58, 72, 114, 142-148, 174, 192, 202-205, and 220-223 ft bls. The borehole geophysical logs indicate adownward vertical gradient is present. Well05MW12I was logged to a depth of 149 ft. Theprincipal water-bearing fracture is at 109-112 ft bls.The borehole geophysical logs indicate upwardand downward vertical gradients are present; thevertical gradient is downward above 112 ft bls andupward below 112 ft bls.
Contaminants in ground water flowing in frac-tures may move by molecular diffusion into immo-bile aquifer pore water under a chemicalconcentration gradient. To determine the extent towhich this occurred at Site 5, a 17-ft long rock corefrom 23.5 to 40.5 ft bls was obtained in the areawhere analyses of soil and ground water showedthe highest concentration of VOC’s. Three water-bearing fractures in the core were identified by ironand manganese oxide staining on the fracturefaces. One fracture was in mudstone at 30.8 ft bls,one fracture was at the contact between mudstoneand weathered coarse-grained sandstone at35.6 ft bls, and one fracture was in unweatheredcoarse-grained sandstone at 35.9 ft bls. Threesamples were analyzed from each water-bearingfracture—at the fracture face, 2 cm below the frac-ture, and 4 cm below the fracture. Fifteen VOC’swere detected. However, concentrations of 1,2-dichloroethane; trans-1,2-dichloroethene; ethylbenzene; meta-, ortho-, and para-xylene; methyl-ene chloride; and 1,1,2-trichloroethane were lessthan 1 µg/kg when detected. Concentrations ofbenzene (from 0.39 to 3.3 µg/kg), 1,1-DCE (from0.15 to 13 µg/kg), TCA (from 0.17 to 22 µg/kg), andTCE (from 0.092 to 9.6 µg/kg) were detected in allsamples. The highest concentrations detectedwere for toluene, which was detected at a concen-tration of 32 and 86 µg/kg in the samples fromunweathered sandstone at 2 and 4 cm below thefracture, respectively.
Concentrations of VOC’s generally decreasedwith distance below the fracture in the mudstonesamples. Concentrations of benzene and tolueneincreased with distance below the fracture in theunweathered sandstone samples. No pattern wasevident in the weathered sandstone samples. Con-centrations of 1,1-DCE, TCA, and TCE were higherin the mudstone samples than in the samples fromthe other rocks. Toluene concentrations were

36
higher in unweathered sandstone than in the otherrocks. The distribution pattern may be related tothe release history, which is unknown.
The presence of contaminants in the aquifermatrix suggests that the contaminants cannot eas-ily or rapidly be removed by water flowing in frac-tures. Contaminants in the matrix may be a con-tinuing source of low-level contamination to theground-water system.
The effect of the pumping of well HWSA-26,0.2 mi southwest of the base boundary, on ground-water levels on the base was determined by con-ducting a hydraulic test. Well HWSA-26 was shutdown for 6 days to allow water levels to recover andthen restarted. Water levels in the vicinity of wellHWSA-26 were measured for 1 week before thetest, during the test, and for 1 week after the test.Water levels were measured in well HWSA-26 and11 other wells using transducers and dataloggersand in 9 wells 3 times per day using electric water-level-measurement tapes.
The only well that showed an unambiguousresponse to the shutdown of well HWSA-26 waswell 02MW01I, which is directly along strike fromwell HWSA-26. Four wells, 02MW01S, 02MW03I,02MW04I, and 05MW11I, showed a rise in waterlevel that occurred after well HWSA-26 was shutdown. A comparison of climatic data with thehydrographs from these wells showed the rise inwater level was most likely caused by rechargefrom snowmelt during a rise in temperature. Therecovery of well 05MW11I in response to the shut-down of well HWSA-26 was masked by rechargefrom snowmelt but probably does not exceed about0.2 ft. The water level in well 05MW11I showed aresponse to the pumping of well HWSA-26 thatranged from 0.5 to 0.15 ft. Well 05MW11I is in thewell cluster nearest to the base boundary and isthe well at Site 5 nearest to well HWSA-26. Ifextraction wells for remediation are drilled in thisvicinity near the base boundary, off-base pumpingpossibly may cause some interference with theextraction wells.
A map of the regional potentiometric surfaceat and in the vicinity of the Willow Grove NAS/JRBshows a regional ground-water divide runningnortheast-southwest approximately through thecenter of Site 5. From this divide, ground waterflows both northwest toward Park Creek and south-east toward Pennypack Creek. The high point onthe divide was centered around wells 05MW02S,05MW03S, and 05MW04S during the time of
water-level measurements on October 7, 1999.From this high point, which appears as a ground-water mound, ground-water flow is radial; thesteepest gradients, however, are to the northwestand southeast.
Three potentiometric-surface maps were pre-pared using water-level data from Sites 2, 3, and 5.Because of vertical head gradients at these sites,water-level data were grouped into three depthranges for contouring. Horizontal gradients differwith depth, and the rate and direction of ground-water flow and contaminant movement varies withdepth. The potentiometric-surface map based onwater levels measured in wells screened between5 and 44 ft bls shows a ground-water moundaround wells 05MW02S, 05MW03S, and05MW04S. This represents the high point on theregional ground-water divide. From this mound,horizontal ground-water flow follows a radial pat-tern. The hydraulic gradient around this mound isrelatively flat to the southeast and particularly tothe northwest. The potentiometric-surface mapbased on water levels measured in wells screenedbetween 40 and 100 ft bls shows a very flathydraulic gradient at Site 5. Differences in the ele-vation of the potentiometric surface are less than2 ft. The area of flat hydraulic gradient extendsnorthwest to Site 3. The water level in well02MW01I (altitude of 243.01) in the southeasternpart of Site 2 is affected by the pumping of wellHWSA-26 and is much lower than water levels inother wells at Site 2. The potentiometric-surfacemap based on water levels measured in wellsscreened between 105 and 179 ft shows a steephydraulic gradient between Sites 5 and 2 anda relatively flat hydraulic gradient between Sites 5and 3.
Water levels measured on October 7, 1999,showed downward vertical head gradients for allwell clusters at Sites 5 and 2. Gradients at Site 5ranged from 0.01 at well cluster 05MW10 to 0.2 atwell cluster 05MW11. Most gradients werebetween 0.01 and 0.026. The downward verticalgradient at Site 5 is what would be expected in aground-water divide/recharge area.
Except for well cluster 03MW06, the samevertical gradient pattern was observed for all wellclusters at Site 3. The vertical head gradient isdownward from wells screened at shallow depths(screened 4.5 to 35 ft bls) to wells screened at anintermediate depth (55 to 80 ft bls) and upwardfrom wells with deep screens (134 to 179 ft bls) tothe intermediate and shallow screened wells. This

37
pattern was observed for well clusters 03MW01,03MW02, and 03MW04. At well cluster 03MW05, adownward vertical head gradient was observedfrom the shallow screened well to the intermediatedepth screened well; the well cluster lacks a deepscreened well. At well cluster 03MW03, an upwardvertical head gradient was observed from the deepscreened well to the shallow screened well; thewell cluster lacks a well screened at an intermedi-ate depth. The pattern at well cluster 03MW06,which is the well cluster in Site 3 closest to Site 5,is different than the others in Site 3. The verticalhead gradient is upward and downward from theintermediate zone, which has a higher water levelthan either the shallow or deep zones.
The vertical head gradient varies with time.The variability is caused by a difference in the mag-nitude of water-level fluctuations between the shal-low wells and deep fractures. The difference in themagnitude of water-level fluctuations is because ofdifferences in lithology and aquifer storativity. Thestorativity at depth is less than the storativity in theshallow zone.
REFERENCES CITED
Brown and Root Environmental, Inc., 1998, Phase IIremedial investigation report for NASJRBWillow Grove, Pennsylvania: King of Prussia,Pa. [variously paginated].
_____1997, Phase II remedial investigationworkplan for NASJRB Willow Grove,Pennsylvania: King of Prussia, Pa.[variously paginated].
Conger, R.W., 1997, Evaluation of geophysical logs,phase I, at Willow Grove Naval Air Station,Montgomery County, Pennsylvania: U.S.Geological Survey Open-File Report 97-631,48 p.
_____1999, Evaluation of geophysical logs, phaseII, at Willow Grove Naval Air Station JointReserve Base, Montgomery County,Pennsylvania: U.S. Geological Survey Open-File Report 99-73, 14 p.
Gilbert/Commonwealth, Inc., 1978, Hydrogeologicreport well 26: Reading, Pa. [variouslypaginated].
Halliburton NUS Environmental Corporation, 1993,Remedial investigation report for sites 1, 2, 3,and 5, Naval Air Station, Willow Grove,Pennsylvania: Wayne, Pa. [variouslypaginated].
Keys, W.S., 1990, Borehole geophysics applied toground-water investigations: U.S. GeologicalSurvey Techniques of Water-ResourcesInvestigations, book 2, chap. E2, 150 p.
National Oceanic and Atmospheric Administration,2000a, Climatalogical Data PennsylvaniaJanuary 2000: v. 105, no. 1, 40 p.
_____2000b, Climatalogical Data PennsylvaniaFebruary 2000: v. 105, no. 2, 40 p.
Parker, B.L., Gillham, R.W., and Cherry, J.A., 1994,Diffusive disappearance of immiscible-phaseorganic liquids in fractured geologic media:Ground Water, v. 32, no. 6, p. 805-820.
Parker, B.L., and Sterling, S.N., 1999, Fieldverification of TCE, matrix diffusion in afractured sandstone and implications fornatural attenuation and remediation:Proceedings of the International symposiumon dynamics of fluids in fractured rocks,p. 175-177.
Rima, D.R., Meisler, Harold, and Longwill, Stanley,1962, Geology and hydrology of the StocktonFormation in southeastern Pennsylvania:Pennsylvania Geological Survey, 4th ser.,Water Resource Report 14, 111 p.
Sloto, R.A., Goode, D.J., and Frasch, S.M., 2002,Interpretation of borehole geophysical logs,aquifer-isolation tests, and water quality,supply wells 1 and 2, Willow Grove Naval AirStation/Joint Reserve Base, HorshamTownship, Montgomery County, Pennsyl-vania: U.S. Geological Survey Water-Resources Investigations Report 01-4264,64 p.
Sloto, R.A., Goode, D.J., and Way, J.C., 2001,Altitude and configuration of the regionalpotentiometric surface, Willow Grove NavalAir Station/Joint Reserve Base and vicinity,Horsham Township, Montgomery County,Pennsylvania, October 7-8, 1999: U.S.Geological Survey Open-File Report01-149, 1 pl., scale 1:24,000.
Sloto, R.A., Macchiaroli, Paola, and Towle, M.T.,1996, Geohydrology of the StocktonFormation and cross-contamination throughopen boreholes, Hatboro Borough andWarminster Township, Pennsylvania: U.S.Geological Survey Water-ResourcesInvestigations Report 96-4047, 49 p.