hydrogeology, hydrogeochemistry, and spoil settlement … · kentucky geological survey donald c....
TRANSCRIPT

KENTUCKY GEOLOGICAL SURVEYDonald C. Haney, State Geologist and DirectorUNIVERSITY OF KENTUCKY, LEXINGTON
HYDROGEOLOGY, HYDROGEOCHEMISTRY,AND SPOIL SETTLEMENT AT A LARGEMINE-SPOIL AREA IN EASTERNKENTUCKY: STAR FIRE TRACT
David R. Wunsch, James S. Dinger, Page B. Taylor,Daniel I. Carey, and C. Douglas R. Graham
REPORT OF INVESTIGATIONS 10 Series XI, 1996

DISCLAIMER
The Kentucky Geological Survey provides online versions of its publications as a publicservice. Publications are provided as Adobe PDF (portable document format) files. Hard-copy versions are available for purchase by contacting the Survey at:
Kentucky Geological SurveyPublication Sales Office228 Mining and Mineral Resources BuildingUniversity of KentuckyLexington, Kentucky 40506-0107
Phone: 606-257-5500Fax: 606-257-1147
Selected KGS reports published before 1999 have been scanned and converted to PDFformat. Scanned documents may not retain the formatting of the original publication. Inaddition, color may have been added to some documents to clarify illustrations; in thesecases, the color does not appear in the original printed copy of the publication. Everyeffort has been made to ensure the integrity of the text. KGS maps and charts are suppliedeither whole or in part and some are too large to be printed on most plotters. Open-filereports are reproduced from the best available copy provided by the author, and have notundergone KGS technical or editorial review.
The Kentucky Geological Survey disclaims all warranties, representations, orendorsements, expressed or implied, with regard to the information accessed from, or via,this server or the Internet.

UNIVERSITY OF KENTUCKYDr. Charles T. Wethington, Jr., PresidentDr. Fitzgerald Bramwell, Vice President for Research and
Graduate StudiesJack Supplee, Director, Administrative Affairs, Research
and Graduate Studies
KENTUCKY GEOLOGICAL SURVEYADVISORY BOARDKenneth Gibson, Chairman, MadisonvilleWilliam W. Bowdy, Fort ThomasSteve Cawood, PinevilleLarry R. Finley, HendersonHugh B. Gabbard, RichmondRon D. Gilkerson, LexingtonDr. Wallace W. Hagan, LexingtonPhil M. Miles, LexingtonW.A. Mossbarger, LexingtonHenry A. Spalding, HazardJacqueline Swigart, LouisvilleDavid A. Zegeer, LexingtonRalph N. Thomas, Emeritus Member, OwensboroGeorge H. Warren, Jr., Emeritus Member, Owensboro
KENTUCKY GEOLOGICAL SURVEYDr. Donald C. Haney, State Geologist and DirectorDr. John D. Kiefer, Assistant State Geologist for Adminis-
trationDr. James C. Cobb, Assistant State Geologist for Research
ADMINISTRATIVE DIVISIONPersonnel and Finance Section:James L. Hamilton, Administrative Staff Officer IIJackie Perrelli, Administrative Staff Officer
Clerical Section:Jody L. Cruse, Staff Assistant VIIKimberly B. Stroth, Staff Assistant VIJuanita G. Smith, Staff Assistant V, Henderson Office
Office of Communications and Technology Transfer:Dr. Carol L. Ruthven, Geologist V, ManagerMargaret Luther Smath, Geologic Editor IIITerry D. Hounshell, Chief Cartographic IllustratorMichael L. Murphy, Principal Drafting TechnicianGwenda K. Rulo, Drafting TechnicianShirley D. Dawson, Staff Assistant V
Well Sample and Core Repository:Patrick J. Gooding, Geologist IV, ManagerRobert R. Daniel, Laboratory Technician B
Office of Geologic Information:Bart Davidson, Geologist IV, ManagerRichard A. Smath, Geologist III, ESIC CoordinatorKevin J. Wente, Geological TechnicianWilliam A. Briscoe III, Publication Sales Supervisor
Roger S. Banks, Account Clerk VLuanne Davis, Staff Assistant IVTheola L. Evans, Staff Assistant IV
Computer and Laboratory Services Section:Steven J. Cordiviola, HeadRichard E. Sergeant, Geologist VJoseph B. Dixon, Systems ProgrammerJames M. McElhone, Senior Systems Analyst ProgrammerHenry E. Francis, Associate ScientistKaren Cisler, Senior Research AnalystJanet M. Royer, Senior Research AnalystSteven R. Mock, Research AnalystAlice T. Schelling, Research AnalystMark F. Thompson, Research AnalystLisa A. Miles, Principal Laboratory TechnicianChristopher L. Parsons, Senior Laboratory TechnicianMary C. Koewler, Senior Laboratory Technician
GEOLOGICAL DIVISIONCoal and Minerals Section:Dr. Donald R. Chesnut, Jr., HeadDr. Garland R. Dever, Jr., Geologist VIIDr. Cortland F. Eble, Geologist VDr. Gerald A. Weisenfluh, Geologist VDavid A. Williams, Geologist V, Henderson OfficeDr. Stephen F. Greb, Geologist IVWilliam M. Andrews, Jr., Geologist IErnest E. Thacker, Geologist I
Geologic Mapping and Hydrocarbon Resources Section:Dr. James A. Drahovzal, HeadWarren H. Anderson, Geologist VDavid C. Harris, Geologist IVBrandon C. Nuttall, Geologist IVLance G. Morris, Geologist IIThomas N. Sparks, Geologist IAnna E. Watson, Geologist I
Water Resources Section:Dr. James S. Dinger, HeadDr. Daniel I. Carey, Hydrologist VJames C. Currens, Geologist VDr. David R. Wunsch, Geologist IVPhilip G. Conrad, Geologist IIIR. Stephen Fisher, Hydrologist IIIAlex W. Fogle, Hydrologist IIIRobert E. Andrews, Geologist IIC. Douglas R. Graham, Geologist IITimothy D. Montowski, Geological TechnicianGregory L. Secrist, Geological TechnicianD. Ian Thomas, Geological TechnicianSteven E. Webb, Geological TechnicianKathleen J. O’Leary, Program CoordinatorWendy S. Romain, Program Coordinator

CONTENTSPage
Abstract ......................................................................................................................................................................................... 1Introduction .................................................................................................................................................................................. 1
Geologic and Hydrogeologic Setting ...................................................................................................................................... 2Ground-Water Considerations ...................................................................................................................................................... 2
Aquifer Framework.................................................................................................................................................................. 2Infiltration Basin Design and Construction ............................................................................................................................. 3
Water Monitoring Methods........................................................................................................................................................... 5Surface-Water Flow Measurements ......................................................................................................................................... 5Monitoring Wells ..................................................................................................................................................................... 5Slug Tests ................................................................................................................................................................................. 7Water-Quality Sampling and Analysis ..................................................................................................................................... 7Dye Tracing ............................................................................................................................................................................. 8Spoil-Settlement Measurements .............................................................................................................................................. 8
Results and Discussion ................................................................................................................................................................. 8Recharge Observations ............................................................................................................................................................ 8Spring Discharge ..................................................................................................................................................................... 9Mass-Balance Calculations .................................................................................................................................................... 10Dye Tracing ........................................................................................................................................................................... 11Ground-Water Occurrence ..................................................................................................................................................... 12Slug Tests ............................................................................................................................................................................... 15Infiltration Basin .................................................................................................................................................................... 15Conceptual Model for Ground-Water Flow in Spoil ............................................................................................................. 16
Hydrogeochemistry .................................................................................................................................................................... 17Water-Mineral Reactions ....................................................................................................................................................... 17Interpretation of Spoil-Water Data ........................................................................................................................................ 18Spoil Settlement ..................................................................................................................................................................... 25
Summary ..................................................................................................................................................................................... 25References Cited ......................................................................................................................................................................... 28Appendix A: Data for Samples from Monitoring Wells ............................................................................................................. 30Appendix B: Data from Storm-Event Sampling......................................................................................................................... 48
ILLUSTRATIONSFigure Page
1. Map showing location of the Star Fire Mine ..................................................................................................................... 22. Schematic geologic column showing near-surface coals in the study area ....................................................................... 33. Before- and after-mining cross sections ............................................................................................................................ 44. Schematic cross section showing components of spoil significant to the development of an aquifer framework ............ 55. Schematic diagram showing the location of monitoring wells and instruments near the deep infiltration basin .............. 56. Map showing significant features at the Star Fire site ....................................................................................................... 67. Diagram showing design for monitoring wells 4 through 14 ............................................................................................ 78. Photographs showing settlement of the mine-spoil surface, as indicated by the movement of the cement surface seals........ 99. Map showing dye-trace detector locations around the infiltration basin ......................................................................... 11
10. Map showing outline of the spoil and elevation of basal topography ............................................................................. 1211. Contour map of the spoil water table ............................................................................................................................... 1312. Cross section through line A–A� ..................................................................................................................................... 1413. Precipitation and well hydrographs for monitoring wells 6, 9, and 11 from May 16 through June 19, 1991 ................. 1614. Precipitation and well hydrographs for monitoring well 7 for December 1993 .............................................................. 1615. Hydrographs for monitoring wells 9 and 14 for December 1993 .................................................................................... 1716. Histograms showing response of pool elevation in infiltration basin to precipitation events from May 16 through
June 19, 1991 ............................................................................................................................................................... 18

ILLUSTRATIONS (CONTINUED)Figure Page17. Graph showing relationship between flume stage and pool level during and after the May 29, 1991, storm ................. 1918. Digital terrain model showing the bedrock topography buried beneath the spoil ........................................................... 2019. Aerial photographs of the northwest corner of the reclaimed mine site .......................................................................... 2120. Conceptual model of ground-water flow in the spoil at the Star Fire site ....................................................................... 2221. Piper diagram showing the water types of samples from monitoring wells 2 through 14 and the main spring .............. 2322. Graph showing distribution of pH values for water samples collected from monitoring wells and SP 1 ....................... 2323. Graph showing saturation indices (IAP/K) for gypsum for water samples collected in June 1992 ................................2524. Maps showing mine spoil settlement around monitoring wells from July 1989–July 1992 and from August 1992–
November 1993 ............................................................................................................................................................ 27
TABLESTable Page
1. Discharge data from Long Fork flume, water year 1992 ................................................................................................. 102. Saturated thickness in monitoring wells in June 1991 ..................................................................................................... 153. Hydraulic conductivity in monitoring wells, measured by slug tests .............................................................................. 174. Water levels in wells near the infiltration basin ............................................................................................................... 195. Saturation indices (log IAP/K) determined by PHREEQE for minerals of interest ........................................................ 246. Measurements of settlement around monitoring wells .................................................................................................... 26

MISSION STATEMENTThe Kentucky Geological Survey at the University of Kentucky is a
State-mandated organization whose mission is the collection, preservation,and dissemination of information about mineral and water resources and thegeology of the Commonwealth. KGS has conducted research on the geol-ogy and mineral resources of Kentucky for more than 150 years, and hasdeveloped extensive public databases for oil and natural gas, coal, water,and industrial minerals that are used by thousands of citizens each year. TheSurvey’s efforts have resulted in topographic and geologic map coveragefor Kentucky that has not been matched by any other state in the Nation.
One of the major goals of the Kentucky Geological Survey is to makethe results of basic and applied research easily accessible to the public. Thisis accomplished through the publication of both technical and non-technicalreports and maps, as well as providing information through open-file re-ports and public databases.

HYDROGEOLOGY, HYDROGEOCHEMISTRY,AND SPOIL SETTLEMENT
AT A LARGE MINE-SPOIL AREA IN EASTERN KENTUCKY:STAR FIRE TRACT
David R. Wunsch, James S. Dinger,Page B. Taylor, Daniel I. Carey, and
C. Douglas R. Graham
ABSTRACT
An applied research program at the Star Fire surface mine in eastern Kentucky, owned and operated byCypress-AMAX Coal Co., defined spoil characteristics to develop and monitor water resources, which willhelp identify a reliable water supply for future property development. Water stored in the mine spoil mayprovide a usable ground-water supply, and the spoil could also be engineered to provide base flow to surface-water reservoirs.
Ground-water recharge enters the spoil by way of sinking streams, ground-water flow from bedrock incontact with the mine spoil, and a specially designed infiltration basin. Ground water discharges predomi-nantly from springs and seeps along the northwestern outslope of the spoil.
A conceptual model of ground-water flow, based on data from monitoring wells, discharge from springsand ponds, dye tracing, hydraulic gradients, and field reconnaissance, indicates that ground water movesslowly in the spoil interior, where it must flow down into the valley fills before discharging out of the spoil.Two saturated zones have been established: the first in the spoil interior, and the second in the valley fills thatsurround the main spoil body at lower elevations. The saturated zone in the valley fills contains fresher waterthan the zone in the spoil interior and exhibits more water-level fluctuation because of efficient rechargepathways along the spoil’s periphery at the spoil-highwall contact. The average saturated thickness of thevalley fill areas (30.1 ft) is approximately twice the average saturated thickness found in the spoil’s interior(15.4 ft). Spatial water-quality variations are consistent with those predicted in the proposed flow system.
Based on an estimated average saturated thickness of 21 ft for the entire site, the saturated spoil stores4,200 acre-ft (1.4 billion gallons) of water. Hydraulic-conductivity (K) values derived from slug tests rangefrom 2.0 × 10⁻⁶ to more than 2.9 × 10⁻⁵ ft/sec, and are consistent with hydraulic-conductivity data for otherspoil areas where similar mining methods are used.
Water samples taken from wells and springs indicate that the ground water is a calcium-magnesium-sulfatetype, differing mainly in the total concentration of these constituents at various locations. Mineral saturationindices calculated using the geochemical model PHREEQE indicate that most of the ground water is nearequilibrium with gypsum. Nearly all the water samples had pH measurements in a favorable range between6.0 and 7.0, indicating that the spoil does not produce highly acidic water.
Measurements of vertical displacement around the monitoring-well surface casings indicate that differen-tial settlement is occurring within the mine spoil. The most rapid settlement occurs in the most recently placedspoil near the active mining pit.
INTRODUCTION
Even though Kentucky’s high coal production rates haveremained steady, the mining-related work force has been re-duced approximately 33 percent since 1980. General unem-ployment in both coal-mining areas is estimated to be 25 per-cent because of the lack of economic development except formining. Economic diversification in eastern Kentucky is ham-pered by the lack of water supplies and flat usable land. Al-
though significant areas of relatively flat land are continu-ously being created by surface-mining operations throughoutthis area, the availability of water resources to sustain indus-trial development or agriculture remains questionable.
This study evaluates the potential development of waterresources in a thick and extensive spoil at the reclaimed siteto (1) define the hydrogeology of the site, leading to the defi-nition of the flow system, (2) characterize the ground-watergeochemistry to create baseline data for long-term monitor-

2
ing, (3) delineate temporal and spatial variation in water chem-istry, and (4) make a preliminary evaluation of spoil settle-ment to determine its constraints on future development. Thisstudy will contribute to the basic understanding of the hydro-geology and hydrogeochemistry of large spoil areas and re-sult in baseline data and technology that may be applicable toother reclaimed mine areas in eastern Kentucky and the Ap-palachian coal field.
GEOLOGIC AND HYDROGEOLOGIC SETTING
The Star Fire Mine encompasses parts of Breathitt, Perry,and Knott Counties and is located approximately 5 miles north-east of Hazard, Ky., off the Daniel Boone Parkway (Ky. High-way 80) (Fig. 1). Regional geology of the site is mapped onthe Noble (Hinrichs, 1978) and Vest (Danilchik andWaldrop, 1978) 7.5-minute geologic quadrangle maps. Fig-ure 2 is a generalized geologic column for the mine site. Thecoals being mined include the Hazard Nos. 7, 8, 9, and 10, allof which are part of the Breathitt Formation of Pennsylva-nian age. These coals are high-volatile bituminous and rangein thickness from 3 to 7 ft. Several zones contain rider coals,thin coal beds adjacent to the major beds, which are alsomined. The overburden consists of interbedded sandstones,shales, siltstones, and underclays. Some units are locally cal-careous, or may contain lenticular calcareous concretions(Spengler, 1977). In the process of mining, backfill (spoil) upto 300 ft thick is being created.
Weinheimer (1983) studied sandstone samples from fourcores representing the Breathitt Formation at a site approxi-mately 3 miles from the mine. Analyses revealed the follow-ing average component percentages (thus, the sum of the com-ponents does not equal 100 percent): quartz, 47.0 percent;
feldspar (mainly potassium feldspar), 29.0 percent; rock frag-ments, 11.9 percent; mica, 5.4 percent; and heavy minerals(pyrite, siderite), 0.5 percent. The majority of the cement wasdetermined to be ferroan calcite. Abundant authigenic kaolinitefilled pore spaces and formed reaction rims around feldspargrains. The occurrence of dolomite in Breathitt rocks is rare.Shales and claystones in the Breathitt Formation contain il-lite, kaolinite, and chlorite (Papp, 1976).
Analyses performed to obtain the initial mining permit(Soil and Material Engineers, Inc., 1982) predicted that theoverburden should not produce acid-mine drainage problemsbecause of the high net neutralization potential. The high neu-tralization potential was attributed to the abundance of car-bonate cements in the overburden sandstones. All pre-miningoverburden analyses show a potential acidity (PA) of less than5. PA is the acidity, expressed as equivalents of calcium car-bonate (CaCO3), calculated from pyritic sulfur content. If PAis less than 5, the stratum is generally considered a non-acidproducer, regardless of the neutralization potential (Sobek andothers, 1978).
Ground water is stored in the unmined bedrock that sur-rounds the mine. The dominant pathways for ground-watermovement are coal seams, and near-surface and regional frac-ture systems (Kipp and Dinger, 1991; Wunsch, 1992).
GROUND-WATER CONSIDERATIONS
AQUIFER FRAMEWORK
Discussions with mine personnel and direct observationof the mining process demonstrated that selected spoil-han-dling techniques have produced a rock framework conduciveto the development of an aquifer within the spoil. Several
Figure 1. Location of the Star Fire Mine. DB=Daniel Boone Parkway. MP=Mountain Parkway.
Hydrogeology, Hydrogeochemistry, and Spoil Settlement at the Star Fire Tract
75
64
MP
DB
8015
23
64
Cincinnati
Lexington
Ashland
Hazard
Eastern Kentucky Coal Field
Louisville
N
STAR FIRE MINE
KENTUCKY

3
previous papers have described, in detail, blasting effects,gravity settling and sorting, selective dumping, and compac-tion of the spoil and the implications of these factors in con-trolling the movement and storage of ground water at the site(Dinger and others, 1988, 1990; Wunsch and others, 1992).Therefore, these factors will be discussed only briefly here.
Figure 3 illustrates the transformation from the pre-min-ing bedrock topography to the landscape resulting from theextraction of the Hazard Nos. 7, 8, and 9 coal beds. Overbur-den is removed by alternating episodes of cast blasting andspoil removal by a 64-cubic-yard bucket dragline (cast blast-ing is a process in which explosives are placed in holes drilledalong the highwall, and the rock is directionally blasted and“cast” into the bottom of the pit; large, boulder-size chunksof rock typically accumulate at the bottom of the spoil as aresult). The lowest coal being mined is the Hazard No. 7. Theshale bedrock remaining in place after the removal of the coalcreates a pavement that forms a relatively impermeable lowerboundary for any water that accumulates in the spoil. Figure3b shows the continuous, coarse boulder zone created by castblasting the adjoining bedrock. Spoil covering the boulderlayer is placed by the dragline, electric shovels, and dumpingof large rocks by dump trucks (Kemp, 1990).
Figure 4 is a detailed cross section of the spoil; it illus-trates the spoil structure in which various mining methodsand spoil placements are being used. Unmined valleys are
sometimes filled with durable boulders, creating a zone ofhigher hydraulic conductivity, which provides subsurfacedrainage for the mine (Fig. 4, feature A). The continuouscoarse boulder zone on top of the unmined bedrock (Fig. 4,feature B) ranges from 15 to approximately 30 ft in thicknessand usually consists of the underburden of the Hazard No. 9coal. This spoil is cast-blasted into the open pit after the No.7 coal is removed. This zone, and similar boulder zones foundin valley fills, should permit the storage and rapid movementof ground water. Because of their thick and continuous na-ture, and their position on the bedrock floor, these zones shouldbe the most capable of providing and storing significantamounts of ground water.
The spoil material cast by the dragline produces numer-ous inclined layers of coarse aggregate above the boulder zone(see Fig. 4, feature C). These layers are created by gravitysorting of the spoil material when it is dumped from the drag-line bucket: the larger, heavier rock fragments separate fromthe finer material and accumulate from the bottom up alongthe outer edge of each spoil cone. As mining continues, thespoil cones and therefore the coarse layers coalesce to createinterconnected pathways for ground-water movement. Thesepathways may act as recharge routes from the land surface tothe boulder zone at the base of the fill, and the finer materialat the base of the spoil cones may behave as an extensivestorage reservoir for ground water as the spoil becomes satu-rated.
Another sequence of coarse inclined layers is also foundin the upper part of the spoil material, where spoil has beendumped by trucks (Fig. 4, feature F). The coarse rock layersare similar to the cast-dragline spoil, but are not as thick or asextensive.
In contrast to the coarse permeable zones, relatively im-permeable compacted zones are also produced by miningwithin and on top of the spoil (see Fig. 4, features D, E, andG). The final compacted graded land surface (see Fig. 4, fea-ture G) can inhibit surface water from infiltrating into thespoil material. Therefore, special spoil-handling techniqueshave been used to capture surface runoff for recharge to theground-water system within the spoil material.
INFILTRATION BASIN DESIGN AND CONSTRUCTION
An infiltration basin was constructed that would create adirect connection to the rubble zone resting on top of the No.7 coal underburden (Fig. 4), and would lead to an understand-ing of water movement and recharge potential of the spoilafter the infiltration basin was operational. An extensive rockdrain consisting of sandstone boulders was created to bypassall intermediate compacted zones within the spoil that mighttend to perch percolating ground water (see Fig. 4).
Directing surface runoff into the infiltration basin can havean additional benefit. Typically, surface-water runoff flowingfrom large spoil areas contains high amounts of suspended
Figure 2. Schematic geologic column showing near-surface coals in the study area. All units are part of theBreathitt Formation of Pennsylvanian age. Modified fromKemp (1990).
Ground-Water Considerations
Zone of activemining
(~300 feet)
Tiptop or Skyline coal zone(Hazard No. 10)
Hindman coal bed(Hazard No. 9)
Francis coal zone(Hazard No. 8)
Hazard coal zone(Hazard No. 7)
Hazard coal zone(Hazard No. 5)
sandstone
shale
coal
1 inch = 100 feet(coals not shown to scale)
Vertical Scale
Explanation

4
Figure 3. Before- and after-mining cross sections. Inset shows location of cross sections. Modified from Kemp (1990).
Hydrogeology, Hydrogeochemistry, and Spoil Settlement at the Star Fire Tract
Before mining
After mining
1600
1000
1200
1400
A
No. 9 coal
No. 7No. 8
A
N
A
SPOIL BOUNDARY
Location Map
A
Active Pit
1000
1200
1400
A1600
Dragline PadCast-blasted Spoil
Long ForkHollow Fill
A
sandstone
shale
coal
EXPLANATION
0
100
SCALE
1000
Fee
tF
eet

5
solids and sediment, which leads to sedimentation problemsin nearby streams. Surface water directed into the infiltrationbasin is filtered by the porous media as it percolates down tothe saturated zone. Introducing artificial recharge through theinfiltration basin may help minimize sedimentation problemsin streams surrounding the mine site. Sediment will most likelystill have to be removed from the bottom of the infiltrationbasin, however.
WATER MONITORING
METHODS
Methods used to characterize the hydroge-ology of the spoil include precipitation mea-surements, discharge measurements of streamsand springs, ground-water dye tracing, water-level measurements from monitoring wells, fall-ing-head slug tests, and water-quality analyses.
Figure 5 shows the locations of a precipita-tion gage, a discharge flume, monitoring wells,and a stilling well around the periphery of theinfiltration basin. The stilling well consists of apressure transducer to measure water stage in-stalled within a length of PVC well casing thatdescends to the bottom of the basin. Daily pre-cipitation data have been recorded at the sitewith a tipping-bucket device equipped with apulse recorder and data logger. The flume andstilling well measure discharge and stage, re-spectively, by converting direct head measure-ments collected by digital data loggers. The digi-
tal data loggers record data from pressure trans-ducers.
SURFACE-WATER FLOW
MEASUREMENTS
Surface-water flow was measured at re-charge and discharge points at the site. Flowmeasurements were made using a hand-heldmeter and summing the flow-velocity readingstaken at even increments along a cross sectionof the stream channel. This method yields amaximum accuracy of within 5 percent of ac-tual discharge (U.S. Geological Survey, 1980).The total mine outflow was measured at a flumelocated below the sediment-pond discharge. Theflume was equipped with digital stage record-ers, and discharge was determined by establish-ing a rating curve based on stage levels. Massbalance was calculated to determine missingcomponents of flow, using surface-water flow
data and flume measurements.
MONITORING WELLS
Monitoring wells were installed to study the establishmentand fluctuations of a water table in the spoil, characterize theground-water quality, determine the effectiveness of the deepinfiltration basin, and determine the hydraulic properties ofthe spoil. Installation of monitoring wells in deep spoil was
Figure 5. Schematic diagram showing the location of monitoring wellsand instruments near the deep infiltration basin.
Stilling Well
Flume
Precipitation Gage
Perimeter ofInfiltration Basin
MW 2
MW 5
MW 4
N
Spoil Boundary
(Not to scale)
Water Monitoring Methods
Figure 4. Schematic cross section showing components of spoilsignificant to the development of an aquifer framework. A=hollow fill.B=cast-blasted rubble. C=dragline spoil. D=dragline pad. E=temporaryhaul road. F=truck-dumped spoil. G=final graded land surface.

6
hampered by heterogeneity of the spoil, which contains par-ticle sizes ranging from clay to large sandstone boulders; lackof consolidation and spoil instability; and slump and collapsein the saturated zone.
The locations of monitoring wells at the site are shown inFigure 6. Three methods of monitoring-well installationwere attempted at the site; each succeeding drilling episodecontributed to an ultimately successful design that maintainedwell integrity in the dynamic subsurface environment of thethick mine spoil. Monitoring well (MW) 1 was drilled using
the cable-tool method. Problems with this technology were:unsuccessful attempts to drive steel casing to prevent collapseof the spoil, loss of borehole integrity when the drill bit en-countered the saturated zone, and extremely slow drilling rate.
Monitoring wells 2 and 3 were drilled using an air-rotarymethod, in which a welded steel casing was driven into thespoil behind the advancing drill bit to prevent collapse. Thismethod required pulling the drilling rods out in order to drivein the surface casing and weld on additional sections. Oncethe casing was installed, the production screen and pipe were
BOUNDARY
MW 14
MW 13
Long Fork
A
SPOIL
Line of cross section
STUDY AREA
KY.
MW 9
MW 11MW 12
MW 3
MW 1
MW 2
MW 5
MW 4
MW 6 Infiltrationbasin
Spring
Gap
MW 7
MW 10
MW 8
Chestnu
t
Bra
nch
Ponds
A
Sediment pond
Spring
Pond overflow
Monitoring well location
Diffuse recharge area
Stream recharge area
Axis of hollow fill
EXPLANATION
MW 14
0 1000 2000 3000 ft
SCALE
0 .5 1 km
SPOILBOUNDARY
Nor
th
Mine outflowflume
Flume
Figure 6. Significant features at the Star Fire site. The southeastern boundary of the mine spoil is approximatebecause of continuing mining.
Hydrogeology, Hydrogeochemistry, and Spoil Settlement at the Star Fire Tract

7
lowered into the hole. A gravel pack was placed around thescreen while the steel surface casing was pulled back. Wells 2and 3 were completed with 4-inch-diameter, flush-joint, sched-ule-40 PVC pipe. We subsequently discovered that settlementand shifting of the spoil caused failure and rupturing wherethe plastic casing was unprotected.
The third monitoring well design utilized an air-rotary drill-ing rig equipped with a pneumatic-hammer, under-reamingdrill bit with a hardened steel collar that expands as the ham-mer rotates below an advancing steel casing. The steel casingwas simultaneously driven as the drill bit advanced. The pro-tective casing was left in the hole for increased well integrityafter an initial pullback to expose the well screen and installthe gravel pack. Two-inch-diameter, schedule-40 stainless-steel screens were attached to schedule-40 PVC productionpipe, creating a “hybrid” monitoring well (Fig. 7). The PVCpipe was encased within the steel protective casing; thus, allexternal monitoring-well materials in contact with spoil ma-terial were made of steel. The annular space between the steelprotective casing and the PVC pipe was filled with bentonite,which allowed for slight plastic deformation of the produc-tion pipe as a result of spoil settlement and adjustment.
A total of 11 monitoring wells (wells 4 through 14), rang-
ing in depth from 54.7 to 239.0 ft, were installed as illus-trated in Figure 7, using the under-reaming bit. Various moni-toring wells were equipped with continuous data loggers torecord changes in the water table for extended periods of time.
SLUG TESTS
Falling-head slug tests determined the spatial distributionof hydraulic conductivity and the range of variability withinthe spoil. Nine tests were performed by injecting ground wa-ter derived from the spoil as quickly as possible into the moni-toring wells until the water level reached the top of the plasticcasing. Usually, the well casing was filled with water in lessthan a minute. An equilibrium water level was maintainedwhile any trapped air bubbles were allowed to escape fromthe water column. The instantaneous drop in head when thewater flow was cut off was recorded by a submerged pressuretransducer that stored the head data on a digital data logger.This technique is based on methods first described by Hvorslev(1951) in the development of “time-lag” permeability tests.Hvorslev’s method assumes that instantaneous changes inwater level occur at the initiation of a slug test, which was notthe case in this study. Even under ideal conditions, Hvorslev’smethod is not precise. However, it is generally considered anappropriate means of estimating the order of magnitude ofhydraulic conductivity (Thompson, 1987).
Hydraulic-conductivity values were calculated using thecomputer program TIMELAG (Thompson, 1987). This pro-gram contains several cases that are employed depending onthe well-configuration data provided. Unconfined aquiferconditions were assumed.
In some cases, wells took more water than could be in-jected by the pump (50 gallons per minute [gpm]). In thesewells, the hydraulic conductivity calculated represents a mini-mum value based on a water-injection rate of 50 gpm. Thestatic head level used for calculations was the maximum headlevel (top of casing) for each well, which provided for a mini-mum hydraulic conductivity value that would sustain the maxi-mum flow rate. Actual hydraulic conductivity values must behigher than these calculated values.
WATER-QUALITY SAMPLING AND ANALYSIS
Samples were collected to determine the chemical charac-ter of the surface and ground water at the site, provide inputdata for geochemical models and mass-balance studies, andestablish baseline data in order to monitor temporal and spa-tial variability in water quality. Samples were drawn and ana-lyzed from the largest spoil spring, monitoring wells, thestream in Chestnut Gap Branch (see Fig. 6), and the deepinfiltration basin. All wells were sampled quarterly be-ginning in the spring of 1991; this sampling scheme will con-tinue as funding permits. Some samples were taken fromsprings and streams to study recharge events. Field param-eters determined for most samples were temperature, specific
Figure 7. Design for monitoring wells 4 through 14.Drawing not to scale.
Water Monitoring Methods
6" steel protective casing
cement/bentonite surface seal
centralizer
2" schedule-40 PVC production pipe
bentonite grout
bentonite pellet seal
.01" slotted stainless-steel screen
tempered-steel drive shoe
sand pack

8
electrical conductance, oxidation-reduction potential (Eh), andpH in accordance with U.S. Geological Survey (1980) guide-lines for sampling and collecting. Data were collected utiliz-ing a flow-through cell that was closed to the atmosphere.Under these conditions, Eh measurements and subsequentqualitative interpretations of the redox conditions in naturalwaters could be made (Langmuir, 1971; Champ and others,1979). Water flow to the cell was provided by a 2-inch-diam-eter submersible pump, which was used for purging and sam-pling of the monitoring wells. Laboratory analysis of watersamples determined 30 total and dissolved metal concentra-tions and major anions.
DYE TRACING
Ground-water dye traces defined flow paths and traveltimes through the spoil. Dye-trace data from previous studies(Kemp, 1990) were also used to define ground-water flowpaths in the Spring Gap drainage area. The dye used for alltracing was Rhodamine WT, a fluorescent dye. It has beenwidely used in the study of karstic carbonate aquifers, and toa lesser extent in granular aquifers (Aulenbach and others,1978). Rhodamine WT exhibits many properties favorablefor ground-water tracing, including detectability at very lowconcentrations (parts per billion), low toxicity, a distinct peak-emission wavelength, chemical stability over a wide range ofpH values, photochemical and biological stability, and a lowrate of adsorption (Smart and Laidlaw, 1977). The most criti-cal of these factors for this study is its low rate of adsorption,because the dye is assumed to flow through an aquifer matrixrich in clays, organic-rich shales, and ferric hydroxide. Ferrichydroxide was found to adsorb significant quantities ofRhodamine WT in an experiment designed to test fluorescentdyes for use in ground-water tracing in underground coalmines (Aldous and Smart, 1987). Therefore, ample amountsof dye were used to allow for dilution and adsorption.
Dye traces determined the flow path of water entering thespoil through the deep infiltration basin, Chestnut Gap Branch(a stream that flows into the base of the spoil), and MW 1,which is located in the central area of the spoil (Fig. 6). Theflow path of ground water injected with dye at these loca-tions was determined by placing dye detectors, which con-sisted of permeable textile sacks filled with activated char-coal, at various points of discharge. The elutriant, or solutionused to desorb dye from the charcoal detectors, was analyzedwith a Turner model 10 filter fluorometer1.
SPOIL-SETTLEMENT MEASUREMENTS
Spoil visibly settled around the monitoring wells that wereinstalled in July 1990. There was vertical displacement be-tween the cement surface seal placed during monitoring-well
construction and the surface of the spoil. The spoil was notmonitored immediately after the well’s emplacement; there-fore, settlement could only be assessed for the period afterwell installation. The displacement between the cement sealand the spoil surface were calculated for each well by makingbaseline measurements in the four compass directions aroundthe seal of each well. The settlement values were then mea-sured in each direction, and an average value from the fourmeasurements was calculated to represent the spoil settlementat each well. Figure 8 shows an example of surface settle-ment at MW 4.
RESULTS AND DISCUSSION
RECHARGE OBSERVATIONS
Field reconnaissance of the study area revealed numerousplaces where streams and storm runoff recharge the spoil aqui-fer. Recharge at most of these sites is sporadic and often dif-ficult to quantify.
Several streams flow directly into the spoil at the base.The largest is Chestnut Gap Branch, a first-order stream witha watershed area of 0.32 mi2 (see Fig. 6). Data from Kemp(1990) show that Chestnut Gap Branch had an average flowrate of 0.73 cubic feet per second (cfs) during a 3-month pe-riod in 1989, which equates to a 0.47 million gallons per day(mgd) contribution to the total water moving through the spoil.
Recharge from bedrock aquifers occurs where minehighwalls are in contact with the spoil. Although primarypermeability is relatively low in the non-coal bedrock form-ing the highwall (Wunsch, 1992), near-surface and tectoni-cally induced fractures provide highly permeable zones thatdischarge ground water into the spoil (Kipp and Dinger, 1991).
In some cases, spoil handling resulted in boulders beingrandomly exposed at the surface. Small (less than 5 cm indiameter), discrete infiltration points, or “snakeholes,” wereobserved where boulders intersect the spoil surface. Stormrunoff flows into these discrete holes and rapidly disappearsinto the spoil. The amount of water that may ultimately reachthe saturated zone at the bottom of the spoil by way of thesediscrete points has not been determined, but is assumed to beminimal compared to the amount of water entering the spoilalong the edges of the main spoil body.
Aside from the few discrete infiltration points just de-scribed, infiltration through the spoil surface does not accountfor a significant amount of recharge because of the compactednature of the graded spoil. Drilling and excavation have shownthat the spoil is dry within a few inches of the surface, and athin sheet of mud quickly forms on the surface after a storm,which indicates that rainfall does not easily infiltrate the spoil.Limited data from a single percolation test performed in the
Hydrogeology, Hydrogeochemistry, and Spoil Settlement at the Star Fire Tract
1The use of brand names in this report is for information purposes only, and does not constitute an endorsement.

9
vicinity of MW 4 support this observation. The data reveal avery low infiltration rate (0.186 inch/hour) for water enteringthe spoil through the graded, compacted surface.
On a larger scale, the infiltration basin provides a pointsource for ground-water recharge. At the present time, thewatershed that supplies the basin is limited, and probablycontributes relatively insignificant quantities of water in rela-tion to the total amount stored in the spoil. The present water-shed surrounding the basin encompasses approximately 18acres, less than 2 percent of the total spoil area.
Recharge also occurs when precipitation falls directly onungraded dragline-cast spoil cones or other recently excavatedareas. We assumed the infiltration rate in these areas was higherthan the rate in the compacted spoil, but have not determinedquantitative recharge rates. The size of this spoil cone areavaries depending on the amount of grading that has occurred,but is extensive, often 2 million ft2 or larger (Dinger and oth-ers, 1988).
SPRING DISCHARGE
The most significant area of discharge from the spoil is inthe northwest corner, where a group of three springs is lo-cated at the toe of the Spring Gap Branch valley fill (Fig. 6).The springs appear at an elevation of approximately 1,040 ft.The discharge point for the largest of the springs (spring 1) islocated at the toe of a 130-ft-thick truck-dumped sandstonespoil that overrides a 45-ft-thick truck-dumped shale spoil.The shale spoil is purported to have a lower permeability thanthe sandstone spoil (Kemp, 1990). During times of extremelyhigh discharge, a number of small springs have been observedalong the toe of this lift at an elevation equivalent to or slightlyhigher than the main spring. Total discharge from the springsranges from approximately 1 to 5 mgd (Kemp, 1990).
Discharge was not observed from the toe of the Long Forkvalley fill. Mine personnel observed ground water discharg-ing directly into the sediment pond at a point below the pond’swater level.
Ground water also discharges from the spoil into the ac-tive dragline pit when the pit is at the level of the No. 7 coal.At times, ground water has discharged from the spoil into theactive pit at a rate high enough to require pumping on a dailybasis. On occasion, pumping rates have reached an estimated360,000 gpd.
Two ponds have been created to store water for dust con-trol. These ponds, whose locations are shown on Figure 6,are at the northwest corner of the spoil, above the springs.The bottom of the northern pond is on the underclay belowthe Hazard No. 7 coal. The bottom of the southern pond hasbeen excavated to a lower elevation and is completed withinthe shale unit below the No. 7 coal and the underclay. Bothponds are fed by water from the saturated spoil, as evidencedby the fact that the water level in the northern pond (1,125 ft),which has no overflow, is very similar to the water level ob-
Results and Discussion
Figure 8. Settlement of the mine-spoil surface, asindicated by the movement of the cement surface seals.
July 1990
July 1992

10
served in the nearest monitoring well not located over a val-ley fill (1,130 ft in MW 8). This similarity suggests that thepond is a surface expression of the water table. Also, althoughthese ponds are pumped to fill 10,000-gallon water trucks,the water is never depleted, and the ponds do not freeze in thewinter, which suggests a ground-water source. Finally, theelectrical conductance (2,100 microsiemens) of the waterflowing out of the overflow is similar to that of the spoil-fedsprings that discharge below it (Kemp, 1990); if the pondsreceived their water from surface runoff, the conductancevalues would be much lower because of dilution. Water over-flows from the lower pond throughout the year and cascadesdown the spoil face by way of a riprap-lined drainage chan-nel and contributes to the total mine outflow.
A large-capacity flume below the sediment pond gagesthe total water outflow (see Fig. 6 for location). Data have notbeen continuously collected because of periods of freezingand vandalism, but data were collected on 255 days of the1992 water year. Table 1 shows the discharge data for severalmonths during the 1992 water year. The monthly mean dis-charge ranges from 3.08 to 6.95 cfs (2.0 to 4.5 mgd). Themean and median discharge are both approximately 4 cfs (2.6mgd).
MASS-BALANCE CALCULATIONS
Mass balance was calculated to determine what part of thetotal mine outflow is provided by the spring that drains theLong Fork valley fill. The spring discharges below water levelin the sediment pond at the northwest corner of the spoil,making it impossible to take direct flow measurements orcollect water samples (Fig. 6). Flow measurements at all otheraccessible discharge points were made in June 1994 after arelatively dry spell when streams and springs were consid-ered at base flow. The flow components used in the calcula-tions consisted of the Long Fork flume, spring 1 (SP 1), Chest-nut Gap Branch, and the dust-control pond’s overflow (seeFig. 6). The cumulative flow for all components was deter-mined by the formula:
Qt=Qpo+ Qcb+ (Qsp– Qcb) + Qlf
whereQt=measured total mine discharge at the Long Fork flumeQpo=measured discharge of the overflow from the dust-
control pondQcb=measured discharge from Chestnut Gap BranchQsp=measured discharge at the Spring Gap springQlf=calculated discharge from the Long Fork spring.
The discharge from Chestnut Gap Branch was subtracted fromthe discharge from Spring Gap because Kemp (1990) dem-onstrated by dye tracing that the total streamflow in ChestnutGap Branch disappears into the base of the Spring Gap valleyfill and re-emerges at spring 1. Thus, it contributes to the flowmeasured at spring 1. The measured discharge for each site,in cfs, is as follows: Qt=2.23, Qpo=0.84, Qcb=0.20, Qsp=0.63.The flow contribution from the Long Fork drainage (Qlf) istherefore 0.76 cfs.
Mass balance for the total dissolved solid (TDS) load wascalculated to determine if the mass loads were consistent withthe discharge data. We could not collect a representative wa-ter sample from the submerged Long Fork spring. However,MW 10, located approximately 800 ft upgradient from thereported spring discharge site, produces water that is prob-ably representative of the water moving through the LongFork buried valley, which is the source of the water that dis-charges from the Long Fork spring. In addition, the coeffi-cient of variation for TDS values from MW 10 is 14 percent(Appendix A), which indicates that the data are consistent.We therefore used the TDS value from MW 10 in the mass-balance calculations.
TDS data for the flow components were determined fromsamples collected in June 1994, except for the sample fromMW 10, which was collected in August 1994 (see AppendixA). The mass-balance formula used in the calculation was:
QtCt=QpoCpo + QcbCcb + QspCsp + QlfClf
whereCt=TDS determined for water from the Long Fork flumeCpo=TDS of the overflow from the dust-control pondCcb=TDS of the discharge from Chestnut Gap BranchCsp=TDS of the discharge at the Spring Gap springClf=TDS of the Long Fork spring.
Hydrogeology, Hydrogeochemistry, and Spoil Settlement at the Star Fire Tract

11
TDS for water derived from the Long Fork spring was deter-mined by the formula:
CQ C Q C Q C Q C
Qlft t po po cb cb sp sp
lf=
− + +( )
The discharge value for SP 1 is 0.43 cfs, which is the mea-sured discharge (0.63 cfs) minus the recharge component sup-plied from Chestnut Gap Branch (0.20 cfs). Solving for Clfyields a TDS value of 2,082 mg/L. The TDS of the watersample from MW 10 was 2,113, which is in excellent agree-ment with the calculated value (a difference of less than 1.5percent). Moreover, the consistency of the mass-balance cal-culations suggests that the measurements for discharge sitesand the calculated discharge for the submerged spring drain-ing the Long Fork valley fill are reasonable. These calcula-tions show that almost all the total mine outflow can be ac-counted for by a summation of the ground-water dischargesites located in the northwestern area of the main spoil body.
DYE TRACING
Kemp’s 1990 dye trace delineated a flow path betweenwhere the Chestnut Gap stream disappears into the spoil andspring 1, located at the northwest corner of the spoil (see Fig.6). Kemp (1990) also determined an apparent velocity rang-ing from 0.014 to 0.009 ft/sec based on a straight-line traveldistance of 2,400 ft and a travel time between 49 and 73hours. Chestnut Gap Branch contains high levels of suspendedsediment after storms, but the consistently clear discharge atspring 1 indicates that sediment in surface water in ChestnutGap Branch is filtered by flowing through the spoil. This sug-gests that directing surface runoff from large spoil bodiesthrough the spoil itself could be an effective technology fortreating sediment problems in areas where the mineralogy ofthe overburden does not create significant acid mine-drain-age problems.
A second dye trace by Kemp in 1990 injected dye with a1,000-gallon slug of water into MW 1 (see Fig. 6). This dyewas not recovered in the springs in the northwest corner ofthe spoil. The dye may have flowed northeast into the LongFork drainage, but there were no adequate discharge pointsalong this flow route to monitor for dye. Dye was still visiblein MW 1 several months after it was introduced, indicatingthat ground-water movement is sluggish in the vicinity of MW1. The slow movement of ground water in the vicinity of MW1 and the lack of dye emerging from the springs also suggeststhat a low-permeability barrier may exist; or, ground-watermovement may be very slow between the interior spoil areaand the lower elevation valley-fill areas that encompass theSpring Gap, Chestnut Gap, and Long Fork drainage valleys.
Additional dye tracing in the spring of 1991 determinedthe flow path of recharge that enters the spoil through theinfiltration basin. Dye detectors were set at several locations
that were suspected as possible emergence areas for waterentering the infiltration basin. Figure 9 shows the locationsof the dye detectors. Three positive traces were detected westof the infiltration basin. These results are consistent with thedirection of flow indicated by hydraulic gradients and basaltopography in this area. One positive trace was also found ina pit excavated along the highwall-valley fill contact nearMW 6. Additional positive traces were found where waterperiodically flowed from the spoil slope between the elevationof the infiltration basin and the valley fill near MW 6. Thisindicates that not all of the water that flows into the infiltrationbasin penetrates vertically to the base of the spoil; it may bediverted laterally by low-permeability barriers within the spoil.
Spoil Boundary
MW 5
MW 2MW 4
MW 6
InfiltrationBasin
EXPLANATIONRoad
SumpPond
MW 3
MW 1
MW 12
MW 31300
12001300
1200
1300
12001300
1400
Nor
th
1200 ft8004000
SCALE
Monitoring well
Dye detector-negative
Dye detector-positive
1200
1300
Dye-trace vector or inferredground-water flow route
Location Map
Figure 9. Dye-trace detector locations around theinfiltration basin. Contours represent land-surfaceelevation in ft above sea level.
Results and Discussion

12
The permeability barrier may be created by the spoil-handlingtechniques that were discussed previously (see Fig. 4), or fromsediment clogging the rock chimney (Fig. 4).
Residual dye in MW 1 from Kemp’s 1990 dye trace mayhave contributed to the positive 1991 tests; MW 1 is locatednear the infiltration basin (see Fig. 6). The infiltration basin issituated between MW 1 and where the positive dye traces
were found, however, so movement of ground water is to-ward MW 6, whether the dye originated from residual dyefrom the 1990 trace or from the 1991 infiltration-basin test.
GROUND-WATER OCCURRENCE
Figure 10 shows the outline of the spoil area, along withthe contoured surface of the now-buried bedrock topography.
MW 12
MW 1
Filled valley
Contour interval 10 feet
1000
0
0
SCALE
2000
.5 1 km
3000 ft
Monitoring well location
MW 7
MW 14
Che
stnu
t
LEGEND
Gap
MW 2 MW 3MW 4
MW 6MW 5G
ap
Spring
MW 8
Long
STUDY AREA
BOUNDARYSPOIL
Nor
th
MW 11
MW 14
MW 13
Fork
BOUNDARYSPOIL
KY.
MW 9
MW 10
1120
1130
1120
1130
1110
1120
1130
1110
1120
1130
1000
Figure 10. Outline of the spoil and elevation of basal topography.
Hydrogeology, Hydrogeochemistry, and Spoil Settlement at the Star Fire Tract

13
This map was created by combining the pre-mining topo-graphic map of the mined area and a structure-contour mapon the base of the Hazard No. 7 coal, which is the lowest coalbeing mined. The bottom surface of the spoil’s interior is agently undulating plateau capped by the shale that underliesthe No. 7 coal. This buried plateau is bordered by the pre-existing stream drainage (shaded areas on Fig. 10) formed byLong Fork to the northeast and Spring Gap/Chestnut GapBranch to the southwest. Elevation drops considerably from
the plateau level to the bottom of the old stream drainages.Maximum relief (approximately 130 ft) occurs in the north-west corner of the spoil, where the two buried drainage val-leys converge around the nose of the plateau.
A contour map of the water table within the spoil (Fig. 11)was created from water-elevation data collected in June 1991from the 14 monitoring wells on the site, the dust-controlpond, and spring 1. There is a slightly mounded water tablein the central plateau region, as demonstrated by the closed
KY.
STUDY AREA
3000 ft
1 km
2000
.5
SCALE
0
0
1000
SPOILBOUNDARY
SPOILBOUNDARY
1140
1130
1140
1120
1040
1050
1080
1100
1110
LongFork
SpringG
apChe
stnu
t
Gap
MW 7
MW 8
MW 3MW 1
MW 2
MW 5MW 6
MW 4
MW 14
MW 13
MW 11MW 12
MW 14 Monitoring well location
Contour interval 5 feet
Filled valley
EXPLANATION
Nor
th
MW 9
MW 10
1090
1130
1125
1135
1060
Figure 11. Contour of the spoil water table.
Results and Discussion

14
1,300-ft contour line in the center of Figure 11. The watermound is probably a reflection of the spoon-like shape of themine floor, as shown in Figure 10.
The water-table mound shown in Figure 9 also indicates alow hydraulic gradient in this area. For example, the gradientbetween MW 9 and MW 13 is 0.0019. The gradient of thewater table in the surrounding buried valleys is much higher:the gradient between MW 6 and MW 7 in the Spring Gapvalley fill is 0.025, more than 10 times the gradient betweenthe plateau wells.
Steep gradients are also evident between the northwesternarea of the plateau and the surrounding buried valleys, whichparallel the elevation differences indicated by the buried to-pography (see Fig. 10). These steep gradients seem unrealis-tic, and probably represent a boundary between two distinctbut interconnected saturated zones.
The distribution of water within the spoil is illustrated inFigure 12, which is a cross section of the spoil through moni-toring wells 7, 8, 9, and 13 along line A–A� (location shownon Fig. 6). There are two saturated zones: one relatively shal-low zone perched on the buried plateau, and the other in thevalley fill of the Chestnut Gap Branch drainage. The differ-ence in elevation between the buried plateau and the valleybottoms decreases toward the southeast, where the elevationof the valley bottoms gradually rises toward the heads of thevalleys. The saturated zones are probably directly connectedin the heads of the valleys, where the buried valleys intersectthe base of the plateau. The spoon-like shape of the interiorbasal plateau suggests that the bedrock along the edges of theplateau may form barriers that retard ground-water movementinto the valley, where the difference in elevation is greater.This interpretation is supported by the dye-tracing data, whichshow that water movement is restricted in the interior of thespoil. The water levels in wells on the north side of the spoilsuggest a similar configuration in the Long Fork valley fill.
The apparent lack of hydraulic continuity and the low hy-draulic gradient in the plateau region suggest that the major-ity of ground water moving through the spoil flows throughthe two buried valleys before finally discharging in the north-west corner of the spoil. This conclusion is also supported bythe dye-trace data, which show that water moves through theburied valleys at high velocities.
The occurrence of water in each well in the spoil indicatesthat a significant amount of ground water has accumulated.Table 2 compares the saturated-thickness data for the five wellslocated in the valley fills with the eight wells located over thespoil’s interior (buried plateau). Based on the June 1991 wa-ter levels, the mean saturated thickness for the valley-fill wells(30.1 ft) is approximately twice the mean value (15.4 ft) forthe wells located over the spoil’s interior. The greater satu-rated thickness in the valley fills may be the result of low-permeability spoil at the mouths of the valleys retarding drain-age from the valley fills and allowing for the accumulation ofwater (Kemp, 1990). In addition, the lower elevation of thevalley bottoms, and constriction of flow because of the V shapeof the incised, pre-mining valley, compared to the relativelyflat bottom of the No. 7 coal underlying the plateau region,may also be factors. The increase in recharge along the edgeof the spoil in the valley fills, in contrast to the lack of directrecharge over the main spoil body, may also contribute to thedifference in saturated thickness.
Based on an average saturated thickness of 21 ft for allspoil wells, and assuming an estimated porosity of 20 per-cent, approximately 4,200 acre-ft (1.4 billion gallons) of wa-ter is stored within the existing 1,000 acres of reclaimed spoil.Diodato and Parizek (1994) found that the porosity of minespoil ranged from 30.1 to 57 percent in shallow, unsaturatedboreholes, but because of the thick spoil, compaction, andsaturated conditions at the Star Fire site, the 20 percent po-rosity estimate used here seems appropriate.
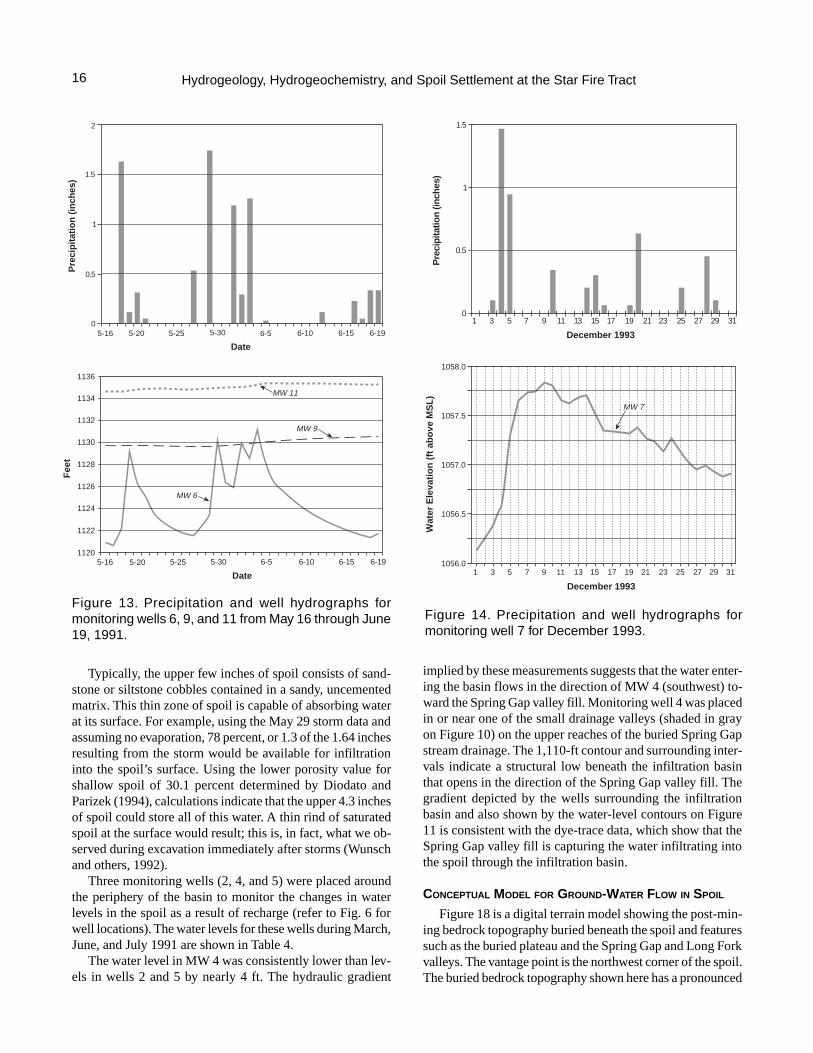
Hydrographs for the monitoring wells reveal some impor-tant facts about the ground-water system. Fig-ure 13 shows the daily water-level averages formonitoring wells 6, 9, and 11. These data werecollected using digital data loggers. Water levelgradually increased in each well from May 16,1991, through June 19, 1991. Wells 9 and 11,which are located in the interior of the spoil,exhibited a steady, gradual rise in water level,while MW 6’s water levels fluctuated erratically,in a pattern that closely paralleled the precipita-tion during the observation period. The net risein water level for MW 6 is similar to the ap-proximately 1 ft increase exhibited by wells 9and 11 during this period.
MW 6 is located near a bedrock highwall thatresulted from contour-cut mining in this area dur-ing the 1950’s. The rapid response to precipita-tion in MW 6 is most likely caused by surface
0 2000 4000 6000 ft
1400 ft
1300
1200
1100
1000
Base of Spoil
Hollow Fill
Top of Spoil
MW 7
MW 8MW 9 MW 13
?
A A
Bedrock
SpoilWater Table
Figure 12. Cross section through line A–A�.
Hydrogeology, Hydrogeochemistry, and Spoil Settlement at the Star Fire Tract

15
runoff quickly entering the spoil along the con-tact of the spoil and the bedrock valley wall andby ground water entering the valley fill fromthe bedrock in contact with the spoil.
Similar responses to precipitation are alsoseen in the hydrographs for well 7 (Fig. 14) andwells 9 and 14 (Fig. 15) from December 1993.Each well had a net increase in water level dur-ing the period. However, the hydrographs forvalley-fill wells 7 and 14 indicate that these wellsare much more responsive to precipitation thanwell 9. The increase in water levels followingrecharge in wells 7 and 14 is probably causedby the same recharge mechanisms described forMW 6.
In summary, the hydrographs for wells 9 and11 show a relatively smooth response to pre-cipitation, suggesting that the interior of the spoildoes not obtain ground-water recharge as readilyas the spoil in the valley fills located near theperiphery of the spoil (wells 6, 7, and 14). Thethickness of the saturated zone in the spoil is afunction of the elevation of the bedrock aquitardbelow the spoil and other barriers to ground-water flow. Generally, the higher the bedrocksurface elevation, the thinner the saturated zone.In the valley-fill areas the saturated zone is influenced by thepre-existing surface topography of the unmined areas.
SLUG TESTS
Falling-head slug tests were performed in nine monitor-ing wells at the site during the fall of 1992. The results of thetests are shown in Table 3. The hydraulic conductivity (K)values ranged from 1.0 × 10⁻⁶ to greater than 2.9 × 10⁻⁵ ft/sec.These values are comparable to K values for silty sand (Freezeand Cherry, 1979), and are also consistent with hydraulic-conductivity values determined by other studies of mines thatuse similar mining methods. For example, Oertel and Hood(1983) found K values ranging from 1.5 × 10⁻⁶ to 6.9 × 10⁻⁴
ft/sec, and Herring and Shanks (1980) found a range from 1.5× 10⁻⁶ to 1.6 × 10⁻³ ft/sec.
Because some wells (5, 8, 10, and 13) were able to dis-perse water at a rate that exceeded injection and data-record-ing capabilities, only a minimum hydraulic conductivity couldbe calculated. However, judging from the past pumping per-formance of these wells, and keeping in mind that the flow ofwater in mine spoil tends to move along discrete high-poros-ity zones (Caruccio and Geidel, 1984), the actual K valuesfor these wells are probably significantly higher than the val-ues calculated. Because there is no discernible difference inhydraulic conductivity between the wells in the valley fillsand wells in the spoil interior, the apparently sluggish ground-water movement in the spoil interior must be related to thelow gradients induced by recharge-discharge relationships.
INFILTRATION BASIN
The deep infiltration basin catches surface-water runofffrom an 18.9-acre catchment area. The volume of water flow-ing into the basin for any recorded precipitation event can becalculated by using the stage-discharge curve for runoff thatis recorded by the flume and stage recorder. The water levelof the pool that accumulates in the basin is recorded by apressure transducer and digital data recorder in a stilling well(see Fig. 5).
Response of pool levels to precipitation events from May16 through June 6, 1991, is shown in Figure 16. The responseof water entering the basin to a storm is nearly instantaneous,indicating very rapid runoff.
Data from a storm on May 29, 1991, are given in Figure17. The runoff passing through the flume into the infiltrationbasin during this event was calculated to be 24,390 ft3 (182,000gallons). Three hours passed before all of the water infiltratedinto the base of the basin, indicating that the average infiltra-tion rate of the basin was 136 ft3 (1,010 gallons) per minute.
The percentage of rainfall measured as runoff for the May29, 1991, storm was 22 percent. Data collected from 42 storms(Appendix B) showed the percentage of runoff varied from alow of 0.82 to a high of 34.3 percent, with an average of 11.9percent. These data indicate that, on average, 88 percent ofprecipitation either infiltrates directly into the spoil, istranspired by vegetation, or evaporates directly from the spoil’ssurface.
Results and Discussion
16
Typically, the upper few inches of spoil consists of sand-stone or siltstone cobbles contained in a sandy, uncementedmatrix. This thin zone of spoil is capable of absorbing waterat its surface. For example, using the May 29 storm data andassuming no evaporation, 78 percent, or 1.3 of the 1.64 inchesresulting from the storm would be available for infiltrationinto the spoil’s surface. Using the lower porosity value forshallow spoil of 30.1 percent determined by Diodato andParizek (1994), calculations indicate that the upper 4.3 inchesof spoil could store all of this water. A thin rind of saturatedspoil at the surface would result; this is, in fact, what we ob-served during excavation immediately after storms (Wunschand others, 1992).
Three monitoring wells (2, 4, and 5) were placed aroundthe periphery of the basin to monitor the changes in waterlevels in the spoil as a result of recharge (refer to Fig. 6 forwell locations). The water levels for these wells during March,June, and July 1991 are shown in Table 4.
The water level in MW 4 was consistently lower than lev-els in wells 2 and 5 by nearly 4 ft. The hydraulic gradient
implied by these measurements suggests that the water enter-ing the basin flows in the direction of MW 4 (southwest) to-ward the Spring Gap valley fill. Monitoring well 4 was placedin or near one of the small drainage valleys (shaded in grayon Figure 10) on the upper reaches of the buried Spring Gapstream drainage. The 1,110-ft contour and surrounding inter-vals indicate a structural low beneath the infiltration basinthat opens in the direction of the Spring Gap valley fill. Thegradient depicted by the wells surrounding the infiltrationbasin and also shown by the water-level contours on Figure11 is consistent with the dye-trace data, which show that theSpring Gap valley fill is capturing the water infiltrating intothe spoil through the infiltration basin.
CONCEPTUAL MODEL FOR GROUND-WATER FLOW IN SPOIL
Figure 18 is a digital terrain model showing the post-min-ing bedrock topography buried beneath the spoil and featuressuch as the buried plateau and the Spring Gap and Long Forkvalleys. The vantage point is the northwest corner of the spoil.The buried bedrock topography shown here has a pronounced
Figure 13. Precipitation and well hydrographs formonitoring wells 6, 9, and 11 from May 16 through June19, 1991.
1 3 5 7 9 11 13 15 17 19 21 23 25 27 29 311056.0
1056.5
1057.0
1057.5
1058.0
December 1993
Wat
er E
leva
tion
(ft a
bove
MS
L) MW 7
December 1993
1 3 5 7 9 11 13 1915 17 21 23 25 27 29 310
0.5
1
1.5
Pre
cipi
tatio
n (in
ches
)
Figure 14. Precipitation and well hydrographs formonitoring well 7 for December 1993.
Hydrogeology, Hydrogeochemistry, and Spoil Settlement at the Star Fire Tract
5-16 5-20 5-25 5-30 6-5 6-10 6-15 6-19
Date
MW 6
MW 9
MW 11
1126
1128
1130
1132
1134
1136
1120
1122
1124
Fee
t
5-16 5-20 5-25 5-30 6-5 6-10 6-15 6-19
Date
0
1
0.5
1.5
2
Pre
cipi
tatio
n (in
ches
)

17
effect on the occurrence and movement of ground water inthe spoil.
Figure 19 shows several features and ground-water flowdirections superimposed on an aerial photograph of the north-western part of the mine site (top photograph). The vantagepoint is the same as in Figure 18. Water contained in the val-ley fills flows toward the northwest, where it discharges atsprings. Water that accumulates in the southeastern part ofthe spoil’s interior flows toward the heads of the buried val-leys, which are now valley fills. This is evidenced by dye-trace data, head data, and the bottom structure of the buriedplateau. Some of the water in the spoil’s interior dischargesto ponds situated above the springs on the northwest face.These points of discharge are illustrated in the bottom photo-graph of Figure 19, an aerial photograph with a close-upview of the northwest face of the spoil. Water entering thespoil through the infiltration basin (not within view in eitherphotograph in Figure 19) probably flows into Spring Gap, aspreviously indicated by the dye-trace and head data from thewells surrounding the basin. The pond water, in turn, flows
down the face of the spoil, where it joins with the spring dis-charge before entering the lowermost sediment pond (Fig.19, top photograph).
Mass-balance calculations indicate that the amount of watercontributed by the pond overflow to the total mine outflow(0.86 cfs) is less than the amount of water that dischargesfrom the valley fills (1.39 cfs). Water recharging the buriedSpring Gap and Long Fork valleys is supplied from (1) groundwater derived from bedrock along the valley fills at the spoil-bedrock contact, (2) surface-water seepage along the spoil-bedrock contact, and (3) the capture of ground water from thespoil’s interior in the southeastern part of the spoil.
Figure 20 is a map of the spoil body; the arrows indicatethe assumed direction of ground-water flow. It represents aconceptual model of ground-water movement through thespoil.
In this model the majority of water moves through the val-ley fills around the main spoil body and discharges at the north-west corner of the spoil. Recharge enters the spoil mainlyalong the edges of the valley fills, and at discrete points onthe reclaimed surface, which includes the infiltration basin.
HYDROGEOCHEMISTRY
WATER-MINERAL REACTIONS
The mineralogy of the overburden plays an important partin determining chemical evolution of ground water in minespoil. In addition, the mining process exposes unweatheredmineral surfaces and increases the potential reactive surfacearea. Several dominant chemical reactions occur in almost all
Figure 15. Hydrographs for monitoring wells 9 and 14for December 1993.
Hydrogeochemistry
1 3 5 7 9 11 13 15 17 19 21 23 25 27 29 31
December 1993
1117.5
1118.0
1118.5
1119.0
1119.5
Wat
er E
leva
tion
(ft a
bove
MS
L)
December 1993
1129.5
1130.0
1130.5
1131.0
Wat
er E
leva
tion
(ft a
bove
MS
L)
1 3 5 7 9 11 13 15 17 19 21 23 25 27 29 31
MW 14
MW 9

18
geologic terranes that contain coal, and these reactions have agreat impact on the major dissolved constituents in groundand surface water (Williams and Hammond, 1988).
High concentrations of sulfate in ground and surface wa-ter are often associated with coal mining. The most probablesource of sulfate in eastern Kentucky is from the oxidation ofiron sulfide minerals. Both pyrite and marcasite are commoniron sulfide minerals in the Appalachian coal field (Powelland Larson, 1985). Sulfate-bearing minerals such as gypsum(CaSO4·2H2O) are not common primary minerals in the rocksof eastern Kentucky; therefore, the dissolution of gypsumprobably is not a major source of sulfate.
Generally, the oxidation of pyrite can be represented asfollows:
2FeS2 + 7O2 + 2H2O ® 2Fe2+ + 2H2SO4 + 2SO42-
Additional excess acidity can be generated if conditions withinthe spoil are conducive to the establishment of a populationof iron-oxidizing bacteria such as Thiobacillus ferrooxidans(Singer and Stumm, 1970), which catalyze the reactions thatproduce acid-mine drainage. The resulting sulfuric acid solu-tion can react with carbonate minerals (e.g., calcite), result-ing in the neutralization of the acid and the release of calciumand sulfate, along with an increase in bicarbonate. The netreaction is as follows:
2CaCO3 + H2SO4 ® 2HCO3- + 2Ca2+ + SO4
2-
Dolomite is rare in the rocks of the Breathitt Formation(Danilchik and Waldrop, 1978; Weinheimer, 1983), and there-fore the dissolution of this mineral probably does not con-tribute magnesium, which is found in significant concentra-tions in the spoil’s ground water.
Chlorite ((Mg,Fe)6(AlSi3)O10(OH)8) is common inBreathitt rocks (Papp, 1976; Weinheimer, 1983), and it maybe a significant source of magnesium in ground water (Hem,1985). The weathering of chlorite is promoted by acidic con-ditions, making this reaction likely in areas where pyrite oxi-dation occurs (Powell and Larson, 1985).
Cation exchange is a geochemical process that may affectthe distribution of cations in ground water in contact withmine spoil. In spoil water laden with divalent cations, the mostlikely reaction is one in which the preferred divalent cationssuch as calcium and magnesium are exchanged for sodiumon the surfaces of reactive clays, iron hydroxides, or organicmatter present in the spoil. The net effect is to increase thesodium concentration relative to the divalent cations in theground water. The reaction is shown below, with X represent-ing the exchange site on the solid:
2NaX + Ca2+ ® 2 Na+ + CaX
An additional reaction is the chemical weathering of sili-cate minerals such as feldspars and clays, which tends to re-lease alkali-metal cations, silica, and bicarbonate into solu-tion (Freeze and Cherry, 1979; Powell and Larson, 1985).
INTERPRETATION OF SPOIL-WATER DATA
Figure 21 is a trilinear diagram in which the results ofanalyses of water samples are plotted as a function of thenormalized percentage of the samples’ major cations and an-ions. Sixty-eight water samples are represented on the dia-gram, including all ground-water samples taken from moni-toring wells and springs from April 1991 through June 1992.Chemical data for each sample are listed in Appendix A. Allsamples plot in the same general location on the diamond-shaped field of the diagram, indicating that they possess thesame distribution of major ions. The dominant cations arecalcium and magnesium, and sulfate is the dominant anion.The data shown represent four sampling events spanning 14months, indicating that the water composition at the site var-
0.5
2
3.5
5
6.5
8
Infil
trat
ion
basi
n po
ol le
vel (
feet
)
Date5-16 5-20 5-25 5-30 6-5 6-10 6-15 6-19
0
1
0.5
1.5
2
Pre
cipi
tatio
n (in
ches
)
6-19Date
5-16 5-20 5-25 5-30 6-5 6-10 6-15
Figure 16. Response of pool elevation in infiltrationbasin to precipitation events from May 16 throughJune 19, 1991.
Hydrogeology, Hydrogeochemistry, and Spoil Settlement at the Star Fire Tract

19
ies little temporally. The most likely origin for the calcium-magnesium-sulfate water type at the site is the oxidation ofiron sulfide minerals with the contemporaneous dissolutionof calcium carbonate. The source of the relatively highamounts of magnesium is not well understood, but high-mag-nesium calcite or magnesium-rich clays such as illite or chlo-rite could be potential sources.
Figure 22 shows the distribution of pH values for all moni-toring wells and spring 1. Most of the monitoring wells havemaximum, median, and minimum pH values greater than 6.0,except for wells 6, 11, and 14. Overall, the majority of ground-water samples collected at the site indicate that the mine spoilgenerally does not produce highly acidic water.
Samples from MW 14 all have a pH of less than 4.5, whichrepresents the lowest pH measurements encountered on thesite. Samples taken from MW 14 are somewhat separated fromthe other samples plotted on the trilinear diagram (Fig. 21).The distribution of cations (mainly calcium and magnesium)is consistent with the distributions found in other well samples,the major difference being in the distribution of the anions. InMW 14 the dominant ion is sulfate, but the anionic distribu-tion differs from that of the other wells by containing verylow amounts of bicarbonate.
Water samples from MW 14 have bicarbonate contentslower than the other water samples by approximately two or-ders of magnitude. The range of bicarbonate concentration inMW 14 is from 3.66 to 8.54 mg/L, and the range of bicarbon-ate in samples from all other wells is from 185 to 1,046mg/L.
A plausible explanation for the low bicar-bonate level is that MW 14 collects water froman area where the rocks contain significantamounts of sulfide-bearing minerals and con-ditions are favorable for their oxidation. In ad-dition, the amount of sulfide minerals in thevicinity of this well must be much greater thanthe amount of calcium carbonate. In this case,excess sulfuric acid would be produced, re-sulting in low bicarbonate concentrations andlow pH.
Well 14 is located over a valley fill and isnear a recharge area where Kemp (1990) ob-served surface water accumulating at the spoil-highwall contact. The highest average Eh value(mean Eh=398 millivolts [mV]; coefficient ofvariation=3.3 percent) of all the wells surveyedwas observed at MW 14, and is in the Eh rangein which the oxidation of sulfides is likely totake place (Champ and others, 1979). In addi-tion, MW 14 is adjacent to an experimentalgoose pond situated on the reclaimed spoil.The pond has been prone to leaking, which
could supply oxygen-rich surface water to the saturated zonemonitored by MW 14. The result would be a geochemicalenvironment that could create the acidic water encounteredin MW 14. However, iron concentrations are lower than ex-pected if pyrite is actively being oxidized and dissolved. Oneexplanation for the relatively low iron concentration could bethe contemporaneous precipitation of hydrous ferric hydrox-ides along the water’s flow path.
Wells 4 and 7 had the highest average dissolved iron con-tents of 39.1 and 44.1 mg/L, respectively. MW 7 is directlydowngradient from the point where Chestnut Gap Branch dis-appears into the spoil, and MW 4 is downgradient from therecharge water that enters the spoil through the infiltrationbasin. Chemical data show that these two wells also had thelowest average Eh measurements (213 and 159 mV, respec-tively). These values indicate slightly oxidizing to reducingconditions, which means conditions are more conducive forsustaining high dissolved iron concentrations in ground wa-ter in this area than in other areas of the spoil (Domenico andSchwartz, 1990). The relatively low Eh conditions may berelated to the consumption of oxygen during the oxidation of
Figure 17. Relationship between flume stage and pool level during andafter the May 29, 1991, storm.
Hydrogeochemistry
1202 1232 1302 1332 1402 1432 1502 1532 1602 1632 17020
1
2
3
4
5
6
7
24-Hour Time
Pool level in basin Stage in flume
Fee
t

20
organic matter. Both wells 4 and 7 are directly downgradientfrom points of surface-water recharge that are likely to con-tain water with more organic components than water fromother locations that flows over the relatively sterile,unvegetated spoil. Surface water entering the spoil near MW7 (i.e., Chestnut Gap Branch) flows through an unmined val-ley used for cattle grazing, where organic matter from decay-ing vegetation or from animal waste is likely to occur. Thedrainage basin surrounding the infiltration basin is well veg-etated at the time of the writing of this report compared tomost of the reclaimed spoil. Organic matter acts as a foodsource for bacteria, aids in the consumption of dissolved oxy-gen in the ground-water system, and can form organic-metal-lic complexes. These and other processes can affect the solu-bility and mobility of dissolved iron (Domenico and Schwartz,1990). More chemical data are needed to confirm or discountthese hypotheses concerning water chemistry at the site.
Head distribution for wells on the periphery of the infil-tration basin indicates that water entering the spoil throughthe basin moves toward MW 4. This is substantiated by chemi-cal data from water samples taken from wells 2, 4, and 5. Theaverage TDS content of the samples taken from MW 4 is 789mg/L (see Appendix A for chemical data), which is approxi-mately one-third the TDS values of the other wells surround-ing the infiltration basin (MW 2 and MW 5). TDS values forwells 2 and 5 are similar to each other (average TDS valuesare 2,273 and 2,216 mg/L, respectively). The lower TDS valuein MW 4 is most likely a result of dilution by the less miner-alized surface water entering the spoil through the infiltrationbasin. A sample of water taken from the intermittent flowthat descends into the infiltration basin had a relatively lowdissolved solid content (177.8 mg/L) and a pH of 7.67. Wecan reasonably assume that the majority of surface water en-
tering the basin is similar in chemistry to this sample. Unlessdisturbed, the spoil exposed at the surface will become lessand less reactive because of leaching by subsequent precipi-tation. Therefore, the low TDS values of water samples fromMW 4 probably reflect the mixing of recharge water enteringthrough the infiltration basin and more mineralized groundwater in the saturated zone.
The mean TDS value (see Appendix A) for wells in theinterior plateau region of the spoil (2, 3, 5, 8, 9, 11, 12, and13) is 2,474 mg/L (standard deviation=349), whereas meanTDS values for the valley-fill wells (4, 6, 7, 10, 14) and spring1 is 1,414 mg/L (standard deviation=820). The higher TDSvalues characteristic of the interior of the spoil are most likelythe result of longer contact time between slowly movingground water and reactive spoil. The extended contact timeallows for greater water-rock interaction and leaching ofsoluble and reactive rock materials, which results in an in-crease in the total concentration of the dissolved constitu-ents.
Limited data indicate that the TDS concentration of thewater entering the spoil at Chestnut Gap Branch is generallylower than that of the water emerging from the springs (datafrom SP 1 in Appendix A) at the discharge zone. Discharg-ing ground water from SP 1 has a TDS content nearly threetimes that of the water entering the spoil at Chestnut GapBranch. This dramatic increase in mineralization probablyresults from two main processes: (1) the recharging water,although only in contact with the spoil material for a shorttime (as evidenced by travel times determined by dye-trac-ing), reacts with minerals in the spoil, and (2) the relativelyfresh water from the stream is mixing with the more mineral-ized water entering the valley fills from the interior of thespoil. Mass-balance calculations demonstrate that the mixing
Figure 18. Digital terrain model showing the bedrock topography buried beneath the spoil. Features such as theburied plateau and the Spring Gap and Long Fork valley fills can be seen in Figure 19. Vantage point is from thenorthwestern corner.
Hydrogeology, Hydrogeochemistry, and Spoil Settlement at the Star Fire Tract

21
Figure 19. Aerial photographs of the northwest corner of the reclaimed mine site. The conceptual ground-water flowsystem is superimposed on the top photograph. Ground-water discharge points along the northwest slope of thespoil body are superimposed on the bottom photograph.
Hydrogeochemistry
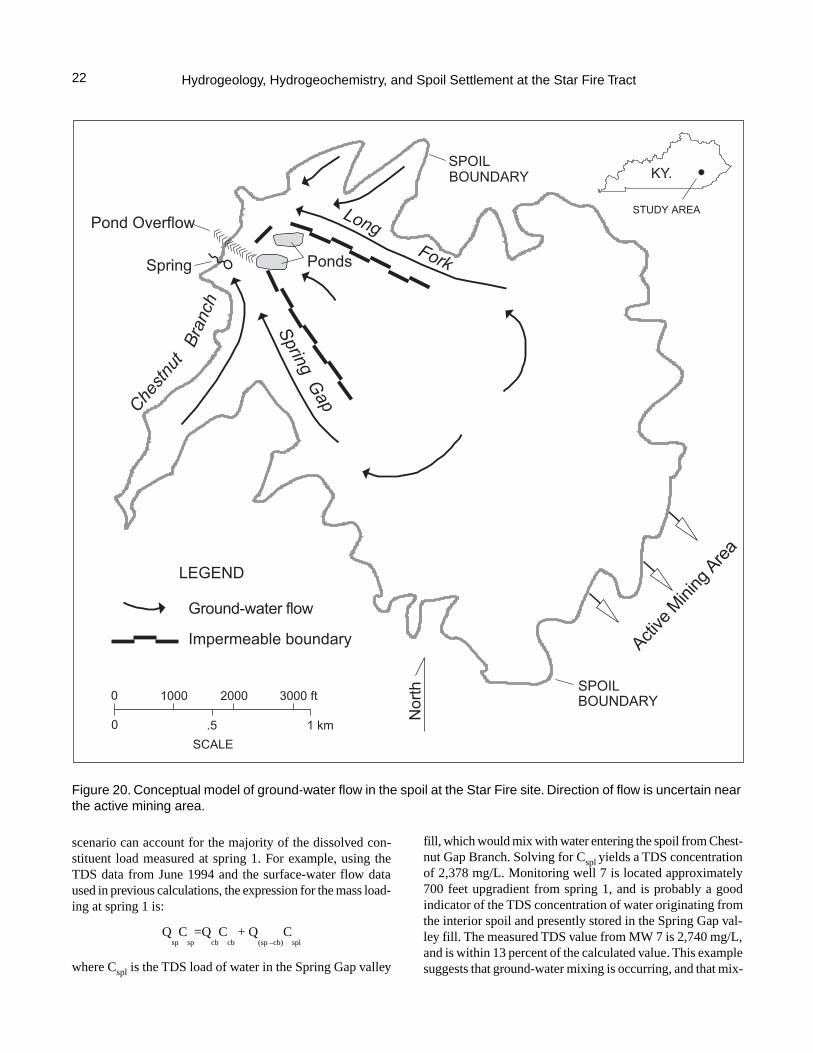
22
scenario can account for the majority of the dissolved con-stituent load measured at spring 1. For example, using theTDS data from June 1994 and the surface-water flow dataused in previous calculations, the expression for the mass load-ing at spring 1 is:
QspC
sp=Q
cbC
cb + Q
(sp –cb)C
spl
where Cspl is the TDS load of water in the Spring Gap valley
fill, which would mix with water entering the spoil from Chest-nut Gap Branch. Solving for Cspl yields a TDS concentrationof 2,378 mg/L. Monitoring well 7 is located approximately700 feet upgradient from spring 1, and is probably a goodindicator of the TDS concentration of water originating fromthe interior spoil and presently stored in the Spring Gap val-ley fill. The measured TDS value from MW 7 is 2,740 mg/L,and is within 13 percent of the calculated value. This examplesuggests that ground-water mixing is occurring, and that mix-
Figure 20. Conceptual model of ground-water flow in the spoil at the Star Fire site. Direction of flow is uncertain nearthe active mining area.
Hydrogeology, Hydrogeochemistry, and Spoil Settlement at the Star Fire Tract
Long Fork
BOUNDARYSPOIL
STUDY AREA
KY.
Nor
th
BOUNDARYSPOIL
SpringG
apChestn
utB
ranc
hPond Overflow
Spring Ponds
1000
0
0
SCALE
.5
2000
1 km
3000 ft
Active
Mini
ng A
rea
Impermeable boundary
Ground-water flow
LEGEND

23
ing is an important determining factor for waterquality in the spring. This is a reasonable inter-pretation, considering that Kemp (1990) dem-onstrated that travel time for water entering thespoil at Chestnut Gap Branch and dischargingat spring 1 is less than 73 hours. This rapid rateof water movement would limit the amount oftime for chemical reactions that increase TDSconcentrations, especially if channelized flowcontrols the movement of ground water in thespoil. Channelized, or pseudo-karstic, flow canlimit the amount of spoil-water contact that addsdissolved solids to water moving through thespoil (Caruccio and Geidel, 1984).
TDS data indicate that the majority of thewater leaving the site is derived from the spoil.Based on average TDS values, wells 7 and 10,which are closest to the flume monitoring themine outflow in Long Fork (see Fig. 7 for thelocation), yield TDS concentrations very simi-lar to the TDS concentration of water discharg-ing the mine site through the Long Fork flume(TDS values are 2,573 and 1,966 mg/L for wells7 and 10, respectively, and 1,947 mg/L for theflume). These data, along with the mass-balance
calculations for the total water budget dis-cussed previously, suggest that the majorsource of the water discharging from themine site is ground water derived from themine spoil. If surface-water runoff at the sitewere making a significant contribution tothe total mine outflow, the TDS measuredat the outflow would be considerably lessthan that observed for spoil ground water,because of dilution. Samples of surface wa-ter collected at other areas of the site (e.g.,water from the stream at Chestnut GapBranch and water entering the infiltrationbasin) have TDS concentrations that are gen-erally less than 600 mg/L (Dinger and oth-ers, 1990).
Table 5 gives the saturation indices (IAP/K) calculated for several minerals that mayaffect the water chemistry of the spoilground water. Degree of saturation is definedin terms of the saturation index (SI):
SI LogIAP
K=
where IAP is the ion activity product and Kis the equilibrium constant of the mineral inquestion. If the SI is less than zero, the so-
Mg
Ca Cl
SO
SO Ca+Mg
20
40
80
80 60 40 20
80
60
40
20
20 40 60 80
80
60
40
20
80
60
40
20
+Cl4
4
Percent of total milliequivalents per liter
Na+K 3HCO +CO320 20
40 40
60 60
80 80
Well 14 Data
60
Figure 21. Piper diagram showing the water types of samples frommonitoring wells 2 through 14 and the main spring.
2 3 4 5 6 7 8 9 10 11 12 13 14 SP14
4.5
5
5.5
6
6.5
7
Well or spring
pH
Minimum Median Maximum
Figure 22. Distribution of pH values for water samples collected frommonitoring wells and SP 1.
Hydrogeochemistry
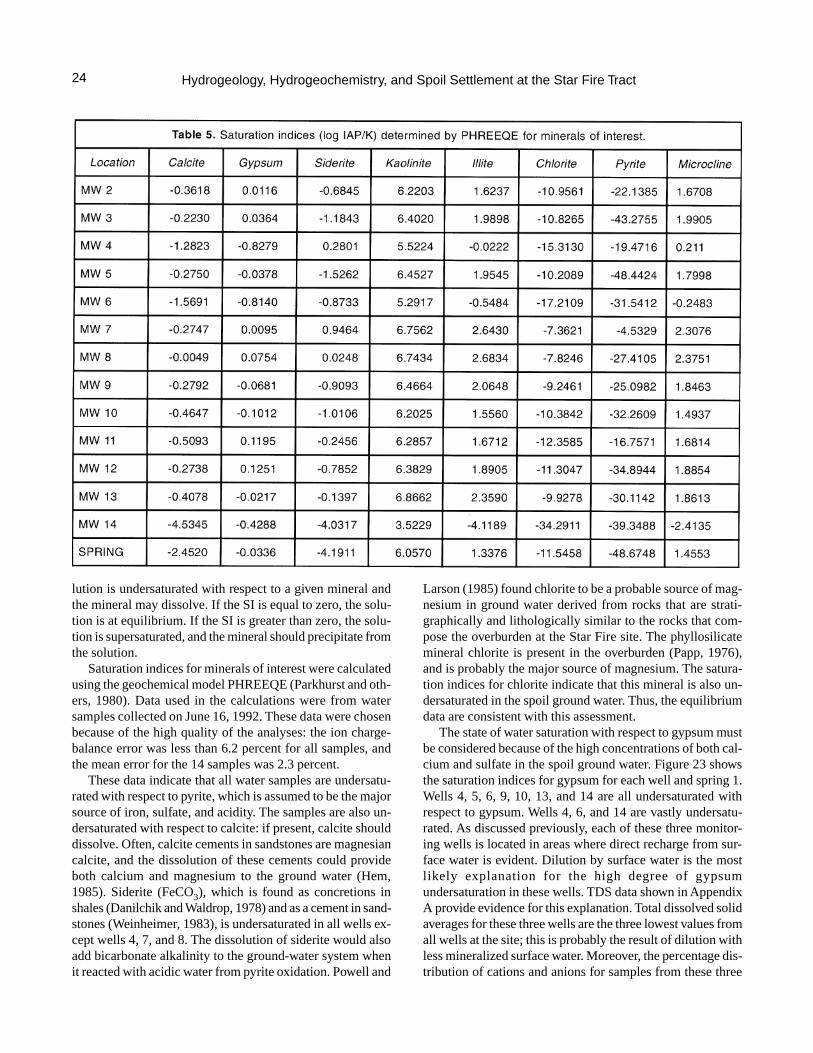
24
lution is undersaturated with respect to a given mineral andthe mineral may dissolve. If the SI is equal to zero, the solu-tion is at equilibrium. If the SI is greater than zero, the solu-tion is supersaturated, and the mineral should precipitate fromthe solution.
Saturation indices for minerals of interest were calculatedusing the geochemical model PHREEQE (Parkhurst and oth-ers, 1980). Data used in the calculations were from watersamples collected on June 16, 1992. These data were chosenbecause of the high quality of the analyses: the ion charge-balance error was less than 6.2 percent for all samples, andthe mean error for the 14 samples was 2.3 percent.
These data indicate that all water samples are undersatu-rated with respect to pyrite, which is assumed to be the majorsource of iron, sulfate, and acidity. The samples are also un-dersaturated with respect to calcite: if present, calcite shoulddissolve. Often, calcite cements in sandstones are magnesiancalcite, and the dissolution of these cements could provideboth calcium and magnesium to the ground water (Hem,1985). Siderite (FeCO3), which is found as concretions inshales (Danilchik and Waldrop, 1978) and as a cement in sand-stones (Weinheimer, 1983), is undersaturated in all wells ex-cept wells 4, 7, and 8. The dissolution of siderite would alsoadd bicarbonate alkalinity to the ground-water system whenit reacted with acidic water from pyrite oxidation. Powell and
Larson (1985) found chlorite to be a probable source of mag-nesium in ground water derived from rocks that are strati-graphically and lithologically similar to the rocks that com-pose the overburden at the Star Fire site. The phyllosilicatemineral chlorite is present in the overburden (Papp, 1976),and is probably the major source of magnesium. The satura-tion indices for chlorite indicate that this mineral is also un-dersaturated in the spoil ground water. Thus, the equilibriumdata are consistent with this assessment.
The state of water saturation with respect to gypsum mustbe considered because of the high concentrations of both cal-cium and sulfate in the spoil ground water. Figure 23 showsthe saturation indices for gypsum for each well and spring 1.Wells 4, 5, 6, 9, 10, 13, and 14 are all undersaturated withrespect to gypsum. Wells 4, 6, and 14 are vastly undersatu-rated. As discussed previously, each of these three monitor-ing wells is located in areas where direct recharge from sur-face water is evident. Dilution by surface water is the mostlikely explanation for the high degree of gypsumundersaturation in these wells. TDS data shown in AppendixA provide evidence for this explanation. Total dissolved solidaverages for these three wells are the three lowest values fromall wells at the site; this is probably the result of dilution withless mineralized surface water. Moreover, the percentage dis-tribution of cations and anions for samples from these three
Hydrogeology, Hydrogeochemistry, and Spoil Settlement at the Star Fire Tract

25
wells is consistent with that of all other ground-water samples,which also indicates dilution.
Samples from wells 2, 3, 7, 8, 11, and 12 are saturatedwith respect to gypsum. Each of these wells, except for MW7, is located in the interior of the spoil. Wells 8 and 11 havesome of the highest TDS concentrations observed at the site(see Appendix A). The degree of gypsum saturation in thesewells correlates well with the increased mineralization of theground water in the spoil’s interior.
Sodium and potassium concentrations are generally lowcompared to the calcium and magnesium concentrations inall samples. Cation exchange, therefore, is probably not animportant factor in determining the water type at the site. Othersources for sodium and potassium may result from the weath-ering of silicate minerals. However, the saturation indices forkaolinite, illite, and microcline indicate saturation in most ofthe samples representative of the spoil ground water. Only invery acidic conditions should chemical weathering of thesesilicates become significant. For example, very acidic condi-tions were consistently found in MW 14, and both illite andmicrocline are undersaturated, and would be expected to dis-solve. However, the kinetics of dissolution of these mineralsis slow (Powell and Larson, 1985), and therefore their disso-lution is probably unimportant to the overall chemistry ofground water at the site.
SPOIL SETTLEMENT
Table 6 contains the spoil-settlement data collected in 1992and 1993. Figure 24 shows settlement that occurred subse-quent to well installation, measured in tenths of a foot, based
on the two data sets. A good correlation existsbetween the age and thickness of spoil and ar-eas of high settlement. The northwestern areaof the spoil has been in place the longest time:parts of the valley fills in Spring Gap and LongFork have been in place for over 10 years. Thisarea showed the least settlement, generally 0.2to 0.4 ft during the period of observation. Thearea of maximum settlement occurred in thesoutheastern part of the spoil, where activemining is producing recent spoil. The maxi-mum settlement that occurred between the timeof well installation (July and August 1990) andNovember 1993 was 0.92 ft near MW 11,which translates into an average settlement rateof approximately 0.28 ft per year.
The contour lines in Figure 24 also indicatea lobe of higher settlement in the spoil overly-ing the buried plateau. This is the area wherethe spoil is the thickest, and in some places itexceeds 250 ft (Kemp, 1990). However, thelimited data here do not allow determinationof which variable is the most important factor
in predicting where maximum settlement will occur (age,thickness, or subsurface geometry).
The settlement rate calculated here is based merely on anarithmetic average of settlement per unit time. In addition,spoil measurements did not commence with the initial place-ment of the spoil immediately after mining. Settlement ratesfor earthen materials such as mine spoil usually decrease atan exponential rate (Charles and others, 1977). Therefore, theamount and rate of settlement at the Star Fire site should de-crease substantially with time. Additional study is needed.
SUMMARY
Mine spoil at the Star Fire site ranges from approximately100 to 300 ft in thickness. Selected spoil handling techniques,such as cast blasting, dragline casting, and dumping by trucks,is providing a framework for water storage in the 1,000 acresthat have been mined at the Star Fire site.
Field investigations have identified numerous ground-wa-ter recharge and discharge zones at the mine spoil area. Re-charge occurs by way of disappearing streams, ground-waterinfiltration along exposed boulder zones, and at areas wherethe spoil is in contact with the bedrock highwalls. Minor re-charge occurs locally on the spoil’s surface throughmacropores (snakeholes). Discharge of ground water fromthe spoil occurs mainly through springs and seeps at theoutslope of the spoil body. Ground-water movement withinthe spoil is controlled by the ground-water gradients withinthe spoil, which are a function of the buried topography andthe interaction of the recharge and discharge zones with zonesof low-permeability spoil. The spoil interior, lacking any major
Figure 23. Saturation indices (IAP/K) for gypsum (CaSO4·2H
20) for water
samples collected in June 1992.
Summary
W2 W3 W4 W5 W6 W7 W8 W9 W10 W11 W12 W13 W14 SP1
Well or spring
-1.00
-0.80
-0.60
-0.40
0.00
0.20
0.40
0.60
0.80
1.00
-0.20
Log
IAP
/K G
YP
SU
M

26
direct recharge from the surface, slowly accumulates water,whereas in the valley fills ground water moves at a rapid rate.Recharge to the valley fills comes from streams, adjacent bed-rock aquifers, and from surface water that seeps in near thebedrock-spoil interface.
Water-table elevations measured at monitoring wells,springs, and ponds indicate that a saturated zone in the inte-rior of the spoil slowly discharges to the southeast or north-west, and that two additional saturated zones occur at lowerelevations in the two adjoining valley fills (Spring Gap-Chest-nut Gap Branch and Long Fork). Most likely, these saturatedzones are in hydraulic connection in the upper reaches (south-eastern part) of the spoil body, but are separated by the topog-raphy of the basal bedrock in the central plateau section ofthe spoil.
Based on an average saturated thickness of 21 ft and aspoil porosity of 20 percent for the site, an estimated 4,200acre-ft (1.4 billion gallons) of water exists in the 1,000-acrespoil. The average saturated thickness of the wells located inthe valley fills (30.1 ft) is nearly twice that (15.4 ft) for thewells located in the spoil’s interior.
The range of hydraulic conductivity values computed inthe spoil are from 2.0 × 10⁻⁶ to more than 2.9 × 10⁻⁵ ft/sec.The upper limit of K for spoil wells could not be determinedbecause of equipment limitations; thus, the upper range couldbe significantly higher than measured. Because there is nodiscernible difference in hydraulic conductivity between thewells in the valley fills and wells in the spoil interior, theapparently sluggish ground-water movement in the spoil in-terior must be related to gradients induced by recharge-dis-charge relationships.
A deep infiltration basin instrumented at the site collectssurface runoff from the spoil. A 1.64-inch precipitationevent produced 24,390 ft3 (182,000 gallons) of runoff, whichentered the spoil through the infiltration basin at an averagerate of 136 ft3 (1,010 gallons) per minute. The head distribu-tion measured in monitoring wells around the infiltration ba-sin indicates that the water entering the basin is flowing to-ward the Spring Gap valley fill and most likely dischargesfrom the springs in the northwestern part of the spoil.
Chemical analysis of samples from monitoring wells andsprings shows that all waters at the site are a calcium-magne-sium-sulfate type. The pH of all ground-water samples, ex-cept for those from MW 14, fell into a favorable range ofapproximately 6 to 7. The TDS values for wells located in thespoil interior are higher than the average value for wells lo-cated in the valley fills. Higher mineralization of the watersamples from the interior spoil area probably reflects thelonger contact time of ground water with reactive spoil mate-rial, as inferred from the gentle gradient of the water tableand dye-tracing data. Lower TDS values for the valley-fillwells probably result from a greater contribution of less min-eralized surface water into the ground-water flow system anda shorter residence time.
Ground-water chemistry appears to be controlled by thedissolution of calcite and probably weathering of chlorite,and the oxidation of sulfide minerals, resulting in a calcium-magnesium-sulfate water type for both ground and surfacewater at the site. Most of the ground water in the spoil is at or
Hydrogeology, Hydrogeochemistry, and Spoil Settlement at the Star Fire Tract

27
near equilibrium with the mineral gypsum. Some areas of thespoil, especially in valley fill areas near a bedrock highwall,
are diluted by less mineralized surface waterthat can more easily infiltrate the spoil in thesezones.
A conceptual model of ground-water flowpatterns indicates that two separate but con-nected saturated zones occur in the spoil.Ground-water movement within the spoil iscontrolled by the gradients that form as a func-tion of the interaction of recharge and dischargezones, by the topography of the relatively im-permeable pavement that underlies the lowestcoal being mined (Hazard No. 7), and by thedrainage patterns that existed before miningbegan. The major streams that drained the pre-mined area (Chestnut Gap Branch, Spring Gap,and Long Fork) eroded valleys whose bottomsare at elevations well below the level of theNo. 7 coal. These drainage valleys became val-ley fills as contour-cut mining occurred alongthe valley walls. The interior of the spoil con-tains a relatively thin saturated zone from theaccumulation of water from discrete infiltra-tion zones within the spoil, the infiltration ba-sin, and the active mining area whereuncompacted or reclaimed spoil are present.Water that accumulates in the interior zonemost likely flows into the valley fills on eitherside of the interior plateau in the upper reachesof the buried valleys in the southeastern sec-tion of the spoil, or flows to the northwest anddischarges into either of the two ponds exca-vated into the bedrock pavement below theHazard No. 7 coal.
Water in the valley fills receives contribu-tions of ground water from the adjacent un-mined bedrock highwall and surface water thataccumulates and later percolates along thespoil-bedrock contact. The total mine outflowmeasured in the northwestern area of the re-claimed spoil produces a base flow of approxi-mately 4 cfs (2.6 mgd). Variations in waterquality observed at the site are related to theflow system described by this model.
Measurements taken at the spoil surface in-dicate that the spoil is exhibiting differentialsettlement related to the age and thickness ofthe spoil. The most recently mined areas ofthe spoil body exhibit the greatest settlement;the maximum spoil settlement rate observedwas 0.28 ft per year.
Contour lines on maps of the spoil’s watertable and the spoil settlement are similar in that
they both show changes in gradients that correlate with abruptchanges in topography defined by buried valleys and the pave-
Summary
Figure 24. Mine spoil settlement around monitoring wells from July 1989–July 1992 and from August 1992–November 1993.
-0.10
-0.30
-0.40
-0.50
-0.60
-0.50
-0.10
-0.40
-0.30
-0.20
-0.60
-0.20
-0.30
-0.10
-0.40
-0.50
-0.60
-0.70
-0.80
-0.90
-0.70
-0.60
-0.50-0.40
-0.30
-0.20
-0.10
-0.20
-0.21-0.59
-0.63
-0.35
-0.67
-0.46
-0.36
-0.52
-0.18
-0.02
-0.07
-0.27-0.21
-0.31
-0.63-0.60
-0.75-0.73-0.22
-0.83 -0.92
-0.28
SPOIL BOUNDARY
SPOIL BOUNDARY
July 1989–July 1992
August 1992–November 1993
1000
0
0
SCALE
2000
.5
3000 ftN
1 km

28
ment bedrock resulting from coal extraction. This implies thatthe buried topography beneath large spoil areas such as theStar Fire site is important in predicting hydrologic and geo-technical characteristics of the spoil body, and must be con-sidered when evaluating such sites.
The initial water-quality and -quantity data measured atthe Star Fire Mine demonstrate that the ongoing mining tech-niques can provide the physical framework for water storagein the extensive mine spoil. Although the water stored in thespoil is not potable at this time, it likely could serve for vari-ous agricultural and industrial uses and may become moreuseful with time and as water-treatment technology improves.Development of a useful water supply within the spoil will bea key factor in future land use and economic diversity of thesite and other similar sites in eastern Kentucky.
REFERENCES CITED
Aldous, P.J., and Smart, P.L., 1987, Tracing ground watermovement in abandoned coal mined aquifers using fluo-rescent dyes: Ground Water, v. 26, no. 2, p.172–178.
Aulenbach, D.B., Bull, J.H., and Middlesworth, B.C., 1978,Use of tracers to confirm ground-water flow: GroundWater, v. 16, no. 3, p. 149–157.
Caruccio, F.T., and Geidel, Gwendolyn, 1984, Induced alka-line recharge zones to mitigate acidic seeps, in Proceed-ings, 1984 Symposium on Surface Mining, Hydrology,Sedimentology, and Reclamation: Lexington, Universityof Kentucky, College of Engineering, College of Con-tinuing Education and Extension, College of Agriculture–Department of Forestry, p. 43–47.
Champ, D.R., Gulens, J., and Jackson, R.E., 1979, Oxida-tion-reduction sequences in ground-water flow systems:Canadian Journal of Earth Science, v. 16, p. 12–23.
Charles, J.A., Naismith, W.A., and Burford, D., 1977, Settle-ment of backfill at Horslev restored opencast coal min-ing site, in Geddes, J.D., ed., Large ground movementsand structures: New York, Wiley, p. 229–251.
Danilchik, Walter, and Waldrop, H.A., 1978, Geologic mapof the Vest Quadrangle, eastern Kentucky: U.S. Geologi-cal Survey Geologic Quadrangle Map GQ-1141.
Diodato, D.M., and Parizek, R.R., 1994, Unsaturated hydraulicproperties of reclaimed coal strip mines: Ground Water,v. 32, no. 1, p. 108–119.
Dinger, J.S., Warner, R.C., and Kemp, J.E., 1988, Buildingan aquifer in coal-mine spoil: Concept and initial con-struction at the Star Fire tract, eastern Kentucky, in Pro-ceedings, 1988 Symposium on Surface Mining, Hydrol-ogy, Sedimentology, and Reclamation: Lexington, Uni-versity of Kentucky, College of Engineering, College ofContinuing Education and Extension, College of Agri-culture–Department of Forestry, p. 85–93.
Dinger, J.S, Wunsch, D.R., and Kemp, J.E., 1990, Occurrenceof ground water in mine spoil, a renewable resource: StarFire tract, eastern Kentucky: Mining and ReclamationConference and Exhibition, Charleston, W.Va., April 23–26, 1990, p. 171–179.
Domenico, P.A., and Schwartz, F.W., 1990, Physical andchemical hydrogeology: New York, Wiley, 824 p.
Freeze, R.A., and Cherry, J.A., 1979, Ground water:Englewood Cliffs, N.J., Prentice-Hall, 604 p.
Hem, J.D., 1985, Study and interpretation of chemical char-acteristics of natural water (3d ed.): U.S. Geological Sur-vey Water-Supply Paper 2254, 263 p.
Herring, W.A., and Shanks, T.J., 1980, Hydraulic conductiv-ity of cast overburden: EOS, v. 61, no. 48, p. 1193.
Hinrichs, E.N., 1978, Geologic map of the Noble Quadrangle,eastern Kentucky: U.S. Geological Survey GeologicQuadrangle Map GQ-1476.
Hvorslev, M.J., 1951, Time lag and soil permeability inground-water observations: U.S. Army Corps of Engi-neers Waterways Experiment Station Bulletin 36.
Kemp, J.E., 1990, Hydrogeologic characterization of surfacemine spoil, Star Fire Mine, eastern Kentucky: Lexing-ton, University of Kentucky, M.S. Thesis, 102 p.
Kipp, J.A., and Dinger, J.S., 1991, Stress-relief fracture con-trol of ground-water movement in the Appalachian Pla-teau: Kentucky Geological Survey, ser. 11, Reprint 30,11 p.
Langmuir, Donald, 1971, Eh-pH determinations, in Carver,R.E., ed., Procedures in sedimentary petrology: New York,Wiley-Interscience, p. 597–634.
Oertel, A.O., and Hood, W.C., 1983, Changes in ground-wa-ter quality associated with cast overburden material insouthwest Perry County, Illinois, in Proceedings, 1983Symposium on Surface Mining, Hydrology, and Recla-mation: Lexington, University of Kentucky, College ofEngineering, College of Continuing Education and Ex-tension, College of Agriculture–Department of Forestry,p. 73–78.
Papp, A.R., 1976, Extractable cations from claystones andshales of the Pennsylvanian Breathitt Formation in east-ern Kentucky as related to depositional environments:Richmond, Eastern Kentucky University, M.S. Thesis,153 p.
Parkhurst, D.L, Thorstenson, D.C., and Plummer, L.N., 1980,PHREEQE, a computer program for geochemical calcu-lations: U.S. Geological Survey Water-Resources Inves-tigation Report 80-96, 210 p.
Hydrogeology, Hydrogeochemistry, and Spoil Settlement at the Star Fire Tract

29
Powell, J.D., and Larson, J.D., 1985, Relation between ground-water quality and mineralogy in the coal-producingNorton Formation of Buchanan County, Virginia: U.S.Geological Survey Water-Supply Paper 2274, 30 p.
Singer, P.C., and Stumm, Werner, 1970, Acidic mine drain-age: The rate limiting step: Science, v. 167, p. 1121–1123.
Smart, P.L., and Laidlaw, I.M.S., 1977, An evaluation ofsome fluorescent dyes for water tracing: Water ResourcesResearch, v. 13, p. 15–33.
Sobek, A.A., Schuller, A.J., Freeman, J.R., and Smith, R.M.,1978, Field and laboratory methods applicable to over-burdens and minesoils: U.S. Environmental ProtectionAgency, EPA-600/2-78-054, 204 p.
Soil and Material Engineers, Inc., 1982, Ground water deter-mination: Star Fire Coals, Inc., various pagination.
Spengler, R.W., 1977, Geologic map of the Salyersville SouthQuadrangle, Magoffin and Breathitt Counties, Kentucky:U.S. Geological Survey Geologic Quadrangle Map GQ-1373.
Taylor, P.B., 1995, Hydrologic assessment, SEDCAD+ modelvalidation, and infiltration basin performance for theAppalachian coal region in Kentucky: Lexington, Uni-versity of Kentucky, M.S. Thesis, 301 p.
References Cited
Thompson, D.B., 1987, A microcomputer program for inter-preting time-lag permeability tests: Ground Water, v. 25,no. 2. p. 212–218.
U.S. Geological Survey, 1980, National handbook for rec-ommended methods for water-data acquisition; chapter2—Ground water: U.S. Geological Survey Work Group2, 147 p.
Weinheimer, R.L., 1983, Vertical sequence and diagenesis inBreathitt sandstones in eastern Kentucky: Cincinnati,Ohio, University of Cincinnati, M.S. Thesis, 147 p.
Williams, R.S., and Hammond, S.E., 1988, Soil-water hy-drology and geochemistry of a coal spoil at a reclaimedsurface mine in Routt County, Colorado: U.S. Geologi-cal Survey Water-Resources Investigations Report 86-4350, 100 p.
Wunsch, D.R., 1992, Ground-water geochemistry and its re-lationship to the flow system at an unmined site in theEastern Kentucky Coal Field: Lexington, University ofKentucky, Ph.D. Dissertation, 239 p.
Wunsch, D.R., Dinger, J.S., and Taylor, P.B., 1992, Design,construction, and monitoring of the ground-water re-sources of a large spoil area: Star Fire tract, eastern Ken-tucky: Kentucky Geological Survey, ser. 11, Report ofInvestigations 6, 16 p.

30 Hydrogeology, Hydrogeochemistry, and Spoil Settlement at the Star Fire Tract
APPENDIX A:DATA FOR SAMPLES FROM MONITORING WELLS

31Appendix A

32 Hydrogeology, Hydrogeochemistry, and Spoil Settlement at the Star Fire Tract

33Appendix A

34 Hydrogeology, Hydrogeochemistry, and Spoil Settlement at the Star Fire Tract

35Appendix A

36 Hydrogeology, Hydrogeochemistry, and Spoil Settlement at the Star Fire Tract

37Appendix A

38 Hydrogeology, Hydrogeochemistry, and Spoil Settlement at the Star Fire Tract

39Appendix A

40 Hydrogeology, Hydrogeochemistry, and Spoil Settlement at the Star Fire Tract

41Appendix A

42 Hydrogeology, Hydrogeochemistry, and Spoil Settlement at the Star Fire Tract
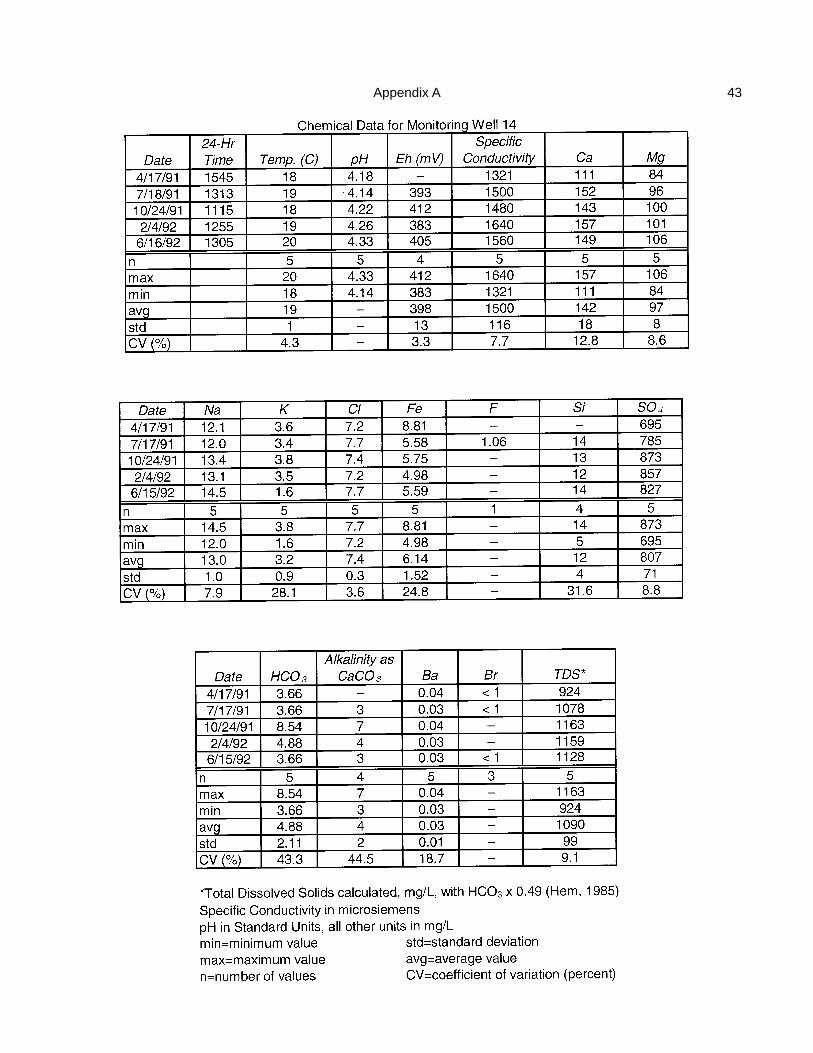
43Appendix A

44 Hydrogeology, Hydrogeochemistry, and Spoil Settlement at the Star Fire Tract

45Appendix A

46 Hydrogeology, Hydrogeochemistry, and Spoil Settlement at the Star Fire Tract
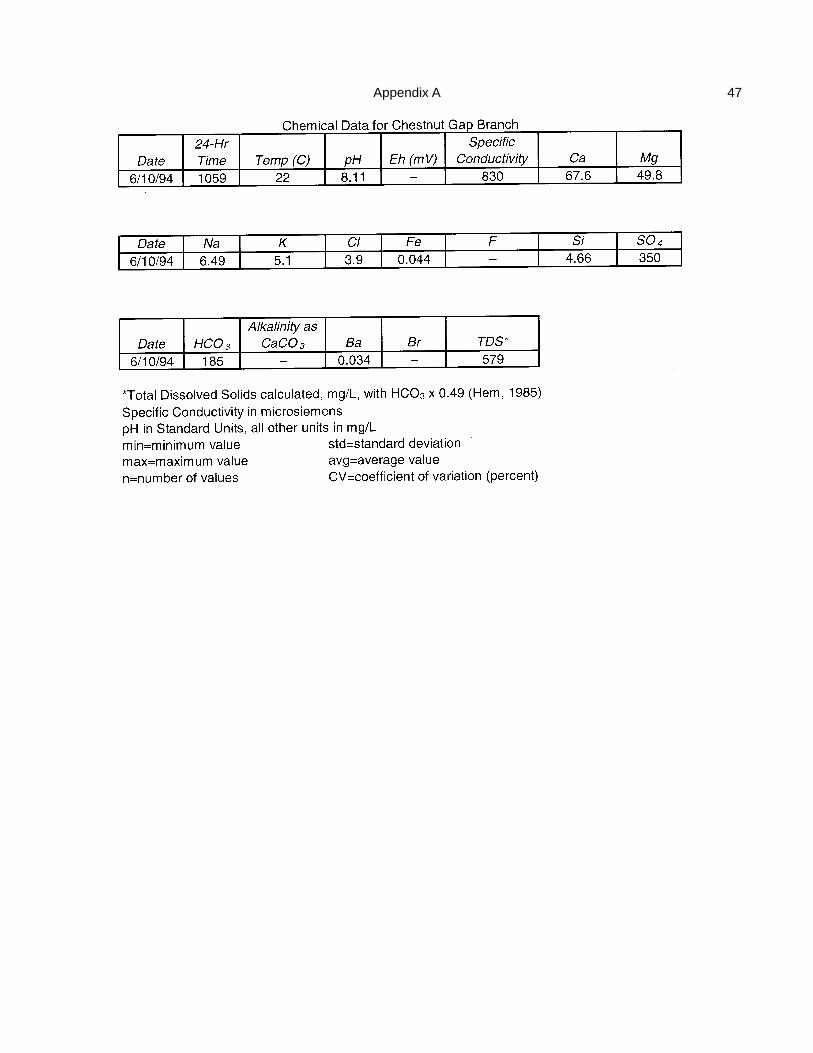
47Appendix A

48 Hydrogeology, Hydrogeochemistry, and Spoil Settlement at the Star Fire Tract
APPENDIX B:DATA FOR STORM-EVENT SAMPLING

49Appendix AAppendix B