hydrologic cycle - university of rochester lecture 1.pdfhydrologic cycle • the transfer of heat...
TRANSCRIPT

Hydrologic CycleHydrologic CycleLooking at movement of energy through natural systems
http://www.cet.nau.edu/Projects/SWRA/research.html

Hydrologic Cycle
Berner and Berner, The Global Water Cycle, 1987

Hydrologic CycleHydrologic CycleImportant in terms of examining other chemical cycles
Water:• Due to the structure of water (dipole properties- having both a positive and
a negative end), it forms hydrogen bonds between the water molecules which are weak in comparison to the covalent bonds (about 20x stronger) between the oxygen and hydrogen within a water molecule.
•However, the presence of these hydrogen bonds do serve to make the molecule more stable than other hydrogen compounds such as hydrogen sulfide which exists as a gas at normal temperature.
http://www.ldeo.columbia.edu/edu/dees/ees/lithosphere/hays_tutorial_3/figure1.htm
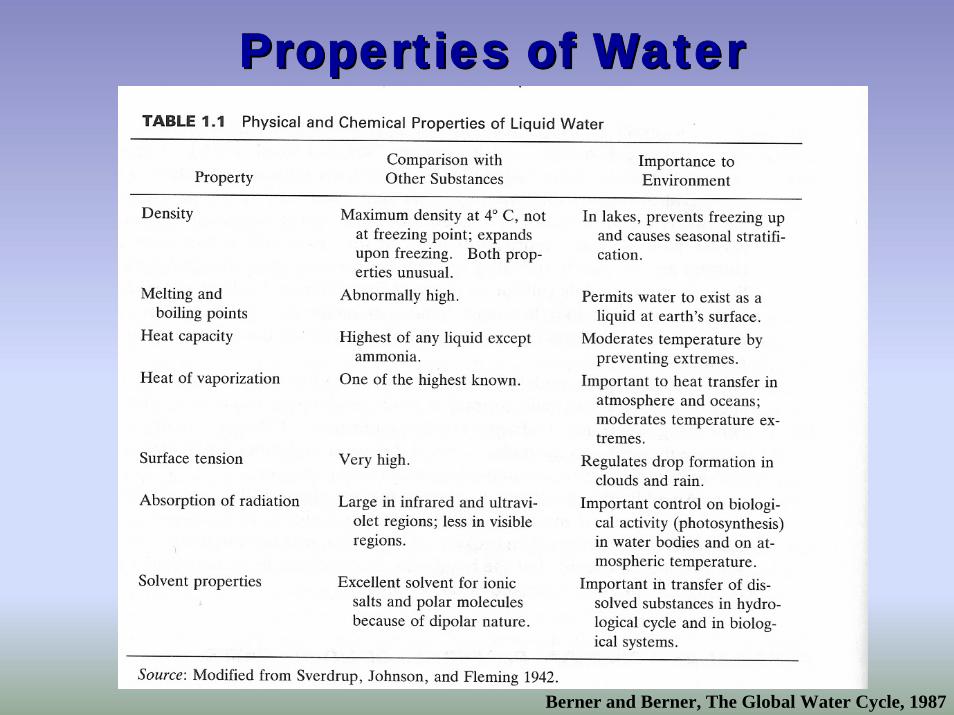
Properties of WaterProperties of Water
Berner and Berner, The Global Water Cycle, 1987
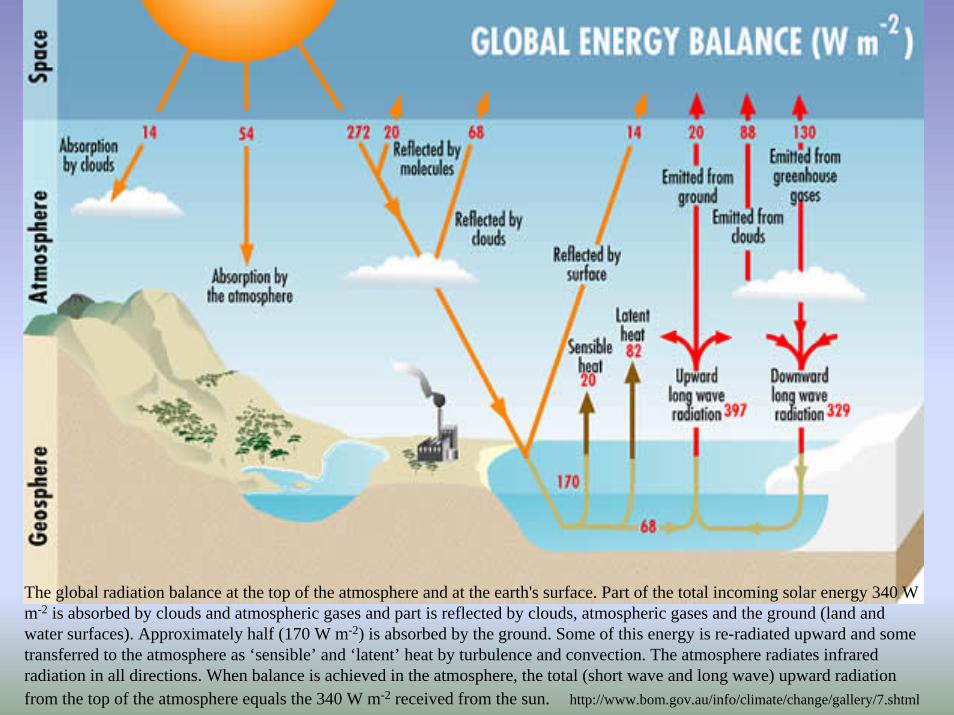
The global radiation balance at the top of the atmosphere and at the earth's surface. Part of the total incoming solar energy 340 W m-2 is absorbed by clouds and atmospheric gases and part is reflected by clouds, atmospheric gases and the ground (land and water surfaces). Approximately half (170 W m-2) is absorbed by the ground. Some of this energy is re-radiated upward and some transferred to the atmosphere as ‘sensible’ and ‘latent’ heat by turbulence and convection. The atmosphere radiates infrared radiation in all directions. When balance is achieved in the atmosphere, the total (short wave and long wave) upward radiation from the top of the atmosphere equals the 340 W m-2 received from the sun. http://www.bom.gov.au/info/climate/change/gallery/7.shtml
Hydrologic Cycle
• The transfer of heat and mass occurs through oceans and atmosphere. This movement is ultimately derived from the Sun.
• The sun influences the atmosphere which influences wind currents which influences ocean surface currents which effectively transfers heat from low to high latitudes.
• Otherwise, we would be in a perpetual deep freeze. In glacial times, this heat/energy transport mechanism probably shut down to some extent.

Because of these qualities, water acts as a thermostat to lessen extreme temperatures such as the west coast of Europe and the west coast of the US.In close proximity to the oceans, the temperatures vary less.
• San Francisco varies by about 10oC while Washington DC varies by about 30oC.
http://www.lord.ca/offices/usa/usa.html
El Paso, TX San Francisco, CA
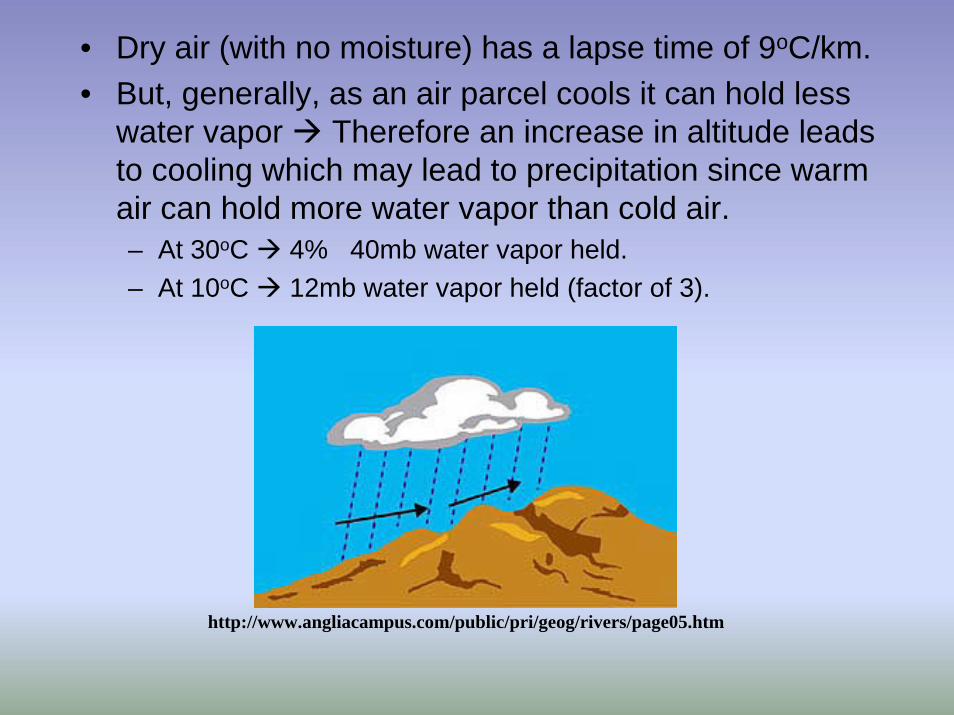
• Dry air (with no moisture) has a lapse time of 9oC/km.• But, generally, as an air parcel cools it can hold less
water vapor Therefore an increase in altitude leads to cooling which may lead to precipitation since warm air can hold more water vapor than cold air.– At 30oC 4% 40mb water vapor held.– At 10oC 12mb water vapor held (factor of 3).
http://www.angliacampus.com/public/pri/geog/rivers/page05.htm
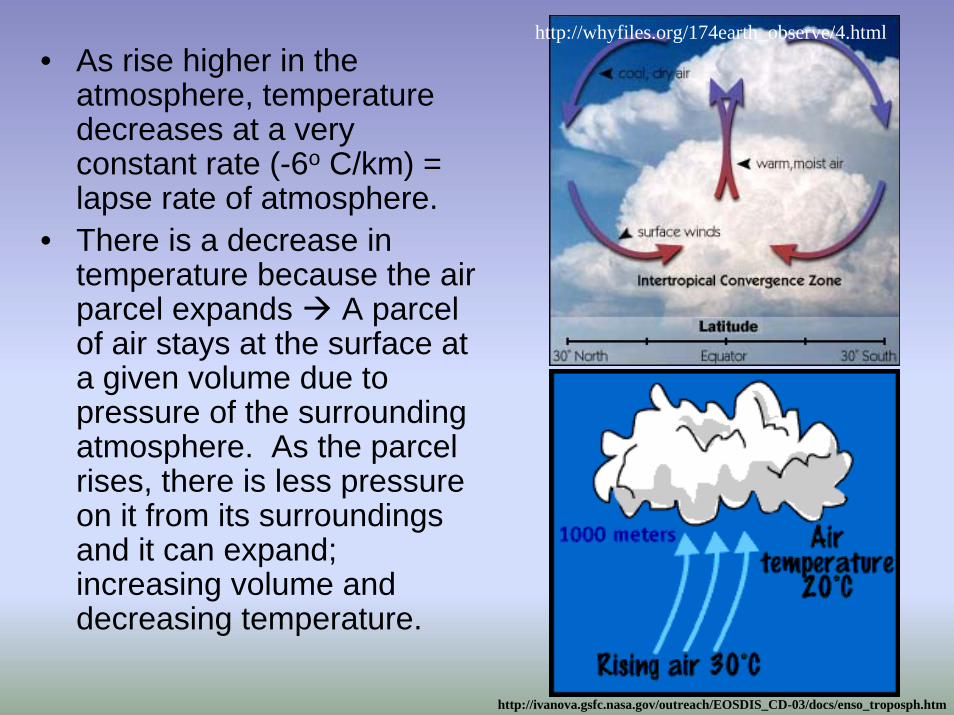
• As rise higher in the atmosphere, temperature decreases at a very constant rate (-6o C/km) = lapse rate of atmosphere.
• There is a decrease in temperature because the air parcel expands A parcel of air stays at the surface at a given volume due to pressure of the surrounding atmosphere. As the parcel rises, there is less pressure on it from its surroundings and it can expand; increasing volume and decreasing temperature.
http://whyfiles.org/174earth_observe/4.html
http://ivanova.gsfc.nasa.gov/outreach/EOSDIS_CD-03/docs/enso_troposph.htm
http://rst.gsfc.nasa.gov/Sect14/Sect14_1b.html
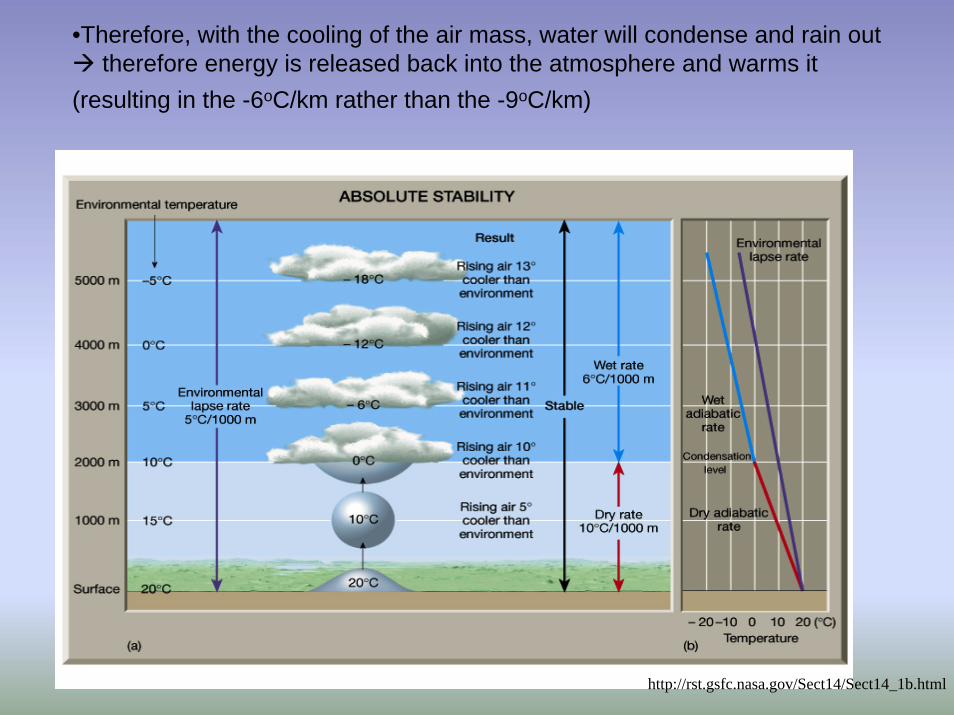
•Therefore, with the cooling of the air mass, water will condense and rain out therefore energy is released back into the atmosphere and warms it
(resulting in the -6oC/km rather than the -9oC/km)
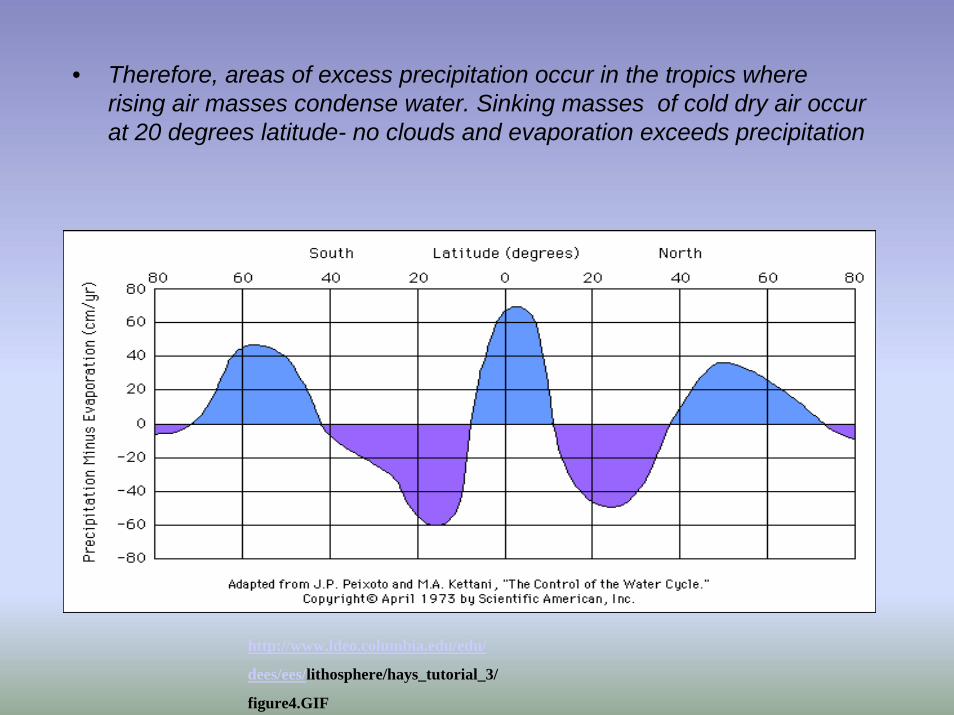
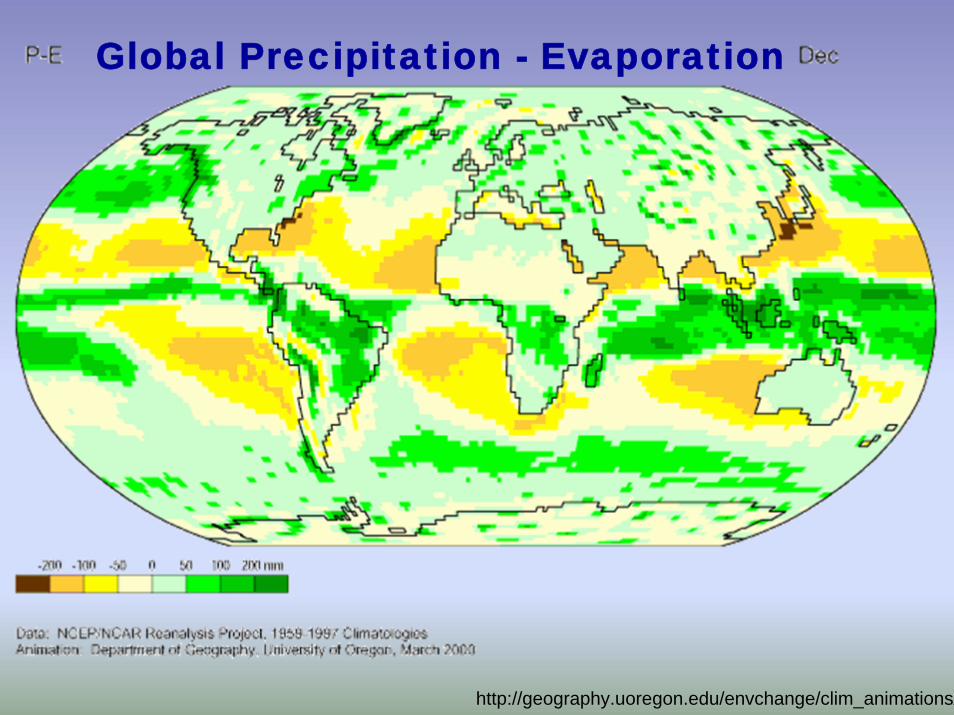
• Therefore, areas of excess precipitation occur in the tropics where rising air masses condense water. Sinking masses of cold dry air occur at 20 degrees latitude- no clouds and evaporation exceeds precipitation
http://www.ldeo.columbia.edu/edu/
dees/ees/lithosphere/hays_tutorial_3/
figure4.GIF
http://www.ldeo.columbia.edu/~martins/climate_water/slides/US_precip_map.gif
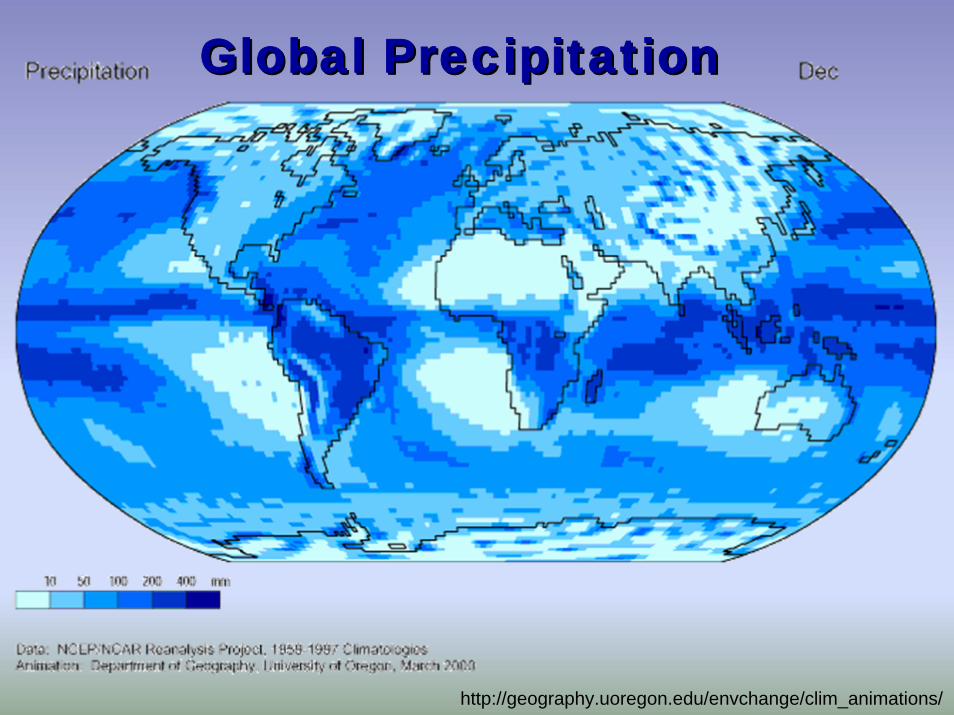
Global Precipitation Global Precipitation
http://geography.uoregon.edu/envchange/clim_animations/
http://geography.uoregon.edu/envchange/clim_animations/
Global Precipitation - Evaporation
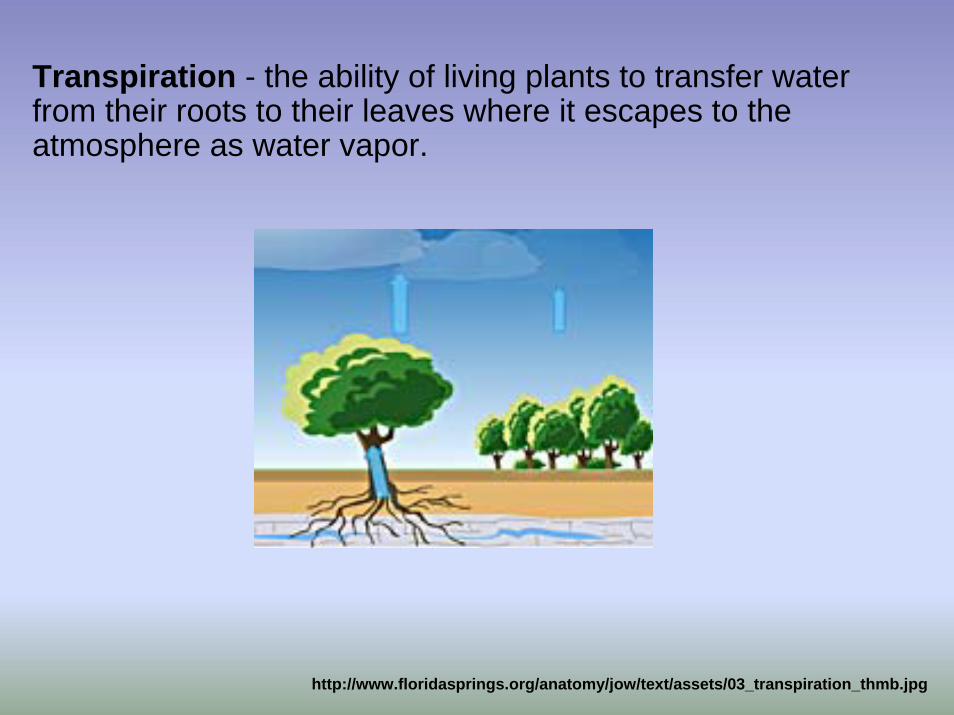
Transpiration - the ability of living plants to transfer water from their roots to their leaves where it escapes to the atmosphere as water vapor.
http://www.floridasprings.org/anatomy/jow/text/assets/03_transpiration_thmb.jpg

Fetter, Applied Hydrogeology 4th Edition
Potential and Actual Evapo-transpiration

Transpiration: 20-30% of total precipitation in grasslands80% of total precipitation in forest regimes.
Evaporation: 100% in desert
Whatever is left (20-80%) contributes to the base flow and percolates down to the water table.
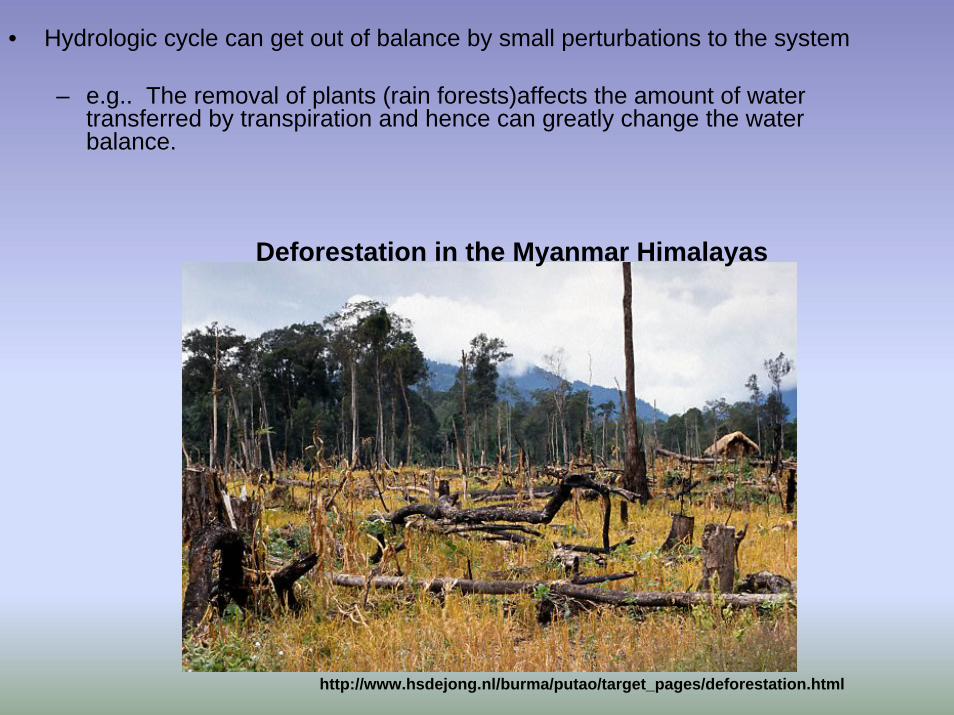
• Hydrologic cycle can get out of balance by small perturbations to the system
– e.g.. The removal of plants (rain forests)affects the amount of water transferred by transpiration and hence can greatly change the water balance.
http://www.hsdejong.nl/burma/putao/target_pages/deforestation.html
Deforestation in the Myanmar Himalayas
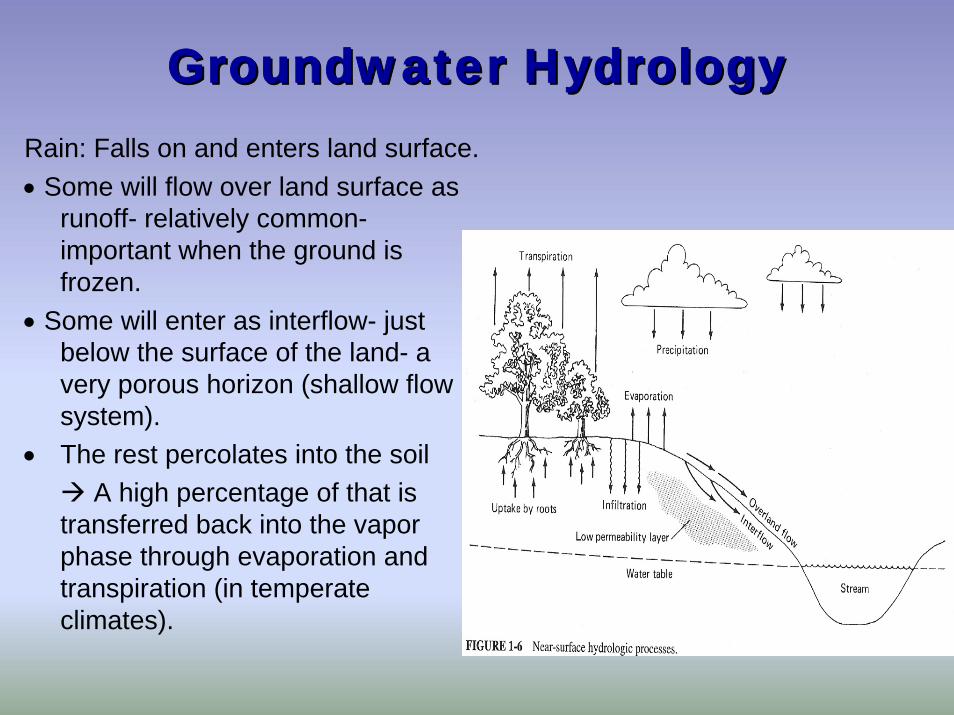
Groundwater HydrologyGroundwater HydrologyRain: Falls on and enters land surface.• Some will flow over land surface as
runoff- relatively common-important when the ground is frozen.
• Some will enter as interflow- just below the surface of the land- a very porous horizon (shallow flow system).
• The rest percolates into the soil A high percentage of that is
transferred back into the vapor phase through evaporation and transpiration (in temperate climates).
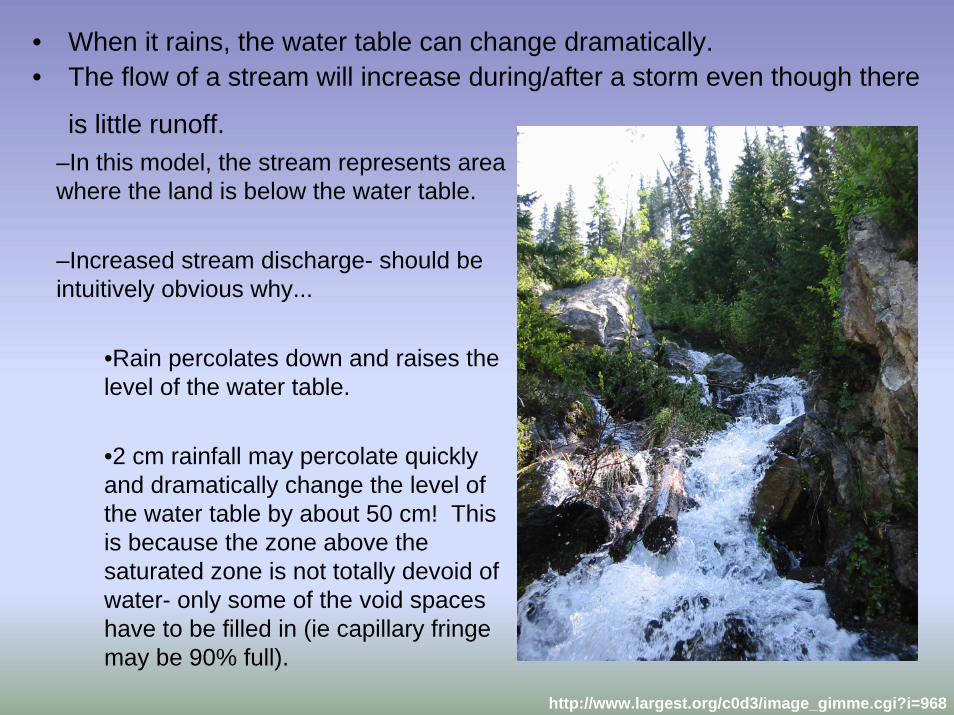
• When it rains, the water table can change dramatically. • The flow of a stream will increase during/after a storm even though there
is little runoff.–In this model, the stream represents area where the land is below the water table.
–Increased stream discharge- should be intuitively obvious why...
•Rain percolates down and raises the level of the water table.
•2 cm rainfall may percolate quickly and dramatically change the level of the water table by about 50 cm! This is because the zone above the saturated zone is not totally devoid of water- only some of the void spaces have to be filled in (ie capillary fringe may be 90% full).
http://www.largest.org/c0d3/image_gimme.cgi?i=968
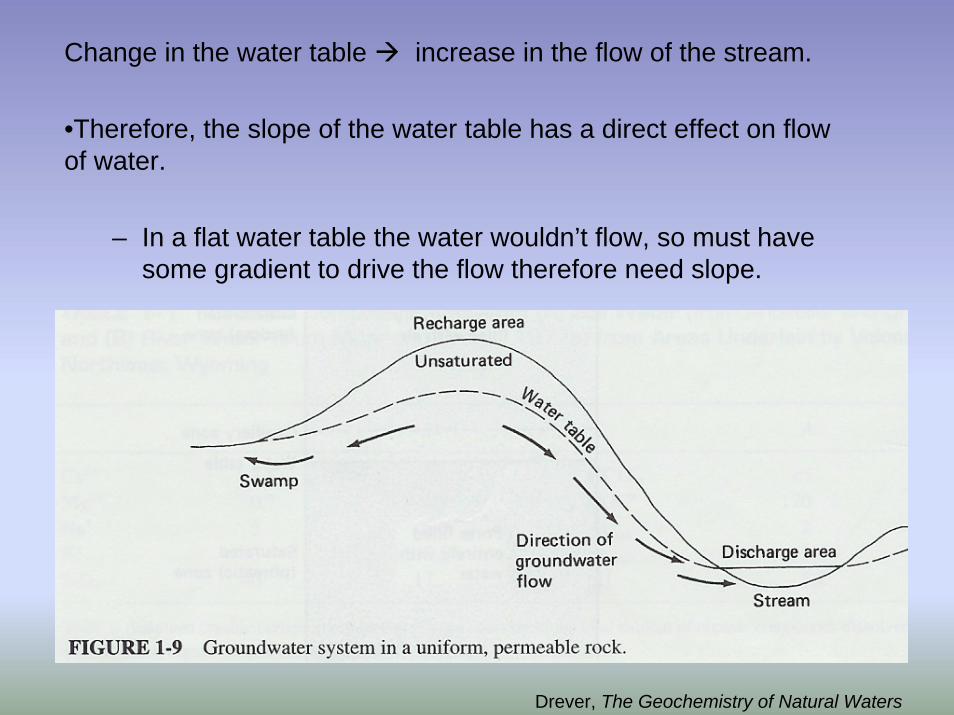
Change in the water table increase in the flow of the stream.
•Therefore, the slope of the water table has a direct effect on flow of water.
– In a flat water table the water wouldn’t flow, so must have some gradient to drive the flow therefore need slope.
Drever, The Geochemistry of Natural Waters
Water ‘box’(Weir) constructed to monitor flow.• During rain events, the flow increases.
• But the water transported is not just the water from the precipitation event but rather water in the subsurface.
How does the water flow through the subsurface?
* Need to look at tools to measure flow and factors controlling flow.
• Flow is driven by gradient : height /length (Δh/Δl) of the water table
• The medium the water flows through also has an effect on the flow.
The implications of these observations lead to…
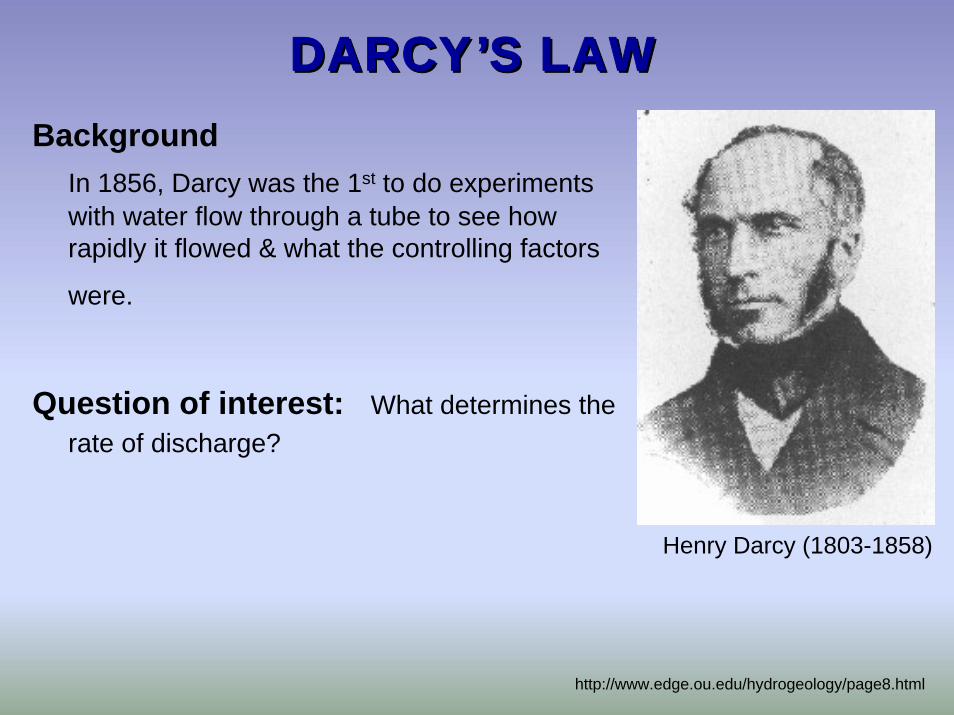
DARCYDARCY’’S LAWS LAWBackground
In 1856, Darcy was the 1st to do experiments with water flow through a tube to see how rapidly it flowed & what the controlling factors
were.
Question of interest: What determines the rate of discharge?
Henry Darcy (1803-1858)
http://www.edge.ou.edu/hydrogeology/page8.html
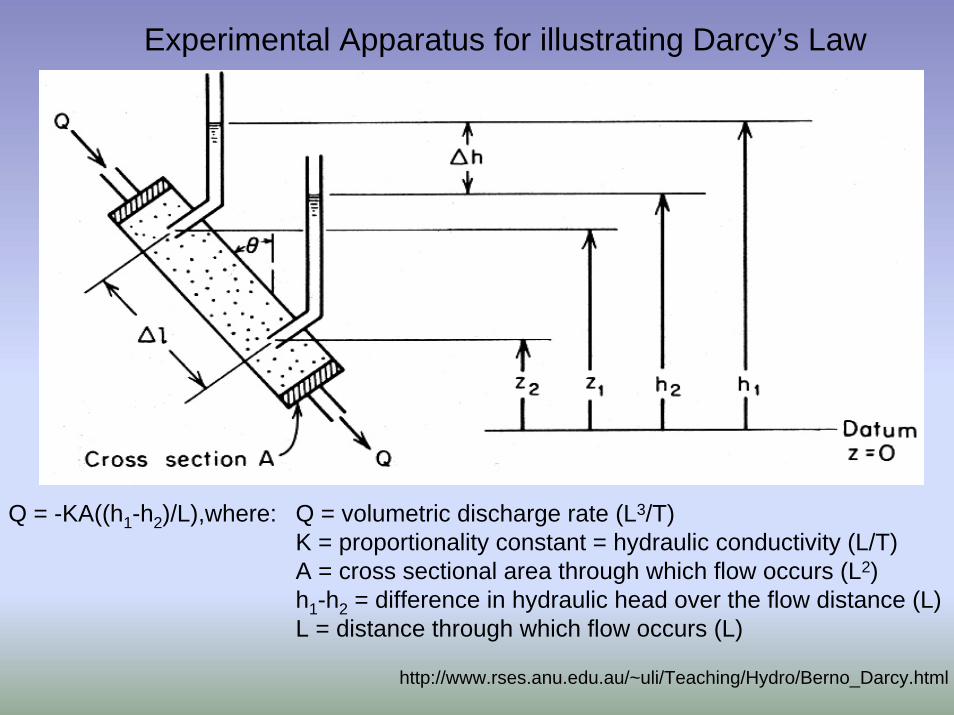
Experimental Apparatus for illustrating Darcy’s Law
http://www.rses.anu.edu.au/~uli/Teaching/Hydro/Berno_Darcy.html
Q = -KA((h1-h2)/L),where: Q = volumetric discharge rate (L3/T) K = proportionality constant = hydraulic conductivity (L/T) A = cross sectional area through which flow occurs (L2) h1-h2 = difference in hydraulic head over the flow distance (L) L = distance through which flow occurs (L)
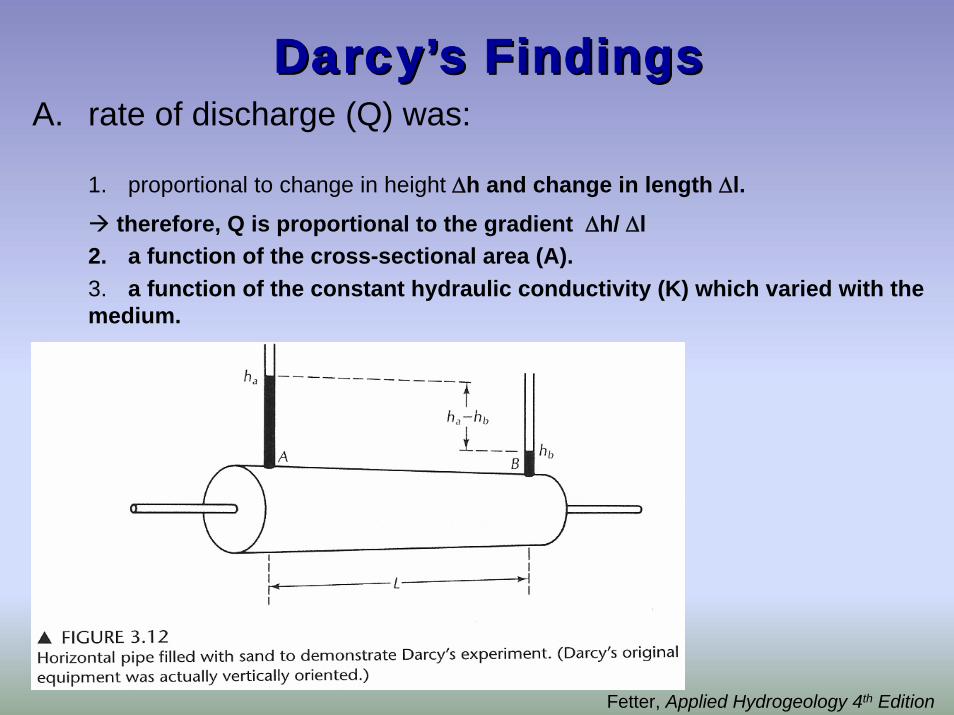
DarcyDarcy’’s Findingss FindingsA. rate of discharge (Q) was:
1. proportional to change in height Δh and change in length Δl.therefore, Q is proportional to the gradient Δh/ Δl
2. a function of the cross-sectional area (A).3. a function of the constant hydraulic conductivity (K) which varied with the medium.
Fetter, Applied Hydrogeology 4th Edition
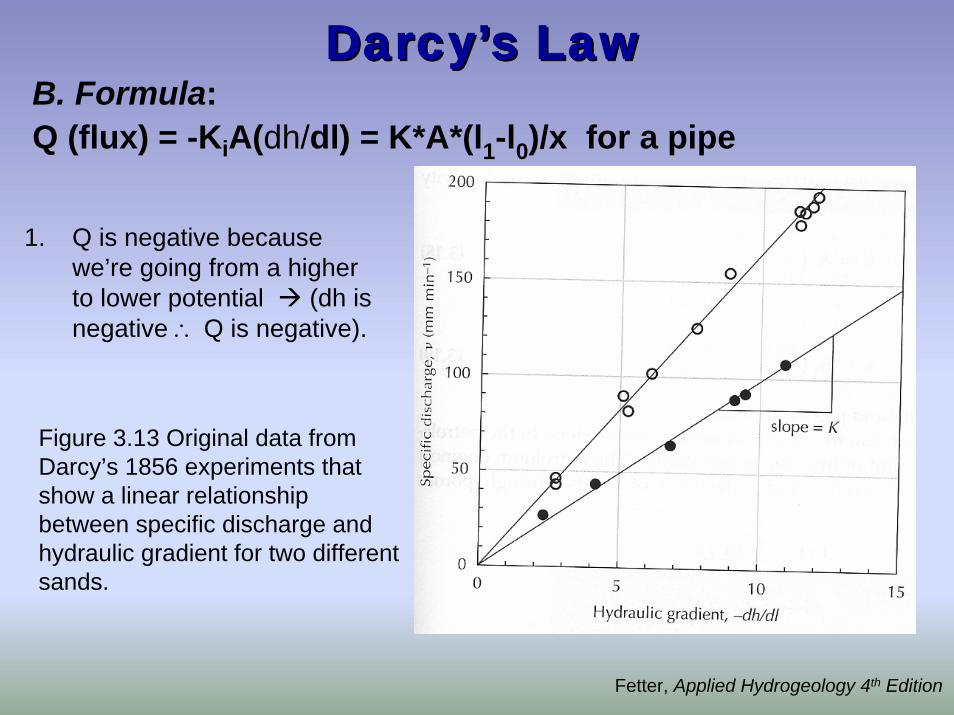
DarcyDarcy’’s Laws LawB. Formula: Q (flux) = -KiA(dh/dl) = K*A*(l1-l0)/x for a pipe
1. Q is negative because we’re going from a higher to lower potential (dh is negative ∴ Q is negative).
Figure 3.13 Original data from Darcy’s 1856 experiments that show a linear relationship between specific discharge and hydraulic gradient for two different sands.
Fetter, Applied Hydrogeology 4th Edition
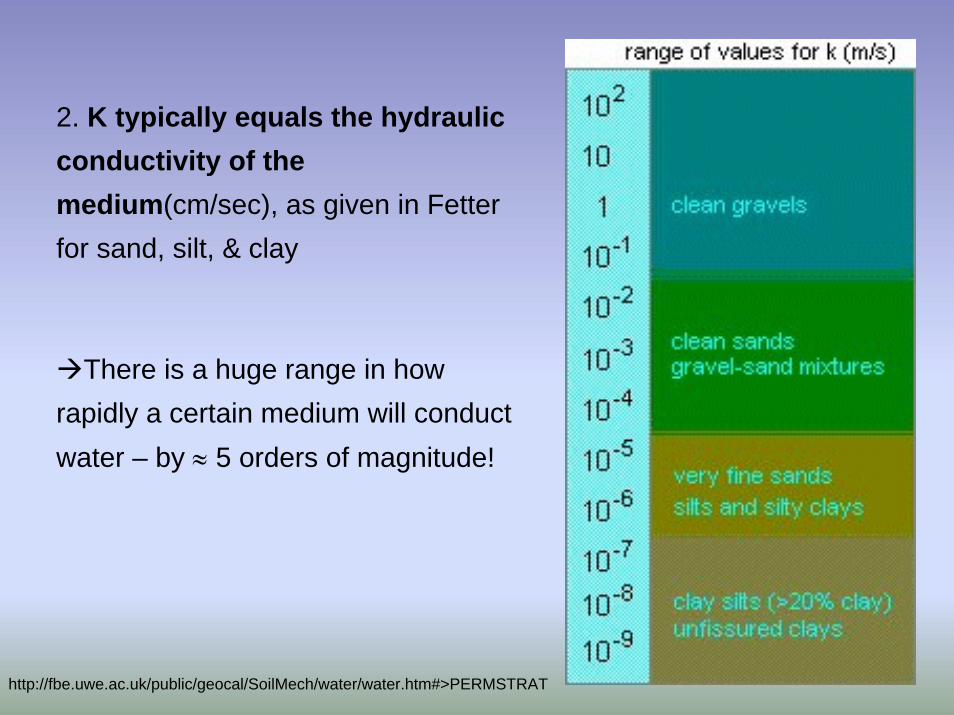
2. K typically equals the hydraulic conductivity of the medium(cm/sec), as given in Fetter for sand, silt, & clay
There is a huge range in how rapidly a certain medium will conduct water – by ≈ 5 orders of magnitude!
http://fbe.uwe.ac.uk/public/geocal/SoilMech/water/water.htm#>PERMSTRAT
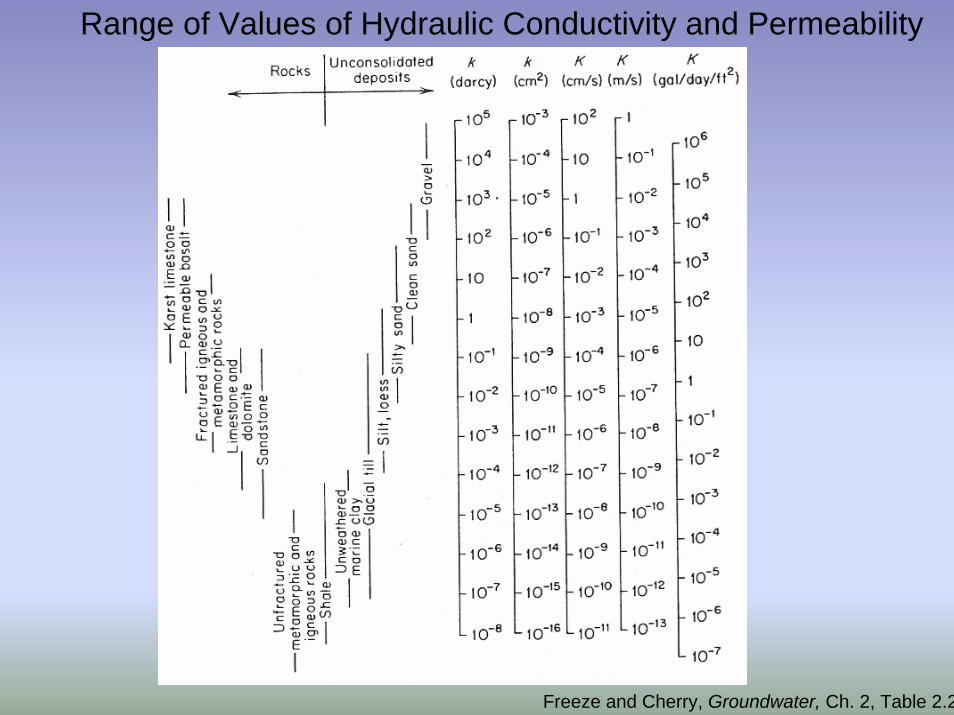
Freeze and Cherry, Groundwater, Ch. 2, Table 2.2
Range of Values of Hydraulic Conductivity and Permeability
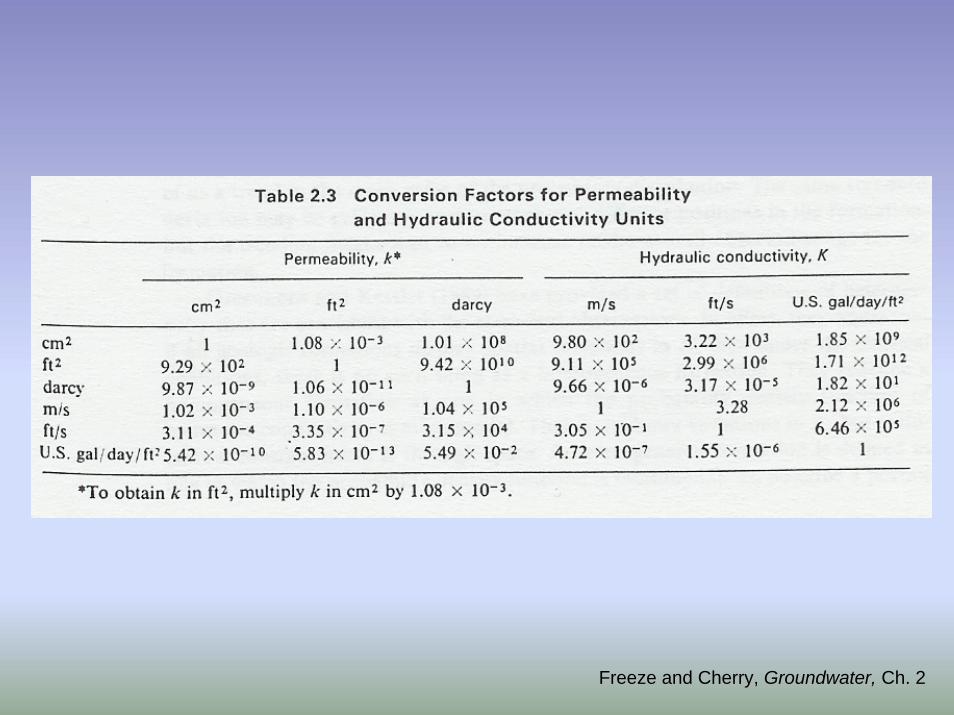
Freeze and Cherry, Groundwater, Ch. 2
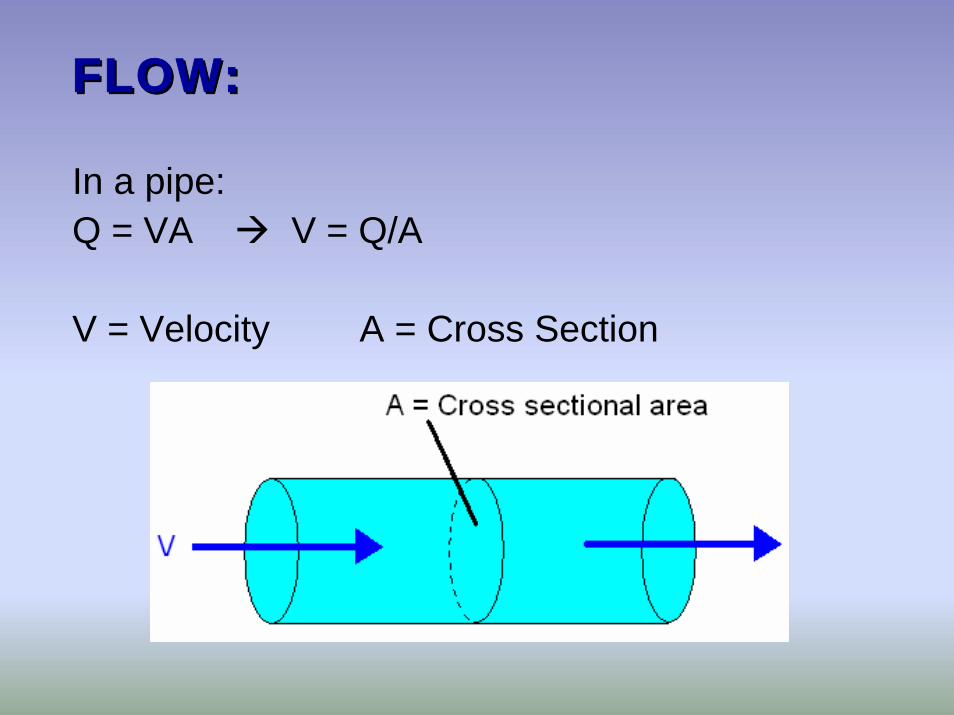
FLOW:FLOW:
In a pipe:Q = VA V = Q/A
V = Velocity A = Cross Section
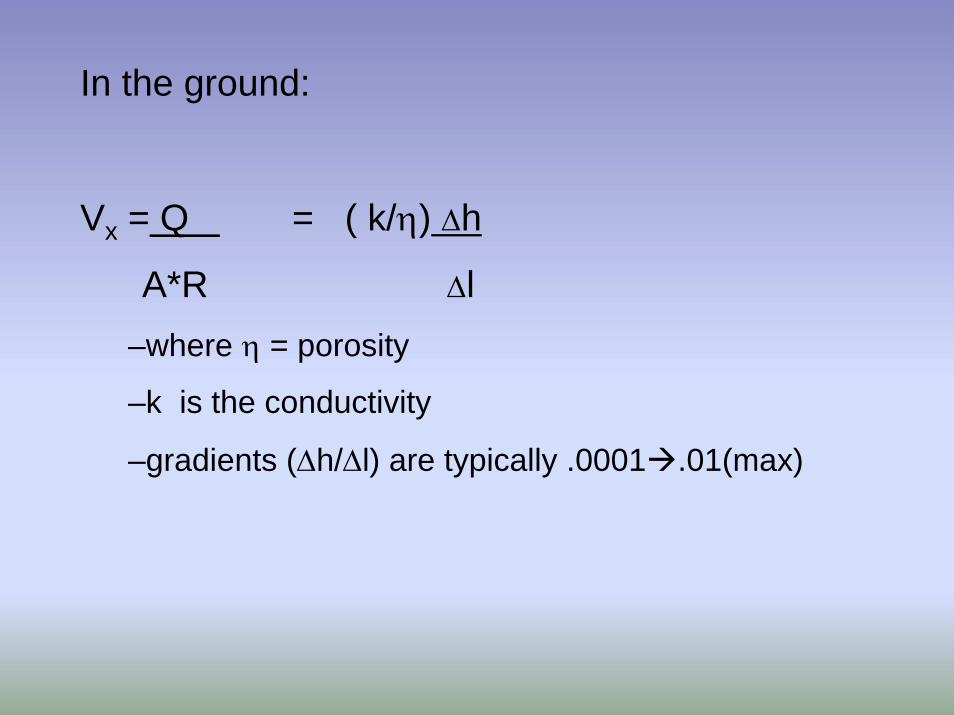
In the ground:
Vx = Q = ( k/η) Δh
A*R Δl–where η = porosity
–k is the conductivity
–gradients (Δh/Δl) are typically .0001 .01(max)
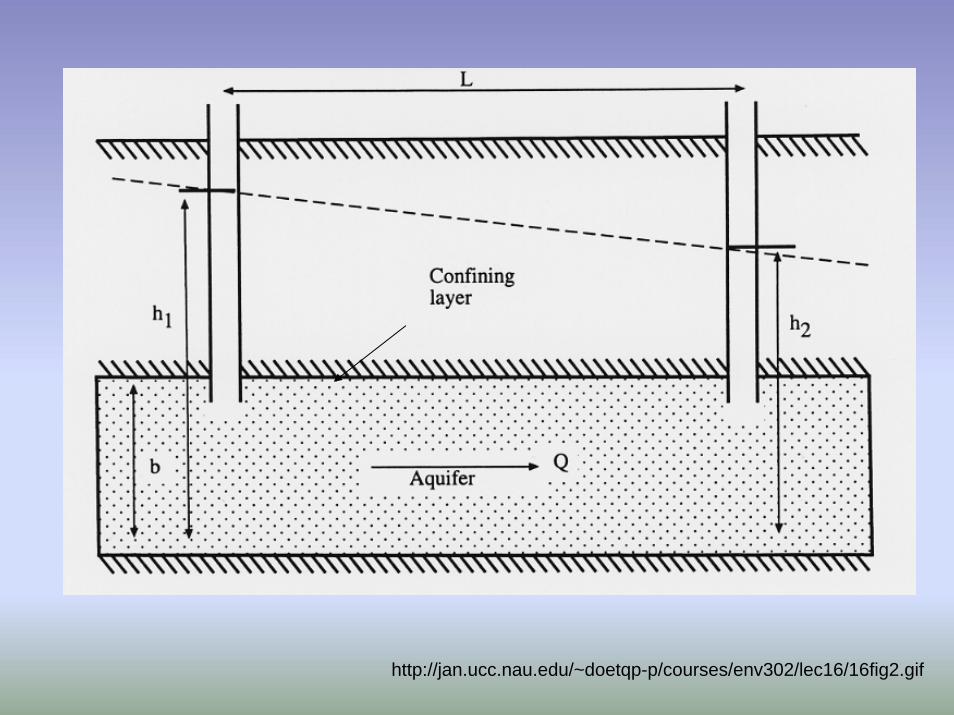
http://jan.ucc.nau.edu/~doetqp-p/courses/env302/lec16/16fig2.gif
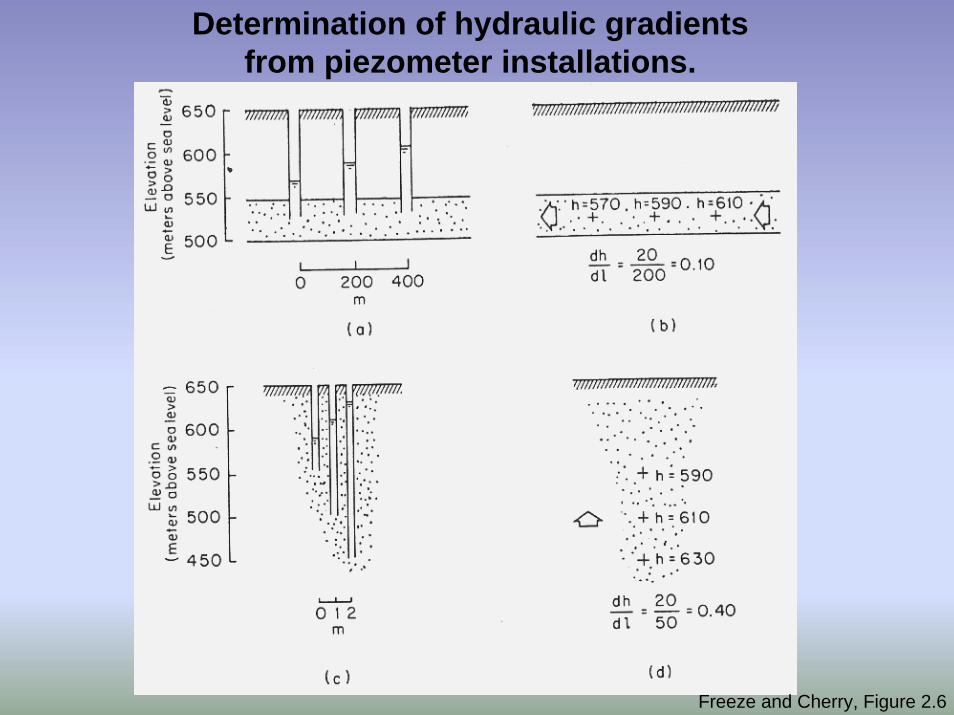
Determination of hydraulic gradients from piezometer installations.
Freeze and Cherry, Figure 2.6

Steady flow through a confined aquifer of uniform thickness
Figure 4.16. Fetter, Applied Hydrogeology 4th EditionFigure 4.17. Fetter, Applied Hydrogeology 4th Edition
Steady flow through an unconfined aquifer resting on a horizontal impervious surface

Equation that governs fluid flows are fairly straight forward. Only rigorous in interpretation and when in 3 dimensions.
Essentially, the velocity will depend on the hydraulic conductivity; therefore need to establish the hydraulic conductivity of the medium which is typically performed with a variety of aquifer testing (e.g. slug tests) or laboratory testing (permeameter)
Transport will depend on the hydraulic gradient – established from well observations