hydrologic significance of the lithofacies of the … significance of the lithofacies of the sparta...
TRANSCRIPT

Hydrologic Significance
of the Lithofacies of the
Sparta Sand in Arkansas
Louisiana, Mississippi
and TexasGEOLOGICAL SURVEY PROFESSIONAL PAPER 569-A

Hydrologic Significance
of the Lithofacies of the
Sparta Sand in Arkansas
Louisiana, Mississippi
and TexasBy J. N. PAYNE
GEOHYDROLOGY OF THE CLAIBORN GROUP
GEOLOGICAL SURVEY PROFESSIONAL PAPER 569-A
UNITED STATES GOVERNMENT PRINTING OFFICE, WASHINGTON : 1968

UNITED STATES DEPARTMENT OF THE INTERIOR
STEW ART L. UDALL, Secretary
GEOLOGICAL SURVEY
William T. Pecora, Director
For sale by the Superintendent of Documents, U.S. Government Printing Office Washington, D.C. 20402

CONTENTS
Abstract.__________________________________________Introduction-_ _____________________________________
Purpose and scope._____________________________Acknowledgments. ______________________________
Geology-__________________________________________Structure._____________________________________Thickness_ _ __________________________________Lithologic variations and interpretation of deposi-
tional environment._________________________Maximum sand-unit thickness.___________________
Al 112223
34
Hydrology.--_--_---------_-----_----------------_-Permeability and transmissibility in relation to
geologic factors-______________________________Recharge and discharge.________________________Regional flow__________________________________
Chemical quality of water and relations to geologic and hydrologic factors______________________________
Chemical provinces-______________ _____________Dissolved solids._______________________________
Extent of flushing of the Sparta Sand _________________Conclusions._______________________________________Selected bibliography________________________________
ILLUSTRATIONS
Page A5
1010141415
[Plates are in separate case]
PLATE 1. Section A-A'-A" showing correlation of the Sparta Sand and associated formations through the central part of Arkansas, Louisiana, Mississippi, and Texas.
2. Section B-B' showing correlation of formations, and dissolved-solids content, of Sparta aquifer in northeastern Louisiana, and southeastern Arkansas.
3. Structure-contour map on the base of the Sparta Sand in Arkansas, Louisiana, Mississippi, and Texas.4. Map showing sand-percentage distribution and thickness of the Sparta Sand in Arkansas, Louisiana, Mississippi, and
Texas.5. Sections C-C' and D-D' showing variable thickness of continuous sand units in the Sparta Sand, northeastern Louisiana
and southeastern Arkansas.6. Map showing the maximum sand-unit thickness in the Sparta Sand in Arkansas, Louisiana, Mississippi, and Texas.7. Map showing estimated coefficient of transmissibility of the total sand thickness of the Sparta Sand in Arkansas, Louisiana,
and Mississippi.8. Map showing the piezometric surface and the base of fresh ground water in the Sparta Sand in Arkansas, Louisiana,
and Mississippi.9. Map showing dissolved-solids content and chemical provinces of water in the Sparta Sand in Arkansas, Louisiana,
Mississippi, and Texas.10. Map showing cumulative thickness of fresh- water-bearing sand, and percentage of total sand thickness that is fresh
water saturated, in the Sparta Sand in Arkansas, Louisiana, and Mississippi.
FIGURE 1. Index map showing area of report---__-____-__--___-____----_---_-----------------------_------------_2. Generalized section showing relation of regional geology and hydrology. ________-____--_-_---_-_-_----___-.3. Electric logs of wells and chemical analyses of waters from the Sparta Sand in the Monroe, La., area showing
variation in major chemical constituents at different stratigraphic positions within the formation. _________4. Graph showing relation of specific conductance to dissolved-solids content in waters from the Sparta Sand in
Arkansas, Louisiana, Mississippi, and Texas ___ ____________________________________________________
Page A2
7
9
11
TABLE
TABLE 1. Analyses of water from representative wells in the Sparta Sand-Page A12


GEOHYDROLOGY OF THE CLAIBORN GROUP
HYDROLOGIG SIGNIFICANCE OF THE LITHOFACIES OF THE SPARTA SAND IN ARKANSASLOUISIANA, MISSISSIPPI, AND TEXAS
By J. N. PAYNE
ABSTRACT
The study of the geohydrology of the Sparta Sand is the initial phase in the investigation of the geohydrology of the Olaiborne Group.
The thicker sections of the Sparta Sand lie along the axes of the Mississippi embayment and Desha basin. The area of maximum thickness, 1,100-1,200 feet, is in Claiborne and Warren Counties, Miss., and Madison Parish, La. Local thickening or thinning over some structures indicates structural movement during Sparta time.
A sand-percentage map prepared from data derived from interpretation of electric logs indicates that the Sparta Sand was deposited as a delta-fluvial plain complex in Arkansas, Louisiana, and Mississippi. This complex shows a text-book example of a well developed channel pattern. The delta-fluvial- plain complex probably resulted from an ancestral Mississippi River system. In most of Texas the sand-percentage map shows a pattern suggestive of offshore or near-shore bar deposition. A map of the maximum sand-unit thickness shows the de velopment during deposition of an interlacing channel pattern in Arkansas, Louisiana, and Mississippi. In the channel areas the maximum thickness of the sand units may be as much as 350 feet; in the interchannel areas the maximum thickness is generally less than 50 feet
Coefficients of permeability and transmissibility for the Sparta Sand vary widely in localized areas. In the channel- sand area of Arkansas, Louisiana, and Mississippi, data suggest that the coefficient of permeability increases with an increase in maximum sand-unit thickness. These permeability values which depend on sand unit thicknesses, were used to prepare a map showing the transmissibility of the total sand thickness of the Sparta Sand in Arkansas, Louisiana, Mississippi, and eastern Texas. The data on the map show a close relation be tween channel development and high transmissibility values.
The Sparta Sand is recharged by infiltration of water from precipitation on the outcrop, by leakage from other aquiflers, and by seepage from streams. Natural discharge from the Sparta Sand takes place primarily by leakage through the overlying and underlying confining beds. In Texas, west-central Louisiana, and southeastern Mississippi the direction of flow of ground water is down the regional dip toward the gulf coast geosyncline. In most of Arkansas, Louisiana, and Mis sissippi the regional flow is toward the Mississippi River alluvial valley. In the channel-sand area of Arkansas, Louisiana, and Mississippi the ground-water flow is governed by changes in transmissibility, which in turn reflects the lithology.
A study of the ground-water chemistry indicates that the areas of higher transmissibility have lower concentrations of dissolved solids than the areas of low transmissibility. On the basis of anion ratios, the waters of the Sparta Sand are grouped into three chemical provinces: the bicarbonate water province, the chloride water province, and the sulfate water province. The dissolved-solids content of waters from the Sparta Sand is closely related to the lithologic framework of the Sparta Sand area. Differences in water chemistry are attributed to regional differences in the rates of ground-water movement. Interpretation of the data suggests that the channel deposits have undergone a higher degree of flushing by fresh water than the interchannel deposits.
INTRODUCTION
PURPOSE AND SCOPE
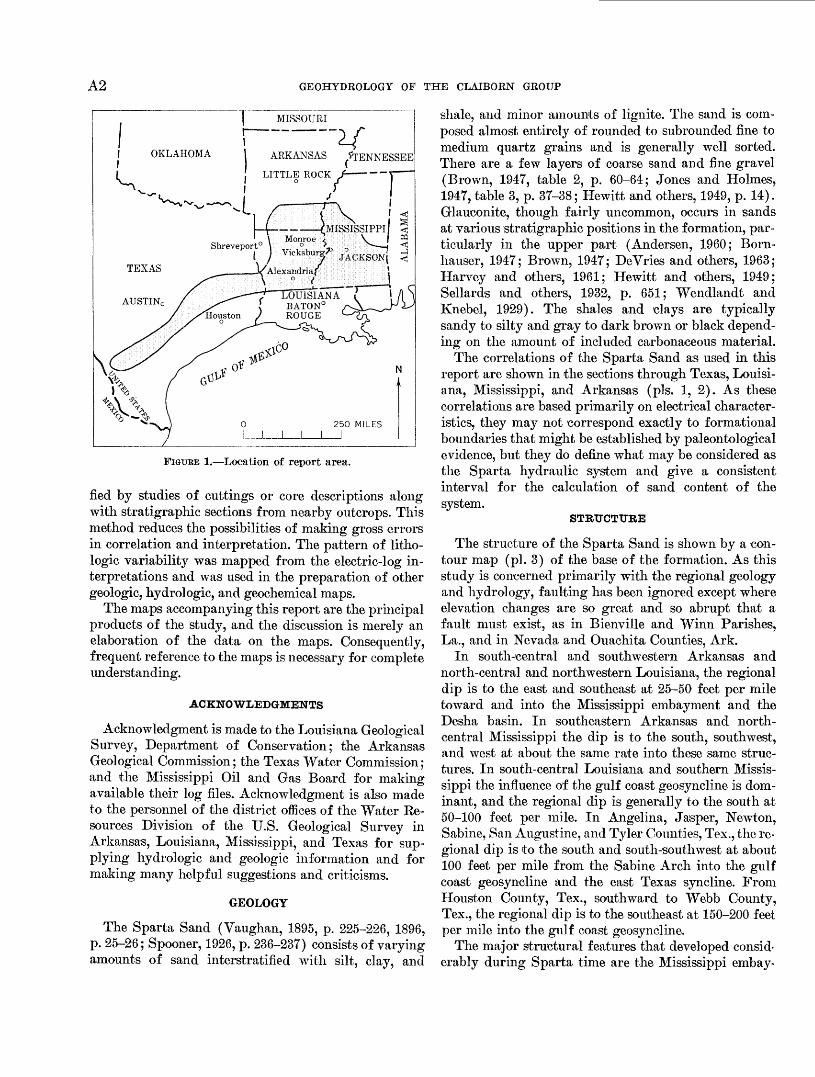
Abundant electric-log and hydrologic data on the gulf coast area of the United States are available for study and analysis to aid in understanding the relations between hydrologic and geologic factors and delineating the potential for ground-water development. The rela tions between hydrologic and geologic factors in aqui fers can more accurately indicate the ground-water potential if they are studied on a regional basis. There fore, a study of the formations of the Claiborne Group of Eocene age was begun in early 1961. The initial phase of this study describes and evaluates the relations of stratigraphy, structure, facies development, and de- positional controls to the hydraulic characteristics of the Sparta Sand in parts of Arkansas, Louisiana, Mis sissippi, and Texas (fig. 1). Similar reports will be pre pared for the Cockfield and Cane River Formations.
Both electric-log data on oil and gas wells and on test wells and hydrologic data were used to prepare the geologic and hydrologic maps. The electric-log analysis was initiated in areas of dense drilling where extremely close control was available, and was then expanded systematically by running closed traverses of logged sections into less densely drilled areas. Where possible the lithologic interpretation of these sections was veri-
Al
A2 GEOHYDROLOGY OF THE CLAIBORN GROUP
FIGURE 1. Location of report area.
fied by studies of cuttings or core descriptions along with stratigraphic sections from nearby outcrops. This method reduces the possibilities of making gross errors in correlation and interpretation. The pattern of litho- logic variability was mapped from the electric-log in terpretations and was used in the preparation of other geologic, hydrologic, and geochemical maps.
The maps accompanying this report are the principal products of the study, and the discussion is merely an elaboration of the data on the maps. Consequently, frequent reference to the maps is necessary for complete understanding.
ACKNOWLEDGMENTS
Acknowledgment is made to the Louisiana Geological Survey, Department of Conservation; the Arkansas Geological Commission; the Texas Water Commission ; and the Mississippi Oil and Gas Board for making available their log files. Acknowledgment is also made to the personnel of the district offices of the Water Ke- sources Division of the U.S. Geological Survey in Arkansas, Louisiana, Mississippi, and Texas for sup plying hydrologic and geologic information and for making many helpful suggestions and criticisms.
GEOLOGY
The Sparta Sand (Vaughan, 1895, p. 225-226, 1896, p. 25-26; Spooner, 1926, p. 236-237) consists of varying amounts of sand interstratified with silt, clay, and
shale, and minor amounts of lignite. The sand is com posed almost entirely of rounded to subrounded fine to medium quartz grains and is generally well sorted. There are a few layers of coarse sand and fine gravel (Brown, 1947, table 2, p. 60-64; Jones and Holmes, 1947, table 3, p. 37-38; Hewitt and others, 1949, p. 14). Glauconite, though fairly uncommon, occurs in sands at various stratigraphic positions in the formation, par ticularly in the upper part (Andersen, 1960; Born- hauser, 1947; Brown, 1947; DeVries and others, 1963; Harvey and others, 1961; Hewitt and others, 1949; Sellards and others, 1932, p. 651; Wendlandt and Knebel, 1929). The shales and clays are typically sandy to silty and gray to dark brown or black depend ing on the amount of included carbonaceous material.
The correlations of the Sparta Sand as used in this report are shown in the sections through Texas, Louisi ana, Mississippi, and Arkansas (pis. 1, 2). As these correlations are based primarily on electrical character istics, they may not correspond exactly to formational boundaries that might be established by paleontological evidence, but they do define what may be considered as the Sparta hydraulic system and give a consistent interval for the calculation of sand content of the system.
STRUCTURE
The structure of the Sparta Sand is shown by a con tour map (pi. 3) of the base of the formation. As this study is concerned primarily with the regional geology and hydrology, faulting has been ignored except where elevation changes are so great and so abrupt that a fault must exist, as in Bienville and Winn Parishes, La., and in Nevada and Ouachita Counties, Ark.
In south-central and southwestern Arkansas and north-central and northwestern Louisiana, the regional dip is to the east and southeast at 25-50 feet per mile toward and into the Mississippi embayment and the Desha basin. In southeastern Arkansas and north- central Mississippi the dip is to the south, southwest, and west at about the same rate into these same struc tures. In south-central Louisiana and southern Missis sippi the influence of the gulf coast geosyncline is dom inant, and the regional dip is generally to the south at 50-100 feet per mile. In Angelina, Jasper, Newton, Sabine, San Augustine, and Tyler Counties, Tex., the re gional dip is to the south and south-southwest at about 100 feet per mile from the Sabine Arch into the gulf coast geosyncline and the east Texas syncline. From Houston County, Tex., southward to Webb County, Tex., the regional dip is to the southeast at 150-200 feet per mile into the gulf coast geosyncline.
The major structural features that developed consid erably during Sparta time are the Mississippi embay-

HYDROLOGIC SIGNIFICANCE OF THE LITHOFACIES OF THE SPARTA SAND A3
ment, Desha basin, Sabine arch, and Jackson dome, and, to a lesser extent, the Monroe uplift and the LaSalle arch. These developments are indicated by the thicken ing or thinning of the Sparta over these structures. The downwarping of the Mississippi embayment during Sparta and post-Sparta time is shown by the marked steepening of the dip on the basinward flanks of Jack son dome and similar structures. Minor structural fea tures are associated with the Tinsley oil field, Yazoo County, Miss., the Madisonville oil field, Madison County, Tex., and other oil fields and a number of salt domes (pis. 3, 4). Faulting such as is shown on pi. 3 occurred throughout the gulf coast area.
THICKNESS
The thickness of the Sparta Sand generally exceeds 800 feet along and near the axes of the Mississippi em bayment and the Desha basin in 'southeastern Arkansas, eastern Louisiana, and western Mississippi (pi. 4). The maximum thickness, 1,100-1,200 feet, occurs in Clai- borne and Warren Counties, Miss., and Madison Parish, La. Eastward from the axes of the Mississippi embay ment and Desha basin, the Sparta Sand thins rapidly to only 250-300 feet in central and east-central Missis sippi and 100-150 feet in southeastern Mississippi. Westward from the axes the thinning is more gradual; the Sparta is 400-600 feet thick in south-central and southwestern Arkansas and central and west-central Louisiana (pi. 4, sheet 1). In eastern Texas the forma tion generally is 300-500 feet thick, but it thins to 100-200 feet in Fayette and Gonzales Counties and maintains a rather constant thickness of 100-150 feet to the southwestern extremity of the area mapped in Webb County, Tex. (pi. 4, sheet 2).
Local variations in thickness are common and in some places pronounced, as in the Jackson, Miss., area. The more obvious of these variations are associated with localized structural features which were developing during the period of Sparta deposition. Such structures are the Jackson and Tinsley domes of Mississippi, parts of the Monroe uplift in Morehouse and Ouachita Par ishes, La., and Sharkey County, Miss., and the Desha basin in Drew and Lincoln Counties, Ark. Variations associated with structural growth are less pronounced over some of the oil-field structures in southern Ouachita, southern Bradley, and northern Union Counties, Ark., and in Madison County, Tex. Additional examples of local variations in thickness can be found by comparing the thickness map of the Sparta Sand with oil and gas maps. Some local variations in thick ness of the Sparta result from cut and fill channels at the base of the Sparta that penetrate the upper part of the Cane River Formation, and from differential com
paction of shales and clays surrounding massive sand bodies or areas containing a high percentage of sand. Such variations in thickness are generally indiscernible on maps drawn on a regional scale. However, some of the thick elongated areas in Madison, Richland, and Tensas Parishes, La., and Jefferson County, Miss., may result from differential compaction or from downcutting.
LITHOLOGIC VABIATIONS AND INTEBPBETATION OF DEPOSITIONAL ENVIBONMENT
The lithology of the Sparta Sand is highly variable both vertically and laterally. Predominantly sandy sec tions grade into predominantly shaly sections within very short distances (pis. 1, 2, 4). A good method of creating some order from such variability is to prepare a sand-percentage map on which the ratio of the thick ness of sand in the formation to the thickness of the formation is expressed as a percentage; that is:
a j , total thickness of sand .... nnhand percentage^ , ,,, . . j^ -. X100.r & total thickness of formation
The values calculated for each logged section can then be plotted on a map and grouped by appropriate per centage increments. This method was used in the prep aration of the sand-percentage map (pi. 4) of the 'Sparta Sand using increments of <10 percent, 10-30 percent, 30-50 percent, 50-70 percent and >70 percent. As previ ously mentioned, this work was begun in areas of good control, where the percentage values formed definable patterns that could reasonably be extended into areas of less control.
On the basis of the distribution of sand-concentration patterns, the Sparta can be divided into two areas which seem to have had different depositional environments. One area includes Louisiana, Mississippi, southern Ar kansas, and eastern Texas, and the other extends from Grimes to Webb Counties, Tex.
Louisiana, Mississippi, southern Arkansas, and east ern Texas. The most conspicuous characteristic of the lithologic pattern of the southern Arkansas-Louisiana- Mississippi-eastern Texas area is the well-developed lineation of sand concentrations in a general northerly direction, presumably normal to the orientation of the Sparta shoreline. The pattern of sand distribution in this area was probably created by a system of anastomos ing, constantly shifting stream channels and interlacing lakes, marshes and swamps such as would be developed in a large deltaic-fluvial plain. The frontal edge of this large arcuate former delta extends from Wayne County, Miss., southwestward through southeastern Louisiana probably as far as northern Pointe Coupee, St. Landry, and Alien Parishes, and thence west-northwestward

A4 GEOHYDROLOGY OF THE CLAIBORN GROUP
into Sabine County, Tex. This delta represents the record of an ancestral Mississippi Eiver system that existed probably in Sparta and possibly in much of Claiborne time. The channel deposits in Houston, Madi son, and other counties in east Texas probably represent smaller streams. This interpretation conforms with the ideas of earlier investigators who did surface work in smaller areas (Spooner, 1926; Huner, 1939).
Although the Sparta Sand is predominantly of con tinental origin in the delta area, brief local invasions of the sea repeatedly covered low-lying areas of the land mass, particularly during later Sparta time. These in vasions are indicated by the fossiliferous and glau- conitic sand and shale beds in the Sparta (Andersen, 1960, p. 87-88; Chawner, 1936, p. 72; DeVries and oth ers, 1963; p. 14; Harvey and others, 1961, tables 7, 8, and 9; Hewitt and others, 1949, p. 11-14; Huner, 1939, p. 83; Jones and Holmes, 1947, p. 14; Maher and Jones, 1945, p. 40-41; Spooner, 1926, p. 236; Wang, 1952, p. 56-58).
Eegionally, the numerous long meandering areas that contain at least 50 percent sand represent "flow-ways," which remained areas of channel development through out most of Sparta time. (Compare pis. 4 and 6.) Such an area extends from Drew County, Ark., through west ern Ashley County, Ark., western Morehouse Parish, La., and southward into western Franklin Parish, La. These areas were the sites of channel formation at differ ent times during the deposition of the Sparta and are similar to the channel-development areas along the pres ent courses of the Ouachita and Mississippi Eivers and other streams (Fisk, 1944, pi. 2). The associated areas that contain less than 50 percent sand probably repre sent interchannel swamp, marsh, and lake areas where the finer detritus and vegetal material accumulated. Large water supplies can be developed in the areas that contain at least 50 percent sand.
In areas of sparse drilling, future development of closer control should show a greater degree of lateral variability than is shown by present maps. However, the general pattern of channel deposition will probably remain, and any revisions will be significant only in specific and detailed local studies.
Eegionally, the sand content of the Sparta generally decreases from southern Arkansas, northern Louisiana, and northern and central Mississippi southward toward the margins of the delta (pi. 4). This decrease is prob ably accompanied by an increase in the occurrence of marine interbeds as the area of marine environment is approached (Bornhauser, 1950, p. 1892).
Central and southern Texas gulf coast. The channel pattern that is so conspicuous in Arkansas, Louisiana, and Mississippi and less conspicuous in eastern Texas
is not apparent in the area from Grimes County to Webb County, Tex. In this area the long axes of the sand-concentration patterns and the sand bodies are parallel to, rather than normal to, the postulated Sparta strand line. Another point of contrast between the two areas is the distance from the outcrop area to the limits of continuous sand deposition, sometimes called the "shale-out" line. If measured normal to the regional dip in Louisiana, the distance generally ranges from 50 to 200 miles; in the area from Grimes County to Mc- Mullen County, Tex., the distance generally ranges from 14 to 50 miles. This difference is accounted for not only by differences in degree of regional dip and thick ness of the Sparta but also by more extensive sand dep osition in the delta area.
The thickness characteristics of the Sparta Sand also differ in the two areas. From Grimes County southwest- ward the thickness is uniform, but in Arkansas, Loui siana, and Mississippi it is extremely variable. An interpretation of the orientation of the sand bodies par allel to the strand line, the constant thickness of the Sparta interval, and the distance from the outcrop to the "shale-out" line all suggest that the subsurface Sparta sands in the central and southern gulf coast re gion of Texas are predominantly near-shore bar and beach deposits rather than fluviatile deposits as in out crop areas in Louisiana (Spooner, 1926, p. 236-237; Huner, 1939, p. 76-82). This interpretation is supported by Sparta-Stone City relations in Leon County, Tex. (Stenzel and others, 1957, p. 20), where the nonfossil- iferous continental beds of the Sparta interfinger with, and grade upward into, the fossiliferous marine beds of the Stone City of Stenzel (1938). This suggests that the strand line was near. The interpretation is further sup ported by Sellards, Adkins, and Plummer's (1932, p. 654) description of the Sparta Sand.
MAXIMUM SAND-UNIT THICKNESS
A study of electric logs indicated that a map of the thickness of the thickest vertically continuous sand body for convenience, designated the maximum sand- unit thickness (pi. 5) of the Sparta Sand would aid in better understanding the mode of deposition, more accurately locating channel paths, and understanding some of the variations in hydraulic characteristics. In general, the maximum sand-unit thickness map (pi. 6) is similar to the sand-percentage map; thick sand bodies usually occur in areas in which the total percentage of sand is high. However, there are several exceptions where individual units more than 100 feet thick extend into areas where sand percentage values are low (30-40 percent). In some areas the sand concentration may be 50 percent or more and the maximum sand-unit thick-

HYDROLOGIC SIGNIFICANCE OF THE LITHOFACIES OF THE SPARTA SAND A5
ness may be only 30-50 feet. The maximum sand-unit thickness is a major factor in the evaluation of the po tential ground-water supply. (See discussion on per meability and transmissibility.)
Louisiana, Mississippi, southern Arkansas, and east ern Texas. The axes of thickening of the maximum sand units in Arkansas, Louisiana, Mississippi, and eastern Texas (pi. 6, sheet 1) have been plotted to aid in reading the map. These axes also emphasize the inter lacing channels that are similar to the meander patterns of present-day streams in areas of heavy alluviation (Fisk, 1944, pi. 2). Within the channel areas the maxi mum sand units range from 100 to 350 feet in thickness, but in the interchannel areas they generally range from 10 to 50 feet. Maximum sand units 100 feet or more thick may coalesce or diverge, and as entities they are gener ally of limited aeral extent, but the effect of overlap gives almost continuous interconnection for fluid flow (pi. 5). These thick sand bodies can be traced for several miles parallel to the channel axes (section D-D'), but normal to this direction they are of limited aeral extent (section C-C'). They may occur at any stratigraphic position in the Sparta, but most are in the lower two- thirds of the section.
Central and southern Texas gulf coast. From Grimes County, Tex., southwestward, the axes of thick ening of maximum sand units are not long (pi. 6, sheet 2) and are normal to the regional dip. The limited ex tent and the orientation of the maximum sand units are not conducive to extensive downdip migration of fresh water.
HYDROLOGY
The Sparta Sand is one of the major sources of ground water in southern Arkansas, northern and north-central Louisiana, western and central Missis sippi, and eastern Texas as far west as Burleson County. Large quantities of soft water of low dissolved-solids content (pis. 7, 9; table 1) are available from the Sparta throughout much of this area. However, from Burleson County southwestward in Texas the Sparta Sand is of minor importance as an aquifer because it contains fresh water only in a small area, yields are low, and the water is hard and has a high concentration of dissolved solids (pi. 9; table 1).
When considering the Sparta Sand as an aquifer, one must realize that the aquifer system is made up of sev eral imperfectly connected sand bodies, any one of which may act locally, and for short periods of time, as a separate hydraulic unit. Over longer periods of time and larger areas, these units act as an integral part of the unified Sparta hydraulic system and ultimately form an element of the regional hydrologic system of the gulf coast.
269-725 68 2
PERMEABILITY i AND TRANSMISSIBILITY 2 IN RELATION TO GEOLOGIC FACTORS
Because of the variable lithologic framework of the Sparta, permeability values differ greatly within small areas. For example, the field coefficient of permeability determined from pumping tests in northeastern Oua- chita and southwestern Morehouse Parishes ranges from 130 to 890 gpd per sq ft (gallons per day per square foot) in a distance of about 6 miles. In a number of places the permeability of the same sand bed may vary as much as 200-300 gpd per sq ft within 1 mile.
Notable local variations in transmissibility occur in the Jackson area, Hinds County, Miss., in eastern Winn Parish, La., and in southwestern Ashley County and northwestern Desha County, Ark., where the differences in transmissibility of the total sand thickness of the Sparta Sand are as much as 200,000 gpd per ft (pi. 7).
The relations of permeability and porosity to such factors as grain size, grain shape, arrangement, sorting, and packing were summarized by Meinzer (1923, p. 2- 28, 63) and Pettijohn (1957, p. 81-89). Permeability and transmissibility are directly related to the lithologic variations of the Sparta Sand and, thus, are indirectly related to its mode of deposition. The direct relations are major factors in the consideration of the hydraulic cliaracteristics of the formation.
In the channel area of Arkansas, Louisiana, and Mis sissippi, high coefficients of permeability do not neces sarily occur in areas in which the percentage of sand is high. These high coefficients of permeability are usu ally in areas where the maximum sand-unit thickness is greater than 100 feet. Therefore, the maximum sand- unit thickness may be related to the coefficient of perme ability of the sand. Coefficients of permeability deter mined from pumping tests and specific-capacity tests of wells were compared with the thickness of the sand section in which the well was screened. Sufficient data are lacking to reach any firm conclusions, but the com parison strongly indicates that the coefficient of per meability varies directly with the sand thickness. Such a relation is reasonable for sands deposited in channels because the thicker sand units would lie along the lines of persistent flow where velocities would be higher than in the marginal areas. Therefore, the sand in the thicker units would be cleaner, generally better sorted, and
1 The coefficient of permeability is defined as the rate of flow of water, in gallons per day, through a cross-sectional area of the aquifer 1 foot square under a hydraulic gradient of 100 percent, or 1 foot per foot, at a temperature of 60°F (Meinzer and Wenzel. 1942, p. 452).
* Transmissibility of an aquifer is expressed (Bredehoeft, 1964, p. D168) as:
wherei=l, 2, 3 ... n layers of differing permeability,
T= transmissibility, Ki= permeability of the i layer, A/,=thickness of the i layer.

A6 GEOIIYDROLOGY OF THE CLAIBORN GROUP
Sand thickness (ft)
somewhat coarser than that in the thinner units along the margins of the channel. The correlation between permeability and maximum sand-unit thickness is suffi ciently good to warrant the use of different average permeabilities for sand bodies of different thicknesses in calculating transmissibility, rather than an overall average of the coefficients of permeability. Fifty-foot categories of sand-unit thickness were selected; the average coefficient of permeability for each category is as follows :
Average coefficient of permeability (gpd per sq ft)
=^50 _________________________________ * 225-250 51-100 ________________________________ 1 325-350 101-150 _______________________________ * 450-500 ^151 _______________________________ 600
1 The higher values were used in parts of Arkansas and Mississippi where available data indicate a generally higher coefficient of perme ability than in Louisiana.
These coefficients of permeability were then used to cal culate the transmissibility of the total sand thickness of the Sparta sands. The thickness of sand within each of the 50-foot categories was multiplied by the appropriate average coefficient of permeability, and the products were added to obtain the transmissibility of the total sand thickness at each location. The results were then used to prepare a map showing the transmissibility of the Sparta Sand in the channel sand area of Arkansas, Louisiana, and Mississippi (pi. 1} .
The use of the different average coefficients of permea bility for different thicknesses of sands seems to give a more realistic coefficient of transmissibility than the use of an overall average value. A simple example will illustrate the differences that may occur in using the two approaches. Assume that we have a total sand thickness of 300 feet, composed of 2 sand units 150 feet thick near well A and 10 sand units 30 feet thick near well B. using the variable permeability values we get a trans missibility value of 135,000 gpd per ft. (150X450X2) near well A and a transmissibility of 67,500 gpd per ft. (30X225X10) near well B. If an overall average is used, the same transmissibility value is obtained for both wells A and B. The latter approach not ony dis agrees with the results from pumping tests but also with certain chemical data. (See section on quality of water.)
The close relation between channel sand thickness and higher transmissibility values is illustrated by compar ing plates 6 and 1. Certain minor deviations of maxi mum transmissibility and maximum sand-unit thick ness occur because of inherent properties of the maxi mum sand-unit thickness map. Only the value for the thickest sand unit in any given section is shown on the maximum sand-unit thickness map (pi. 6). This value may be satisfactory for calculating transmissibility
where only one massive sand unit occurs, but frequently several massive sand units of equal or nearly equal thickness are present in the section (pi. 5). This obvi ously causes differences in the transmissibility and maximum sand-unit thickness maps (pis. 6 and 7).
The foregoing discussion of the relation between sand-unit thickness and the coefficients of permeability and transmissibility in stream-channel deposits does not apply to offshore bars, beach bars, and dune sands, where the agents and mechanics of deposition are differ ent. Southwest from Buiieson County, Tex., much of the Sparta Sand appears to be of the offshore bar or beach-bar type, but sufficient hydrologic data are lack ing for the determination of the relation of the thick ness of the beds of sand to coefficients of permeabiilty and transmissibility.
RECHARGE AND DISCHARGE
The Sparta Sand is recharged by direct infiltration in the outcrop area and by leakage from alluvium and from other aquifers with higher heads.
The rainfall is high in Louisiana, Mississippi, and southern Arkansas, and the contribution of water to the Sparta aquifer by direct seepage from streams is there fore negligible because most of the streams serve as drains for ground-water discharge. In Texas, where rainfall is relatively low, the infiltration of water from streams may be appreciable.
Discharge from the Sparta Sand occurs by with drawal from wells and by natural discharge. The effects of large withdrawals from wells are evident in the Hodge-Jonesboro area, Louisiana, in Jackson, Miss., in El Dorado, Ark., and near Monroe, La. (pi. 8). Natural discharge takes place primarily by leakage from the Sparta Sand through the overlying and underlying confining beds.
REGIONAL FLOW
In a formation having the geologic framework of the Sparta Sand, alternating sand and shale bodies that have an appreciable regional dip, the bulk of the ground water available even in the outcrop area, is confined above and below by relatively impermeable beds.
The flow of water ia an artesian aquifer occurs be cause of the difference in head. In Texas, along the south flank of the Sabine uplift in Louisiana, and in southeastern Mississippi, the direction of flow is gen erally down the regional dip toward the gulf coast geosyncline. In most of Arkansas, Louisiana, and Mis sissippi, the major focus of discharge is the Mississippi River alluvial valley. The regional direction of flow is inferred from the water-level contours (pi. 8), the gen eral increase in dissolved-solids content, and the limits

HYDROLOGIC SIGNIFICANCE OF THE LITHOFACIES OF THE SPARTA SAND A7
of fresh water downdip in the aquifer (pis. 8, 9, 10; fig. 2).
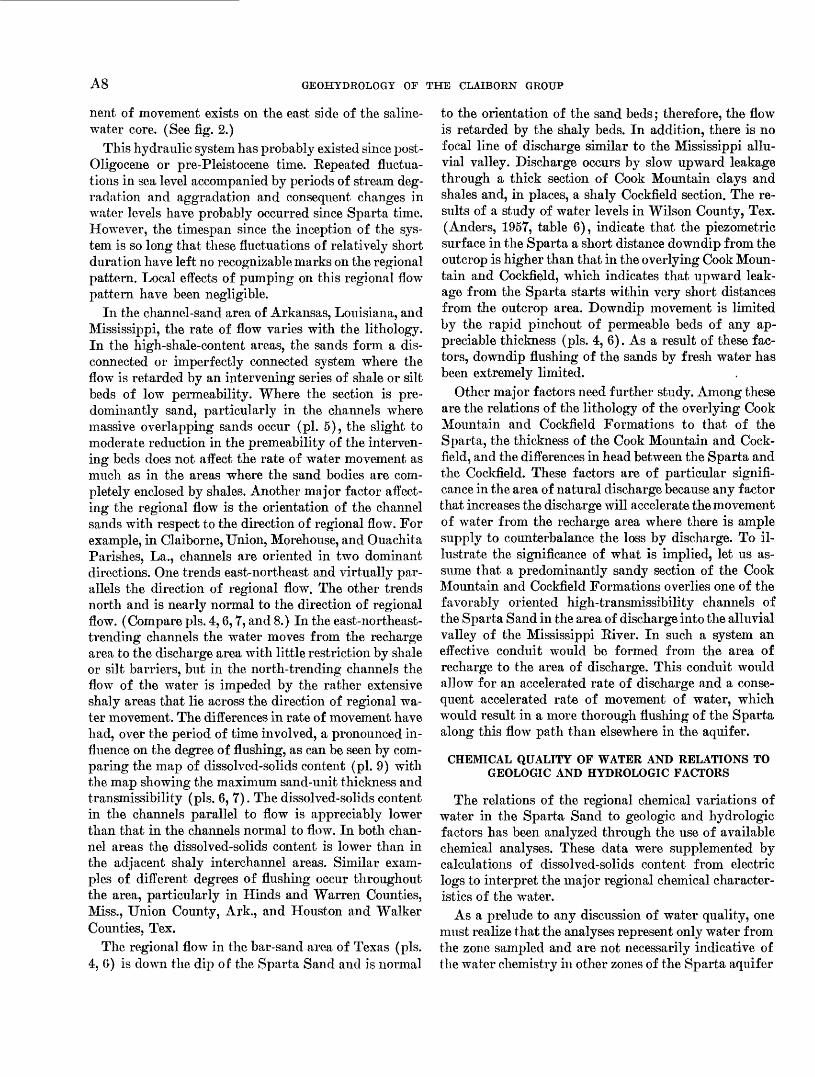
The relation of recharge, discharge, and regional flow to the geology and to the piezometric surfaces is shown in figure 2, which is a generalized section from Bienville Parish, La., to Jasper County, Miss.
In the area shown in figure 2, water from precipita tion that falls on the upland areas of the Cockfield and Sparta enters these formations either directly or by downward percolation through surficial material. Within short distances after entering these formations, the water is in an artesian system, as it is confined above and below either by the interbedded shales of the Cock- field and Sparta Formations themselves or by the clays and shales of the associated Cane River and Cook Moun tain Formations and Vicksburg and Jackson groups. In the recharge area the piezometric surface in the Cock- field is higher than the piezometric surface in the Sparta. The Cockfield Formation, however, is more ac cessible to the regional discharge area in the valley; consequently, the piezometric surface in the Cockfield is more steeply inclined than that in the Sparta. Near the discharge area the relative positions of the two piezometric surfaces are reversed. Furthermore, the re charge areas of the Cockfield and Sparta Formations in Mississippi are considerably higher than those in Louisiana; thus, the piezometric surface is generally higher on the east side of the alluvial valley than on the west. Another major factor affecting the regional move ment of water in the Cockfield and Sparta Formations
500'-
1000'-
1500'-
2000' -
2500'-
3000'
10,000 ppm
_____ o\
General direction of water movement sVft ^- ~""~*^?X^ " * \\ ~
................................. \^ A ^
* ^X
* \\vlooo- ! Np- \. x3000
Piezometric surface of Cockfield Fm.
Piezometric surface of Sparta Sand
I PPm |
Zones of dissolved solidsConcentrations., in parts per million (pp
in water contained in Sparto Sand
is the westward offset of the alluvial valley relative to the structural axis of the Mississippi embayment. Be cause of this offset and the effects of the Monroe uplift, the depth to the Cockfield and Sparta aquifers in the area of discharge in eastern Louisiana is much less than that in western Mississippi.
With these factors in mind, a reasonable interpreta tion of the flow pattern in the systems can be made. (See directional arrows in figure 2.) Normally, water moves downdip in the formations, but where the eleva tion of the water levels in the Cockfield is different from that in the Sparta, the water moves vertically and causes a generalized regional flow pattern as shown in figure 2. The regional flow pattern is similar to that dia grammed and discussed by Le Grand (1964, fig. 4, p. 185). The areas of recharge for the Sparta are between the base of the formation in the outcrop areas and the points of intersection of the Sparta and Cockfield piezometric surfaces on both sides of the Mississippi alluvial valley. (See fig. 2.) The principal area of nat ural discharge is between the two points of intersection.
Together, the flow components produce a markedly asymmetrical flow pattern that contrasts with the sym metrical structural pattern of the Mississippi embay ment. The zone of flushing extends to a much greater depth on the east flank of the embayment than on the west flank. (See pi. 8, fig. 2, and section on quality of water.) The saline-water core, 10,000 ppm (parts per million) dissolved solids, perches on the western limb of the Mississippi embayment. Thus, an updip compo-
roj^^Lsu-^ai J 50Q ,
SEA 'LEVEL
- 500'
- 1000'
-1500'
2000'
-2500'
o | ____ j^Monroe0 \ ovicksburgl
k 7
TEXAS I
3000'
FIGURE 2. Relation of regional geology and hydrology.
A8 GEOHYDROLOGY OF THE CLAIBORN GROUP
nent of movement exists on the east side of the saline- water core. (See fig. 2.)
This hydraulic system has probably existed since post- Oligocene or pre-Pleistocene time. Repeated fluctua tions in sea level accompanied by periods of stream deg radation and aggradation and consequent changes in water levels have probably occurred since Sparta time. However, the timespan since the inception of the sys tem is so long that these fluctuations of relatively short duration have left no recognizable marks on the regional pattern. Local effects of pumping on this regional flow pattern have been negligible.
In the channel-sand area of Arkansas, Louisiana, and Mississippi, the rate of flow varies with the lithology. In the high-shale-content areas, the sands form a dis connected or imperfectly connected system where the flow is retarded by an intervening series of shale or silt beds of low permeability. Where the section is pre dominantly sand, particularly in the channels where massive overlapping sands occur (pi. 5), the slight to moderate reduction in the premeability of the interven ing beds does not affect the rate of water movement as much as in the areas where the sand bodies are com pletely enclosed by shales. Another major factor affect ing the regional flow is the orientation of the channel sands with respect to the direction of regional flow. For example, in Claiborne, Union, Morehouse, and Ouachita Parishes, La., channels are oriented in two dominant directions. One trends east-northeast and virtually par allels the direction of regional flow. The other trends north and is nearly normal to the direction of regional flow. (Compare pis. 4,6,7, and 8.) In the east-northeast- trending channels the water moves from the recharge area to the discharge area with little restriction by shale or silt barriers, but in the north-trending channels the flow of the water is impeded by the rather extensive shaly areas that lie across the direction of regional wa ter movement. The differences in rate of movement have had, over the period of time involved, a pronounced in fluence on the degree of flushing, as can be seen by com paring the map of dissolved-solids content (pi. 9) with the map showing the maximum sand-unit thickness and transmissibility (pis. 6, 7). The dissolved-solids content in the channels parallel to flow is appreciably lower than that in the channels normal to flow. In both chan nel areas the dissolved-solids content is lower than in the adjacent shaly interchannel areas. Similar exam ples of different degrees of flushing occur throughout the area, particularly in Hinds and Warren Counties, Miss., Union County, Ark., and Houston and Walker Counties, Tex.
The regional flow in the bar-sand area of Texas (pis. 4, 0) is down the dip of the Sparta Sand and is normal
to the orientation of the sand beds; therefore, the flow is retarded by the shaly beds. In addition, there is no focal line of discharge similar to the Mississippi allu vial valley. Discharge occurs by slow upward leakage through a thick section of Cook Mountain clays and shales and, in places, a shaly Cockfield section. The re sults of a study of water levels in Wilson County, Tex. (Anders, 1957, table 6), indicate that the piezometric surface in the Sparta a short distance downdip from the outcrop is higher than that in the overlying Cook Moun tain and Cockfield, which indicates that upward leak age from the Sparta starts within very short distances from the outcrop area. Downdip movement is limited by the rapid pinchout of permeable beds of any ap preciable thickness (pis. 4, 6). As a result of these fac tors, downdip flushing of the sands by fresh water has been extremely limited.
Other major factors need further study. Among these are the relations of the lithology of the overlying Cook Mountain and Cockfield Formations to that of the Sparta, the thickness of the Cook Mountain and Cock- field, and the differences in head between the Sparta and the Cockfield. These factors are of particular signifi cance in the area of natural discharge because any factor that increases the discharge will accelerate the movement of water from the recharge area where there is ample supply to counterbalance the loss by discharge. To il lustrate the significance of what is implied, let us as sume that a predominantly sandy section of the Cook Mountain and Cockfield Formations overlies one of the favorably oriented high-transmissibility channels of the Sparta Sand in the area of discharge into the alluvial valley of the Mississippi River. In such a system an effective conduit would be formed from the area of recharge to the area of discharge. This conduit would allow for an accelerated rate of discharge and a conse quent accelerated rate of movement of water, which would result in a more thorough flushing of the Sparta along this flow path than elsewhere in the aquifer.
CHEMICAL QUALITY OF WATER AND RELATIONS TO GEOLOGIC AND HYDROLOGIC FACTORS
The relations of the regional chemical variations of water in the Sparta Sand to geologic and hydrologic factors has been analyzed through the use of available chemical analyses. These data were supplemented by calculations of dissolved-solids content from electric logs to interpret the major regional chemical character istics of the water.
As a prelude to any discussion of water quality, one must realize that the analyses represent only water from the zone sampled and are not necessarily indicative of the water chemistry in other zones of the Sparta aquifer

HYDROLOGIC SIGNIFICANCE OF THE LITHOFACIES OF THE SPARTA SAND A9
system. Therefore, in the marginal areas of any par ticular water province, waters of different types would probably be found in the several sand units that make
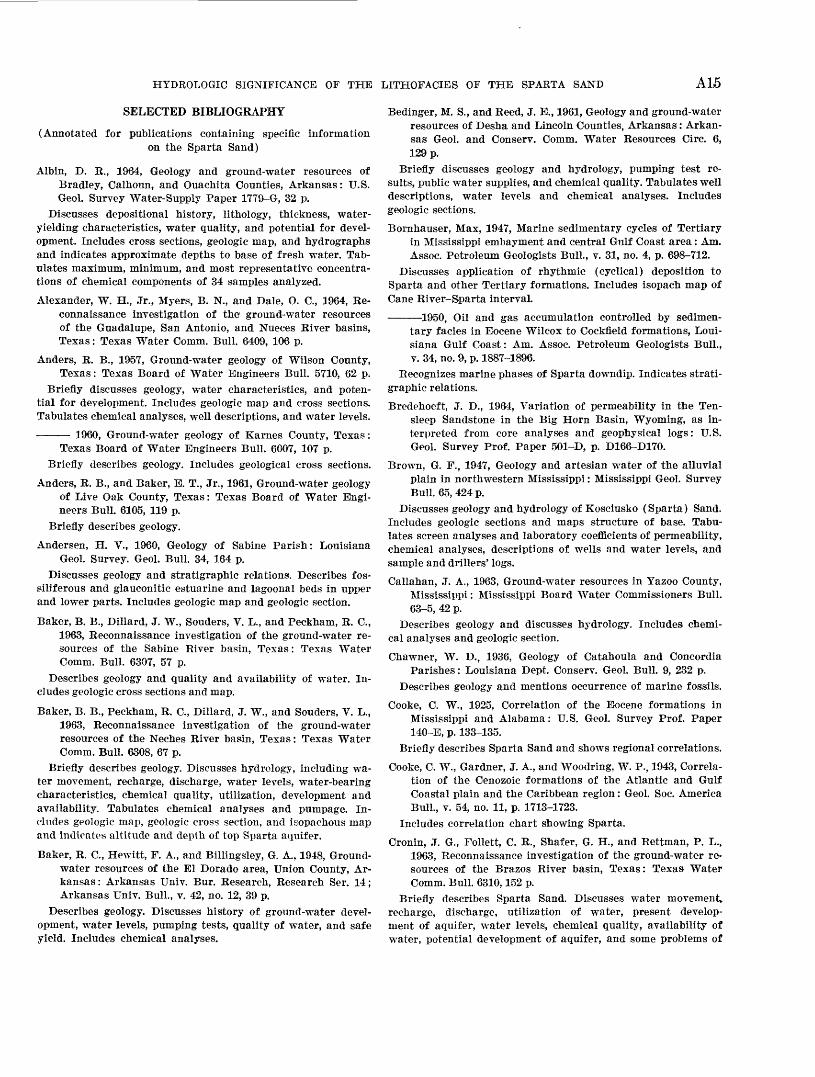
up the Sparta system. This occurs in the Monroe, La., area, where waters from different sands in the same well have been analyzed (fig. 3).
Blevins water wellsCity of Monroe test 1
Sec. 52, T. 18N..R.4E.,Ouachita Parish,La.
City of Monroe test 3Sec. 6, T. 18 N., R. 4 E.
Ouachita Parish, La.Depth in feet
Self-potential
Top Sparta Sand Resistivity (ohms m 2/m)
(millivolts)
-1201+\
I 100
Analysis of waterfrom depth of 315 ft(in parts per million)
Calcium 2.8Magnesium .7Sodium and
potassium 209.0 Carbonate 43.0 Bicarbonate 336.0 Sulfate 7.0 Chloride 76.0 Dissolved
solids 554.0
HCO, =&0C1+S04
Analysis of waterfrom depth of 654 ft(in parts per million)
Calcium 1.0Magnesium .3Sodium and
potassium 176.0 Carbonate 18.0 Bicarbonate 240.0 Sulfate 1.2 Chloride 112.0 Dissolved
solids 448.0
HC08C1 + SO4
= 1.4
Resistivity (ohms m 2/m)
200
50
"Top Sparta Sand
100
300
400
500
600
700
800
-Analysis of water'from depth of 231-241 ft
(in parts per million)Calcium Magnesium Sodium Potassium Carbonate Bicarbonate Sulfate Chloride Dissolved
solidsHCO,
3.21.7
271.04.8
20.0522.0
2.6100.0
684.0
C1+SO4
Analysis of water from depth of 369-379 ft
(in parts per million) Calcium Magnesium Sodium and
potassium Carbonate Bicarbonate Sulfate Chloride Dissolved
solidsHCO3
3.32.0
200.0.0
335.02.6
123.0
688.0
C1 + SO4= 1.6
^Analysis of waterfrom depth of 474-484 ft
(in parts per million)Calcium Magnesium Sodium Potassium Carbonate Bicarbonate Sulfate Chloride Dissolved
solidsHCOS
2.41.5
232.05.99.8
364.0.8
147.0
646.0
C1 + SO4= 1.5
"Analysis of waterfrom depth of 725-735 ft
(in parts per million)Calcium Magnesium Sodium Potassium Carbonate Bicarbonate Sulfate Chloride Dissolved
solidsHC03
1.2.72
383.04.8
28.0353.0
2.1358.0
984.0
Cl+SOi= 0.6
FIGURE 3. Electric logs of wells and chemical analyses of waters from the Sparta Sand in the Monroe, La., area, showing the variation in major chemical constituents at different stratigraphic positions within the formation.

A10 GEOHYDROLOGY OF THE CLAIBORN GROUP
CHEMICAL PROVINCES
Only the major constituents of the dissolved solids in water from the Sparta (table 1) are considered in this report. Regionally, sodium is the dominant cation. Calcium and magnesium occur in appreciable amounts only in very small areas. The anions, on the other hand, occur in rather well defined provinces. As suggested by Hem (1959, p. 155-156), the following chemical ratios were studied in terms of equivalent parts per million: sulfate: chloride + bicarbonate; bicarbonate: chloride + sulfate; chloride: bicarbonate+sulf ate. The resulting values were plotted on a map (pi. 9). Examination of these data showed that the waters of the Sparta can be grouped into three rather well defined chemical prov inces a bicarbonate water province, a chloride water province, and a sulfate water province on the basis of the relations between the anions.
Bicarbonate water province. This province is that area where bicarbonate : chloride + sulfate ^ 1. It covers central and western Louisiana, all but the south eastern part of southern Arkansas, virtually all of Mississippi, and small areas in the updip part of the Sparta in Texas. In the downdip areas, the sands of the Sparta may contain mixed bicarbonate-chloride waters having varying percentages of these anions (fig. 3). Updip from the bacarbonate water-chloride water boundary, toward the recharge area, the bicarbonate anion becomes more and more predominant until it is virtually the only anion present. This is illustrated by a comparison of the analyses for wells LMo-2, LOu-2, LOu-1, LL-1, LL-3, LL-2, MW-1, MW-2, MH-1, and MK-1 (table 1 and pi. 9).
The bicarbonate distribution seems to be a function of rate of water movement and of time. That is, the greater the degree of flushing the greater the proportion of bicarbonate. This relation is indicated by the position of the line where bicarbonate : chloride + sulfate = I relative to the limits of fresh water as delineated by the 1,000-ppm minimum-dissolved-solids line on plate 9. The boundary of the bicarbonate water province is, in general, considerably updip from the limit-of-fresh- water line in Louisiana, but in Mississippi the bicar bonate line is generally downdip from, or coincides with, the limit-of-fresh-water line. The relative posi tions of the bicarbonate and limit-of-fresh-water lines in Louisiana and Mississippi coincide with differences in head in the two States as reflected by the slopes of the piezometric surfaces (pi. 8, fig. 2). The water level in Mississippi is 100-150 feet higher in the recharge area than the water level in a corresponding position in Louisiana. Thus, the steeper hydraulic gradient in
Mississippi, aided by the more favorable orientation of many of the high-transmissibility channel areas in rela tion to the direction of flow, has increased the degree of flushing on the east side of the valley. (See pis. 6,7,10.)
Chloride water province. This province is that area where chloride : bicarbonate + sulfate 1. In Texas it includes all of the Sparta Sand except for limited areas in, and short distances downdip from, the out crop (pi. 9). In Louisiana it is generally confined to the downdip area of the Sparta and to the saline-water tongue, which generally coincides with the area overlain by the Mississippi valley alluvium in eastern Louisiana and southeastern Arkansas. The chloride type waters generally represent areas of discharge where the domi nant component of flow in the Sparta is upward (pi. 2, fig. 2), and they therefore lie beyond the limits of ex tensive flushing by fresh water. (See pis. 8, 9, 10.)
Sulfate loater province. Southwestward from Burle- son County, Tex., along the Sparta trend to Webb County, sulfate may constitute up to 50 percent or more of the total anion content of the waters (table 1, well TWn-4). The ratio value arbitrarily chosen for defini tion of this province is 0.25 (sulfate : chloride + bicar bonate ^ 0.25). The sulfate water province lies along, and slightly downdip from, the outcrop area of the Sparta (pi. 9). It coincides closely with an area in which the formations overlying and underlying the Sparta Sand contain gypsum and gypsiferous clays (Alexander and others, 1964, p. 34-35 and 43^6). The sulfate con tent can probably be attributed to the solution of gyp sum by waters passing through these gypsiferous for mations and the soils derived from them. The dispersion of these salts downdip in the Sparta would be relatively slow because the regional downdip rate of flow is very slow.
DISSOLVED SOLIDS
The dissolved-solids content of water is one of the most effective chemical tools that can be used to under stand the relations of water movement, variations of chemical quality, and the influence of geologic factors on water movement. The relation of the dissolved-solids content to the specific conductance of water from the Sparta Sand is remarkably constant (fig. 4), even in the higher ranges of concentration (^ 3,000 ppm). Because of this relation, electric logs can be used to compute dissolved-solids content. The electric logs pro vide extensive regional control for computing dissolved- solids contents in formational waters.
A satisfactory method of computing the dissolved- solids content of water from the long-normal curve of

100,000
10,000
1000
HYDROLOGIC SIGNIFICANCE OF THE LITHOFACIES OF THE SPARTA SAND
I 1 I I FT
All
100 i 100
I I I I1000 10,000
SPECIFIC CONDUCTANCE, IN MICROMHOS PER CENTIMETER AT 25° CENTIGRADE
100,000
FIGURE 4. Relation of specific conductance to dissolved-solids content in waters from the Sparta Sand in Arkansas, Louisiana,Mississippi, and Texas.
electric logs was described by Turcan (I960).3 This method was used to calculate the dissolved-solids con tent of the water in the Sparta. The values thus obtained, along with data from available chemical
3 Turcan's method is based on the equation:
where.F/=the field formation resistivity factor,-R 0 =the resistivity read from the Ions-normal curve corrected to 77°F,
JJ K =the resistivity of the water at 77°F.
analyses, were used to construct the dissolved-solids map (pi. 9).4 To avoid errors introduced by electrode spacing, calculations were not made for sands less than 15 feet thick. No values are shown for waters containing less than 200 ppm or more than 10,000 ppm dissolved solids.
* Contour intervals of 500, 1,000, 3,000, and 10,000 ppm are used on the dissolved-solids map. These intervals were chosen on the bases of the standards proposed by the U.S. Health Service (1962, p. 7-8) and the salinity classification given by Winslow (1956, p. 5).

f 2
Mississippi.. Mississippi..
W oI i
| W|
& 1r» 8 -j
5 3
^ j_, co o
to i->
,_, ,_,-J Oi
to
§! £
5°0 0
s :co poOi O
CO OS
>_> eo
StO &
^ Oi H*. OI
CO
» CO
o o
i s00 *-J
Oi 00
! i
I i! ;«_ cg_
f |^
O M t* « " h» o /->a^ g a g
h-> H*
to to
'° 3
t~* .* o -
to co
O M
OS OO
to co§ sspo o e
oo oo
to co1^- OS
t- CO
OO CO
CO CO Oi Cn
CO CO Ol OS01 oo
g iOO *.
o o
5 S co !=
oo *-j J OS
t-<09
I
Louisiana ...
Sabine... __
WtfM O p.
6-25-64
8
k
o
J_
H»
stoo
1o
13o
CO
oo
1*.
o
COoo
iS
CO
o
*. 00
7*OS
t-<
s£
p
Rapides.... ...
^ to CD w* Cj _ p*
S I -J
-J
poCO
iOi CO
s1s
1o
COH>
£
COto
£<p8
sCOo
so-s74to
t-<o%t-<
Ouachita _ ..
|d
OS
8
o
-J
CO
go to
^
so
Oi
o
*.
o
s
§OO
en
o
1poo
O C
|
Ouachita. _ ..
City of West Monroe.
to
S
o
Oi
Oi
sH>
OS
i
~J
O
-J
&
Oi
[->Oi
s
§to
CO
o
iP°
LMo-2.....
Louisiana. . .
Morehouse....
Village of Collinston.
£
Ssg
H>
to
1[->«o
§eno
V
§
to
to
s-1
iiOS
o
to
ip°eo
LMo-1.....
Louisiana...
Morehouse ....
o5* W » 2S » a te* C P
X
o
K
OS OO
-J
s.* -J
§o
(6-
l»-
O
N*.
'H-
CO-j
H>
S
i
8
o
174oo
t<
£
Louisiana...
Lincoln.. ...
O ?£'!oo ® S
3-23-55
g
8
*>.
CO
~»to
o
i
o
CO
S°o
'H-
oo
g
too
S
Oi
0
COOS
;-J
09
Eto
a
Lincoln __ ..
DQ B-
t|
CO1
sM*
&
o
o
e
CO
to
o
OO
!* OO
^
1 to
s
B
S
o
o
12
f
Louisiana. . .
p*
Village of Choudrant.
12-15-59
CO
g
oo
to
8
OS
sCO
o
to to
coo
*.
OO
'&
OJ
8
CO
o
-j
po
Ir1 0
Louisiana.. .
Claiborne .....
OzS w ^ai"
r
gNOS
p o
CO (6-
5
too
§
o
00
_«.»OS
u
>-
s
g§s
o
spOS
f0S>
P
Caldwell.. _ .
HS ii g ? i Q S- e '
? I-
CO
H>
to
o
gOS
CO
H>
O
o
1pi to
*.
s
1CO
S
~J
o
I74co
!
£g
& §
^Id;
o
g
N to
OS
iOi
CO
po
oo
CO
o
^
^
COto
Oi
oo
o
sp°
B °
f!d u E. S § f
a ^
£ S
tO M
o to to =5
r* F*OO CO
CO *.
S1"1 5
^
* o
Oi Ol
o o
. P101 *>.
8P0 0
H> OJ
. ^ (-> cn
co to
Cn i£
OS OS
0 0
ISpo po to o
d d
Arkansas ... . Arkansas _ .
Desha ___ .. Drew. ........
J. L. Mc- Kennon.
Harold
V T00 -1
CO Oa
CO i
pS 8
p *. CO
pO it-
OS Oioo >^>
Oi j
g io»
o
p=CO 01
.* en oo to
p j
p-4 Ol
CO CO
-4 CO(fr. 01
I-1 tO
o o
8 100 00
o ^-
lo
0
1§B.&^s
OQ O
2*2* P o **
f||Silica (SiOs)
Total iron (Fe)
Calcium (Ca)
Magnesium (Mg)
Sodium (Na)
Potassium (K)
Bicarbonate (HCOs)
Carbonate (COi)
Sulfate (SOO
Chloride (Cl)
Fluoride (F)
Nitrate (NOs)
Percent sodium
Residue on evaporation H (180° C) § gr
Sum of & «f determined & constituents
Calcium, magnesium » M
Noncarbonate p §
Specific conductance (microinhos at 25°C)
PH
H> w
» H
1 I
I "5.I S
sISCTs
a 2. a"
a a-
jnoao xaoaivio ani, &oSTV

HYDROLOGIC SIGNIFICANCE OF THE LITHOFACIES OF THE SPARTA SAND A13
CO CM 00 rH
oo oo t^ oo I 2 ns 5snssn ss^- CO
CO
rH rH T|T rH~ CxT l*T i-T rH r-T CO i-f
O O O O O
CO CO IO CO CO
S
s*".
O OO rH OOOOO ^§1
CO to <9b- O 10 h- (rH IO CO O> Oi "
" 1 OO CN 00 rH J*l -^1 O
rH CO' rH1 rH rH rH
i-T Cxf rH* Cxf
O) 25 d
o 10 oCM '
CO 00 rH O rH
CM rH rH
IO
CM oo * r- c
orH CO ' CM CC
O
CO
s ioCM
CO
CM
CM
CM
S
O O O
IO
i s i ^ sss
00 O CM O O O <
rH ' ' ' CO
O t- ^< IN. CM
' i-i CM '
IO CO IO O O O O CO rH IO t- CM IO f Tf rH IO IO rH CMco-
M CM CO CM « «
O CO OO rH O Os i g & 0-8
O
£
i
o
° 1 Sg
o
2
,_, ^ CD IO Q to CO >0 00 S C« ^ CO ^ <N
rH -H CM"
2 TH "3 S£ £9 £S 9 co oo o» r*. v
M CM o o 10 ext
S
O
srH
o
0 CO ^i 0> j
O t-^ CM OO t- C s
ioO rH CM OO Tf ^ Tf Tf t- O t- 00 CO 1000 IOrHCM..^< t-lOlOO CO COC5 ^<rHO^<rH <M CO IO CN
o o oe» o ooooo oooo
3 "
3; OOCM ot^extoq OOCMOO 'tft^' CMCOOOCM lOlOrH SS1 RIB 1
1
s g
CM g
O-*
rH r-
CN «
00 O> Q >Ca * 8«rH
S
CM
CM
I
M
2o -io
1
<MO ! ! !! i lit-!' It^li! ' !!
S -#
IRR ill ar- use* OCMCOCO loco CM ^<
t-C " 'CM * rHt^COCOlO rH-*CMrH CO COrHrHrH CMOS
CO 00 IO O t^ IO O
rHCO c5'~''~'S K83
t- CMCO CO rH
IO i rH
! i 111I rH 1 III
I ! ! ! !
o o r*- co «* i
IO
5 OS CM* CM !
co :
IO
rH*^ 82S5S
IO COCO tOCD * * COCO *P co tO CO tO CO ^* IO IO l£
rH OO CM COCO CO CO CO rH rH CJ9 O CO 00 ID O IO CO r-
oo t*.
o
CM CO S
O
2
CM
CO
N <M
»0
rH CO CO CD CO CO CO CO CO ^
t^- co exi go oco i j,n >«^ j "j3 » ' ' -^ CO E ' t £3 * t! **" ' ' r*» I
Oa5 |n'c3j2>2rH 5 52 M . ^ CB GQ a * o ® -S 1^^ 5^ o ° N? ^"* 2 -^ <§ a J£
11*113*11 jjlSililli Infill i^la llj^p En > £ PH £ O O OQ W P? OQ S P? O «J «J O W SQ ^^><j
3 i ^ ^11 S § i 'PH ^ ^ >H <:
"8, 13. "a 'a
g? Jl jg § {
J J CM! J 7' si- ti- "1 C
§ s i § n i n' « 2 P 3 O C §
<1 SQ PQ H O O O
" " 5S 2? " 2 " c c co C3 e o c> > mm ^ > >
EH EH EH EH EH EH £
_ rH CM
« V 3 3 V 7?<j SQ PQ SQ O O O E-t EH EH EH EH EH EH
5 o ^ ^ ^ 5 S oo to oo cco o c« c« os aI PC (^ r^ H] ^
000 0 O c * > i» ^ ^ t< CD CD CD CD CD Ct
H EH EH EH EH E-
r. CS ^ ^<? 1 GO GQ GQ 1
H EH EH EH EH t
S A
0c J. s
EH
E-
a 3 .sM §
0 C
1 sEH E-
i iEH E-
J 1
E$§
! §
9 s aH EH E^
c^cJ Td a a
E6 &: feEH EH EH
i3 c
as>'cl
GO CD
0
O
§a
1 8a
o
a
as>
&
"a
CDfS4^
CD
1
-a i2 S1g
SI'cs
I
1
§CDft
ioJ
IGO
1
S111r!
a<aCD^a
EH

A14 GEOHYDROLOGY OF THE CLAIBORN GROUP
In much of Texas the Sparta aquifer is composed of one continuous sand unit that is 20 feet or more thick; therefore, only the average dissolved-solids content was mapped, and no minimum or maximum dissolved-solids content contours are shown (pi. 9).
In Arkansas, Louisiana, and Mississippi the Sparta is a multi-unit aquifer in which there are usually sev eral sand units, each 20 feet or more thick, that have different dissolved-solids contents (fig. 3). Therefore, in this area three sets of calculations are used to show the range of variation in dissolved-solids content that might be anticipated in the various sands in the Sparta aquifer. These are (1) the minimum dissolved-solids content, which represents the water having the lowest dissolved-solids content in the entire vertical section; (2) the maximum dissolved-solids content, which rep resents the water having the highest dissolved-solids content; and (3) the average dissolved-solids content, which is an average value weighted proportionately for the thickness of each unit in the section.5 That the deter minations of dissolved solids from the electric logs are well within the limits of reasonable accuracy is demon strated by the close agreement between the values com puted from the logs and the dissolved-solids content as determined by chemicals analyses.
The calculation of dissolved-solids content from elec tric logs provides close control for one of the principal chemical characteristics of water. Therefore, the influ ence of various geologic and hydrologic factors on water chemistry can be more accurately determined. The effects of channel development and regional flow on the dissolved-solids content have been discussed in the section on regional flow, but they should be reemphasized to point out the pronounced deflection of lower dissolved-solids contours along channel paths, particularly those oriented favorably with respect to regional flow. (See pis. 4, 6, 7, 8, 9.) The relations of dissolved-solids-content values to channel and inter- channel deposits support the use of variable coefficients of permeability (see discussion of permeability and transmissibility) insofar as the relations reflect the ease or difficulty of flushing.
EXTENT OF FLUSHING OF THE SPARTA SAND
The thickness of sand containing fresh water in the Sparta and its percentage of the total sand thickness of the Sparta is shown on plate 10. In a sense this map
« For example, if the Sparta sand section has three sand units whose thicknesses are 20, 30, and 50 feet and whose respective dissolved-solids contents are 200, 250, and 300 ppm, the weighted average dissolved-solids content
T20X200) + (30X250) + (50X300) 26,500100 (sum of thickness) 100
=265 ppm.
summarizes the information shown on several of the other maps, for it shows that the more permeable chan nels aid the movement of ground water when oriented in the direction of regional flow, and that the shaly areas or areas of low transmissibility impede the flow (pis. 4, 6, 7, 9). The map also emphasizes the more thorough flushing of the formation on the east, or Mississippi, side of the salt-water tongue. This flushing apparently results from the high rates of ground-water movement in this area. (See pi. 8 and fig. 2.) The map also shows the extension of the salt-water tongue through Ashley County, Ark. This extension may at first appear anom alous, but when the orientation of this tongue is com pared with the change in direction of flow as indicated by the piezometric surface (pi. 8) in northern Louisiana and southern Arkansas, the extension is seen to be a small part of the system that has maintained the salt water area along the Mississippi River Valley. (See pis. 2 and 8, and fig. 2.)
CONCLUSIONS
1. The principal geologic factor affecting the hydrol ogy of the Sparta Sand is the mode of deposition. The depositional environment controls the distribution of permeability in the system.
2. One of the major controls of the regional flow pat tern is the Mississippi River alluvial valley, as it is the focus of discharge in the area in which the Sparta Sand is the principal aquifer.
3. In the channel sands the sand-unit thickness is ap parently related to the permeability. The permeability usually increases with an increase in sand-unit thickness.
4. The rate of water movement is related to the lith- ology of the formation in the channel-sand areas. The chemical evidence suggests that the rates of ground-wa ter movement are higher along continuous channels than in the interchannel areas.
5. The dissolved-solids content of water is one of the most effective chemical tools that can be used to under stand the relations of water movement and variations of chemical quality to geologic factors. It can be reliably determined from electric logs, and it thus provides ex tensive data on a major chemical characteristic of water.
6. Geologic, hydrologic, and geochemical maps of a region can be of great help in the ultimate quantitative evaluation and description of any aquifer system.
7. Maps showing sand percentage, maximum sand- unit thickness, and estimated transmissibility aid in the search for, and evaluation of, large supplies of ground water.
HYDROLOGIC SIGNIFICANCE OF THE LITHOFACIES OF THE SPARTA SAND A15
SELECTED BIBLIOGRAPHY
(Annotated for publications containing specific information on the Sparta Sand)
Albin, D. R., 1964, Geology and ground-water resources of Bradley, Calhoun, and Ouachita Counties, Arkansas: U.S. Geol. Survey Water-Supply Paper 1779-G, 32 p.
Discusses depositional history, lithology, thickness, water- yielding characteristics, water quality, and potential for devel opment. Includes cross sections, geologic map, and hydrographs and indicates approximate depths to base of fresh water. Tab ulates maximum, minimum, and most representative concentra tions of chemical components of 34 samples analyzed.
Alexander, W. H., Jr., Myers, B. N., and Dale, O. C., 1964, Re- connaissance investigation of the ground-water resources of the Guadalupe, San Antonio, and Nueces River basins, Texas: Texas Water Cornm. Bull. 6409, 106 p.
Anders, R. B., 1957, Ground-water geology of Wilson County, Texas: Texas Board of Water Engineers Bull. 5710, 62 p.
Briefly discusses geology, water characteristics, and poten tial for development. Includes geologic map and cross sections. Tabulates chemical analyses, well descriptions, and water levels.
1960, Ground-water geology of Karnes County, Texas:Texas Board of Water Engineers Bull. 6007, 107 p.
Briefly describes geology. Includes geological cross sections.
Anders, R. B., and Baker, E. T., Jr., 1961, Ground-water geology of Live Oak County, Texas: Texas Board of Water Engi neers Bull. 6105, 119 p.
Briefly describes geology.
Andersen, H. V., 1960, Geology of Sabine Parish: LouisianaGeol. Survey. Geol. Bull. 34, 164 p.
Discusses geology and stratigraphic relations. Describes fos- siliferous and glauconitic estuarine and lagoonal beds in upper and lower parts. Includes geologic map and geologic section.
Baker, B. B., Dillard, J. W., Souders, V. L., and Peckham, R. C., 1963, Reconnaissance investigation of the ground-water re sources of the Sabine River basin, Texas: Texas Water Cornrn. Bull. 6307, 57 p.
Describes geology and quality and availability of water. In cludes geologic cross sections and map.
Baker, B. B., Peckham, R. C., Dillard, J. W., and Souders, V. L., 1963, Reconnaissance investigation of the ground-water resources of the Neches River basin, Texas: Texas Water Comrn. Bull. 6308, 67 p.
Briefly describes geology. Discusses hydrology, including wa ter movement, recharge, discharge, water levels, water-bearing characteristics, chemical quality, utilization, development and availability. Tabulates chemical analyses and purnpage. In cludes geologic map, geologic cross section, and isopachous map and indicates altitude and depth of top Sparta aquifer.
Baker, R. C., Hewitt, F. A., and Billingsley, G. A., 1948, Ground- water resources of the El Dorado area, Union County, Ar kansas: Arkansas Univ. Bur. Research, Research Ser. 14; Arkansas Univ. Bull., v. 42, no. 12, 39 p.
Describes geology. Discusses history of ground-water devel opment, water levels, pumping tests, quality of water, and safe yield. Includes chemical analyses.
Bedinger, M. S., and Reed, J. E., 1961, Geology and ground-water resources of Desha and Lincoln Counties, Arkansas: Arkan sas Geol. and Conserv. Gornm. Water Resources Circ. 6, 129 p.
Briefly discusses geology and hydrology, pumping test re sults, public water supplies, and chemical quality. Tabulates well descriptions, water levels and chemical analyses. Includes geologic sections.
Bornhauser, Max, 1947, Marine sedimentary cycles of Tertiary in Mississippi embayrnent and central Gulf Coast area: Am. Assoc. Petroleum Geologists Bull., v. 31, no. 4, p. 698-712.
Discusses application of rhythmic (cyclical) deposition toSparta and other Tertiary formations. Includes isopach map ofCane River-Sparta interval.
1950, Oil and gas accumulation controlled by sedimen tary facies in Eocene Wilcox to Cockfield formations, Loui siana Gulf Coast: Am. Assoc. Petroleum Geologists Bull., v. 34, no. 9, p. 1887-1896.
Recognizes marine phases of Sparta downdip. Indicates strati- graphic relations.
Bredehoeft, J. D., 1964, Variation of permeability in the Ten- sleep Sandstone in the Big Horn Basin, Wyoming, as in terpreted from core analyses and geophysical logs: U.S. Geol. Survey Prof. Paper 501-D, p. D166-D170.
Brown, G. F., 1947, Geology and artesian water of the alluvial plain in northwestern Mississippi: Mississippi Geol. Survey Bull. 65, 424 p.
Discusses geology and hydrology of Kosciusko (Sparta) Sand. Includes geologic sections and maps structure of base. Tabu lates screen analyses and laboratory coefficients of permeability, chemical analyses, descriptions of wells and water levels, and sample and drillers' logs.
Callahan, J. A., 1963, Ground-water resources in Yazoo County, Mississippi: Mississippi Board Water Commissioners Bull. 63-5, 42 p.
Describes geology and discusses hydrology. Includes chemi cal analyses and geologic section.
Chawner, W. D., 1936, Geology of Catahoula and ConcordiaParishes: Louisiana Dept. Conserv. Geol. Bull. 9, 232 p.
Describes geology and mentions occurrence of marine fossils.
Cooke, C. W., 1925, Correlation of the Eocene formations in Mississippi and Alabama: U.S. Geol. Survey Prof. Paper 140-E, p. 133-135.
Briefly describes Sparta Sand and shows regional correlations.
Cooke, C. W., Gardner, J. A., and Woodring, W. P., 1943, Correla tion of the Cenozoic formations of the Atlantic and Gulf Coastal plain and the Caribbean region: Geol. Soc. America Bull., v. 54, no. 11, p. 1713-1723.
Includes correlation chart showing Sparta.
Cronin, J. G., Follett, C. R., Shafer, G. H., and Rettman, P. L., 1963, Reconnaissance investigation of the ground-water re sources of the Brazos River basin, Texas: Texas Water Comm. Bull. 6310,152 p.
Briefly describes Sparta Sand. Discusses water movement, recharge, discharge, utilization of water, present develop ment of aquifer, water levels, chemical quality, availability of water, potential development of aquifer, and some problems of

A16 GEOHYDROLOGY OF THE CLAIBORN GROUP
water from Sparta. Tabulates chemical analyses and pumpage. Includes geologic sections and geologic map.
Gushing, B. M., Boswell, B. H, and Hosman, R. L., 1964, Gen eral geology of the Mississippi Bmbayment: U.S. Geol. Survey Prof. Paper 448-B, 28 p.
Briefly describes geology. Indicates configuration of top ofSparta.
DeVries, D. A., and others, 1963, Jasper County mineral re sources: Mississippi Geol. Bcon. and Topog. Survey Bull. 95,101 p.
Describes Kosciusko (Sparta) Sand. Briefly discusses hydrol ogy. Tabulates descriptions of wells, water levels, and chemical analyses.
Bllisor, A. C., 1929, Correlation of the Claiborne of east Texas with the Claiborne of Louisiana: Am. Assoc. Petroleum Geologists Bull., v. 13, no. 10, p. 1335-1346.
Briefly describes Sparta. Correlates various formations of Claiborne. Indicates thickness variations.
Msk, H. N., 1944, Geological investigation of the alluvial valley of the lower Mississippi River: Vicksburg, Miss., U.S. Dept. Army, Mississippi River Comm., 78 p.
Harvey, B. J., Callahan, J. A., and Wasson, B. B., 1961. Ground- water resources of Hinds, Madison, and Rankin Counties, Mississippi, Part II, Basic data: Mississippi Board Water Commissioners Bull. 61-2, 146 p.
Describes geology. Tabulates descriptions of wells and waterlevels, data on municipal supplies, logs of wells, and chemicalanalyses.
1964, Ground-water resources of Hinds, Madison, and Rankin Counties, Mississippi: Missisippi Board Water Com missioners Bull. 64-1, 38 p.
Describes geology. Discusses water levels and movement, well yields and aquifer characteristics, water quality, and develop ment of water supplies. Tabulates records of municipal water supplies, descriptions of wells, chemical analyses, and results of pumping tests.
Hem, J. D., 1959, Study and interpretation of the chemical characteristics of natural water: U.S. Geol. Survey Water- Supply Paper 1473, 269 p.
Hewitt, F. A., Baker, R. C., and Billingsley, G. A., Ground-water resources of Ashley County, Arkansas: Arkansas Univ. Inst. Sci. Technology, Research Ser. no. 16, 35 p.
Describes geology and possible water supply potential. In cludes geologic sections showing fresh water in Sparta.
Huner, J. H., Jr., 1939, Geology of Caldwell and Winn Parishes:Louisiana Dept. Conserv. Geol. Bull. 15, 356 p.
Describes geology in detail, including mode of deposition. Mentions calcareous shales and shell fragments. Includes geo logic map and sections.
Jones, P. H., and Holmes, C. N., 1947, Ground-water conditions in the Monroe area, Louisiana: Louisiana Geol. Survey Bull. 24, 47 p.
Describes geology and some hydraulic characteristics. Dis cusses water resources, hydrology, and quality. Tabulates chem ical analyses, mechanical analyses, and results of drill stem tests. Includes geologic sections.
Klein, Howard, Baker, R. C., and Billingsley, G. A., 1950, Ground-water resources of Jefferson County, Arkansas: Arkansas Univ. Inst. Sci. and Technology, Research Ser. 19, 44 p.
Discusses geology and hydrology.
LeGrand, H. B., 1964, Hydrogeologic framework of the Gulf and Atlantic Coastal Plain: Southeastern Geology, v. 5, no. 4, p. 177-194.
Lonsdale, J. T., 1935, Geology and ground-water resources of Atascosa and Frio Counties, Texas: U.S. Geol. Survey Water-Supply Paper 676,90 p.
Differentiates Sparta and includes it in Cook Mountain and post-Bigford. Includes chemical analyses, and descriptions of wells.
Maher, J. C., and Jones, P. H., 1945, Ground-water and geologic structure of Natchitoches area, Louisiana: Am. Assoc. Pe troleum Geologists Bull., v. 29, no. 1, p. 40-41.
Describes geology and hydrology. Includes geologic sections.
Martin, J. L., Hough, L. W., Raggio, D. L., and Sandberg, A. B., 1954, Geology of Webster Parish: Louisiana Geol. Survey, Geol. Bull. 29,252 p.
Describes geology. Includes geologic map and sections.
Meinzer, O. B., 1923, The occurrence of ground water in the United States: U.S. Geol. Survey Water-Supply Paper 489, 321 p.
Meinzer, O. B., and Wenzel, L. K., 1942, Movement of ground water and its relation to head, permeability and storage, in Physics of the Earth, pt. EX, Hydrology: New York, McGraw^HiU Book Co., p. 444-477.
Moody, C. L., 1931, Tertiary history of region of Sabine Uplift, Louisiana: Am. Assoc. Petroleum Geologists Bull., v. 15, no. 5, p. 531-551.
Discusses stratigraphic relations, the strand line, and geo logic history.
Murray, G. B., 1961, Geology of the Atlantic and Gulf Coastal province of North America: New York, Harper & Brothers, 692 p.
Discusses regional correlations and relationships. Indicatesstructure. Contains excellent bibliography.
Onellion, F. B., 1956, Geology and ground-water resources of Drew County, Arkansas: Arkansas Geol. and Conserv. Comm. Water Resources Circ. 4,43 p.
Describes geology. Discusses aquifer test data, utilization of water, and chemical constituents and quality. Tabulates well descriptions, water levels and chemical analyses. Includes geo logic sections.
Onellion, F. B., and Criner, J. H, Jr., 1955, Ground-water re sources of Chicot County, Arkansas: Arkansas Geol. and Conserv. Comm. Water Resources Circ. 3,32 p.
Briefly describes Sparta.
Page, L. V., and May, H. G., 1964, Water resources of Bossier and Caddo Parishes, Louisiana: Louisiana Geol. Survey and Dept Public Works Water Resources Bull. 5,105 p.
Briefly describes Sparta. Discusses water-bearing character istics, quality, and water-supply potential. Tabulates chemical analyses, well descriptions, and water levels.

HYDROLOGIC SIGNIFICANCE OF THE LITHOFACIES OF THE SPARTA SAND A17
Page, L. V., and Newcome, Roy, Jr., 1963, Water resources of Sabine Parish, Louisiana: Louisiana Geol. Survey and Dept. Public Works Water Resources Bull. 3,146 p.
Briefly describes Sparta. Discusses hydrology, water resources and quality. Tabulates descriptions of wells, water levels and chemical analyses.
Parks, W. S., Moore, W. H., McCutcheon, T. E., and Wasson, B. E., 1963, Attala County mineral resources: Mississippi Geol. Economic and Topographic Survey Bull. 99, 192 p.
Describes geology in detail. Includes geologic map and section. Discusses hydrology.
Peckham, R. C., Souders, V. L., Dillard, J. W., and Baker, B. B., 1963, Reconnaissance investigation of the ground-water re sources of the Trinity River basin, Texas: Texas Water Comm. Bull. 6309,110 p.
Describes geology in fair detail. Discusses water movement, recharge, discharge, water levels, water-bearing characteristics, chemical quality, and utilization and availability of water. Tab ulates chemical analyses and pumpage data. Shows aerial geol ogy. Includes geologic section.
Pettijohn, F. J., 1957, Sedimentary rocks: New York, Harper Bros., 718 p., 2d ed.
Poole, J. L., 1961, Ground-water resources of East Carroll and West Carroll Parishes, Louisiana: Baton Rouge, Louisiana Dept. Public Works, 174 p.
Discusses classification, cyclical sedimentation, stratigraphy,and water-supply potential, p. 59-61.
Rollo, J. R., 1960, Ground water in Louisiana: Louisiana Geol. Survey and Dept. Public Works Water Resources Bull. 1, 84 p.
Briefly discusses geology and hydrology.
Sellards, E. H., Adkins, W. S., and Plummer, F. B., 1932, The geology of Texas, Volume I. Stratigraphy: Texas Univ. Bull. 3232, 1007 p.
Describes geology in fair detail.
Spooner, W. C., 1926, Interior salt domes of Louisiana: Am.Assoc. Petroleum Geologists Bull., v. 10, no. 3, p. 217-292.
Describes and redefines Sparta Sand and discusses mode of deposition.
Stenzel, H. B., 1938, The geology of Leon County, Texas: Texas Univ. Pub. 3818,295 p.
Stenzel, H. B., Krause, E. K., and Twining, J. T., 1957, Pelocy- poda from the type locality of the Stone City beds (middle Eocene) of Texas: Texas Univ. Pub. 5704, p. 18-35.
Discusses relation of fossiliferous Stone City beds to Sparta Sand.
Sundstrom, R. W., and Follett, C. R., 1950, Ground-water re sources of Atascosa County, Texas: U.S. Geol. Survey Water- Supply Paper 1079-C, p. 107-153.
Does not differentiate Sparta, but it is probably included in Cook Mountain aquifers.
Tait, D. B., Baker, R. C., and Billingsley, G. A., 1953, The ground-water resources of Columbia County Arkansas a reconnaissance: U.S. Geol. Survey Circ. 241, 25 p.
Briefly describes Sparta. Tabulates records of wells, waterlevels, and chemical analyses.
Turcan, A. N., Jr., 1960, Estimating water quality from elec trical logs: U.S. Geol. Survey Prof. Paper 450-C, p. C135- C136.
U.S. Public Health Service, 1962, Drinking water standards: U.S. Dept. Health, Education, and Welfare, Public Health Service Pub. 956,61 p.
Vaughn, T. W., 1895, The stratigraphy of northwestern Louisi ana : Am. Geologist, v. 15, p. 205-229.
Proposes name "Sparta."
, 1896, A brief contribution to the geology and paleontol ogy of northwestern Louisiana: U.S. Geol. Survey Bull. 142, 65 p.
Describes and names Sparta Sand.
Wang, K. K., 1952, Geology of Ouachita Parish: Louisiana Geol.Survey. Geol. Bull. 28,126 p.
Describes Sparta in detail.
Welch, R. N., 1942, Geology of Vernon Parish: Louisiana DeptConserv. Geol. Survey Bull. 22, 90 p.
Shows Sparta on geologic sections.
Wendlandt, E. A., and Knebel, G. M., 1929, Lower Claiborne of east Texas, with special reference to Mount Sylvan dome and salt movements: Am. Assoc. Petroleum Geologists Bull., v. 13, no. 10, p. 1347-1375.
Describes Sparta Sand and Tyler Greensand in Sparta. Con siders Sparta Sand a member of Cook Mountain Formation.
White, W. N., Sayre, A. N., and Heuser, J. F., 1941, Geology and ground-water resources of the Lufkin area, Texas: U.S. Geol. Survey Water-Supply Paper 849-A, p. 1-58.
Briefly describes Sparta. Discusses availability and quality ofwater. Includes chemical analyses.
Winslow, A. G., 1950, Geology and ground-water resources of Walker County, Texas: Texas Board of Water Engineers Bull. 5002, 48 p.
Briefly describes Sparta. Includes geologic sections.
Winslow, A. G., and Kister, L. R., 1956, Saline-water resources of Texas: U.S. Geol. Survey Water-Supply Paper 1365,105 p.
Discusses Sparta. Includes saline water classification and chemical analyses.
U.S. GOVERNMENT PRINTING OFFICE: 1968